1. Introduction
The ranking of universities has been configured as an important tool for universities to use to publicise their prestige and international positioning [
1]. Since the appearance in 2003 of the first world ranking of universities—the Academic Ranking of World Universities, ARWU—both the number of university rankings and the number of universities included in them have steadily increased. The growth of these rankings as well as the increase in universities interested in them is explained by the interest of different groups [
2].
First, universities themselves are eager to occupy dominant positions in these rankings, since this is a way of getting the attention of a greater number of potential students and, hence, increasing the revenues from student enrolment. Second, governments also use this information to guide the allocation of public financing funds [
3]. This is clearly reflected when ranking positions determine policies related to the restructuring of the higher education system, as in the French case, where different universities were merged to attain a university in the world top 20 [
4]. Third, a good positioning in the ranking can attract the best talent to occupy both teaching and research positions, which in turn has a positive impact on the future positioning of the university. This feeds a cycle that tends to strengthen the best-positioned universities and weaken those that are not able to attract or retain the most talented employees. Finally, since a significant part of the universities’ income could come from private funds, a prominent position will favour the attraction of new funds from private capital. According to [
5], funding explains up to 51% of the variability of the positions attained by the universities in some rankings.
The growing interest of universities in receiving recognition through a good position has led to a proliferation of rankings in recent years, with notable differences in the numbers of universities analysed and the dimensions reported. The first attempt to obtain a world ranking of universities was the Academic Ranking of World Universities, also known as the Shanghai ranking. The methodology is presented in [
6] and uses four different dimensions to summarise the performance of universities: the quality of education (10%), quality of the faculty (40%), research output (40%), and per capita performance (10%). Each dimension was associated with one or more indicators to facilitate the objective measurement of its performance. Thus, the quality of education was measured through the number of students winning a Nobel Prize or a Fields Medal. These awards were also used to measure the quality of the faculty. The research was evaluated by using three indicators: highly cited researchers, publications in Nature or Science journals, and publications indexed in the Web of Science. Lastly, the per capita performance was computed as the weighted score of the above divided by the number of full-time academic staff.
The Times Higher Education World University Ranking (THE) measures performance by considering both research and non-research activities. The ranking considers 13 indicators categorised into five areas: teaching (30%), research (30%), citations (30%), industry income (2.5%), and international outlook (7.5%). Some of these indicators are collected through a large-scale reputational survey. The questionnaire targets only published scholars, and received more than 11,000 responses from 132 countries in the last edition.
According to [
7,
8], another influential world university ranking is the Quacquarelli Symonds (QS). This ranking comprises five different dimensions: the academic reputation (40%), employer reputation (10%), student-to-faculty ratio (20%), citations per faculty (20%), international faculty ratio (5%), and international student ratio (5%). The QS ranking also combines different activities of the universities to calculate their performance and not only indicators related to scientific productivity.
Recently, new rankings have focused on prominent dimensions not explicitly addressed in the abovementioned rankings, such as innovation (Scimago Institutions Rankings—SIR), web visibility, and impact (Webometrics Ranking), or sustainability (GreenMetric World University Ranking). A detailed review of the methodology employed by these rankings can be found in [
9]. This reinforces the idea of the multidimensional nature of the rankings, which must take into account different areas that are not necessarily aligned with each other. Universities with outstanding performance in all dimensions are possible, but it is common to find universities specialised in just one dimension. In addition, some of these dimensions may be positively related, but there may also be dimensions that are independent of others or even aligned in opposite directions. In fact, the two classic dimensions for measuring the performance of universities, teaching and research, do not necessarily maintain a high correlation between them.
Researchers have outlined challenging concerns that should be considered before assessing the performance of universities. According to [
10], a major criticism of a classification that claims to be based upon objective and rigorous data is the irreproducibility of its results. The author identifies several sources of error that make it difficult to reproduce the Shanghai ranking. A prominent one is the wrong assignment of affiliations to the true corresponding institutions since a great number of universities show a variety of affiliation names. This is a very common misunderstanding in non-English speaking universities. However, the availability of free open data should prevent the irreproducibility of the ranking results [
11]. Another criticism pointed out by researchers is that some rankings that include survey-based information may bias the results towards those universities that are well-known compared with lesser-known universities [
3].
Even considering the above shortcomings, there is a wide consensus that the main weakness associated with university rankings is linked to the determination of the weights used to measure both dimensions and indicators in the computation of university performance. The combination of multiple dimensions of university performance in a single aggregate measure is usually carried out in a quite arbitrary way, which prevents a clear interpretation of the aggregated measure [
3,
9,
12]. The procedure followed by these rankings to compute the aggregated indicator can be summarised as follows. First, the performance indicators are weighted and grouped in different dimensions or areas. Thus, an indicator belongs to just one dimension, and its weight represents its relative importance with respect to the other indicators of that dimension. Second, the weights associated to dimensions are elicited to properly reflect the different importance of these dimensions in the measurement of university performance. This procedure makes each indicator have a local weight within the corresponding dimension, which translates into an overall weight in the resulting ranking.
Along with the criticism regarding the subjectivity with which both dimensions and indicators are aggregated in the ranking, another possible limitation must be recognized: indicators are associated with a single dimension, when, in fact, it may turn out that some of them are related to more than one dimension. This last assumption makes it unfeasible to assume independence between dimensions, which makes it even more difficult to determine their correct weights.
In light of this last criticism, it is worth raising the question of whether the development of a ranking that includes different dimensions of universities should necessarily involve a univocal association between indicators and dimensions. Our proposal advocates avoiding this step, thus also eliminating the need to assume that dimensions are independent. Moreover, if dimensions are finally represented by indicators, our model focuses on the latter, also eliminating the need to define the dimensions themselves.
This paper proposes the use of a multicriteria model based on goal programming (GP), which has been previously applied in areas such as the ranking of firms [
13], financial services [
14], microfinancial institutions [
15], social responsibility [
16,
17], sustainable development [
18], and environmental performance [
19].
The contribution of this paper is threefold. First, we used the goal programming methodology to propose an objective, transparent, and easily reproducible procedure to compute a university ranking, thus eliminating one of the criticisms pointed out in the literature [
10]. Second, the GP models we propose make it possible to address university ranking formulation from two extreme perspectives: (a) one favouring those performance indicators that are aligned with the central tendency of the majority of indicators, and (b) an alternative one that favours those different, singular, or independent performance indicators. The first approach can bias the ranking in favour of renowned and well-established universities, with a high performance in conventional dimensions: teaching and research. The second approach may reward those universities focused on nonstandard dimensions other than just teaching and research. Finally, we explored the consequences of changing the weights of the indicators involved in the elaboration of the rankings by analysing the consistency in the results of two popular university rankings and comparing them with our proposal.
The rest of the paper is organised as follows.
Section 2 introduces the goal programming model framework for computing the ranking of universities.
Section 3 provides details of the dataset used to illustrate the proposal.
Section 4 presents and discusses the empirical results. The paper ends with the main conclusions and implications in
Section 5.
2. A Goal Programming Approach to Measuring Performance
GP was originally proposed by [
20] under the “satisfactory” and “sufficient” philosophy, as a multicriteria methodology that builds linear programming models by explicitly considering both continuous and discrete variables in which all linear and/or nonlinear functions have been transformed into goals [
21]. Decision-makers can be satisfied either by finding optimum solutions for a simplified situation or by finding satisfactory solutions for a more realistic approach. Hence, GP is a realistic alternative to those mathematical models based on a single-objective function, where constraints are relaxed to construct a simplified model and eventually achieve an optimal solution [
16,
22]. The purpose of GP is to minimise deviations between the achievement of goals and their aspiration levels.
Mathematically, the general formulation of a GP model can be expressed as (1) and (2):
where
is—usually—a linear function of the
i-th goal and
corresponds to its aspiration level. In the context of a university ranking, we propose the use of a GP approach for measuring universities’ performance. Our aimed was to obtain a single measure of university performance (multicriteria performance), as an aggregation of all the indicators considered in the measurement of the university performance, regardless of the dimensions involved in the analysis and their relations with the indicators. The multicriteria performance of the
i-th university is computed as a linear function of its indicators (3):
where
stands for the 0–1 normalised value of the
j-th indicator of the
i-th university, and
stands for the estimated weight associated with the
j-th indicator. The weight computation can be addressed through different GP models, thus allowing the assessment of the universities’ performance,
.
The first GP model we introduce solves the multicriteria performance of universities by maximising the similarity between the resulting multicriteria performance and the individual performance indicators. This GP model is known as the weighted goal programming (WGP) model ((4)–(9)):
All the variables in model (4)–(9) are assumed to be positive.
and
represent the negative and positive deviations from goals, respectively. These variables quantify the difference by the excess (deficiency) between the observed performance of the
i-th university in the
j-th indicator and the estimated multicriteria performance for the
j-th indicator. The coefficients
are equal to 1 if
is unwanted, otherwise
.
if
is unwanted; otherwise,
. We must note that some indicators are of the type “the more, the better”, implying that only the negative deviation must be minimised [
23]. On the other hand, some attributes are of the type “the less, the better”, and hence, the positive deviation must be minimised.
The weights are computed by minimising the difference between the estimated multicriteria performance of the universities and the different performance values measured through each indicator (5). We just assume that these weights must add up to 1 (6). Therefore, the deviation variables are minimised in the objective function (4). In the case that all the indicators are considered as “the more, the better”, the decision-maker must replace with 1 and with 0.
Equations (7)–(9) are considered to be accounting constraints. The university performance is estimated in (7), by considering all the indicators involved in the assessment of the universities and the different weights given by model (4)–(9) to every indicator. accounts for the disagreement between the j-th indicator and the estimated multicriteria university performance. In other words, quantifies the difference between universities in the j-th indicator with respect to the estimated multicriteria performance. A high value of indicates that there is a high degree of disagreement between the j-th indicator and the estimated multicriteria performance. On the other hand, a small value indicates that universities’ performance in that indicator is closely aligned with the multicriteria performance of the universities. Z is the sum of the estimated overall disagreement. Low values for Z translate into a multicriteria performance in line with all the individual indicators, while a high value means that there are large differences between the two values. The last situation occurs when some indicators are very dissimilar or independent of each other.
With respect to the above, the objective function seeks a single multicriteria performance aligned with all the indicators considered in the analysis. However, this can be difficult to achieve when some indicators are in conflict with each other, and hence, the improvement of one can mean the worsening of another.
The following GP model presents an alternative for coping with discordant and even opposite indicators. The model is known as the MINMAX GP model [
24]. The objective function minimises the maximum difference between the multicriteria performance and the indicators given to the model. The equations are presented in model (10)–(16):
D represents the maximum deviation between the multicriteria universities’ performance and the indicators’ performance. In consequence, D is assumed to be the supremum of the sum of deviations for each indicator j.
As stated in [
16], “solutions from both models represent extreme cases in which two contrasting strategies are set against one another”, giving an advantage to the general consensus between single indicator performance (WGP model) or to the conflicting indicator performance (MINMAX model).
However, we can seek intermediate alternatives to find a compromise between these opposed approaches: the extended GP model [
24]. A balanced solution is found by considering an additional
parameter in model (17)–(23). We use a
parameter between 0 and 1 to widen the range of solutions, seeking a compromise between the opposed cases represented by the WGP and the MINMAX models. We must note that we can reproduce the solution of the WGP model by giving a value of
, while the MINMAX model solution is obtained by considering
. We can conclude, therefore, that the WGP and MINMAX models are special cases of the extended GP model.
As a practical matter, all the variables involved in the analysis should be 0–1 normalised [
25]. Otherwise, the computed weight could be biased by favouring those indicators with larger absolute values. The normalised indicators
must be calculated by applying the following transformation:
where
is the normalized value of the
j-th indicator for the
i-th university,
is the maximum value of the
j-th indicator, and
is the minimum value of the
j-th indicator.
Finally, note that all the models compute the weights objectively, and hence, there is no need for the participation of a group of experts with subjective and potentially discordant opinions about the importance of each performance indicator in the ranking of universities. The ranking can be elicited directly from the multicriteria performance computed by any of these models without assuming potential biases in the determination of the weights. Furthermore, if we choose the extended GP model, we can compare the importance of variables depending on the parameter. If a university obtains a high multicriteria performance regardless of the value, we can conclude that its outstanding position is independent of the weights assigned by the decision process.
3. Data
This section presents the database used to illustrate the implementation of the multicriteria university ranking. Although a wide variety of rankings currently exist, we chose to apply our model to the data provided by the ARWU and THE rankings. The reason is that, on the one hand, these two rankings are among those with the largest historical data. On the other hand, unlike other, more recent rankings, the number of universities listed in these rankings is very large, and they have many universities in common. Including other rankings means having universities with incomplete information (universities that are in some rankings but not in others). The proposed goal programming approach works only with complete information, which would result in a very significant reduction in the database size.
Table 1 contains a list of the indicators used in the research, the corresponding rankings, and the weights associated for the year 2018. In addition to the indicators collected by the rankings, we have also added three other variables to complete the analysis: the number of students (to proxy the sizes of the universities), the percentage of women, and the number of employees per student. All this information was collected for a total of 419 universities, common to both rankings and for which all the information was available. The last three variables were collected directly from the universities.
Despite the fact that some indicators seem to capture the same dimension but in different rankings, the analysis of the correlation between the variables shows that the way these dimensions are reported is different according to the approach followed by each ranking (
Table 2). For example, the ARWU ranking includes two indicators related to research, publications, and nature/science papers, while the THE ranking includes the indicators research and citations to measure the volume and quality of research. Although all these indicators are positively correlated, the correlation coefficients obtained show that they reflect differentiated elements of research, and it is therefore advisable to include all of them in order to capture the complementary aspects related to university research. Additionally noteworthy are some indicators that are independent of the rest and, therefore, capture dimensions that can place value on some universities over others. This is the case of the percentage of women indicator, with many correlation coefficients below 0.1, reflecting a poor relationship with the other indicators and dimensions of the university.
4. Results
This section describes the analysis of the results obtained by applying the goal programming models of the methodological section to the database of universities described in the previous section. In particular, the results of applying the extended GP model (10)–(16) are presented, as the WGP and MINMAX models are particular instances of the extended model.
Upon varying the value of , the model computes different solutions that give more weight to some indicators than others, which directly affects the performance that each university obtains by combining these indicators into a single performance value through Equation (3).
The GP model was run 500 times for as many equally spaced
values within the range 0–1. The result was that each indicator was assigned a different weight or importance in each instance of the problem, which is reflected in
Figure 1. Although in particular instances of the problem, the award and staff per students indicators were the most relevant according to the weights assigned, if we look at the median values obtained for the 500 model runs, it is the teaching indicator that is the most influential, followed by research and highly cited researchers (hi_ci). The analysis is also revealing in terms of the variables that play little or no role in determining university performance. For example, the indicators citations, per capita performance (PCP), and percentage female do not achieve a weight of 0.05 in any of the instances raised by the
parameter. Therefore, this first analysis served to compute the different importance of each of the indicators, being able to discriminate those that were particularly relevant in a large number of instances of the model, others that were only relevant in some particular cases, and others that finally showed a low relevance regardless of the
value used. Since some variables are highly correlated with each other, we can conclude that a low weight for an indicator should not always translate into low relevance in the quantification of a university’s performance. When several indicators are highly correlated with each other, they may undoubtedly be reporting on the same dimension, so it is the sum of the weights of these indicators that reveals the importance of that dimension. In other words, a lower weight on one indicator may be compensated for by an increase in the weight of another related indicator.
However, the ultimate goal of this model is not simply to know the potential relevance of the indicators but to assess the performance of the universities and the ranking resulting from measuring this performance. In our approach, it is not necessary to go through the intermediate step of quantifying the importance of the dimensions or even to determine the association between indicators and dimensions. It is clear that the same university may obtain a different performance depending on the
value considered, as this implies taking into account different weights for the indicators. However, our results reveal how outstanding some universities are regardless of the
value used. The results shown in
Figure 2 clarify this situation.
Figure 2 shows the ranges of values obtained for the performance of the top 50 universities in all the models obtained. The universities have been ordered from highest to lowest median performance. Clearly, US universities are at the top of the rankings derived from the performance measure. This result confirms that these universities should be considered the best universities in the world, irrespective of the approach taken in the goal programming model. That is, regardless of whether the model favours those indicators that are more in line with the average behaviour of the rest of the indicators, or those that are more discordant with the central tendency, the position of these universities continues to be very outstanding.
A situation worth highlighting is that some universities that, in general, reach prominent positions in the ranking achieve an even better performance for certain values of . This is the case of Princeton University. Although the median of its performance makes it occupy the seventh position, we can observe how, in some cases, the model assigns it the same maximum performance as the first university in the ranking, Harvard University.
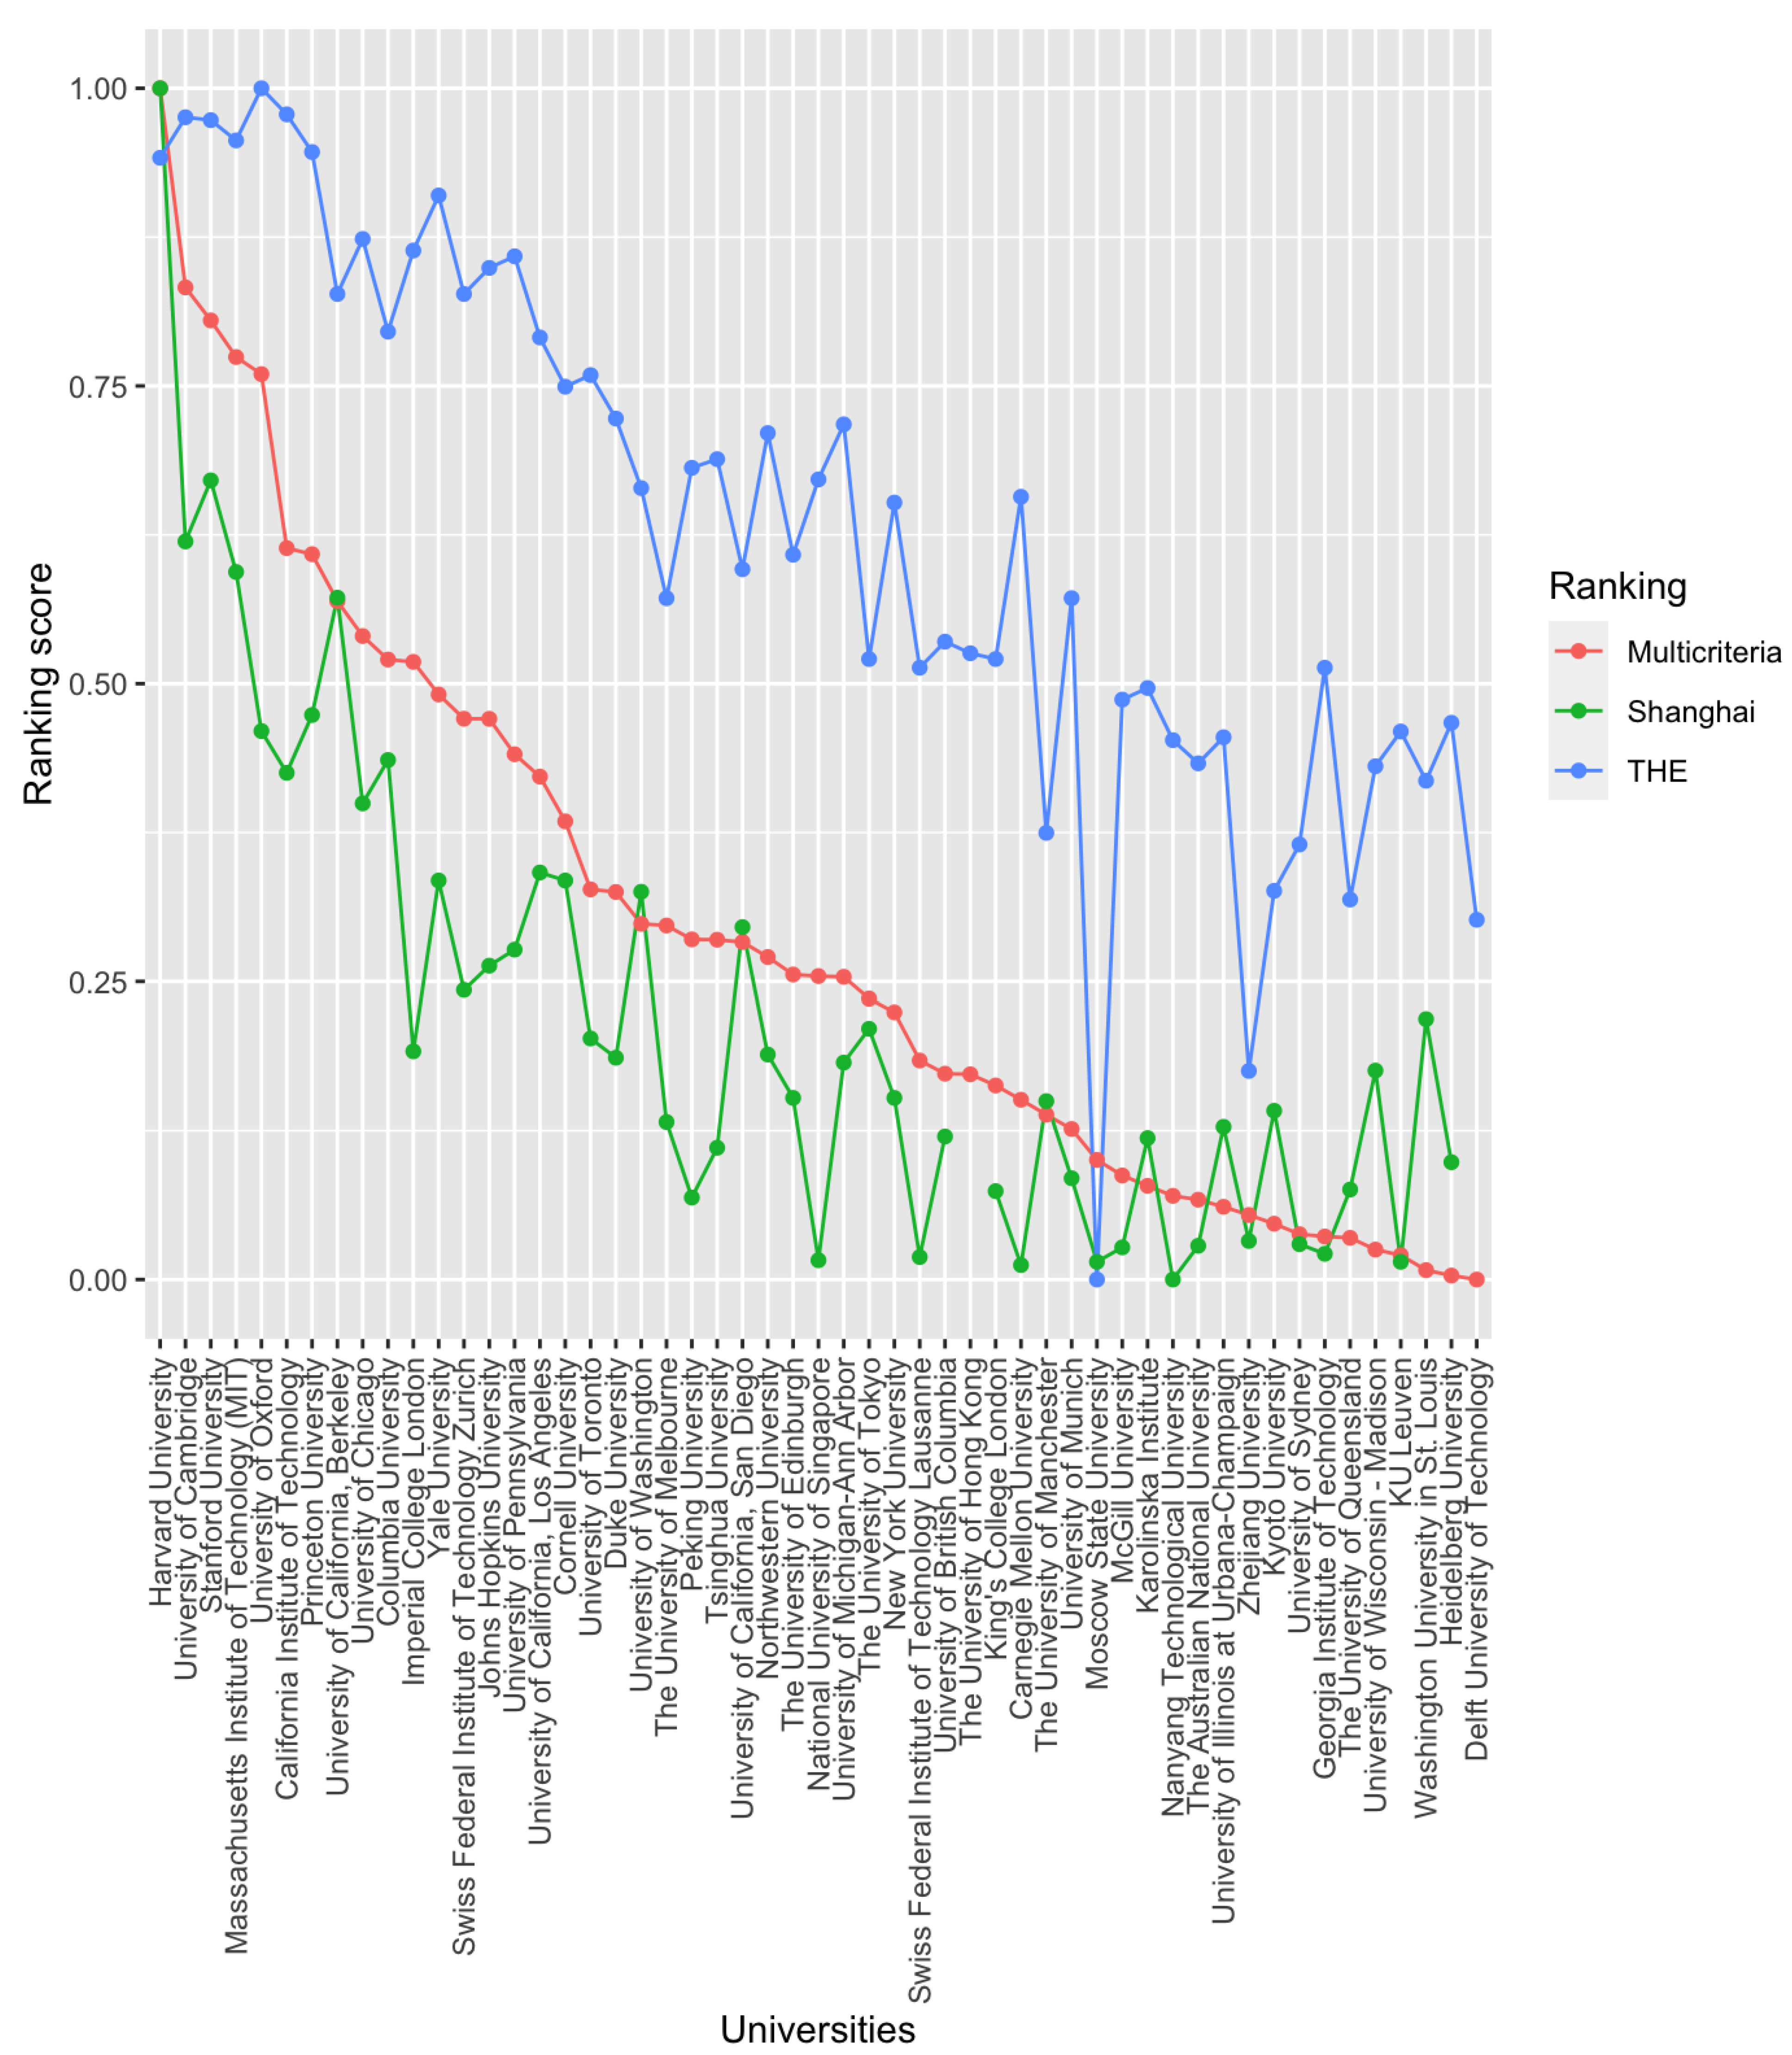
The median performance value was also used to compare these universities’ ratings with those obtained in the Shanghai and THE rankings.
Figure 3 represents the 0–1 normalised values obtained by the best-performing universities. The results obtained with the multicriteria approach more closely resemble those generated by the Shanghai ranking. Both rankings highlight a greater difference between the very top universities and the rest, reflected by the greater slope observed in the figure than the slope obtained with the THE ranking.
However, this is only limited to the visual observation of
Figure 3. In order to quantify the degrees of the relationships between the different rankings, it is preferable to use some quantitative measure. The correlation can be established on the original variables, but since we are dealing with rankings, it is preferable to use a statistical measure specifically designed to measure the correlation between rank variables. Following [
26], we computed both the weighted Spearman’s rank correlation coefficient (
correlation) and the rank similarity coefficient (
correlation). Under this approach, the positions at the top of both rankings are more important. The results are summarized in
Table 3 and
Table 4. In both cases, the multicriteria ranking presents a correlation with the Shanghai and THE rankings higher than the correlation between the latter two rankings. In other words, the multicriteria ranking is consolidated as a consensus solution between the Shanghai and THE rankings. Regarding the question of which ranking is more correlated with the multicriteria ranking, it is observed that in the case of the
correlation, it is closer to the THE ranking, while in the case of the
correlation, it is closer to the Shanghai ranking.
Finally, we present the results of an experiment that analysed the robustness of university performance in terms of the weights attributed to the indicators considered by the Shanghai and THE rankings. The positions these rankings give to universities are necessarily linked to the weights expressed in
Table 1. However, it is interesting to know how the performance of the universities would vary if other weights were used instead of those reported by the rankings. For this purpose, a simulation was carried out in which the weights of the indicators were randomly generated. The process was repeated 500 times, which allowed a significant variety of weights and the corresponding performance derived from them to be generated. The results are depicted in
Figure 4 and
Figure 5 for the Shanghai and THE rankings, respectively. The results show very significant differences in the ranking of the universities.
On the one hand, the experiment carried out on the Shanghai ranking gave fairly stable results in terms of the positions of the best-performing universities. Harvard University clearly stands out in first position. This result is logical considering that it is the university that obtains the best scores in almost all the indicators considered in the Shanghai ranking, so regardless of the weight given to each one of them, any combination of them will always yield outstanding results for this university, which could be considered a “Pareto optimal” university. The next three universities (the University of Cambridge, Standford University, and MIT) also assume the same positions as those generated by the multicriteria ranking but are much further away from Harvard University.
On the other hand, the results obtained with the simulation for the weights of the THE ranking indicators show more diffuse results. Certainly, the same universities continue to occupy the most relevant positions in the ranking, although their positions vary. However, what is most striking is how the performance of all the universities varies greatly in each of the experiments carried out. For example, the range of values obtained by MIT fluctuates between 53 and 92.5. Therefore, the weights attributed to the indicators can lead to large differences in the positioning of the universities, compared to the Shanghai ranking, where the positions of the universities were much more stable. This may be explained by the correlation exhibited between the indicators of one ranking and the other. In the case of the Shanghai ranking, all the variables are positively and highly correlated with each other. However, in the THE ranking, the correlation between some indicators is weaker or even negative (industry income and citations). In other words, the indicators compiled by the Shanghai ranking indicate that a university that is outstanding in one indicator is usually also outstanding in the others. However, in the THE ranking, we can have universities that are highly relevant in one indicator and, at the same time, deficient in others. Hence, their positions are closely linked to the weights given to their prominent indicators.
A relevant feature of the proposed multicriteria model should be highlighted here. The determination of the weights is objective, as opposed to that considered in these experiments. Where indicators may reflect independent or even conflicting dimensions, the positions of universities will be highly dependent on the weights given to these indicators and dimensions. However, the multicriteria model offers two opposing approaches, which, at the same time, determine the weights of the indicators in an objective way. As shown in these results, this model allows combining both highly correlated indicators and independent indicators, as well as negatively correlated indicators, without resulting in an excessive range of values for university performance.
5. Conclusions
This paper proposes the use of a multicriteria model based on goal programming to objectively determine the weights of the indicators used to measure the performance of universities and, finally, to determine their positioning in a ranking of universities. This procedure not only avoids the subjective calculation of indicator weights but also eliminates the need to associate indicators with certain dimensions related to university performance. The paper proposes two competing approaches: determining the importance of indicators by (1) favouring those that are aligned with the majority of indicators, or (2) favouring those indicators that are further away from the general trend. Consensus solutions can be reached between these two extremes through the extended goal programming model.
In addition to the fundamental objective of knowing the positioning of the universities, the model also allows the identification of the most relevant indicators in the determination of performance, as well as those that have little weight in the rating of the universities. This can help managers to focus resources more efficiently to achieve their objectives. Moreover, since one of the extremes favours the most discordant indicators, this can help to identify possible niches for improvement in those universities that want to focus on specific areas that are further away from the standards followed by most universities.
The analysis carried out shows how in the THE ranking, the variation in the weights of the indicators can have a great impact on the positions of the universities. The goal programming model can be used not only to establish a median value for the position, but also to know between which values the performance of the universities can fluctuate, identifying those universities that are dominant with respect to others, regardless of the approach followed in the goal programming model when quantifying the parameter.
Finally, a future research direction should add new indicators to those presented in this paper. In particular, the analysis could be enriched by considering indicators that capture elements other than the classic dimensions of research and teaching. This would facilitate the identification of universities that advance in nontraditional fields that allow them to respond to the new needs and challenges of society. Another future research line could include the development of models to work with missing data. Indeed, few universities appear in all the rankings, which makes it difficult to use models such as the one proposed here. A model that explicitly contemplates the lack of information in some observations could be of great interest.


