Article

Functional Modeling of High-Dimensional Data: A Manifold Learning Approach

by
Harold A. Hernández-Roig
1,2,*,
M. Carmen Aguilera-Morillo
2,3 and
Rosa E. Lillo
1,2
1
Department of Statistics, Universidad Carlos III de Madrid, Calle Madrid, 126, 28903 Getafe, Madrid, Spain
2
uc3m-Santander Big Data Institute, Calle Madrid, 135, 28903 Getafe, Madrid, Spain
3
Department of Applied Statistics and Operational Research, and Quality, Universitat Politècnica de València, Camí de Vera, s/n, 46022 València, Spain
*
Author to whom correspondence should be addressed.
Mathematics 2021, 9(4), 406; https://doi.org/10.3390/math9040406
Submission received: 23 December 2020 / Revised: 3 February 2021 / Accepted: 9 February 2021 / Published: 19 February 2021

Abstract

:
This paper introduces stringing via Manifold Learning (ML-stringing), an alternative to the original stringing based on Unidimensional Scaling (UDS). Our proposal is framed within a wider class of methods that map high-dimensional observations to the infinite space of functions, allowing the use of Functional Data Analysis (FDA). Stringing handles general high-dimensional data as scrambled realizations of an unknown stochastic process. Therefore, the essential feature of the method is a rearrangement of the observed values. Motivated by the linear nature of UDS and the increasing number of applications to biosciences (e.g., functional modeling of gene expression arrays and single nucleotide polymorphisms, or the classification of neuroimages) we aim to recover more complex relations between predictors through ML. In simulation studies, it is shown that ML-stringing achieves higher-quality orderings and that, in general, this leads to improvements in the functional representation and modeling of the data. The versatility of our method is also illustrated with an application to a colon cancer study that deals with high-dimensional gene expression arrays. This paper shows that ML-stringing is a feasible alternative to the UDS-based version. Also, it opens a window to new contributions to the field of FDA and the study of high-dimensional data.

1. Introduction

Recently, a considerable literature has grown up around the topic of high-dimensional data. In this scenario, classical statistical tools are insufficient to study the data, as the number of features is generally higher than the sample size. For example, microarrays measure gene expressions and in most cases can contain up to 10 5 genes (features or predictors) for less than one hundred subjects (samples). Typically, it is common to deal with a huge difference between the sample size n and the number p of features (written as n p ). Moreover, if the data comes with an associated response (say a category indicating ill/healthy patient) tasks such as modeling become very difficult.
In this context, stringing is introduced as a class of methods to map general high-dimensional vectors to functions [1]. Stringing takes advantage of the large p and considers the sample vectors as realizations of a smooth stochastic process observed with a random order of its components. This deviation from the multivariate scenario places the study in the field of FDA, another area with remarkable growth in research—see the books [2,3] or the review [4]. Through stringing, tools such as functional regression become a feasible alternative to more common approaches that add sparsity constraints, as the lasso and generalizations [5,6]. Moreover, linking the high-dimensional data to the infinite-dimensional space of functions also results in a visual representation of the data as smooth curves in the plane.
The key element of stringing is a rearrangement of the predictors (columns of the design matrix, when there is a response variable). It assumes that the sample vectors are realizations of a smooth stochastic process observed in a random and unknown order of the components. The idea is to estimate the true order of the nodes using the scrambled observations. Originally, this ordination is based on Multidimensional Scaling (MDS), a method that reduces the dimension of a vector in R n to R l , where l < n . MDS achieves the reduction by preserving a predefined distance or dissimilarity metric, placing closer in R l those vectors that were similar in R n . In particular, if l = 1 we refer to UDS, which takes advantage of the intrinsic order in R to rank the predictors. Finally, once the true order is recovered, the sample vectors are treated as functional data.
Please note that under these assumptions, stringing can be seen as the necessary data pre-processing step that enables the deployment of the FDA machinery. Furthermore, the strategy is different from the usual understanding of Dimensionality Reduction methods which aim to project the observation points (the sample vectors of size p) to a low-dimensional space where the data features are easily revealed (i.e., R , R 2 , or R 3 ). Stringing, on the other hand, projects the n-dimensional predictors to R and retrieves their order. Then, after rearranging the components, the sample vectors are transformed into functions, increasing p to .
The literature on stringing often relies on Euclidean distances or Pearson correlations to apply UDS. This means that the estimated order (or the projection in R ) only takes into account the linear relations between the predictors in the higher-dimensional space R n . We believe this is a weakness of the method, as more complex relations are very likely to be present in a high-dimensional space. The present study seeks to remedy this issue by preserving the nonlinear structure of the p predictors when they are mapped from R n into R l . Our proposal consists of performing stringing via ML, assuming that the true nodes belong to an underlying l-dimensional smooth manifold M . In particular, in this paper, we study the performance of ML-stringing in functional regression models for a fixed l = 1 .
To study the benefits of using ML-stringing instead of the UDS-based version, we focus mainly on three aspects: (1) the visual representation of the stringed high-dimensional data achieved by the estimated functional predictors; (2) the interpretability of the estimated coefficient function; and (3) the accuracy of the predictions achieved by the SOF regressions. In simulation studies, we show the advantages of ML-stringing while dealing with (1)–(3). Furthermore, we illustrate the versatility of the method with an application to a colon cancer study regarding the classification of tissues from gene expression arrays. Our research is motivated by existing research, mainly focused on applications to biosciences. These applications deal with a substantial variety of high-dimensional datasets, but all of them are processed with UDS-stringing based on Euclidean distance or Pearson correlation. We believe our proposal could bring further improvements to these studies. Below, we summarize some of the most relevant.
Chen et al. [1] present an extensive simulation study, comparing the performance of lasso and functional regression models fitted with the stringed data. Their results show that stringing-based functional models have higher accuracy than lasso, if the generated data is not too sparse or if p is large. They also combine stringing with a functional Cox regression model to predict the survival of patients with diffuse large-B-cell lymphoma (DLBCL).
A previous version of stringing (functional embedding, FEM for short) is introduced by Wu and Müller [7] for the classification of gene expression profiles. The term “ordination” is used to describe the procedure of embedding high-dimensional vectors of gene expressions into a functions space. In this paper, the authors focus on the classification of cancer patients from gene expression profiles. The FEM algorithm reorders the predictors through correlation-based UDS and fits a functional logistic regression model with an iterative nodes selection procedure (equivalent to variable selection in this context).
Stringing is deployed with two scalar-on-function (SOF) regression models by Chen et al. [8]. First, the authors explore the prediction of plasma homocysteine using single-nucleotide polymorphism (SNP) data. They transform the sample vectors to functional data and then fit a functional linear regression model. Next, nodes selection is explored in a functional Cox regression model, regarding the survival of patients with DLBCL.
Three applications that move away from the SOF regressions are also notorious. On the one hand, stringing is used to develop a functional test of equality of covariance matrix with application to mitochondrial calcium concentration data [9]. On the other hand, the method brings new insights into the study of brain connectivity using functional magnetic resonance imaging (fMRI) and electroencephalography (EEG) data [10,11]. Both works apply stringing to rearrange the signal locations (voxels in fMRI and electrodes in EEG data) while preserving the relative distance between them as much as possible. Chen and Wang [10] are able to discriminate normal from Alzheimer’s disease patients using the reordered data. Their alignment also provides a visualization tool for spatially indexed blood oxygen level-dependent signals. Moon et al. [11] exploit the brain connectivity information combined with convolutional neural networks in emotional video classification.
In a recent article, Aguilera-Morillo et al. [12] study the relationship between several clinical variables and the genotype of patients affected by chronic graft-versus-host disease after an allogeneic hematopoietic stem-cell transplantation. The high-dimensional genotype of the patients (SNPs data) is transformed into functional data by means of stringing. Then, the relationship between the (functional) genotype and the clinical variables is explained through a function-on-scalar (FOS) regression model.
We remark that, besides considering the reordered data as functional, stringing can be seen as a seriation (also ordination or sequencing) method for one-mode two-way data. Seriation methods aim to reveal structural information of the data by arranging it into a linear order [13,14]. These methods assume that structural information is revealed when similar objects are placed together. Therefore, the usual input of seriation is a dissimilarity matrix (“two-way” data). The “one-mode” indicates that dissimilarities are obtained for a single set of objects. Surprisingly, the concepts of stringing and seriation are rarely related in the literature (to our knowledge, [15] is the only exception). In this paper, we refer to several “seriation algorithms” to string data.
The rest of the manuscript is divided in Material and Methods (Section 2), Results (Section 3), and Discussion (Section 4). In Section 2.1 we introduce our proposal ML-stringing. Next, we describe the SOF regression problem in Section 2.2, our simulation studies in Section 2.3, and the real data illustration concerning the prognosis of colon cancer from gene expression arrays in Section 2.4. The simulation results are divided in two subsections according to the design: SOF regression with continuous response (Section 3.1) and SOF regression with binary response (Section 3.2). Finally, the results from the real data application are summarized in Section 3.3.

2. Materials and Methods

2.1. Stringing via Manifold Learning

Let d = { ( x i , y i ) , i = 1 , 2 , , n } be the data consisting of n samples x i R p with associated responses y i . The exponent “ ” indicates the transpose. The p predictors X j R n , j = 1 , , p , are n-dimensional vectors that can be arranged in an n × p design matrix: X = X 1 , , X p , with elements X i j = x i j , i = 1 , , n ; j = 1 , , p . Each x i j represents the observed value of the predictor j for subject i. We consider a high-dimensional scenario with many predictors and possibly n p , also known as “wide data” (opposed to “tall data”). The vector Y = y 1 , , y n R n gathers all the responses. In what follows, bold-upper-case letters will indicate a matrix (e.g., design matrix X ) or a column vector (e.g., the vector of responses Y or the j-th column of X : X j ). Bold-lower-case letters will indicate row vectors (e.g., the i-th row of X : x i ). A tilde over a matrix ( X ˜ ) indicates that the columns are scrambled in a random way.
Following [1], we consider stringing as a class of methods that map the samples ( x i ) from R p to the infinite space of square-integrable functions L 2 ( [ 0 , T ] ) defined over a closed interval [ 0 , T ] R . We consider data as realizations of a hidden smooth stochastic process (say X ( · ) ), but observed in random order of its components. This means that for each subject i = 1 , , n , we observe p realizations { x i j = X i ( s j ) } j = 1 p , where s j [ 0 , T ] is an unknown node to be estimated.
The main goal of stringing is to estimate positions s ^ 1 , , s ^ p to each predictor indexed by j = 1 , , p . In other words, to recover the true order of the nodes generating the observations, as well as their positions in a closed interval [ 0 , T ] R . In practice, stringing addresses the problem by reducing the dimension of the predictors { X i } i = 1 p from n to l < n , while preserving dissimilarities across spaces.
Our proposal, stringing via ML, aims to preserve more complex relations between predictors, as nonlinearities. Therefore, we assume that the predictors X ˜ j R n , j = 1 , , p (columns of the design matrix X ˜ ) are the result of mapping the coordinates { s j M } j = 1 p of an underlying l-dimensional smooth manifold M . Following [16], and avoiding the complexities regarding the definition of a topological manifold, we consider M as a space that locally behaves like Euclidean space. We consider that M is continuously differentiable (i.e., smooth), connected, and equipped with a metric d M that determines its structure. This metric is usually called geodesic distance, as it is the arc-length of the shortest curve connecting any two points in the manifold.
In this paper, the dimension of M is fixed to l = 1 , which makes ML analogous to UDS. We focus on six ML and Nonlinear Dimensionality Reduction algorithms: Isometric Feature Mapping (Isomap) [17], Locally Linear Embedding (LLE) [18], Laplacian Eigenmap (LaplacianEig) [19], Diffusion Maps (DiffMaps) [20], t-Distributed Stochastic Neighbor Embedding (tSNE) [21], and Kernel Principal Component Analysis (kPCA) [22]. In general, the ML algorithms start by constructing a weighted graph that considers neighborhood information between the sample objects (e.g., the predictors in stringing). Then, the weighted graph is transformed according to a certain criterion that is particular to each algorithm. Finally, the data is embedded into a lower-dimensional space, commonly by solving an eigen equation problem.
Isomap starts by joining neighboring points, defined as the κ -nearest according to the Euclidean distance in R n . Then it approximates the geodesic distances { d i j M } in the underlying manifold M by computing the shortest paths that connect any two points X ˜ i , X ˜ j R n . The third and final step uses the approximations { d ^ i j M } as inputs of an MDS algorithm.
For any set of dissimilarities { d i j : 1 i , j p } , MDS estimates the minimizing d i j * of the stress:
S 2 s ^ = min d i j * : d i j * d i j i < j ( d i j * d ^ i j ) 2 i < j d ^ i j 2 ,
where d i j * d i j means monotonically related quantities ( d i j < d u v d i j * d u v * , for all i < j , u < v ); and the d ^ i j represent point-to-point distances of a configuration s ^ M . Details regarding the estimation of optimal d * can be found in [16,23].
On the one hand, Isomap can be seen as an extension of MDS that attempts to preserve the global geometry of M . As it estimates all the geodesic distances in the underlying manifold, it is a global approach to the ML problem.
On the other hand, the LLE algorithm is seen as a local approach because it preserves local neighborhood information without approximating all the { d i j M } . First, for a fixed number of neighbors κ , it reconstructs each point X ˜ j through a linear combination of its κ -nearest neighbors N j κ = { X ˜ m } m = 1 κ :
X ˜ ^ j = m = 1 κ w j m X ˜ m ,
with weights w j m minimizing the reconstruction error:
j = 1 p X ˜ j X ˜ ^ j 2 , subject   to : m w j m = 1   and   w j m = 0 X m N j κ .
The coordinates { s j M } j = 1 p , best reconstructed by the weights { w j m } m = 1 κ , are estimated by minimizing the embedding cost function:
j = 1 p s j m = 1 κ w j m s m 2 .
Under some constraints that make the objective function invariant under translation, rotation, and change in scale, the problem is reduced to the estimation of the bottom l + 1 eigenvectors of the sparse p × p matrix M = I p W ^ I p W ^ . The “bottom” eigenvectors refer to those with the l + 1 smallest eigenvalues, I p is the identity matrix of size p × p , and W ^ is the matrix of optimal weights ( w ^ j m ) 1 j , m p .
The Laplacian Eigenmap algorithm is very similar to the previous two. It starts by defining the κ -neighborhoods N j κ of each data point X ˜ j , j = 1 , , p , as in LLE or Isomap algorithms. Next, a weighted adjacency matrix W = ( w i j ) 1 i , j p is constructed, according to:
w i j = exp X ˜ i X ˜ j 2 ϵ , if X ˜ j N i κ 0 , otherwise ,
with weights determined by the isotropic Gaussian kernel. The parameter ϵ R + can also take the value infinity ( ϵ = ), resulting in the simple-minded version: w i j = 1 , if X ˜ j N i κ and 0, otherwise. This results in a graph G , with connected neighboring points and weights given by W . Let D = ( d i j ) 1 i , j p be the degree matrix, meaning it is a diagonal matrix with nonzero elements:
d i i = j : X ˜ j N i κ w i j , i = 1 , , p .
Then, the graph Laplacian of G is the n × n , symmetric, and positive semidefinite matrix L = D W . The coordinates { s j M } j = 1 p are determined by the solution of the optimization problem:
arg min i j w i j s i s j 2 .
This is simplified to solving the generalized eigen equation L v = λ D v , or, equivalently, computing the bottom l + 1 eigenvalues and eigenvectors of D 1 / 2 W D 1 / 2 .
Diffusion Maps are a very interesting alternative to ML. They exploit the relationship between heat diffusion and Markov chains, based on the idea that it is more likely to visit nearby data-points while taking a random walk through the data. The algorithm departs from the same weights matrix W , with entries defined in Equation (2), as in Laplacian Eigenmaps. Using both W and D , the degree matrix with diagonal elements defined in Equation (3), the algorithm calculates the random walk transition matrix P = D 1 W . The elements of P = ( p i j ) 1 i , j p give a sense of connectivity between X ˜ i and X ˜ j . By analogy with random walks, p i j represents the probability for a single step taken from i to j. Moreover, the iterative matrix P t gives the transition probabilities on the graph after t time steps. The coordinates of the embedding are obtained by solving the eigen equation P t v = λ v and retaining the top l + 1 eigenvectors and eigenvalues.
The tSNE algorithm is a variant of the Stochastic Neighbor Embedding (SNE) [24] that improves the original approach by introducing a Student t-Distribution as a kernel in the target low-dimensional space. tSNE first constructs a probability distribution over the high-dimensional data space:
p j | i = exp X ˜ i X ˜ j 2 / 2 σ i 2 k i exp X ˜ i X ˜ k 2 / 2 σ i 2 , i j ,
with p i | i = 0 and 1 i , j p . One can understand the similarity between data points X ˜ i , X ˜ j as the conditional probability, p j | i , that X ˜ i would pick X ˜ j as its neighbor. Next, we define the the joint probabilities p i j in the high-dimensional space to be the symmetrized conditional probabilities, i.e.:
p i j = p j | i + p i | j 2 p .
The bandwidth σ i of the Gaussian kernel defining the probabilities in Equation (4) is set in such a way that the perplexity of the conditional distribution (i.e., a measurement of how well the probability distribution predicts the sample) equals a predefined value. Briefly, σ i is adapted to the density of the data, were smaller values are used in denser parts of the data space. The similarities between the coordinates s 1 , s 2 , , s p in the target l-dimensional manifold M , are measured using a heavy-tailed Student t-Distribution:
q i j = ( 1 + s i s j 2 ) 1 k l ( 1 + s k s l 2 ) 1 , i j ,
with q i i = 0 and 1 i , j p . The locations are estimated by minimizing the Kullback–Leibler divergence (KL) of the distribution P from the distribution Q using gradient descent:
KL P Q = i j p i j log p i j q i j .
kPCA is a nonlinear version of PCA that applies the well-known kernel trick. It can be seen as a two-steps process where: (1) each X ˜ j R n is nonlinearly transformed into Φ ( X ˜ j ) H , where H is an N H -dimensional Hilbert space; and (2) given the { Φ ( X ˜ j ) } j = 1 , , p H with j Φ ( X ˜ j ) = 0 , solve a linear PCA in feature space H . The feature map Φ : R n H is such that:
Φ ( X ˜ j ) = ϕ 1 ( X ˜ j ) , , ϕ N H ( X ˜ j ) τ H , j = 1 , , p ;
with N H > n and nonlinear maps { ϕ i } . The idea behind the method is that any possible low-dimensional structure of the data can be more easily seen in a much higher-dimensional space. Also, the feature map does not need to be defined explicitly.
Briefly, solving a linear PCA in feature space mimics a standard PCA. The goal is to find eigenvalues λ 0 and nonzero eigenvectors v H of the covariance matrix:
C = 1 p j = 1 p Φ ( X ˜ j ) Φ ( X ˜ j ) τ ,
of the centered and nonlinearly transformed input vectors. In practice, the eigenvalues and eigenvectors ( λ , v ) of C are expressed in terms of the eigenvalues and eigenvectors ( λ ˜ , α ) = ( p λ , α ) of the matrix K = ( K i j ) with elements:
K i j = Φ ( X ˜ i ) , Φ ( X ˜ j ) H , = Ker ( X ˜ i , X ˜ j ) ,
where the inner product · , · H in H is substituted by a feasible kernel Ker ( · , · ) . The principal components v k , k = 1 , 2 , , p are not computed explicitly. Instead, for any point X ˜ j , its nonlinear principal component scores corresponding to Φ are given by the projection of Φ ( X ˜ j ) H onto the eigenvectors v k H , using the kernel trick:
v k , Φ ( X ˜ j ) H = λ k 1 / 2 i = 1 p α k i Φ ( X ˜ i ) , Φ ( X ˜ j ) H , = λ k 1 / 2 i = 1 p α k i Ker ( X ˜ i , X ˜ j ) ,
for k = 1 , , p . Please note that the { λ k } are obtained from the ordered eigenvalues of K : λ ˜ 1 λ ˜ 2 λ ˜ p 0 , with associated eigenvectors α 1 , , α p , such that α k = ( α k 1 , α k 2 , , α k p ) τ .
In any case, the estimated order of the predictors is characterized with a permutation ψ p , called the stringing function [1], such that s ^ ψ p ( 1 ) < s ^ ψ p ( 2 ) < < s ^ ψ p ( p ) . Also, for each predictor j with rank order ψ p ( j ) and for a fixed T, a regularized position s j p = ( j 1 ) / ( p 1 ) · T is computed. The purpose is to normalize the resulting domain to [ 0 , T ] , usually for T = 1 . It is worth noting that in the original stringing, the order is estimated by plugging in Equation (1) the Euclidean distances or empirical Pearson correlations between any two columns X ˜ i , X ˜ j R n of the matrix X ˜ :
d i j = X ˜ i X ˜ j , ( Euclidean ) , d i j = 2 2 ρ ^ i , j 2 , ( Pearson ) ,
where
ρ ^ i , j = 1 n 1 k = 1 n ( x ˜ k i x ˜ ¯ i ) ( x ˜ k j x ˜ ¯ j ) σ ^ i σ ^ j , x ˜ ¯ i = 1 n k = 1 n x ˜ k i , σ ^ i 2 = 1 n 1 k = 1 n ( x ˜ k i x ˜ ¯ i ) 2 .
To simplify, we write UDS- and ML-stringing to allude the original method and our proposal, respectively. We also write Isomap-stringing, LLE-stringing, tSNE-stringing, etc., to refer to a particular algorithm.
In our applications we take advantage of the packages dimRed and coRanking [25] in R software [26] to estimate the optimal one-dimensional configuration s ^ 1 , s ^ 2 , , s ^ p M R . Please note that we are fixing l = 1 , while in most dimensionality reduction methods the usual is to estimate the bestl. Nevertheless, while fixing l = 1 we can still enhance ML-stringing by tuning the parameters of each algorithm.
In this paper, we estimate the optimal number of neighbors ( κ max ) that improves the representation resulting from Isomap, LLE, and Laplacian Eigenmap. In particular, we choose κ max from a grid of possible κ between 5 and p, according to the optimal Local Continuity Meta Criterion (LCMC) [27]. Also, we follow the simple-minded version of Laplacian Eigenmap, meaning ϵ = in its Gaussian kernel. Diffusion Maps are set to compute the coordinates in M after a single time step ( t = 1 ), the parameter ϵ in its Gaussian kernel is set to the median distance to the 0.01 · p nearest neighbors, according to the default specifications from dimRed. The perplexity parameter in tSNE algorithm is set to 30, dimRed’s default. Roughly speaking, this value is equivalent to neighborhood size. We perform kPCA only with a Gaussian kernel and a fixed bandwidth σ = 0.1 . Whenever possible, we compare our approach with the resulting configurations from the (UDS-based) Stringing function available in the R package fdapace [28].

2.2. Scalar-on-Function Regression

Once the regularized positions { s j p [ 0 , T ] R } are estimated, it is possible to represent the high-dimensional data as functional. Furthermore, it is reasonable to assume that the measurements are noisy:
x i j = X i ( s j p ) + ϵ i j ,
with independent and identically distributed (i.i.d.) errors ϵ i j N ( 0 , σ 2 ) . The samples are assumed to be from the second order stochastic process X = X ( s ) , s [ 0 , T ] , continuous in quadratic mean, and with sample paths in the Hilbert space of square integrable functions L 2 ( [ 0 , T ] ) .
In any case (stringing via UDS or ML), we can associate the observed values of the process { X i ( s ) , s [ 0 , T ] } with the corresponding response Y i and consider a SOF generalized linear model. Following the notation from [29], we write:
Y i E F [ μ i , θ ] , g ( μ i ) = α + [ 0 , T ] X i ( s ) β ( s ) d s , i = 1 , , n ;
where E F [ μ i , θ ] denotes an exponential family distribution with mean μ i and dispersion parameter θ . The linear predictor μ i = E [ Y i ] is related to the functional covariate X i ( · ) through a link function g ( · ) . In this paper we focus on Gaussian (continuous response) and Bernoulli (binary response) distributions, which implies that the link function g ( · ) is the identity or the logit transformation:
g ( μ i ) = μ i , g ( μ i ) = log μ i / ( 1 μ i ) ,
respectively. We also assume that α is a scalar and that the coefficient function β L 2 ( [ 0 , T ] ) .
Of interest are all the parameters of the SOF model in Equation (6) and the estimation of the process X ( · ) , observed with noise. As the interpretability of the results is bounded to the shape of both X ( · ) and β ( · ) , some regularity is needed. Usually, this is achieved by expanding the coefficient function and the functional predictors in terms of a set of basis functions. We can identify two main approaches depending on the basis functions [30]: those using (i) data-driven bases or (ii) a priori fixed bases. Hybrid methods combining both (i) and (ii) are also possible—e.g., [29,31].
The first approach exploits the Karhunen–Loève expansion of the process X ( · ) in terms of its functional principal components (FPC) [2]. Using a small number of such FPC as basis functions also allows the representation of β ( · ) . Moreover, the functional regression reduces to a classical regression model in terms of the FPC scores. We noticed that this approach is more common in the stringing literature, maybe due to the connection of the authors with the FPC analysis through conditional expectation (PACE) method [32].
The second one is through a basis expansion:
X i ( s ) = k = 1 K X c i k B k X ( s ) , i = 1 , , n ; β ( s ) = k = 1 K β b k B k β ( s ) ;
where { c i k } k = 1 K X , { b k } k = 1 K β are parameters to be estimated and { B k X ( s ) } k = 1 K X , { B k β ( s ) } k = 1 K β are the a-priori-fixed basis functions (often splines, wavelets, or Fourier bases, and not necessarily the same for the coefficient function and the functional predictors). The numbers K X , K β directly affect the smoothness of the estimations and there are data-driven methods to select proper values (for example, cross-validation [2]). However, tuning the number of basis functions is commonly substituted by adding a roughness penalty ( λ ), and fixing K β K X to be a large value. For example, when dealing with a Gaussian distribution (the outcome is continuous and g ( · ) is the identity) the estimation of β can be controlled with:
P λ ( α , β ) = i = 1 n y i α β ( s ) X i ( s ) d t 2 + λ ( L β ) ( s ) 2 d s ,
where L is a differential operator acting on β ( · ) , usually set to be its second derivative: ( L β ) ( s ) = β ( s ) . Similarly, a roughness penalty can be added to the estimation of the { X i ( · ) } .
Here, we follow the second approach and expand both the functional predictors and the coefficient functions using a P-splines formulation [33,34] based on cubic B-splines bases. We do this in a two-steps process motivated by the penalized functional regression method [29]: first we estimate the smooth { X i ( · ) } and then β ( · ) . In any case, we follow Ruppert’s rule of thumb [35] and fix K β = K X = min ( p / 4 , 40 ) . The roughness penalty of the functional predictors’ expansion is chosen via generalized cross-validation. The coefficient function is estimated by fitting the model with the package refund [36] in R, a computationally efficient algorithm that takes advantage of the connection to mixed models and avoids cross-validation procedures or manual selection of the penalty.
It is worth noting that the estimated X ^ i ( · ) , i = 1 , , n , can vary across seriation algorithms that estimate different orders of the predictors. Roughly speaking, as the set of basis functions { B k X ( s ) } k = 1 K X is fixed a priori, permuting the observation nodes (the s j p , j = 1 , , p ) can change the estimated coefficients { c ^ i k } of the basis expansion in Equation (7). Moreover, β ^ ( · ) can also vary as it is estimated through Equation (8), that is, it depends on the { X ^ i ( · ) } . However, the smoothness introduced by the finite basis expansion and/or the penalization can result in similar estimated processes and coefficient functions, even for seriation algorithms with different outputs. An extreme example is that of (nearly) constant processes: no matter the order of the observed nodes, the estimated { X ^ i ( · ) } will be essentially the same, with no impact on the estimation of β ( · ) .
Finally, we remark that stringing can be applied to any high-dimensional data, even when the underlying process X ( · ) estimated by the method does not have a physical interpretation. The reader may have noticed that most of the applications reviewed in the Introduction deal with genetic data (SNPs or gene expression arrays), and in such cases, there is no physical interpretation of the estimated smooth process that generates the data, nor is it needed. Stringing simply maps the high-dimensional vectors into L 2 ( [ 0 , T ] ) to get a visual representation of the data and to study its characteristics from an FDA perspective. The following sections study the advantages of our proposal and illustrate its versatility in a real-data application.

2.3. Simulation Studies

Here, we present two simulation studies comparing the performance of UDS- and ML-stringing in terms of the seriation quality and the accuracy of the fitted SOF regression models. We generate data from a noisy stochastic process, using as baseline the schemes from [3,29]. We differentiate these studies according to the nature of the response.
In Simulation 1 (continuous response), we generate the functional predictors:
X i ( t ) = Z · t + U + η ( t ) + ϵ ( t ) ; t [ 0 , 1 ] ; i = 1 , , n ;
where the uppercase letters Z and U represent random variables distributed as Z N ( 1 , 0.2 2 ) and U U ( 0 , 5 ) , respectively. The function η ( t ) introduces a noisy component to the functional regressor; it is generated as η ( t ) N ( 0 , 1 ) , for every fixed t [ 0 , 1 ] . The random curves ϵ ( t ) are generated as:
ϵ ( t ) = k = 1 10 1 k Z 1 k sin ( 2 π t k ) + Z 2 k cos ( 2 π t k ) ,
where Z 1 k , Z 2 k N ( 0 , 1 ) .
Analogously, when the response is binary (Simulation 2) we generate the functional predictors:
X i ( t ) = Z · t + U ( 1 ) + η ( t ) + ϵ ( t ) , i   is   odd ; X i ( t ) = Z · t + U ( 2 ) + η ( t ) + ϵ ( t ) , i is   even ;
where t [ 0 , 1 ] and i = 1 , , n . All the terms are generated as in Equation (9), except for U ( 1 ) U ( 0 , 5 ) and U ( 2 ) U ( 5 , 0 ) .
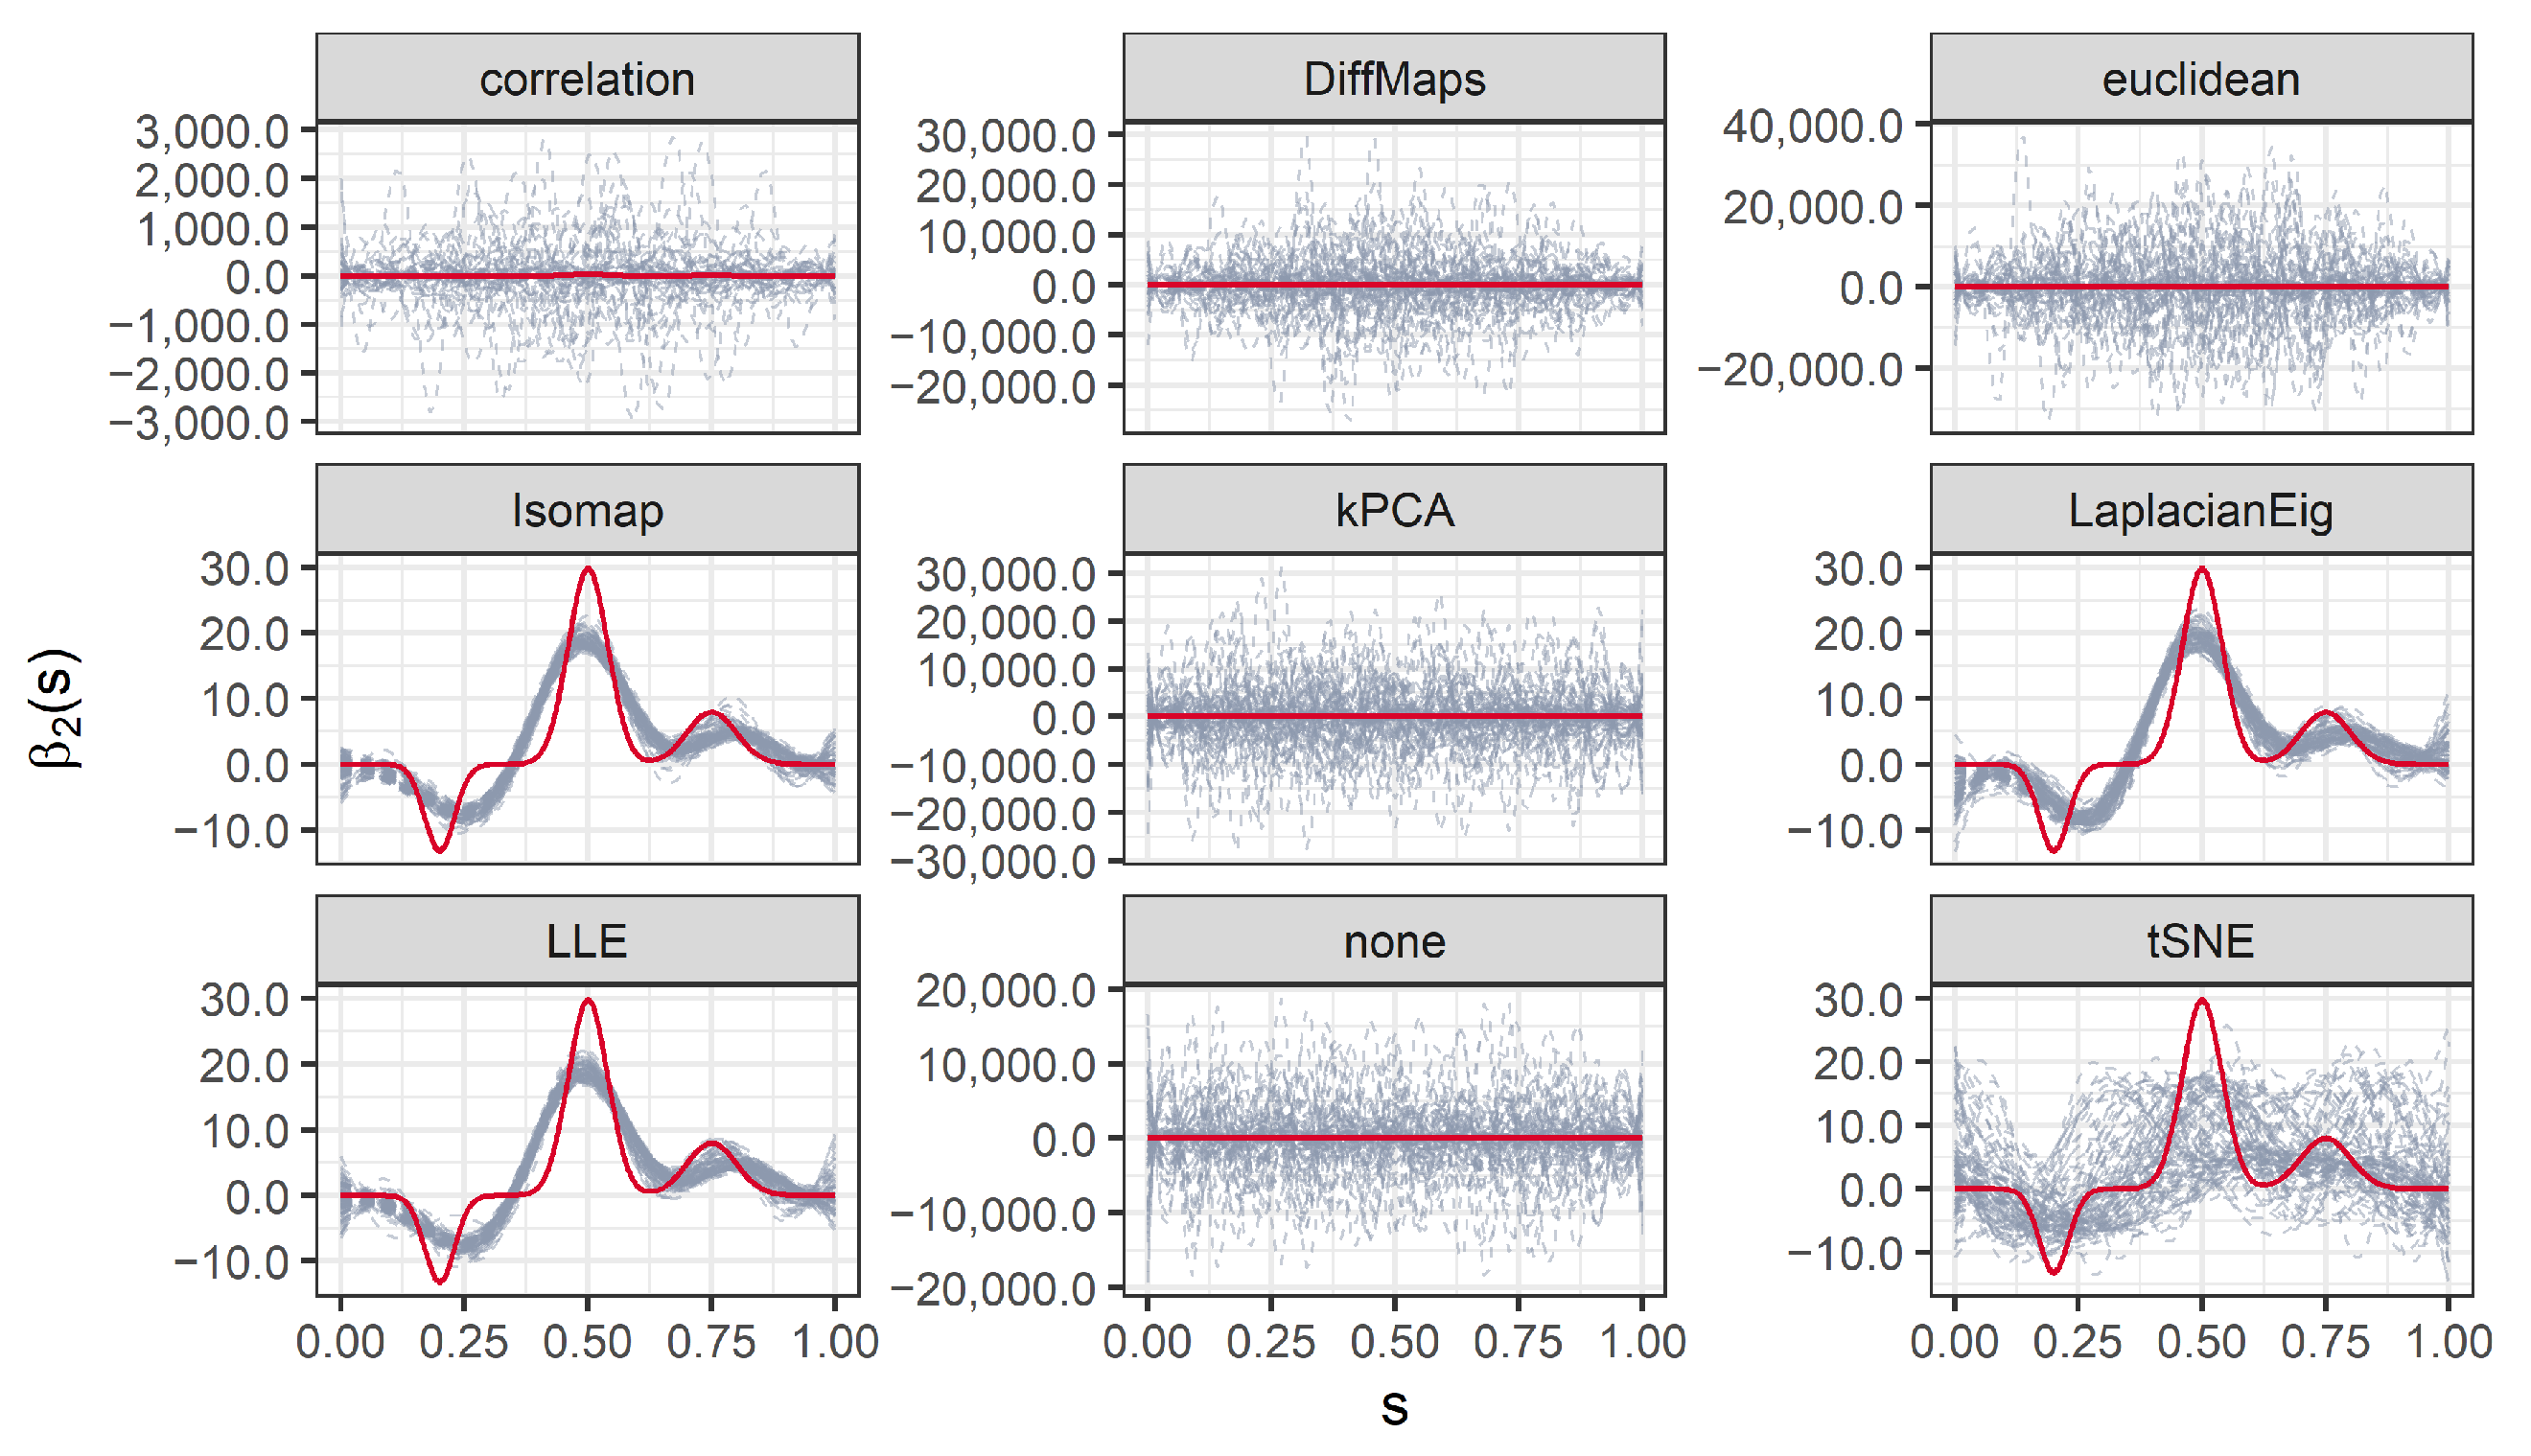
We consider two different coefficient functions β 1 ( · ) , β 2 ( · ) , defined over the interval [ 0 , 1 ] :
β 1 ( t ) = sin ( 2 π t ) , β 2 ( t ) = f 1 ( t ) + 3 f 2 ( t ) + f 3 ( t ) ,
where f 1 , f 2 , and f 3 are normal density functions defined by the ( μ , σ 2 ) -duplets: ( 0.2 , 0.03 2 ) , ( 0.5 , 0.04 2 ) , and ( 0.75 , 0.05 2 ) , respectively. Figure 1 depicts both coefficient functions.
The continuous responses (Simulation 1) are computed through the integration of:
y i l = [ 0 , 1 ] X i ( t ) β l ( t ) d t + z ; i = 1 , , n ;
for z N ( 0 , 0.4 2 ) and subscript l = 1 , 2 indicating which coefficient function is used. The binary responses (Simulation 2) are computed according to the functional logistic regression model, i.e.:
y i l Ber ( π i l ) ,
where π i l , i = 1 , , n , defines the probability of getting a response 1, given the functional data:
π i l = P ( Y = 1 | X i ( t ) ) = exp α + 0 1 X i ( t ) · β l ( t ) d t 1 + exp α + 0 1 X i ( t ) · β l ( t ) d t ; l = 1 , 2 ;
with the scalar α set to 0. Figure 2 represents three of the generated functional predictors and their associated responses (continuous or binary) for β 2 ( · ) .
In practice each curve is evaluated over a fine grid of equally spaced knots { t j } [ 0 , 1 ] , j = 1 , , p . Therefore, the realizations { X i ( t j ) } , where i = 1 , , n and j = 1 , , p , can be arranged in a design matrix X n × p . Then, following the hypotheses of the stringing methodology, we randomly permute its columns to obtain a new matrix X ˜ n × p . This procedure mimics the effect of observing the functional samples with an unknown random order of the nodes. Thus, the goals are to retrieve a good estimation of the true order of the columns, achieve low prediction errors, and estimate coefficient functions closer to the true β 1 ( · ) , β 2 ( · ) . We evaluate the quality of the stringed order by computing the relative order error (ROE), introduced by Chen et al. [1]:
R O E = j = 1 p | o j S o j | E j = 1 p | o j R o j | = j = 1 p | o j S o j | ( p 1 ) ( p + 1 ) 3 ,
where o j denotes the true order for each predictor indexed by j = 1 , , p ; o j R the order of predictor j after the random permutation; and o j S the order induced by stringing. The quality of the predictions is evaluated through the test mean square error (MSE) and area under the receiver operating curve (AUC) for continuous and binary responses, respectively. The suitability of the estimated β ^ 1 ( · ) , β ^ 2 ( · ) is measured with the integrated mean square error (IMSE):
IMSE ( β ^ l ) = 0 1 β l ( t ) β ^ l ( t ) 2 d t 1 / 2 , l = 1 , 2 .
We present the results for 200 simulated data sets that combine three different n / p ratios 50 / 101 , 100 / 101 , 1000 / 101 . UDS-stringing uses Pearson correlation and Euclidean distance. ML-stringing deploys Isomap, LLE, Laplacian Eigenmaps, Diffusion Maps, kPCA, and tSNE algorithms. We also analyze the effect of taking a random order of the components. The sample is partitioned into 70 / 30 % subsets for training and testing purposes.

2.4. Case Study: Prognosis of Colon Cancer from Gene Expression Arrays

We apply stringing to a study comparing gene expressions in colon tissues of 40 cancer patients with 22 controls [37]. The raw data is freely available in the package colonCA [38], and can be arranged in a 62 × 2000 matrix X ˜ recording the gene expression data and a binary vector Y of length 62, recording the sample status (we write Y = 1 to indicate tumor, Y = 0 normal). Our purpose is to illustrate the versatility of stringing (particularly, via ML) with a real high-dimensional dataset that has been widely approached from a multivariate analysis perspective.
Let us assume that a feasible smooth stochastic process can explain the (scrambled and noisy) observed values. The task is to estimate an order of the elements of X ˜ (and associated positions s ^ R ), revealing smooth transitions between gene expression levels. Therefore, we apply stringing (both the UDS and the ML approaches) and estimate the functional predictors corresponding to the observed gene expressions of the patients. Next, we fit a logistic SOF regression as described in 
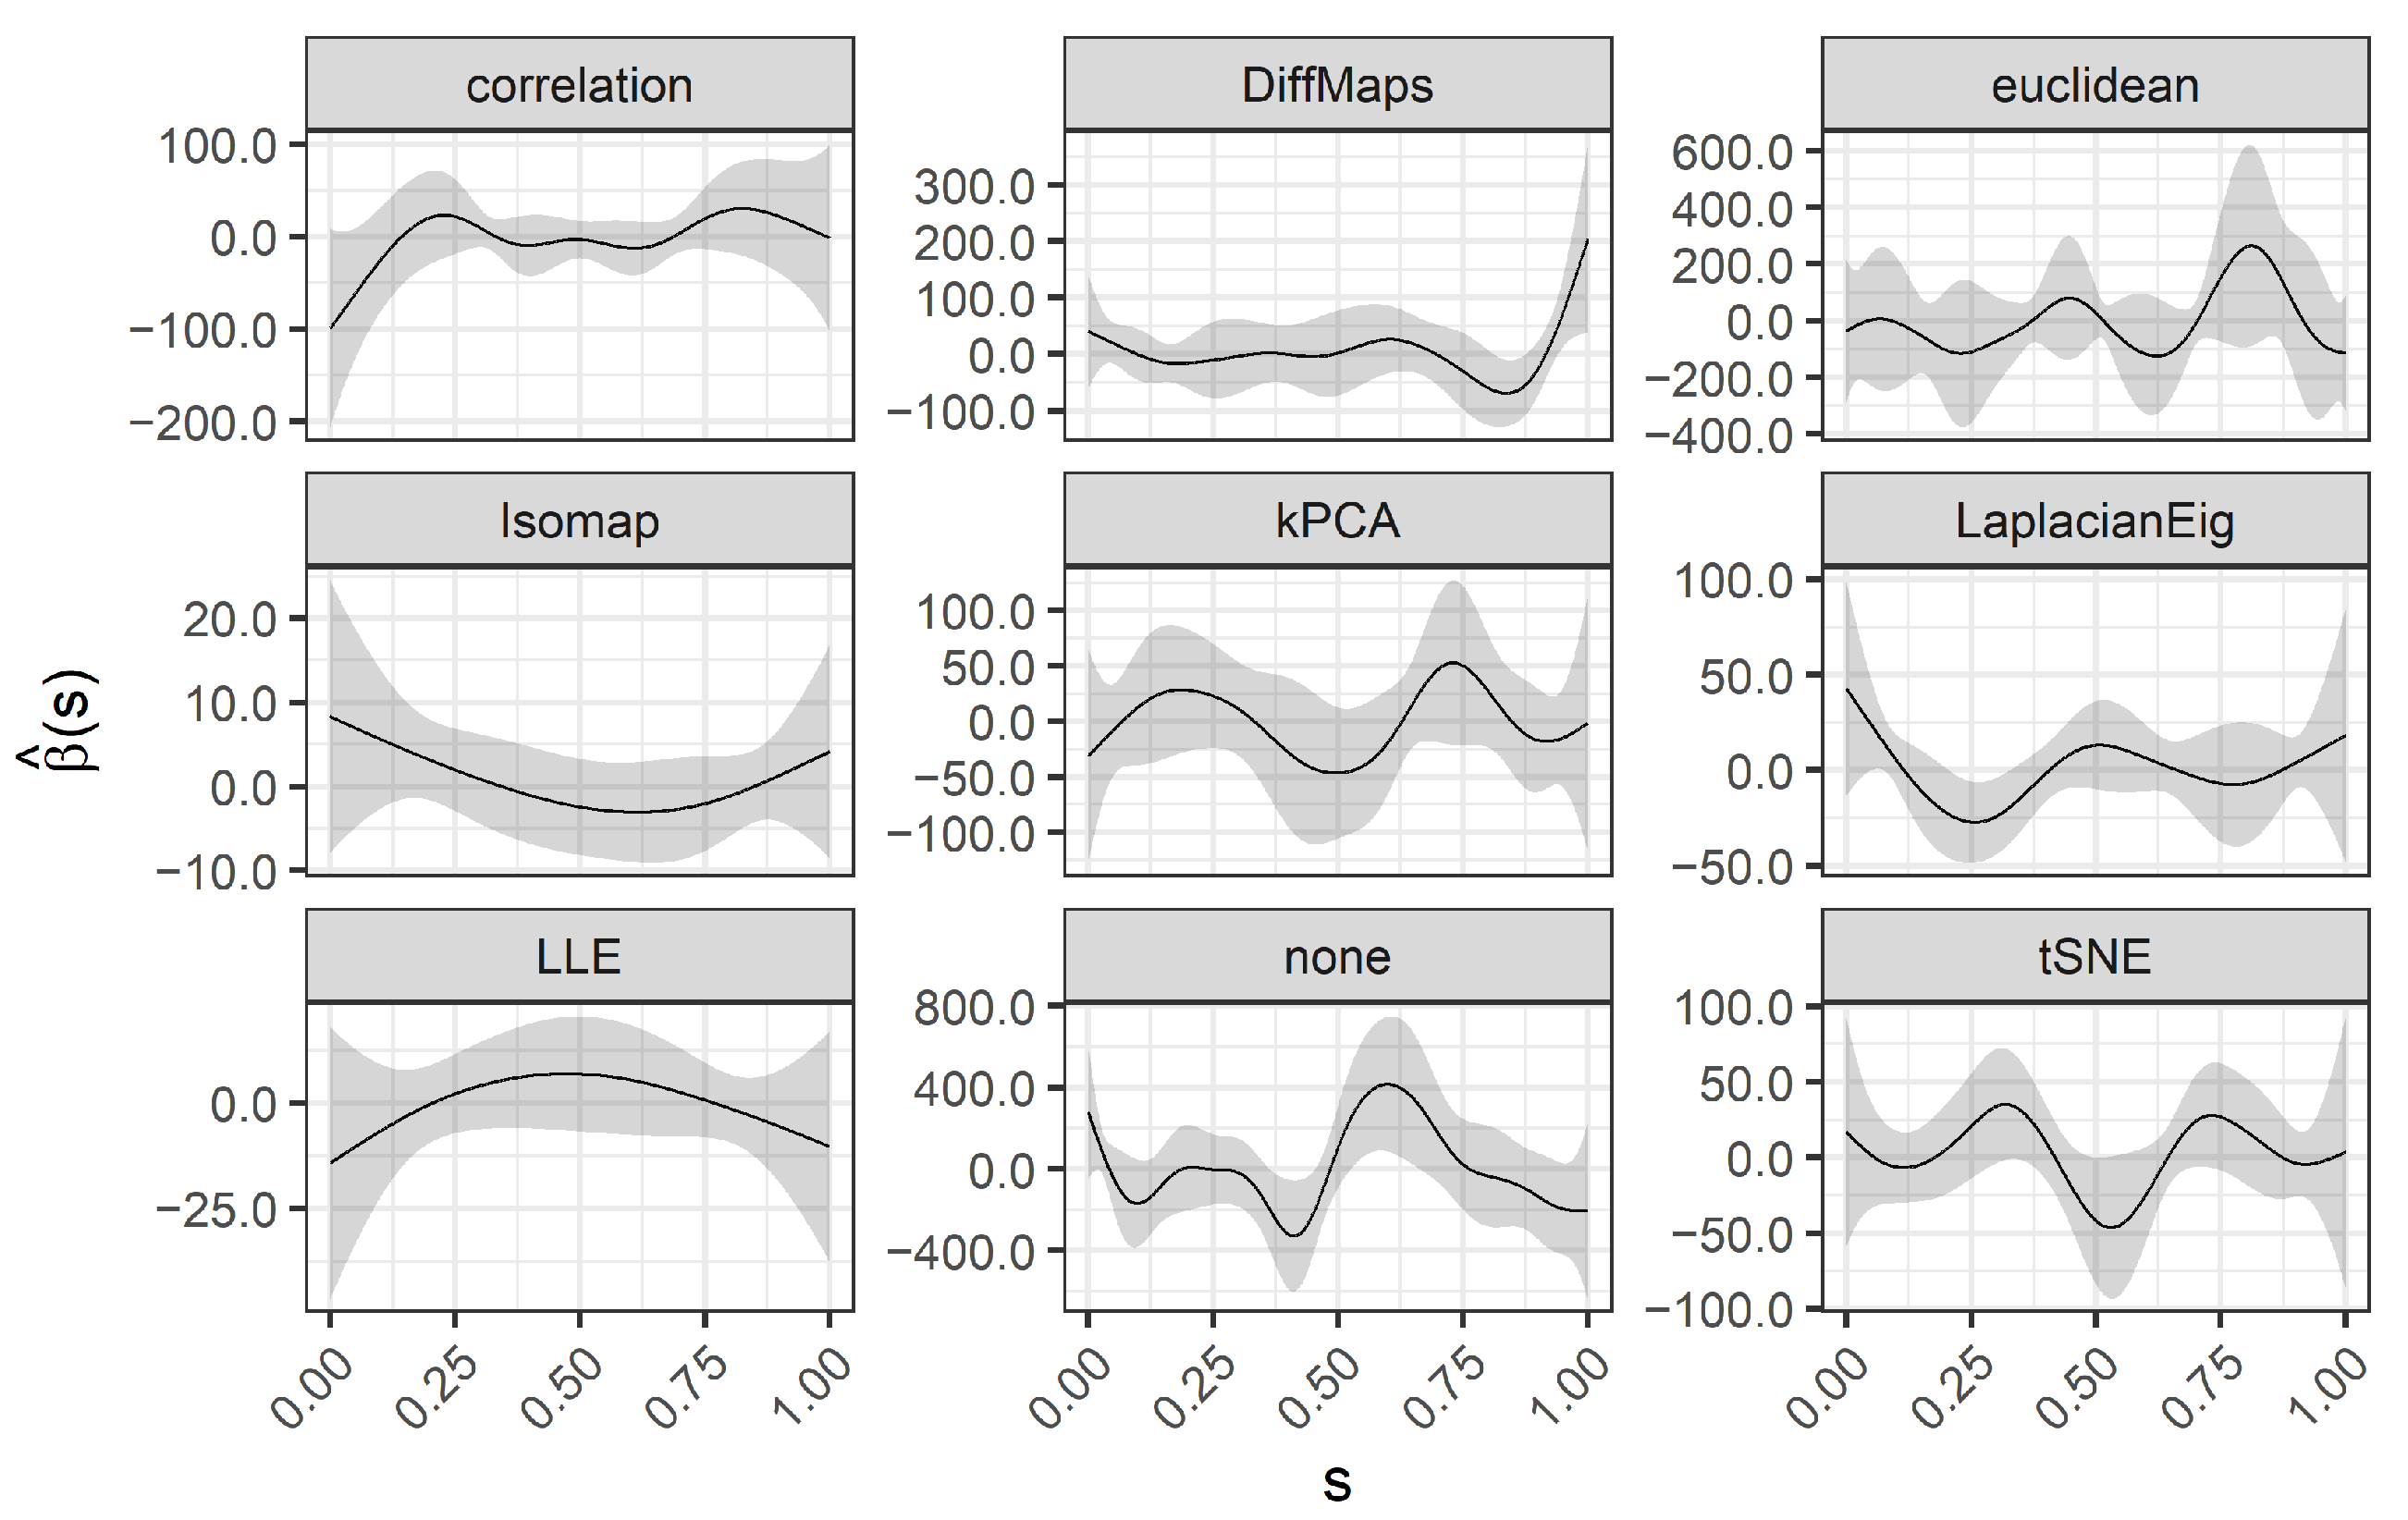
Section 2.2. We scale the data (as usual in machine learning), to obtain zero-mean columns with unit standard deviation. This step also facilitates the visual representation of the high-dimensional data.
Recall our interest in: (1) the visual representation of gene expressions achieved by the estimated functional predictors X i ( · ) ; (2) the interpretability of the estimated coefficient function β ^ ( · ) ; and (3) the accuracy of the predictions (cancer/control patients) achieved by the logistic SOF regression.
The first two aspects are strictly related to each other. In terms of interpretability, we desire smoother transitions between similar gene expression levels and an easy-to-read β ^ ( · ) (smooth, a few wiggles and sign changes). Coefficient functions act as weights of the functional predictors. Nodes s * R such that | β ^ ( s * ) | 0 indicate areas with lower impact on the outcome, while | β ^ ( s * ) | 0 indicates the areas that are most predictive of the outcome. In particular, estimating a β ^ ( · ) with fewer wiggles and sign changes allows an easy interpretation of the logistic SOF model in terms of odds ratios (OR). Following [39], we let l i be the logit transformation of a specific functional observation (one of our smooth estimated processes) X i ( s ) , where i { 1 , , 62 } and s [ 0 , 1 ] . It represents the logarithm of the odds of response Y = 1 :
l i = ln π i 1 π i = ln P ( Y = 1 | X i ( s ) ) P ( Y = 0 | X i ( s ) ) ,
where π i is defined as in Equation (10). Now, let l i * be the logit transformation of the functional observation increased by a positive constant A in a specific interval [ s 0 , s 0 + h ] [ 0 , 1 ] . Then, it can be shown that the expression:
exp l i * l i = exp A s 0 s 0 + h β ( s ) d s ,
is an OR, so that the odds of response Y = 1 is multiplied by the right-hand side of Equation (11) when the value of X i ( s ) is constantly increased in A units in the fixed interval [ s 0 , s 0 + h ] .
For the third aspect, we randomly split the sample into 70 / 30 % subsets for training and testing purposes. By doing this a hundred times we obtain the distribution of the AUC values, similar to the procedure from Simulation 2. We also study the effect of an a priori reduction of the dimension (p), as in the FEM paper [7]. This is done by selecting the top genes with the highest Welch’s t-statistic (a similar preselection of features is found in [40,41]). Thus, three different design matrices of sizes 62 × 500 , 62 × 1000 , and 62 × 2000 (all the predictors) are considered.
The results motivate a second a priori reduction of p: using as input features the ones selected by a “rough” lasso. We take advantage of the package glment[42] and feed lasso with a small penalty λ l a s s o (small enough to select as many features as possible), and all the available data, without partitioning it. This results in p = 30 relevant genes, which makes X ˜ a 62 × 30 design matrix. We note that other a posteriori approaches are also possible, for example, [7,8] iteratively remove the nodes with a minor effect on the model. In those two papers, it is shown that reducing the number of stringed predictors improves the performance of functional models.

3. Results

3.1. Simulation 1: Continuous Response

Figure 3 compares the ROEs under the three n / p ratios. Each boxplot represents the distribution of values for a different seriation algorithm. The effect of taking a random order of the components is also represented (coded as none) and, as expected, the corresponding ROEs are close to 1 with very low variability (i.e., it is very difficult to guess the true order at random). In general, ML-stringing via LLE, Isomap, and Laplacian Eigenmaps are the most accurate alternatives to retrieve the true order of the nodes. These three methods present the lowest median errors and quartiles for every n / p ratio. It is worth noting that the lower the n / p , the higher the variability, no matter the seriation algorithm. This is evident from the larger Interquartile Ranges (IQR, the difference between third and first quartiles: Q 3 Q 1 ) and the minimum and maximum values covering most of the [ 0 , 1 ] interval when n = 50 or 100. If n / p is increased, for example to 1000 / 101 , we observe that the variability is reduced drastically. The exception is tSNE-stringing, which shows similar behavior for every n / p ratio: median ROE over 0.75 but with a very wide range of values. Diffusion Maps and UDS based on Euclidean distance show similar results (median ROEs around 0.5 ), being the second-best group of seriation algorithms. tSNE and UDS based on correlations also show similar behavior in terms of median errors, Q 1 , and Q 3 , although tSNE can achieve smaller ROEs. It is also interesting the behavior of kPCA, its median ROE increases with a higher n / p , particularly, when n = 1000 is equivalent to take a random order (option none). On the other hand, ML-stringing based on LLE or Isomap results in almost perfect rearrangements when n = 1000 .
We remark that the estimated ROEs are independent of the models and the true coefficient functions. These results only take into account the matrix of observations X ˜ n × p . Also, they support some of our preliminary results from a simpler simulation study [43] in which our method (based on LLE and Isomap algorithms) exhibited the lowest ROEs while stringing scrambled realizations of a noisy Ornstein-Uhlenbeck process.
Next, we analyze the effect on the functional regression models. Table 1 (top) summarizes the median MSEs for the six combinations of n / p ratios and β l ( · ) , l = 1 , 2 . Median absolute deviations (MAD, measuring variability) are also reported in brackets. Bold values correspond to the best algorithm (the lowest median from the same column, then deviations if there are ties). In terms of MSEs (accuracy of the predicted outcomes) ML-stringing shows the best performance: tSNE, LLE, Laplacian Eigenmaps, and Isomap (in that order) results in the lowest median MSEs and MADs across n / p ratios. The worst results are obtained when stringing is omitted (option none). Once more we observe an interesting behavior of the tSNE algorithm: the models based on its output generally shows the highest accuracy (lowest MSEs and MADs), while the ROEs in Figure 3 does not necessarily show the best performance. UDS-stringing based on correlations works better than the Euclidean-based version and it is the fifth-best algorithm in terms of median MSEs and variability. Also, it is as competitive as Isomap when n = 50 . Diffusion Maps have the worst performance for lower n / p ratios, especially when β 2 ( · ) is used. The kPCA approach seems to work better for lower n / p ratios. When n = 1000 the variability is substantially reduced and is noticeable the superiority of the top four algorithms (tSNE, LLE, Laplacian Eigenmaps, and Isomap). Moreover, the rest of the algorithms show a performance similar to that of a random order; for example, kPCA if β 1 ( · ) is used, or UDS based on Euclidean distance and Diffusion Maps if the model is defined by β 2 ( · ) .
Table 1 (bottom) summarizes the median IMSEs and the corresponding MADs. The advantages of our proposal are also evident in the resulting IMSE( β ^ l ): ML-stringing via LLE, Laplacian Eigenmaps, Isomap, and tSNE (in that order) shows the lowest median errors and variability. Moreover, these errors are generally reduced when n increases. Surprisingly, we observe the opposite behavior for UDS-stringing and the ML version based on Diffusion Maps and kPCA when β 2 ( · ) defines the functional model. These results indicate that the most competitive algorithms in terms of prediction accuracy are also the most effective for estimating the true coefficient functions.
Figure 4 depicts the (top 100 in terms of IMSEs for n / p = 1000 / 101 ) estimated coefficient functions β ^ 1 ( · ) as gray-dashed lines, compared to the true β 1 ( · ) in bold red. ML-stringing based on Isomap, LLE, and Laplacian Eigenmaps gives the best estimates: they all resemble the true function with minor differences. Diffusion Maps and UDS based on Euclidean distance also produce acceptable estimates, even though some of the curves are straight lines. tSNE does better in this sense with curves closer in shape to β 1 ( · ) . The poorest estimates are obtained for kPCA and UDS based on correlations, with curves that vary in shape and magnitude, similar to taking a random order. Figure 5 shows the same plots for β 2 ( · ) . In this case, all methods struggle to reproduce completely the shape of β 2 ( · ) . Only Isomap, LLE, and Laplacian Eigenmaps result in reasonable estimates. tSNE also shows fair estimations, not very accurate in shape but bounded to the lower and upper limits of β 2 ( s ) , s [ 0 , 1 ] , which we believe justifies the high ROEs and small MSEs. However, the estimated { β ^ 2 ( · ) } for UDS-stringing and ML based on Diffusion Maps and kPCA are as extreme as the ones obtained with the random order.

3.2. Simulation 2: Binary Response

The estimated ROEs show no differences to the ones obtained in Simulation 1 (Figure 3) and as the same results hold they are not reported again. Figure 6 and Figure 7 depict the distribution of AUC values when using β 1 ( · ) and β 2 ( · ) , respectively. For β 1 ( · ) , we observe that the values are close to the 0.5 horizontal (meaning a random discrimination), while those for β 2 ( · ) are always close to 1 (almost perfect discrimination). This is expected as the generated { π i 1 } i = 1 n tend to be centered around 0.5 , while the distribution of the { π i 2 } i = 1 n is markedly bimodal.
Figure 6 shows that using ML-stringing via Laplacian Eigenmaps, LLE, Isomap, and tSNE imply higher median AUCs in the models determined by β 1 ( · ) . Diffusion Maps and UDS based on Euclidean distance are also feasible alternatives when n = 1000 . Avoiding stringing (option none) returns the lowest median AUCs for every n / p ratio and, when n = 1000 , is as competitive as kPCA and UDS based on correlations. All methods show an important improvement in terms of variability when n increases, and it is in this case when the differences across algorithms are more noticeable. Figure 7 shows similar results, although only when n = 1000 the differences between methods are visible. Also, the IQRs are substantially smaller when β 2 ( · ) defines the model, despite the higher number of outliers.
Figure 8 presents the boxplots of IMSE ( β 1 ) . In this case, it is more difficult to compare the algorithms (especially for lower n / p ratios) due to the number of outliers. Nevertheless, the random order (option none), kPCA, and UDS based on correlations show the worst results. Also, when n is increased we observe that ML-stringing via Laplacian Eigenmaps, LLE, and Isomap outperform the rest of the algorithms. Figure 9 shows that it is even harder to compare the IMSE ( β 2 ) across methods, due to the number and magnitude of outlying integrated errors. Only when n = 1000 we can state that ML-stringing via Laplacian Eigenmaps, tSNE, LLE, and Isomap have the best performance.

3.3. Case Study: Prognosis of Colon Cancer from Gene Expression Arrays

Figure 10 represents a sample of 3 (out of 62) estimated functional predictors (solid lines) and corresponding stringed gene expressions (dashed lines). In general, we observe smooth transitions between gene expressions (the nodes of the functional data).
Figure 11 depicts the estimated coefficient functions with 95 % confidence bands. We observe that ML-stringing based on LLE and Isomap results in smoother estimations, with fewer wiggles and sign changes. This allows an easy interpretation of the models in terms of ORs. In this case, Isomap and LLE algorithms use κ max = 5 and 50 neighbors, respectively.
Therefore, we divide the interval [ 0 , 1 ] into three subintervals ( I i [ 0 , 1 ] , i = 1 , 2 , 3 ) delimited by the sign changes of the coefficients functions estimated with LLE/Isomap-stringing. Next, we compute the ORs in each subinterval using Equation (11) and fixing A = 1 , see Table 2. On the one hand, LLE introduces an order such that in ( 0.21 , 0.77 ) the odds of tumor are multiplied by 12.82 when the value of the functional observation is constantly increased in A = 1 unit. On the other hand, Isomap implies that the odds of tumor in [ 0 , 0.34 ) and ( 0.85 , 1 ] are multiplied by 3.86 and 1.36 , respectively when the value of the functional observation is increased in one unit. We remark that this interpretation is considering the set of genes that are mapped to each of the I i by stringing, and that the expression levels are scaled.
Figure 12 presents the boxplots of the AUC values for stringing (under several seriation algorithms). Each panel indicates a different number of features to be stringed. When p = 2000 (no a priori reduction) all the seriation algorithms exhibit a comparable performance, being ML-stringing via tSNE and LLE algorithms the best alternatives (higher medians, less variability, smaller IQR, and higher Q 1 , Q 3 ). Doing the a priori reduction ( p { 500 , 1000 } ) by Welch’s t-test favors ML-stringing compared to the UDS-based version. However, the reader may have noticed that the overall performance decreases. These results motivate the second a priori reduction of p based on a rough-lasso selection (see Section 2.4). In this case, we can reduce X ˜ to a 62 × 30 matrix. Interestingly, changing the preselection of features improves the performance of all the seriation algorithms (see the panel p = 30 ), but with a clear advantage of our proposal based on ML. The exception is the tSNE algorithm as a consequence of setting a smaller perplexity parameter due to the reduction of p. Despite this, the overall improvement is consistent with our simulation studies in which higher n / p ratios resulted in better predictions, particularly, with smaller variability.

4. Discussion

In this article we discussed stringing, a class of methods that links high-dimensional data to the field of FDA according to [1]. During our research, we noticed the connection with seriation methods, for one-mode two-way data. Also, we realized that stringing based on UDS rearranged data according to linear relationships between predictors. Motivated by these findings we introduced ML-stringing, a version of the method that takes into account a more complex structure of the data, like nonlinearities. Our study gave insights into the use of different seriation algorithms, the effect on the functional representation of general high-dimensional data, and the estimation of SOF regression models.
In simulation studies (data are realizations of a smooth stochastic process observed with a random permutation of the nodes) we observed that ML-stringing achieved the best accuracy: lower MSEs for continuous response models or higher AUCs in the case of binary outcomes. In particular, LLE, Isomap, Laplacian Eigenmaps, and tSNE outperformed all the other seriation algorithms. For these mappings, we also noted that the estimated coefficient functions were closer to the true functions generating the data, which is translated into lower IMSEs. However, the differences were more difficult to observe in the classification problem, due to the number and magnitude of outliers. In terms of the quality of the estimated order, we observed the smallest ROEs for LLE, Isomap, and Laplacian Eigenmaps.
A singular finding was that higher ROEs does not necessarily imply a poorer prediction, for example, tSNE showed a highly variable ROE with a median value around 0.75 and still produced the best accuracy in Simulation 1. In this direction, it would be interesting (and challenging) to evaluate from a theoretical perspective the effect of each particular seriation algorithm in functional regression models.
The real data illustration, regarding the prognosis of colon cancer from gene expression arrays, showed that stringing is a feasible alternative to represent and model general high-dimensional data. We observed that ML-stringing provided more accurate models (higher AUC values). In particular, when the number of features was reduced a priori (a practice commonly encountered in the literature), our method was more consistent than the UDS-based approach. Also, the estimated coefficient functions for the Isomap/LLE-stringed data had lower variability and allowed an interpretation in terms of ORs.
It is worth noting that Isomap and LLE algorithms are very easy to tune: we just need to compute the embeddings for several numbers of neighbors ( κ ) and then find the optimal κ max using a quality criterion. We believe this is an advantage over the rest of ML approaches as it avoids tuning several parameters or the need for an a priori knowledge of the characteristics of the data to pick the proper kernel. With this in mind, all the ML algorithms discussed in this paper could be further tuned to improve their outputs, but it would be counterproductive, especially with simpler and powerful alternatives at hand.
Further research should be undertaken to investigate the impact of stringing via ML on functional Cox and FOS regressions, as considered in the literature. Another “intriguing possibility” mentioned by Chen et al. [1] is to consider a higher-dimensional target space R l , where 1 < l p . This means that instead of ordering the predictors in R we could assign them to points in R 2 or R 3 and consider the data as realizations of a stochastic process with more than one argument. Taking into account our findings, we believe ML could be a feasible alternative to stringing in such scenarios.
We remark that stringing does not take into consideration the outcome Y. This is clear from the fact that both UDS and ML are unsupervised learning techniques. We consider this a key strength for further applications, not necessarily related to regression. Nevertheless, the link we have established with seriation offers more possibilities to extend stringing. In this context, two-mode two-way methods would aim to reorder both the columns and rows of the design matrix ( X ˜ ), revealing clusters of relevant features and subjects (particularly interesting in classification problems). In any case, the richness of FDA techniques, seriation algorithms, and the increasing availability of high-dimensional data make stringing a promising research topic.

Supplementary Materials

The supplementary documents are available online at https://www.mdpi.com/2227-7390/9/4/406/s1.

Author Contributions

Conceptualization, H.A.H.-R., M.C.A.-M. and R.E.L.; methodology, H.A.H.-R., M.C.A.-M. and R.E.L.; software, H.A.H.-R.; validation, H.A.H.-R.; formal analysis, H.A.H.-R., M.C.A.-M. and R.E.L.; investigation, H.A.H.-R., M.C.A.-M. and R.E.L.; resources, M.C.A.-M. and R.E.L.; data curation, H.A.H.-R.; writing—original draft preparation, H.A.H.-R.; writing—review and editing, M.C.A.-M. and R.E.L.; visualization, H.A.H.-R.; supervision, M.C.A.-M. and R.E.L.; project administration, M.C.A.-M. and R.E.L.; funding acquisition, M.C.A.-M. and R.E.L. All authors have read and agreed to the published version of the manuscript.

Funding

This research was funded in part by Ministerio de Ciencia, Innovación y Universidades grant numbers PID2019-104901RBI00 and MTM2017-88708-P.

Institutional Review Board Statement

Not applicable.

Informed Consent Statement

Not applicable.

Data Availability Statement

The data presented in this study are openly available in Bioconductor at https://doi.org/10.18129/B9.bioc.colonCA. The codes necessary to reproduce the simulation studies and the case study are available as Supplementary Materials.

Acknowledgments

The authors would like to thank the anonymous referees whose comments and suggestions have improved the understanding of this paper.

Conflicts of Interest

The authors declare no conflict of interest.

References

  1. Chen, K.; Chen, K.; Müller, H.G.; Wang, J.L. Stringing High-Dimensional Data for Functional Analysis. J. Am. Stat. Assoc. 2011, 106, 275–284. [Google Scholar] [CrossRef]
  2. Ramsay, J.O.; Silverman, B.W. Functional Data Analysis, 2nd ed.; Springer Series in Statistics; Springer: New York, NY, USA, 2005. [Google Scholar]
  3. Kokoszka, P.; Reimherr, M. Introduction to Functional Data Analysis; CRC Press Taylor & Francis Group: Boca Ratón, FL, USA, 2017. [Google Scholar]
  4. Wang, J.L.; Chiou, J.M.; Müller, H.G. Functional Data Analysis. Annu. Rev. Stat. Its Appl. 2016, 3, 257–295. [Google Scholar] [CrossRef] [Green Version]
  5. Tibshirani, R. Regression Shrinkage and Selection via the Lasso. J. R. Stat. Soc. Ser. B (Methodol.) 1996, 58, 267–288. [Google Scholar] [CrossRef]
  6. Hastie, T.; Tibshirani, R.; Wainwright, M. Statistical Learning with Sparsity; Chapman and Hall/CRC: London, UK, 2015; p. 362. [Google Scholar]
  7. Wu, P.S.; Müller, H.G. Functional embedding for the classification of gene expression profiles. Bioinformatics 2010, 26, 509–517. [Google Scholar] [CrossRef] [PubMed] [Green Version]
  8. Chen, K.; Zhang, X.; Petersen, A.; Müller, H.G. Quantifying Infinite-Dimensional Data: Functional Data Analysis in Action. Stat. Biosci. 2017, 9, 582–604. [Google Scholar] [CrossRef]
  9. Zhang, T.; Wang, Z.; Wan, Y. Functional test for high-dimensional covariance matrix, with application to mitochondrial calcium concentration. Stat. Pap. 2019. [Google Scholar] [CrossRef]
  10. Chen, C.J.; Wang, J.L. A New Approach for Functional Connectivity via Alignment of Blood Oxygen Level-Dependent Signals. Brain Connect. 2019, 9, 464–474. [Google Scholar] [CrossRef]
  11. Moon, S.E.; Chen, C.J.; Hsieh, C.J.; Wang, J.L.; Lee, J.S. Emotional EEG classification using connectivity features and convolutional neural networks. Neural Netw. 2020, 132, 96–107. [Google Scholar] [CrossRef] [PubMed]
  12. Aguilera-Morillo, M.C.; Buño, I.; Lillo, R.E.; Romo, J. Variable selection with P-splines in functional linear regression: Application in graft-versus-host disease. Biom. J. 2020, 62, 1670–1686. [Google Scholar] [CrossRef]
  13. Hahsler, M. An experimental comparison of seriation methods for one-mode two-way data. Eur. J. Oper. Res. 2017, 257, 133–143. [Google Scholar] [CrossRef]
  14. Liiv, I. Seriation and matrix reordering methods: An historical overview. Stat. Anal. Data Min. 2010, 3, 70–91. [Google Scholar] [CrossRef]
  15. Bagaria, V.; Ding, J.; Tse, D.; Wu, Y.; Xu, J. Hidden Hamiltonian Cycle Recovery via Linear Programming. Oper. Res. 2020, 68, 53–70. [Google Scholar] [CrossRef] [Green Version]
  16. Izenman, A.J. Modern Multivariate Statistical Techniques; Springer Texts in Statistics; Springer: New York, NY, USA, 2008. [Google Scholar]
  17. Tenenbaum, J.B.; Silva, V.D.; Langford, J.C. A Global Geometric Framework for Nonlinear Dimensionality Reduction. Science 2000, 290, 2319–2323. [Google Scholar] [CrossRef] [PubMed]
  18. Roweis, S.T.; Saul, L.K. Nonlinear Dimensionality Reduction by Locally Linear Embedding. Science 2000, 290, 2323–2326. [Google Scholar] [CrossRef] [PubMed] [Green Version]
  19. Belkin, M.; Niyogi, P. Laplacian eigenmaps for dimensionality reduction and data representation. Neural Comput. 2003, 15, 1373–1396. [Google Scholar] [CrossRef] [Green Version]
  20. Coifman, R.R.; Lafon, S. Diffusion maps. Appl. Comput. Harmon. Anal. 2006, 21, 5–30. [Google Scholar] [CrossRef] [Green Version]
  21. van der Maaten, L.; Hinton, G. Visualizing Data using t-SNE. J. Mach. Learn. Res. 2008, 9, 2579–2605. [Google Scholar]
  22. Schölkopf, B.; Smola, A.; Müller, K.R. Nonlinear Component Analysis as a Kernel Eigenvalue Problem. Neural Comput. 1998, 10, 1299–1319. [Google Scholar] [CrossRef] [Green Version]
  23. Mardia, K.; Kent, J.; Bibby, J. Multivariate Analysis; Academic Press: New York, NY, USA, 1979. [Google Scholar]
  24. Hinton, G.E.; Roweis, S. Stochastic Neighbor Embedding. In Advances in Neural Information Processing Systems; Becker, S., Thrun, S., Obermayer, K., Eds.; MIT Press: Cambridge, MA, USA, 2003; Volumne 15, pp. 857–864. [Google Scholar]
  25. Kraemer, G.; Reichstein, M.; Mahecha, M.D. dimRed and coRanking-Unifying Dimensionality Reduction in R. R J. 2018, 10, 342. [Google Scholar] [CrossRef] [Green Version]
  26. R Core Team. R: A Language and Environment for Statistical Computing; R Foundation for Statistical Computing: Vienna, Austria, 2020. [Google Scholar]
  27. Chen, L.; Buja, A. Local Multidimensional Scaling for Nonlinear Dimension Reduction, Graph Drawing, and Proximity Analysis. J. Am. Stat. Assoc. 2009, 104, 209–219. [Google Scholar] [CrossRef] [Green Version]
  28. Carroll, C.; Gajardo, A.; Chen, Y.; Dai, X.; Fan, J.; Hadjipantelis, P.Z.; Han, K.; Ji, H.; Müller, H.G.; Wang, J.L. fdapace: Functional Data Analysis and Empirical Dynamics, R Package Version 0.5.5; 2020. Available online: https://CRAN.R-project.org/package=fdapace (accessed on 22 December 2020).
  29. Goldsmith, J.; Bobb, J.; Crainiceanu, C.M.; Caffo, B.; Reich, D. Penalized Functional Regression. J. Comput. Graph. Stat. 2011, 20, 830–851. [Google Scholar] [CrossRef] [Green Version]
  30. Reiss, P.T.; Goldsmith, J.; Shang, H.L.; Ogden, R.T. Methods for Scalar-on-Function Regression. Int. Stat. Rev. 2017, 85, 228–249. [Google Scholar] [CrossRef] [PubMed]
  31. Aguilera-Morillo, M.C.; Aguilera, A.M.; Escabias, M.; Valderrama, M.J. Penalized spline approaches for functional logit regression. Test 2013, 22, 251–277. [Google Scholar] [CrossRef]
  32. Yao, F.; Müller, H.G.; Wang, J.L. Functional Data Analysis for Sparse Longitudinal Data. J. Am. Stat. Assoc. 2005, 100, 577–590. [Google Scholar] [CrossRef]
  33. Eilers, P.H.C.; Marx, B.D. Flexible smoothing with B -splines and penalties. Stat. Sci. 1996, 11, 89–121. [Google Scholar] [CrossRef]
  34. Eilers, P.H.; Marx, B.D.; Maria, D. Twenty Years of P-Splines. SORT-Stat. Oper. Res. Trans. 2015, 39, 149–186. [Google Scholar]
  35. Ruppert, D. Selecting the Number of Knots for Penalized Splines. J. Comput. Graph. Stat. 2002, 11, 735–757. [Google Scholar] [CrossRef]
  36. Goldsmith, J.; Scheipl, F.; Huang, L.; Wrobel, J.; Di, C.; Gellar, J.; Harezlak, J.; McLean, M.W.; Swihart, B.; Xiao, L.; et al. Refund: Regression with Functional Data, R Package Version 0.1-21; 2019. Available online: https://CRAN.R-project.org/package=refund (accessed on 22 December 2020).
  37. Alon, U.; Barkai, N.; Notterman, D.A.; Gish, K.; Ybarra, S.; Mack, D.; Levine, A.J. Broad patterns of gene expression revealed by clustering analysis of tumor and normal colon tissues probed by oligonucleotide arrays. Proc. Natl. Acad. Sci. USA 1999, 96, 6745–6750. [Google Scholar] [CrossRef] [PubMed] [Green Version]
  38. Merk, S. ColonCA: ExprSet for Alon et al. (1999) Colon Cancer Data, R Package Version 1.32.0. 2020. [CrossRef]
  39. Escabias, M.; Aguilera, A.M.; Valderrama, M.J. Modeling environmental data by functional principal component logistic regression. Environmetrics 2005, 16, 95–107. [Google Scholar] [CrossRef]
  40. Nguyen, D.V.; Rocke, D.M. Tumor classification by partial least squares using microarray gene expression data. Bioinformatics 2002, 18, 39–50. [Google Scholar] [CrossRef] [Green Version]
  41. Zou, H.; Hastie, T. Regularization and Variable Selection via the Elastic Net. J. R. Stat. Soc. Ser. B (Stat. Methodol.) 2005, 67, 301–320. [Google Scholar] [CrossRef] [Green Version]
  42. Friedman, J.; Hastie, T.; Tibshirani, R. Regularization Paths for Generalized Linear Models via Coordinate Descent. J. Stat. Softw. 2010, 33, 1. [Google Scholar] [CrossRef] [PubMed] [Green Version]
  43. Hernández-Roig, H.A.; Aguilera-Morillo, M.C.; Lillo, R.E. From High-dimensional to Functional Data: Stringing Via Manifold Learning. In Functional and High-Dimensional Statistics and Related Fields; Aneiros, G., Horová, I., Hušková, M., Vieu, P., Eds.; Springer International Publishing: Cham, Switzerland, 2020; pp. 115–122. [Google Scholar]
Figure 1. Simulations 1–2: True coefficient functions β 1 ( · ) and β 2 ( · ) .
Mathematics 09 00406 g001
Figure 2. Simulations 1–2: A sample of 3 functional predictors and their associated responses (left: continuous, right: binary) when β 2 ( · ) is used. Dashed lines illustrate the added noise (solid: no measurement error).
Mathematics 09 00406 g002
Figure 3. Simulation 1: ROE values for different n / p ratios. The boxplots represent the effect of the random permutation (none); stringing via UDS (correlation, euclidean); and ML (LLE, Isomap, LaplacianEig, DiffMaps, tSNE, kPCA).
Mathematics 09 00406 g003
Figure 4. Simulation 1: Coefficient function β 1 ( · ) (red-bold line) and estimations after stringing (gray-dashed lines). The panels compare UDS-stringing (correlation, euclidean) with ML-stringing (LLE, Isomap, LaplacianEig, DiffMaps, tSNE, kPCA). The ratio n / p = 1000 / 101 is the same for all the plots.
Mathematics 09 00406 g004
Figure 5. Simulation 1: Coefficient function β 2 ( · ) (red-bold line) and estimations after stringing (gray-dashed lines). The panels compare UDS-stringing (correlation, euclidean) with ML-stringing (LLE, Isomap, LaplacianEig, DiffMaps, tSNE, kPCA). The ratio n / p = 1000 / 101 is the same for all the plots.
Mathematics 09 00406 g005
Figure 6. Simulation 2: Distribution of AUC values for β 1 ( · ) and the three n / p ratios. The boxplots compare the performance of a random permutation (none); UDS-stringing (correlation, euclidean); and ML-stringing (LLE, Isomap, LaplacianEig, DiffMaps, tSNE, kPCA).
Mathematics 09 00406 g006
Figure 7. Simulation 2: Distribution of AUC values for β 2 ( · ) and the three n / p ratios. The boxplots compare the performance of a random permutation (none); UDS-stringing (correlation, euclidean); and ML-stringing (LLE, Isomap, LaplacianEig, DiffMaps, tSNE, kPCA).
Mathematics 09 00406 g007
Figure 8. Simulation 2: Distribution of IMSE( β 1 ) values for the three n / p ratios. The boxplots compare the performance of a random permutation (none); UDS-stringing (correlation, euclidean); and ML-stringing (LLE, Isomap, LaplacianEig, DiffMaps, tSNE, kPCA).
Mathematics 09 00406 g008
Figure 9. Simulation 2: Distribution of IMSE( β 2 ) values for the three n / p ratios. The boxplots compare the performance of a random permutation (none); UDS-stringing (correlation, euclidean); and ML-stringing (LLE, Isomap, LaplacianEig, DiffMaps, tSNE, kPCA).
Mathematics 09 00406 g009
Figure 10. Case study: A sample of 3 functional predictors and associated classes (red: Y = 0 , blue: Y = 1 ). The stringed gene expressions are represented by dashed lines. The solid curves are the smooth functional predictors. The panels compare UDS-stringing (correlation, euclidean) with ML-stringing (LLE, Isomap, LaplacianEig, DiffMaps, tSNE, kPCA).
Mathematics 09 00406 g010
Figure 11. Case study: Estimated coefficient functions under several seriation algorithms. The panels compare the effect of UDS-stringing (correlation, euclidean); ML-stringing (LLE, Isomap, LaplacianEig, DiffMaps, tSNE, kPCA); and omitting the rearrangement of the predictors (none).
Mathematics 09 00406 g011
Figure 12. Case study: AUC values for the classification of colon tissues. Each panel takes into account a different number of starting features, according to the top genes from a Welch’s t-test ( p { 500 , 1000 , 2000 } ) or the rough-lasso selection ( p = 30 ). The boxplots represent the distribution of AUCs for 100 random splits of the sample and different stringing methods: random permutation (none); UDS-stringing (correlation, euclidean); and ML-stringing (LLE, Isomap, LaplacianEig, DiffMaps, tSNE, kPCA).
Mathematics 09 00406 g012
Table 1. Simulation 1: Median MSE and IMSE ( β ^ l ) , l = 1 , 2 . Median absolute deviations are also reported (in brackets). Values in bold represent the lowest median (and lowest deviation if there is a tie) within each column.
β 1 ( · ) β 2 ( · )
Algorithm∖n 50 100 1000 50 100 1000
MSEcorrelation0.22 (0.1)0.2 (0.05)0.19 (0.03)2.08 (1.36)1.81 (1.12)1.14 (0.38)
DiffMaps0.26 (0.11)0.22 (0.07)0.18 (0.02)4.15 (4.11)4.58 (4.03)2.04 (0.86)
euclidean0.24 (0.11)0.21 (0.06)0.18 (0.03)2.89 (2.47)3.07 (2.61)2.19 (0.86)
Isomap0.22 (0.1)0.19 (0.05)0.17 (0.01)2.88 (2.64)1.36 (1.06)0.69 (0.06)
kPCA0.2 (0.08)0.21 (0.06)0.21 (0.02)2.52 (1.74)2.46 (1.23)1.91 (0.5)
LaplacianEig0.2 (0.08)0.18 (0.04)0.17 (0.01)1.76 (1.47)0.98 (0.39)0.72 (0.05)
LLE0.2 (0.08)0.18 (0.04)0.17 (0.01)1.38 (0.96)0.91 (0.31)0.69 (0.06)
tSNE0.18 (0.06)0.17 (0.04)0.17 (0.01)0.93 (0.37)0.84 (0.23)0.72 (0.07)
none0.31 (0.12)0.28 (0.08)0.21 (0.02)7.42 (3.84)5.62 (2.59)2.01 (0.52)
IMSE( β ^ l )correlation1 (0.66)1.04 (0.79)3.91 (5.12)11.83 (4.28)13.35 (5.55)1.2 × 10 3 (1.8 × 10 3 )
DiffMaps0.64 (0.26)0.53 (0.12)0.49 (0.25)9.98 (2.72)13.33 (6.87)1.0 × 10 4 (1.4 × 10 4 )
euclidean0.75 (0.44)0.65 (0.29)0.49 (0.27)11.11 (3.72)14.43 (8.37)1.4 × 10 4 (1.8 × 10 4 )
Isomap0.55 (0.14)0.52 (0.08)0.12 (0.06)9.17 (2.4)8.5 (4.8)4.47 (0.21)
kPCA0.8 (0.45)1.36 (0.85)12.35 (14.86)13.88 (5.08)17.77 (9.86)1.1 × 10 4 (1.3 × 10 4 )
LaplacianEig0.52 (0.1)0.52 (0.05)0.16 (0.07)8.46 (2.58)5.82 (0.84)4.71 (0.22)
LLE0.55 (0.12)0.52 (0.07)0.12 (0.06)7.99 (2.91)5.61 (0.7)4.45 (0.19)
tSNE0.78 (0.29)0.77 (0.29)0.64 (0.4)9.53 (2.78)9.52 (3.25)10.75 (2.85)
none2.17 (0.99)2.57 (1.12)23.82 (29.42)22.89 (8.52)28.79 (16.84)8.4 × 10 3 (1.1 × 10 4 )
Table 2. Case study: ORs computed in three subintervals of I i [ 0 , 1 ] , i = 1 , 2 , 3 , according to the sign changes of the coefficients functions estimated with Isomap/LLE-stringing.
IsomapLLE
i I i OR i I i OR i
1 [ 0 , 0.34 ) 3.86 [ 0 , 0.21 ) 0.25
2 ( 0.34 , 0.85 ) 0.36 ( 0.21 , 0.77 ) 12.82
3 ( 0.85 , 1 ] 1.36 ( 0.77 , 1 ] 0.31
Publisher’s Note: MDPI stays neutral with regard to jurisdictional claims in published maps and institutional affiliations.

