
Optimization of Nano-Additive Characteristics to Improve the Efficiency of a Shell and Tube Thermal Energy Storage System Using a Hybrid Procedure: DOE, ANN, MCDM, MOO, and CFD Modeling


Abstract
:1. Introduction
1.1. The Importance of TES
1.2. LHTES Units
1.3. PCM Enhancement Techniques
- Applying a magnetic field [42];
1.4. Shell and Tube LHTES Systems
1.5. Research Contribution
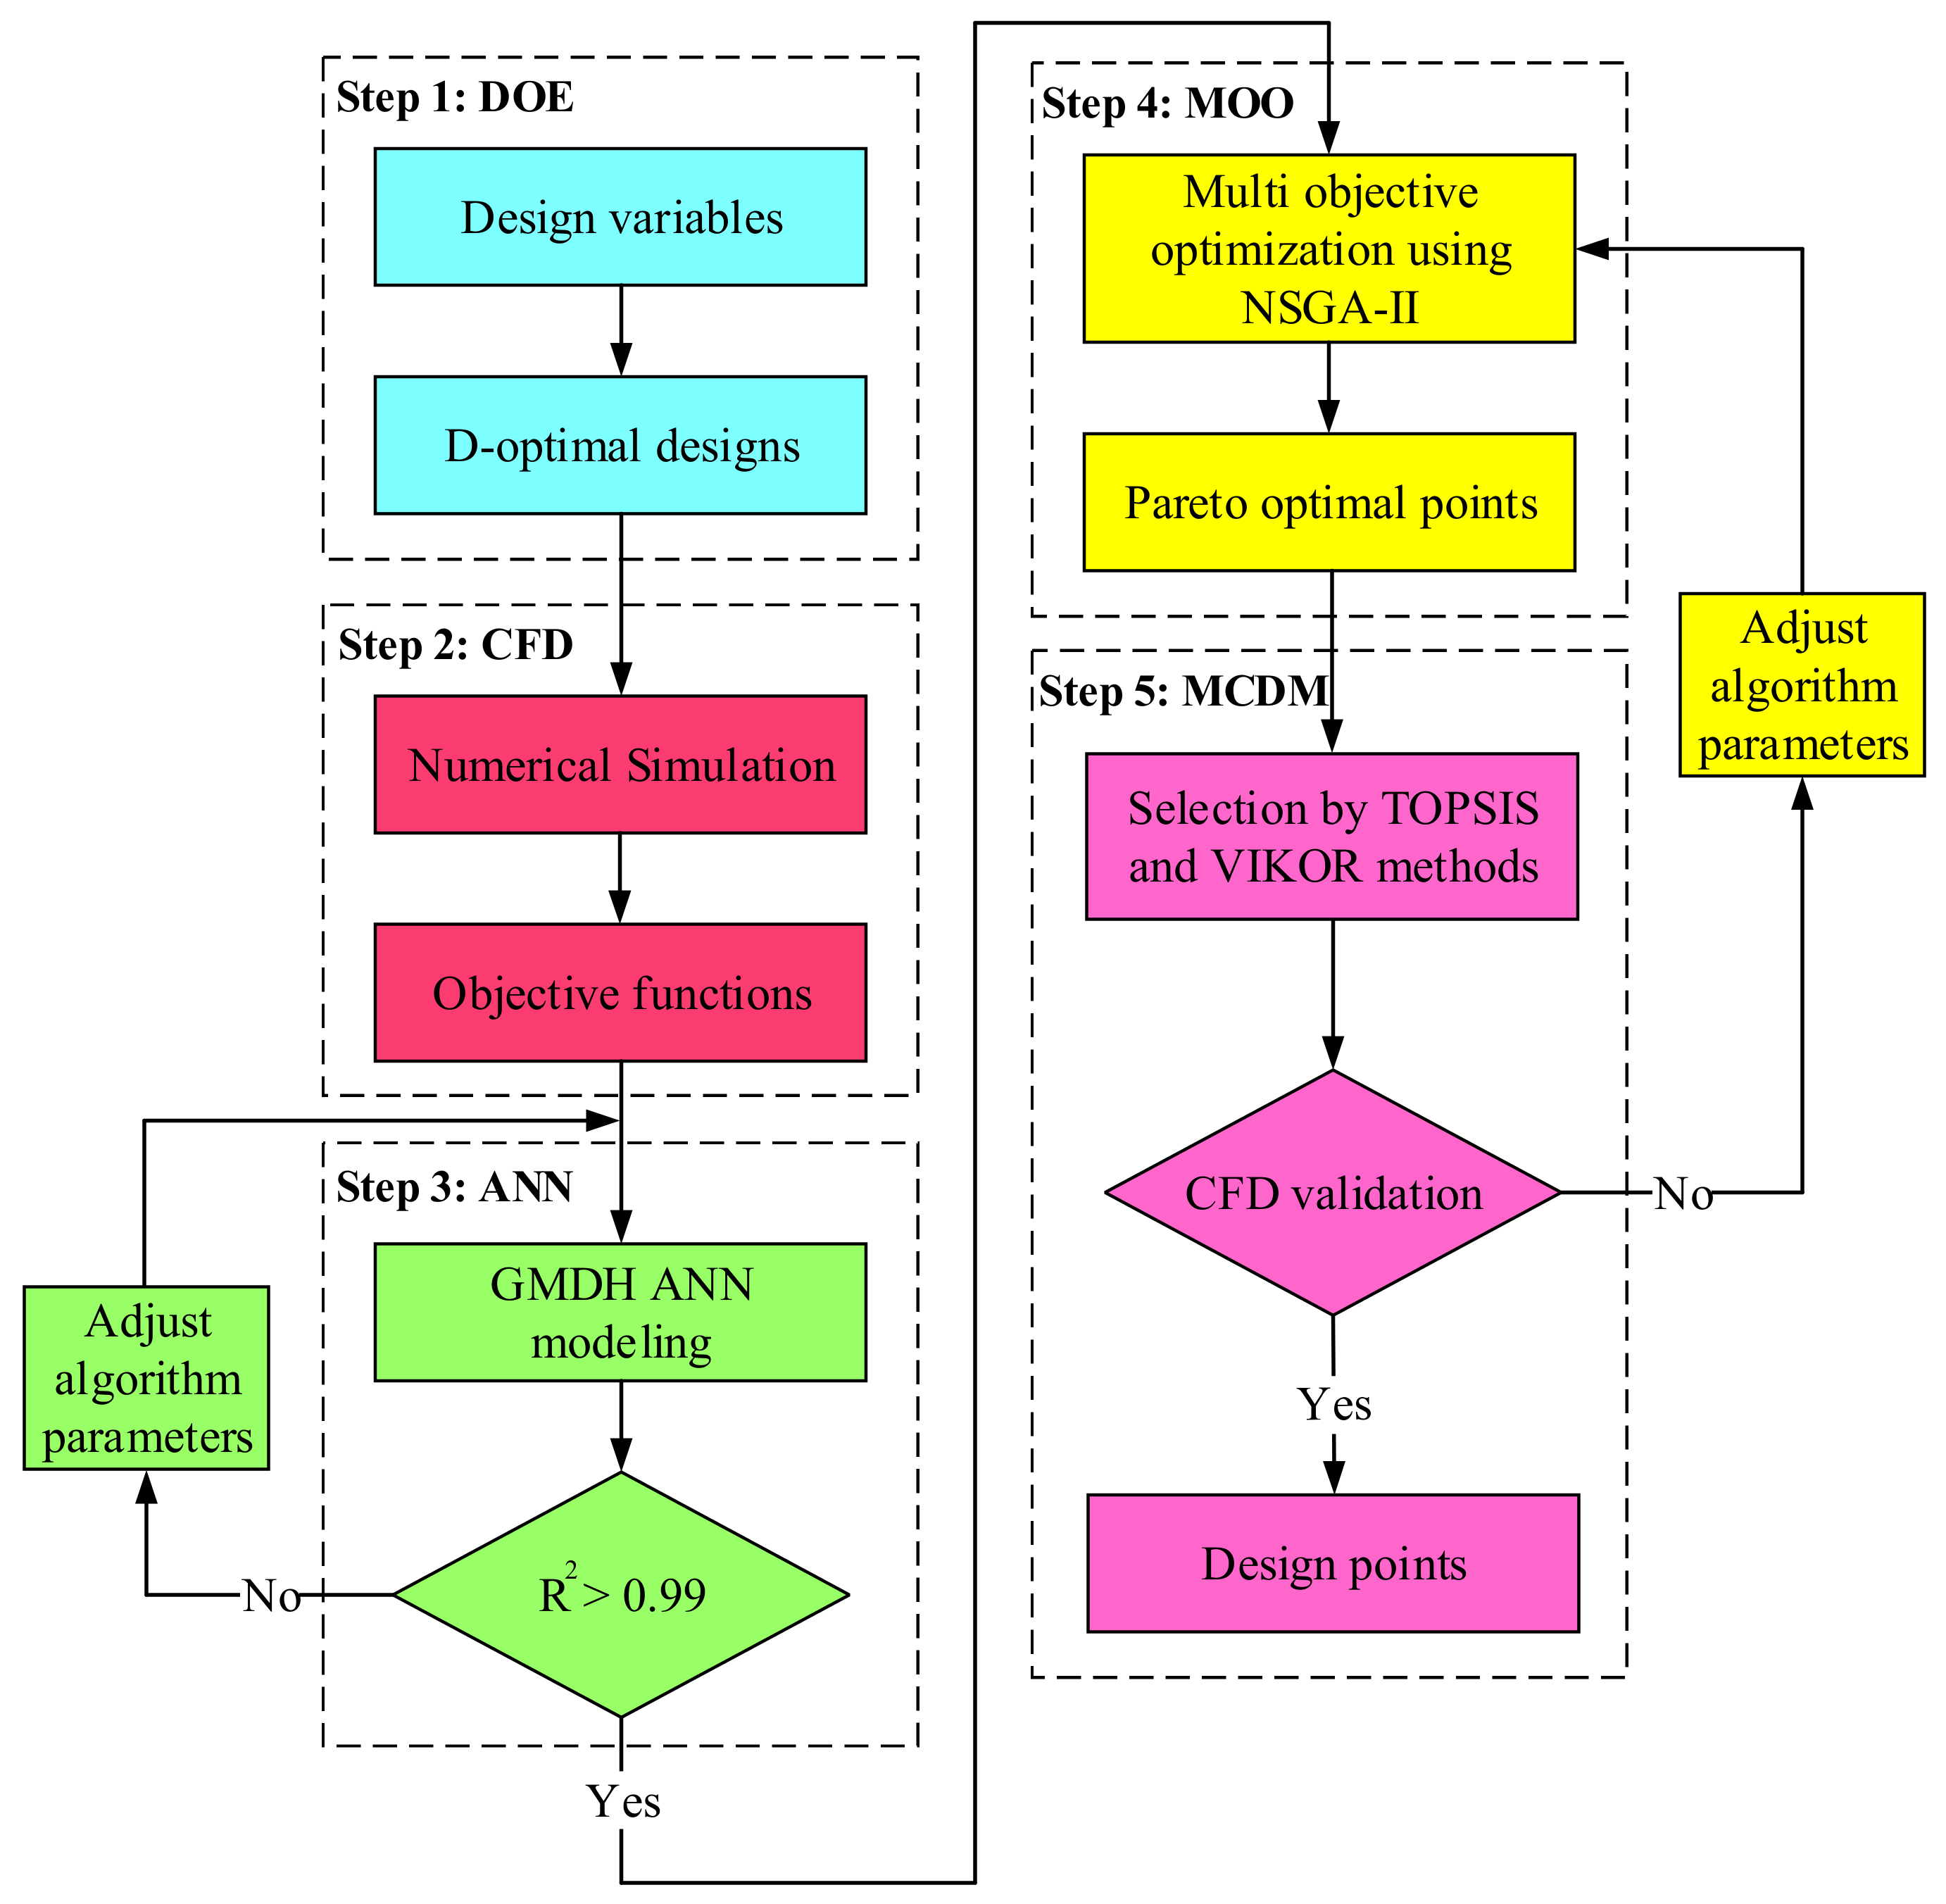
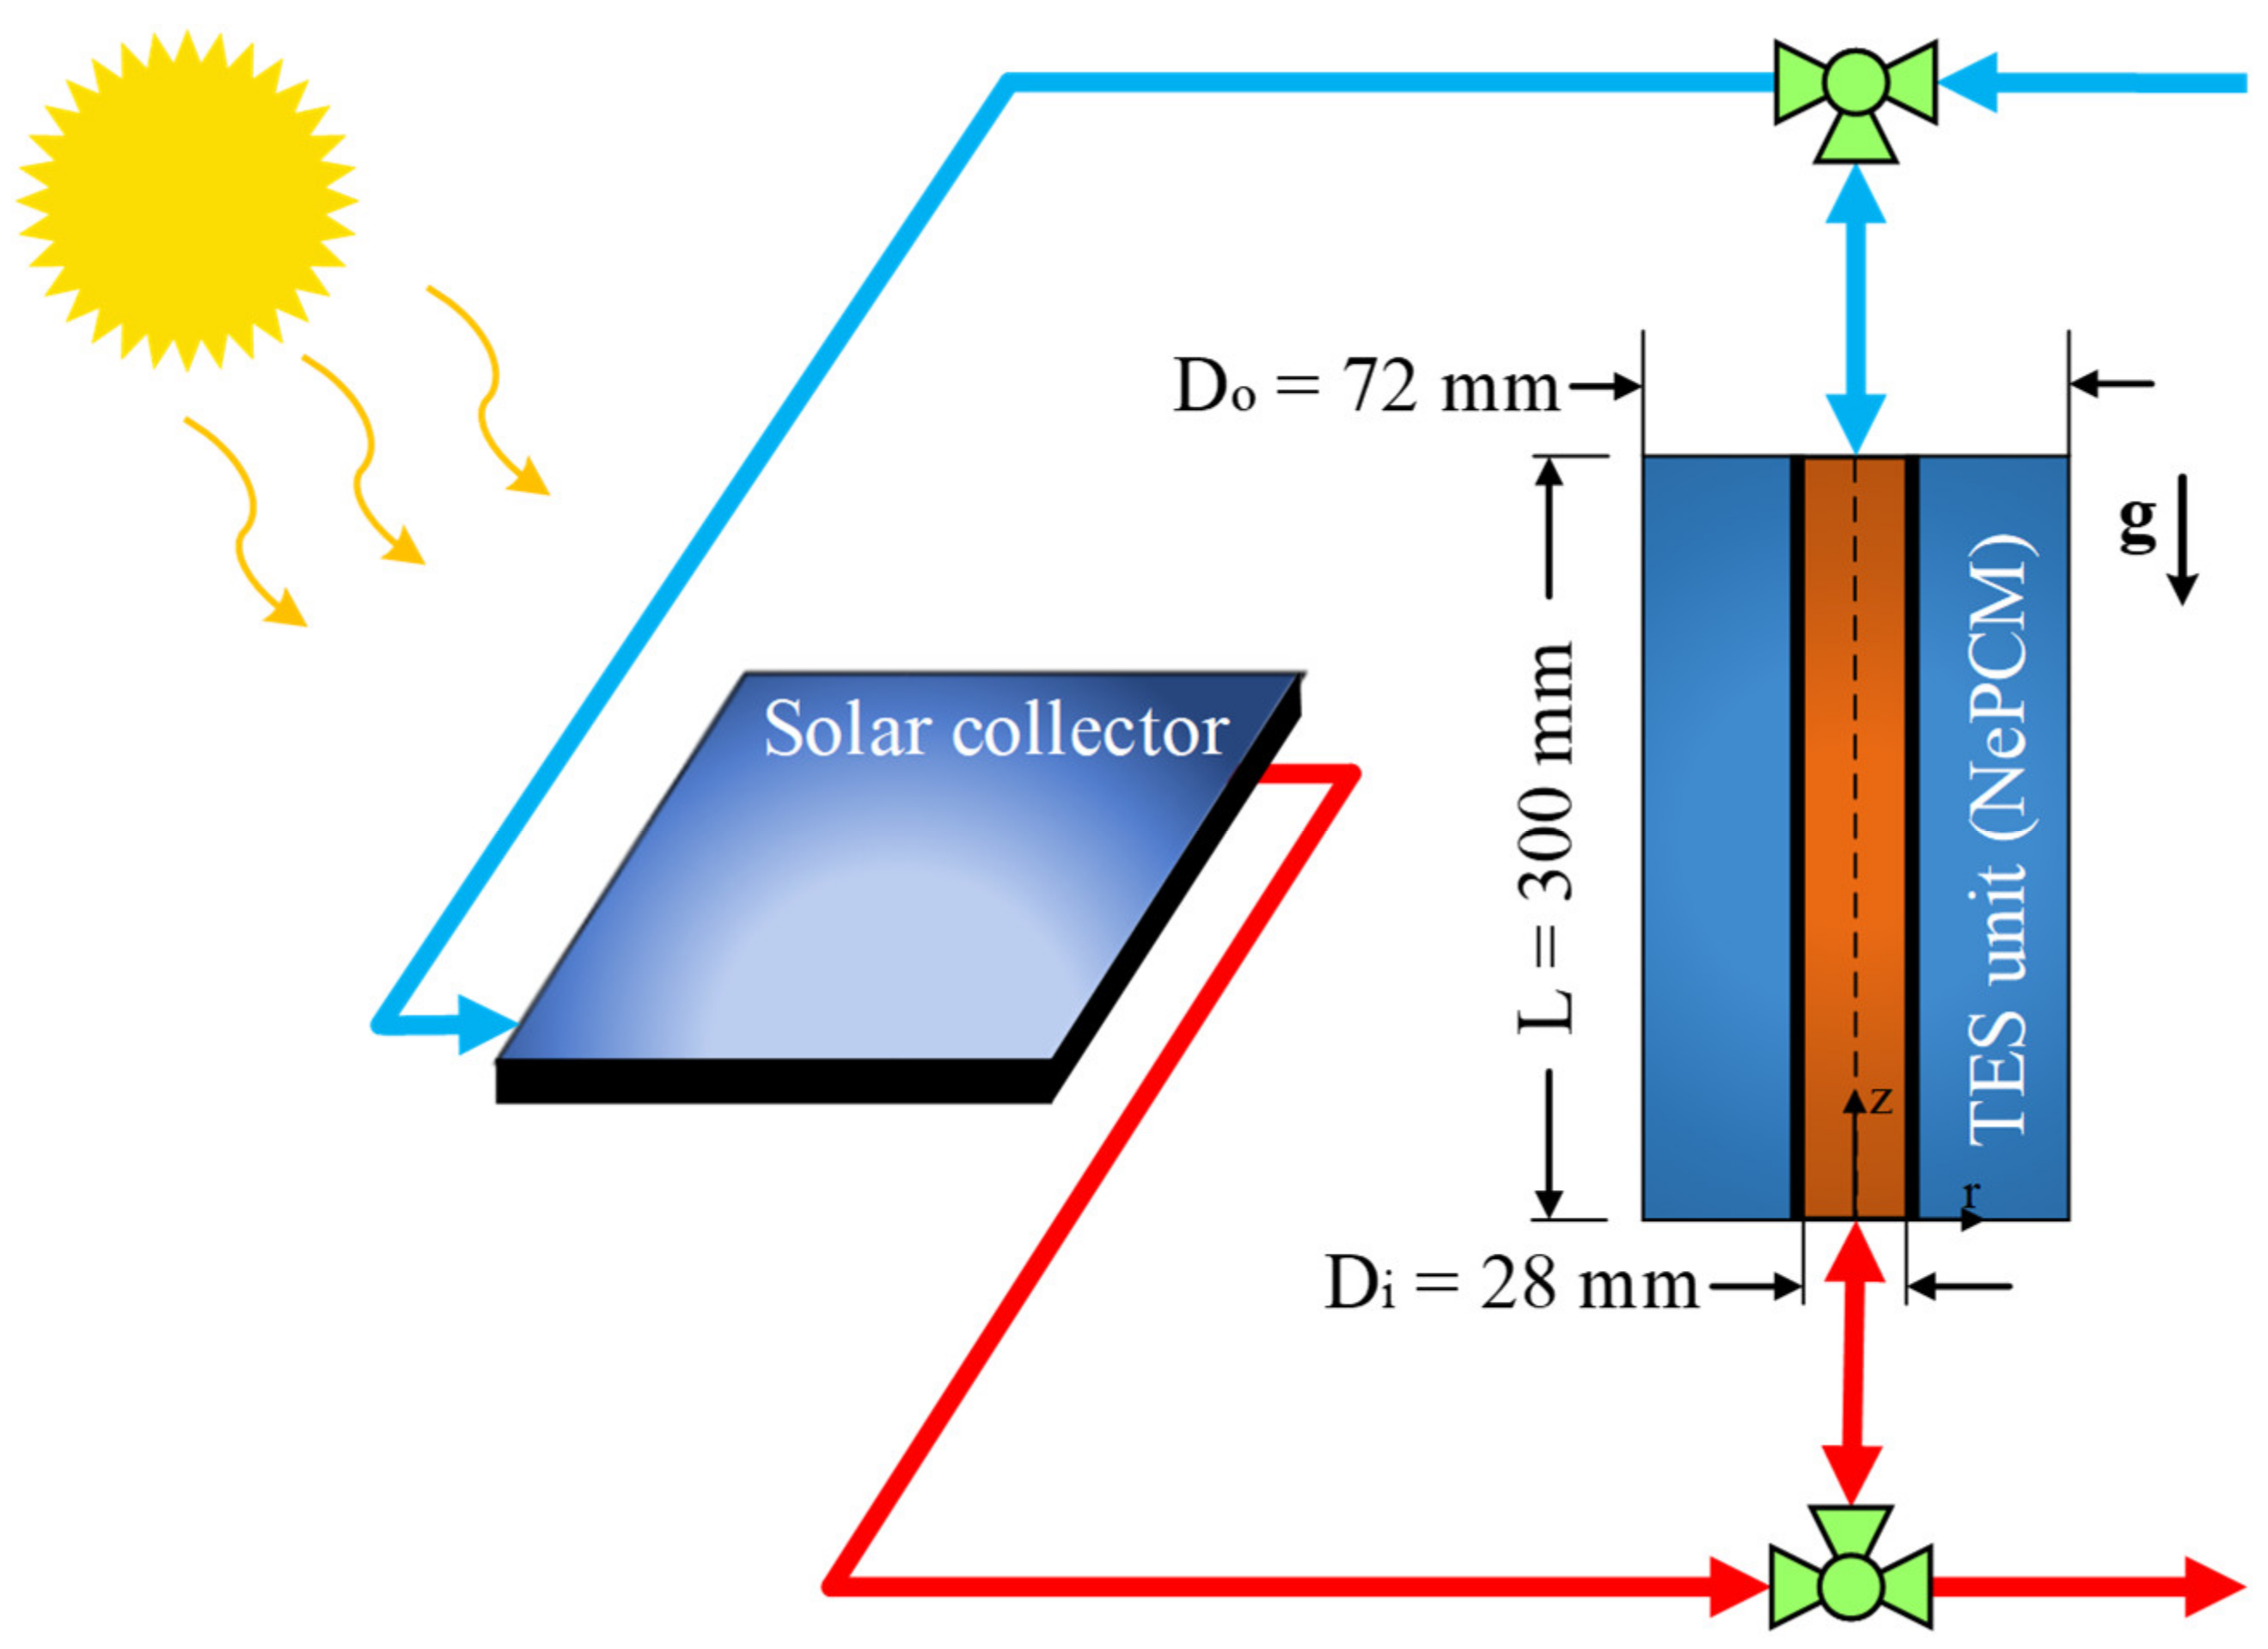
2. Problem Description and Optimization Variables
3. CFD Modeling
3.1. Assumptions and Boundary Conditions
- It is assumed that a fully developed turbulent HTF flow enters the LHTES system. The following equation provides an estimate of the entrance length required to create a fully developed turbulence flow [86]:
- The inner tube has a wall thickness of 2 mm and is made of aluminum.
- The thermophysical properties of the PCM are temperature-dependent.
- The thermophysical properties of the HTF are considered constant.
- It is assumed that the nano-additives are dispersed homogeneously in the PCM.
- The liquid NePCM flows in the LHTES unit are assumed to be Newtonian, steady-state, incompressible, and laminar flows.
- The Reynolds number and inlet temperature of HTF are set to be 4500 and 363.15 K, respectively.
- The outer surfaces of the LHTES system are considered perfectly insulated (adiabatic condition).
- A zero gradient boundary condition (outflow) is considered for the HTF outlet.
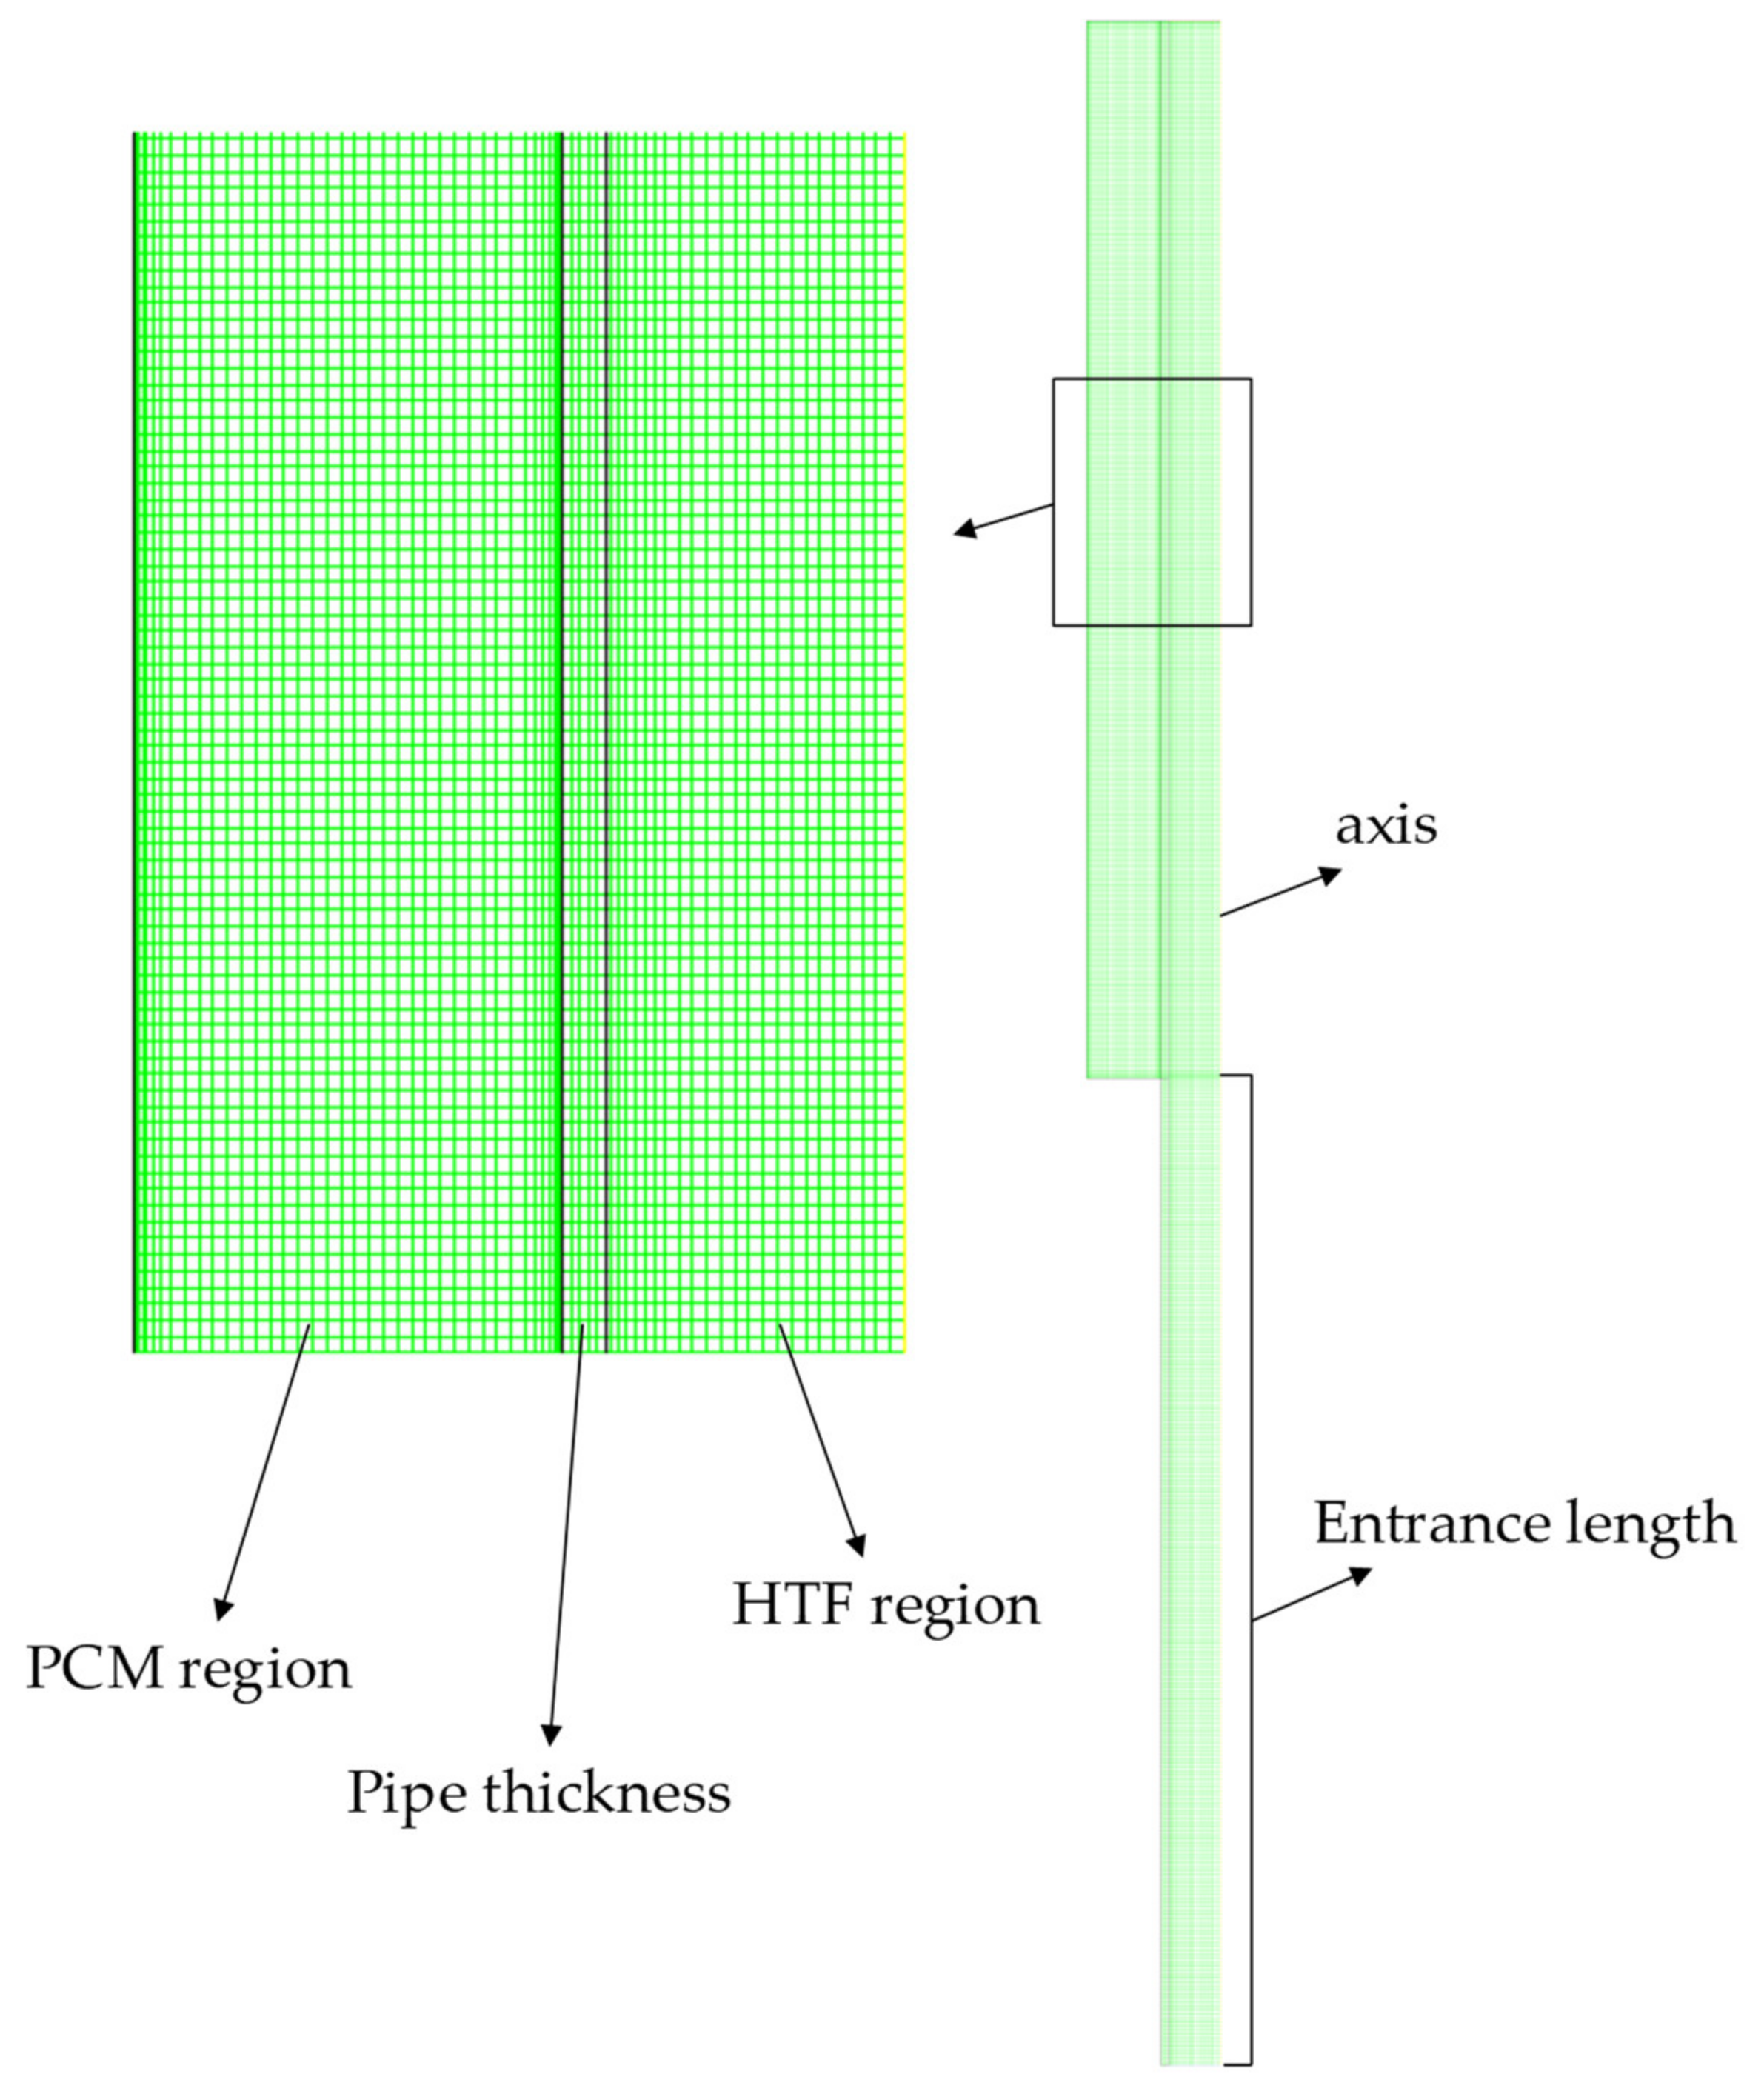
- A 2D axisymmetric modeling is adopted for the simulation of the LHTES system (see Figure 2).
- No-slip condition is assumed at the boundary of the walls.
- The initial temperature of the NePCM is set to be 310.15 K (the NePCM is subcooled).
3.2. Thermophysical Properties of NePCM
3.3. Governing Equations and Numerical Procedure
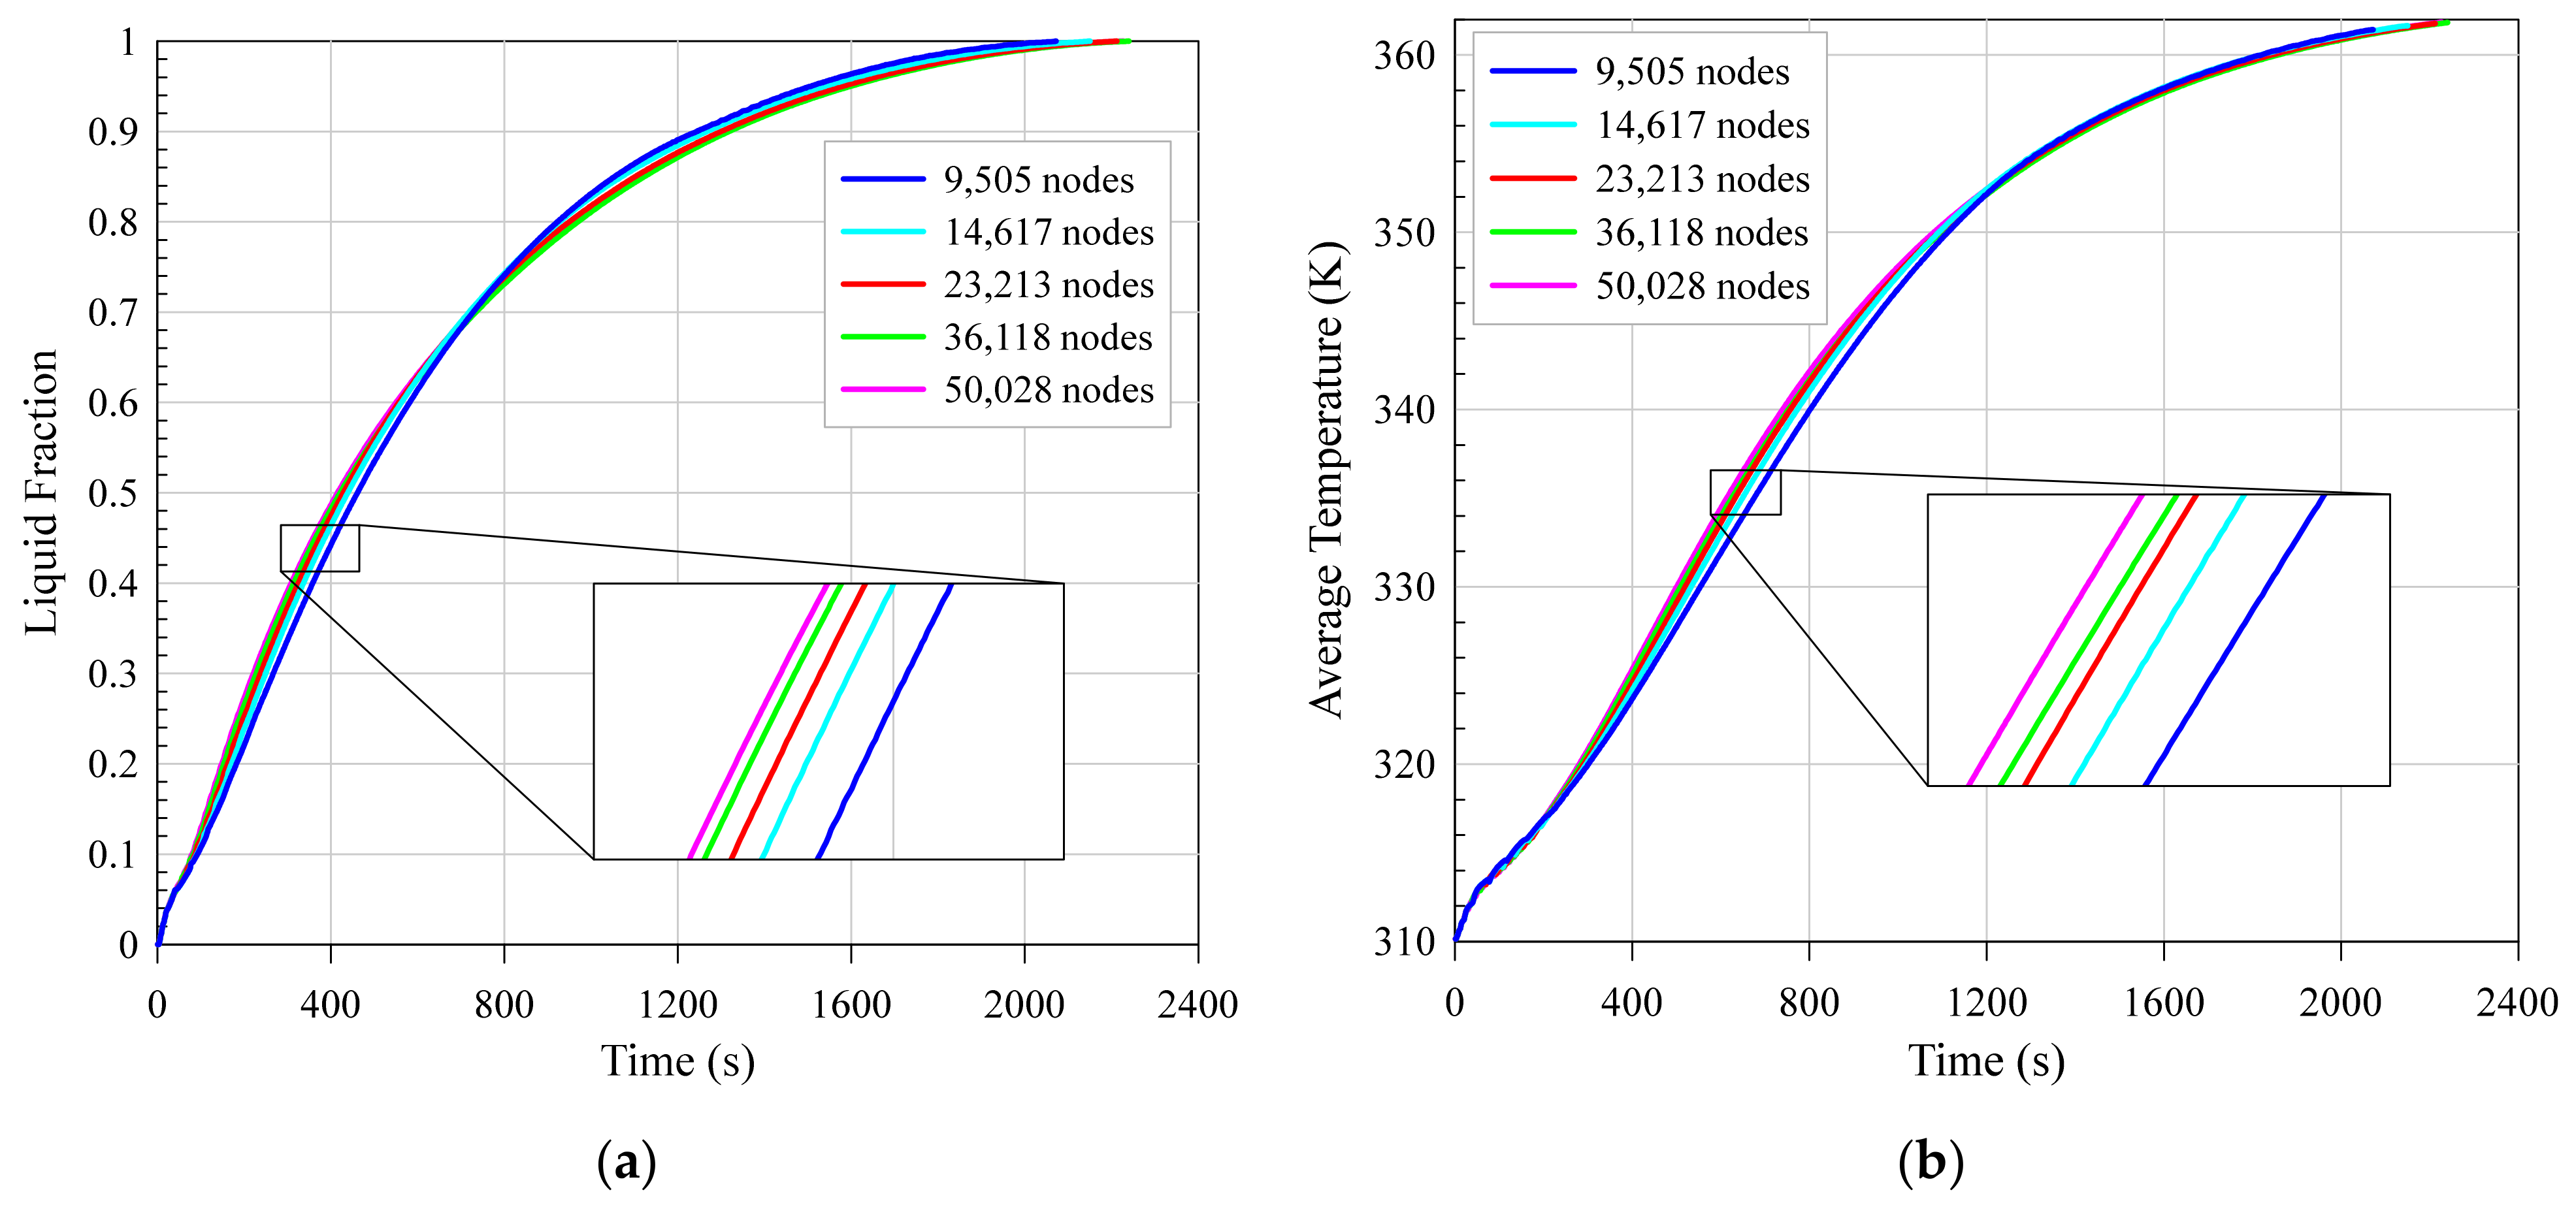
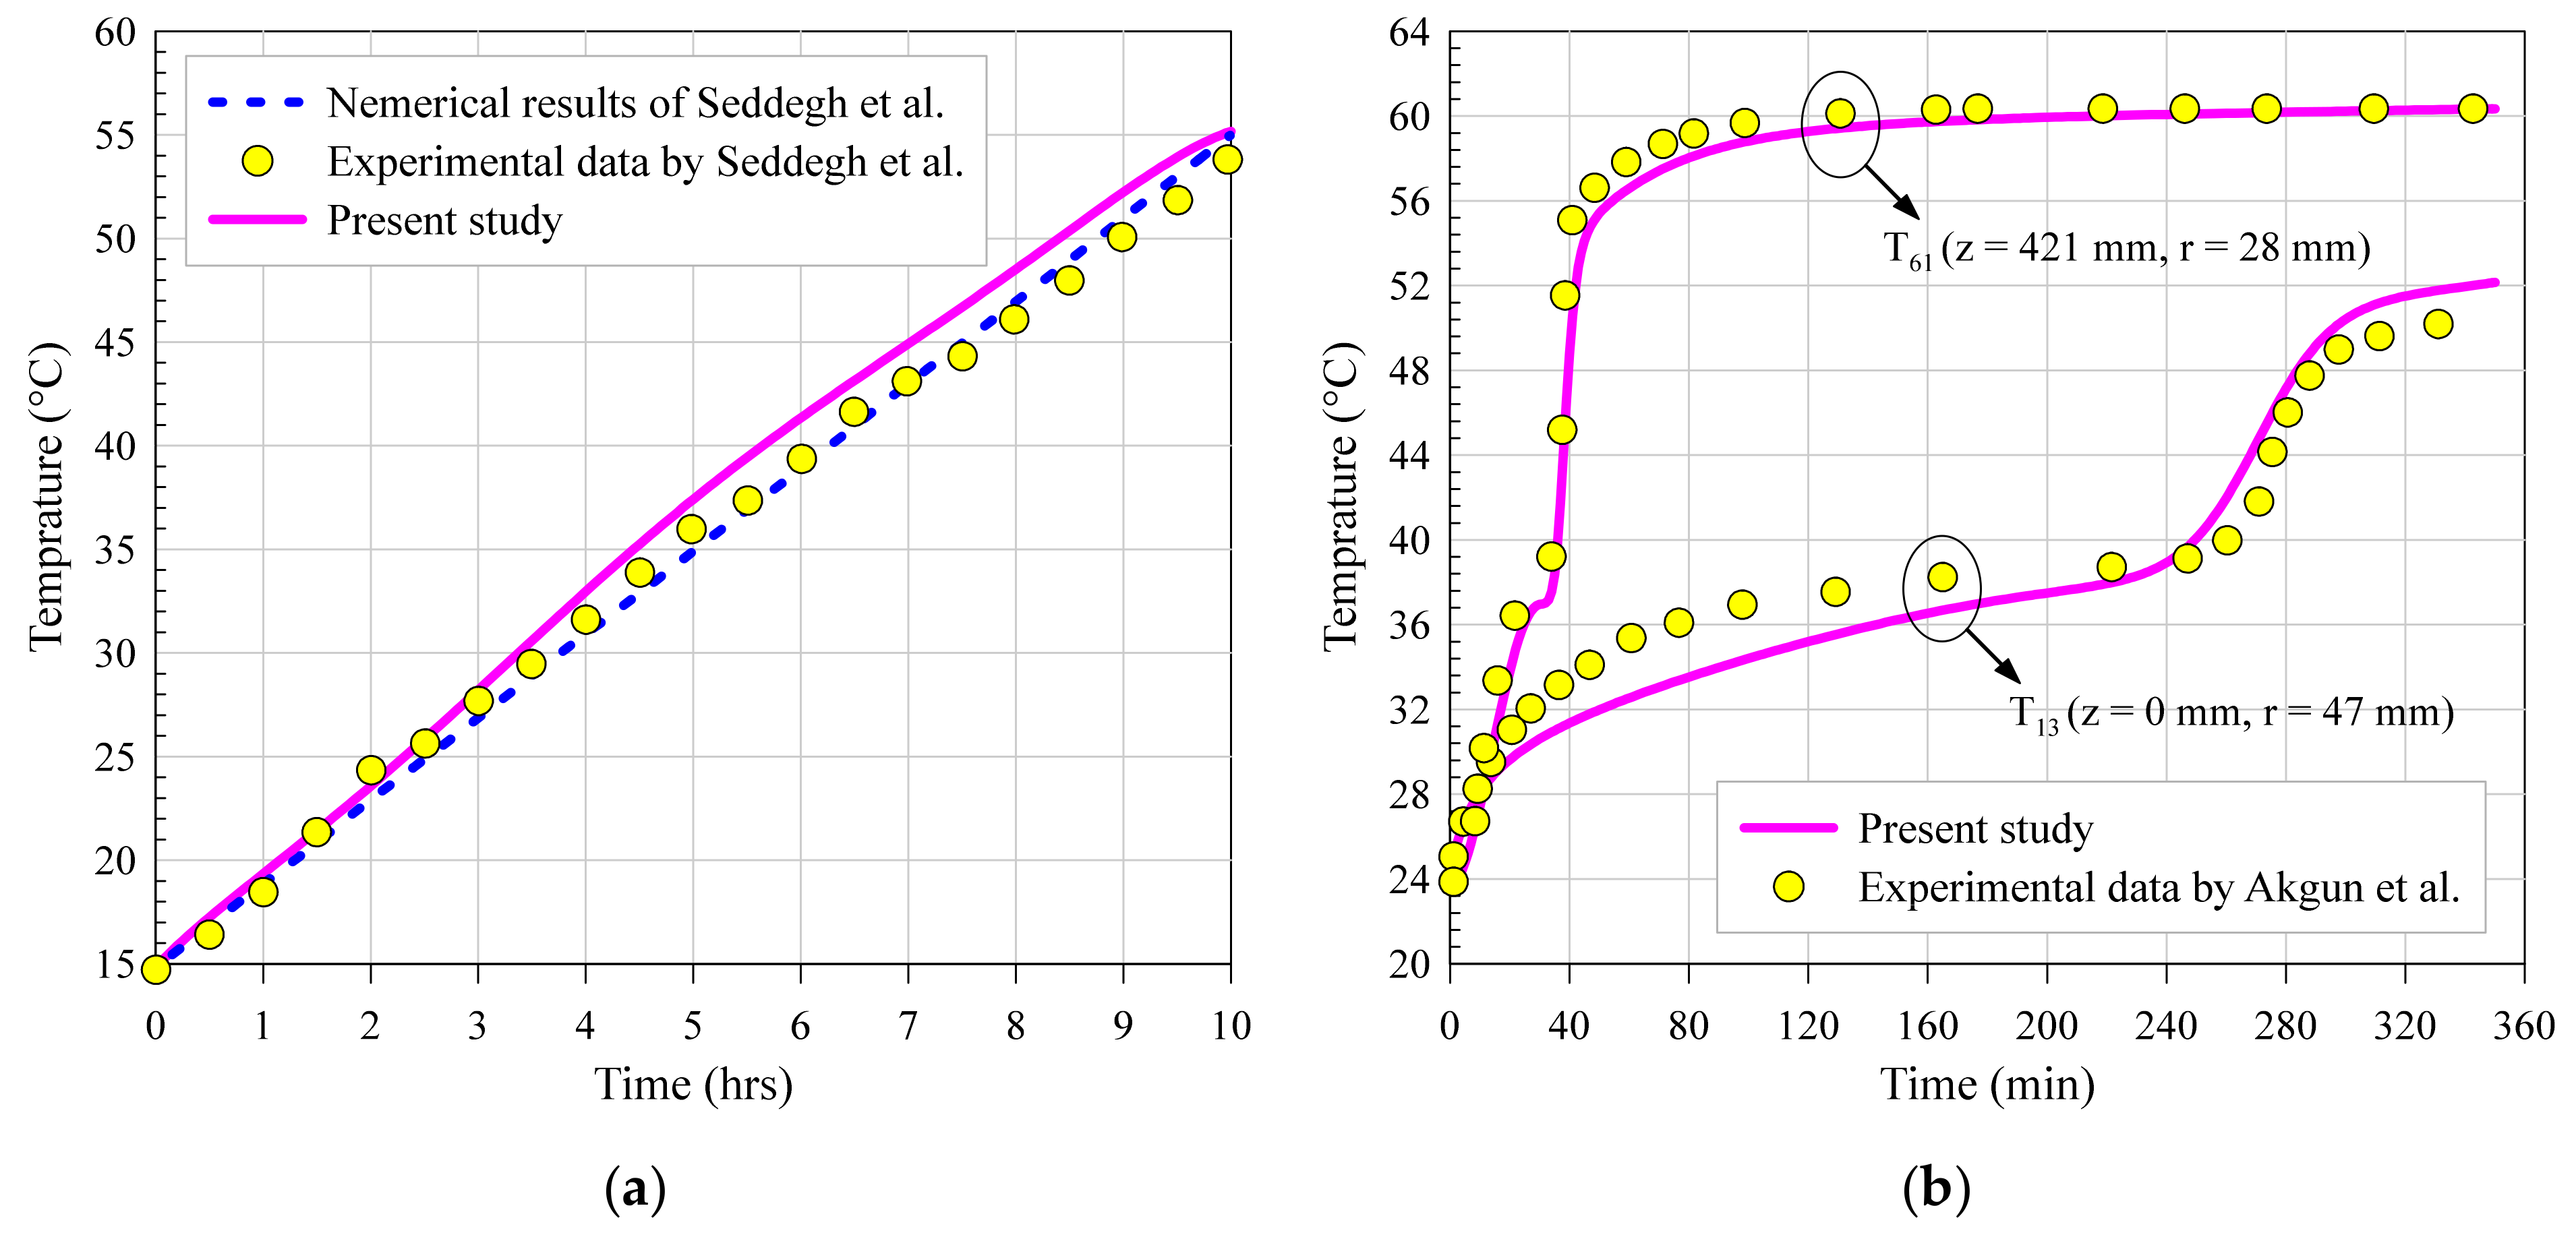
3.4. Grid Sensitivity Study and CFD Validation
4. Objective Functions
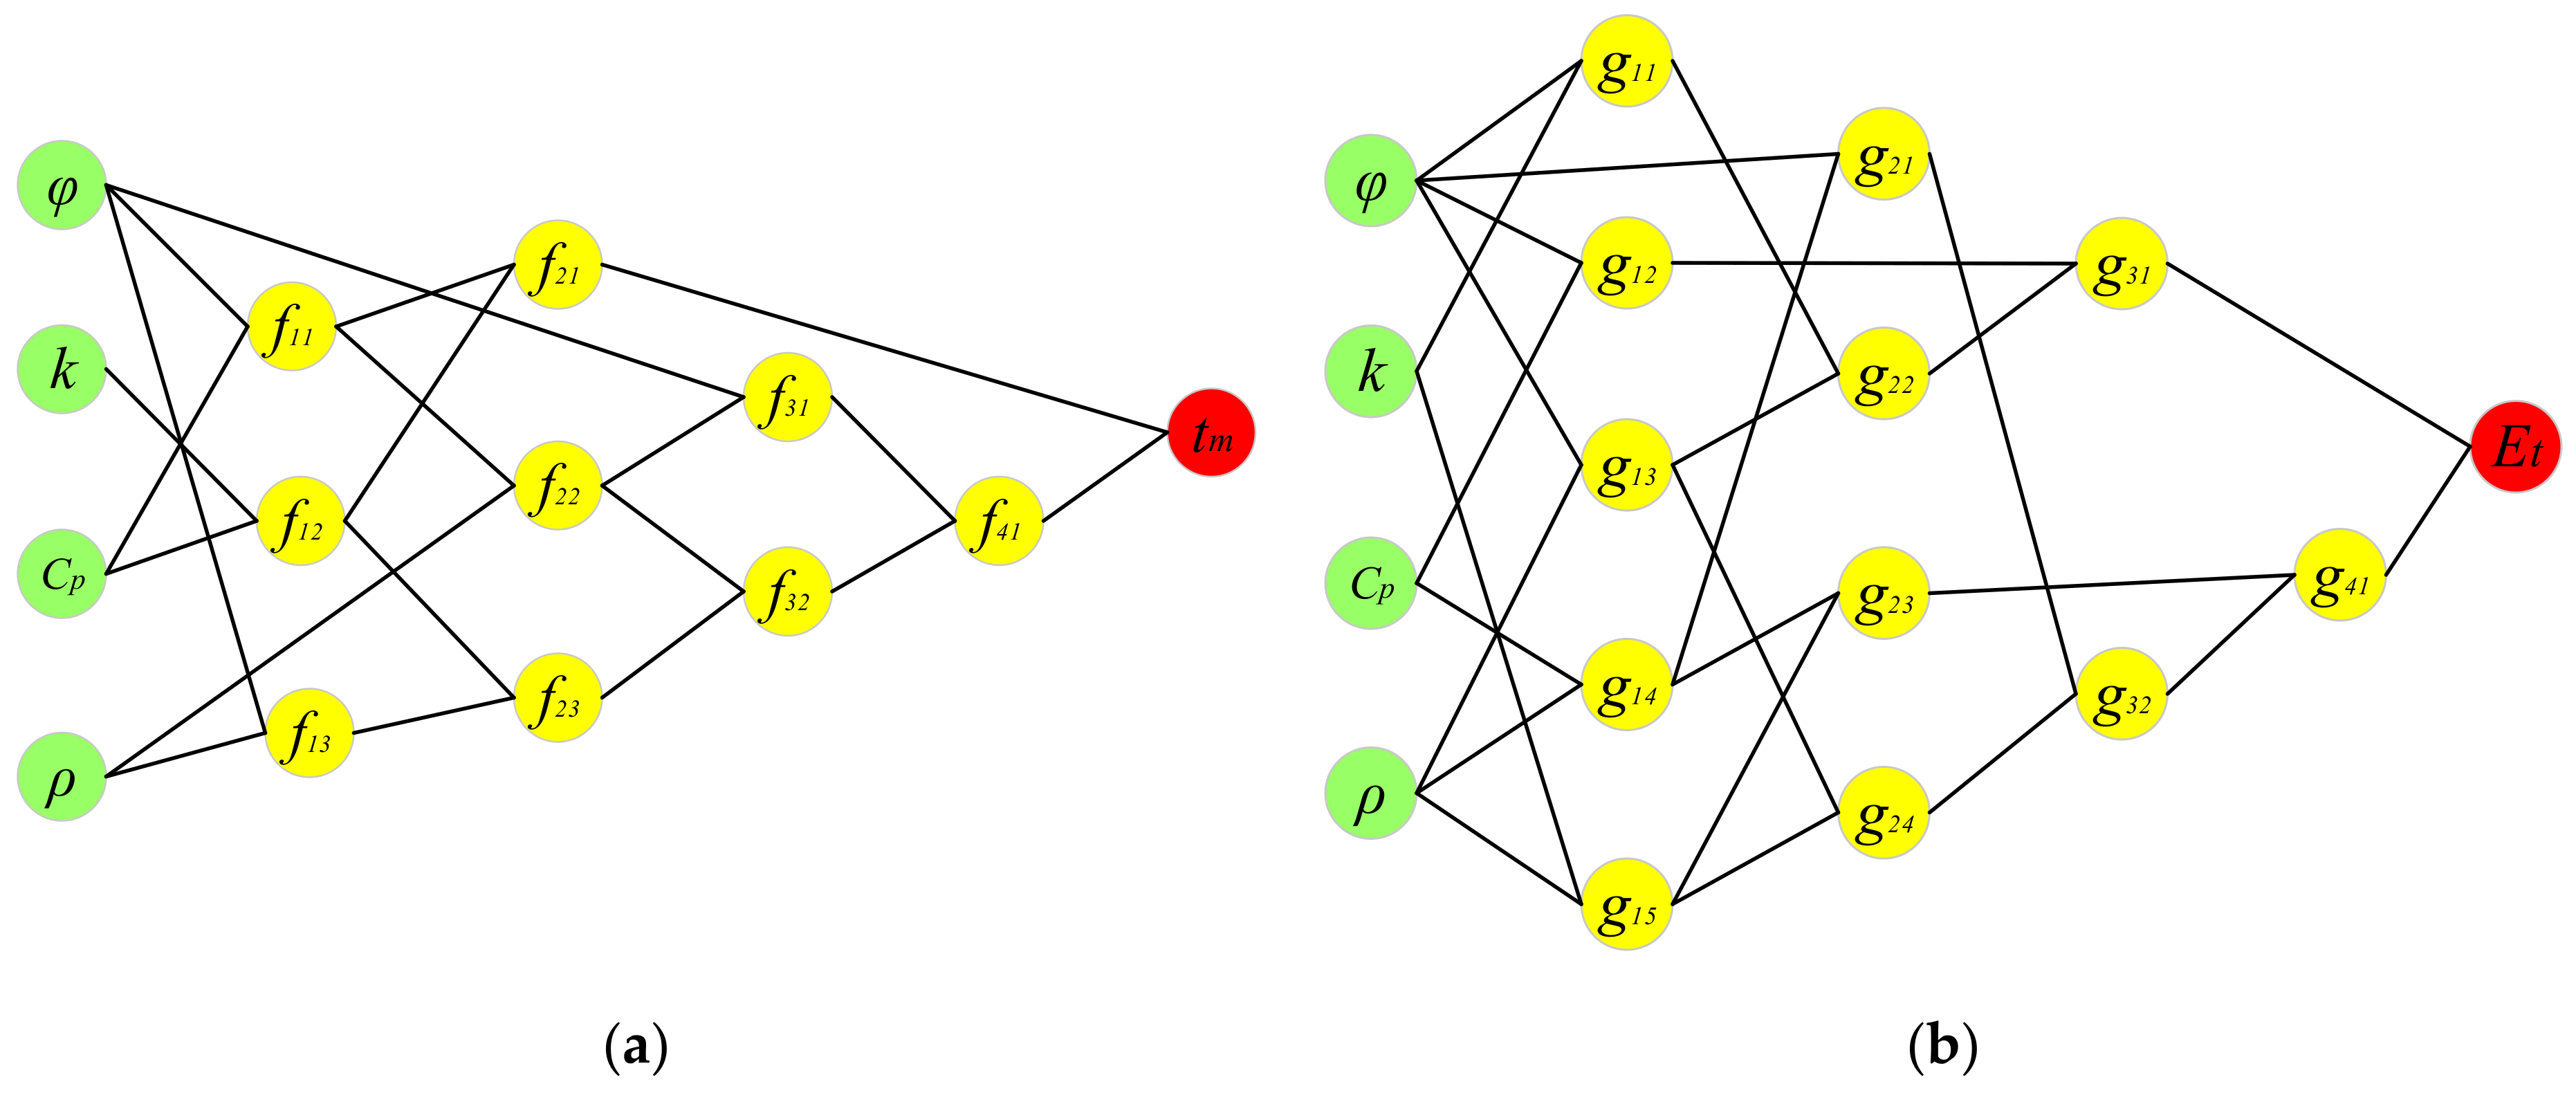
5. GMDH-Type Neural Network Modeling
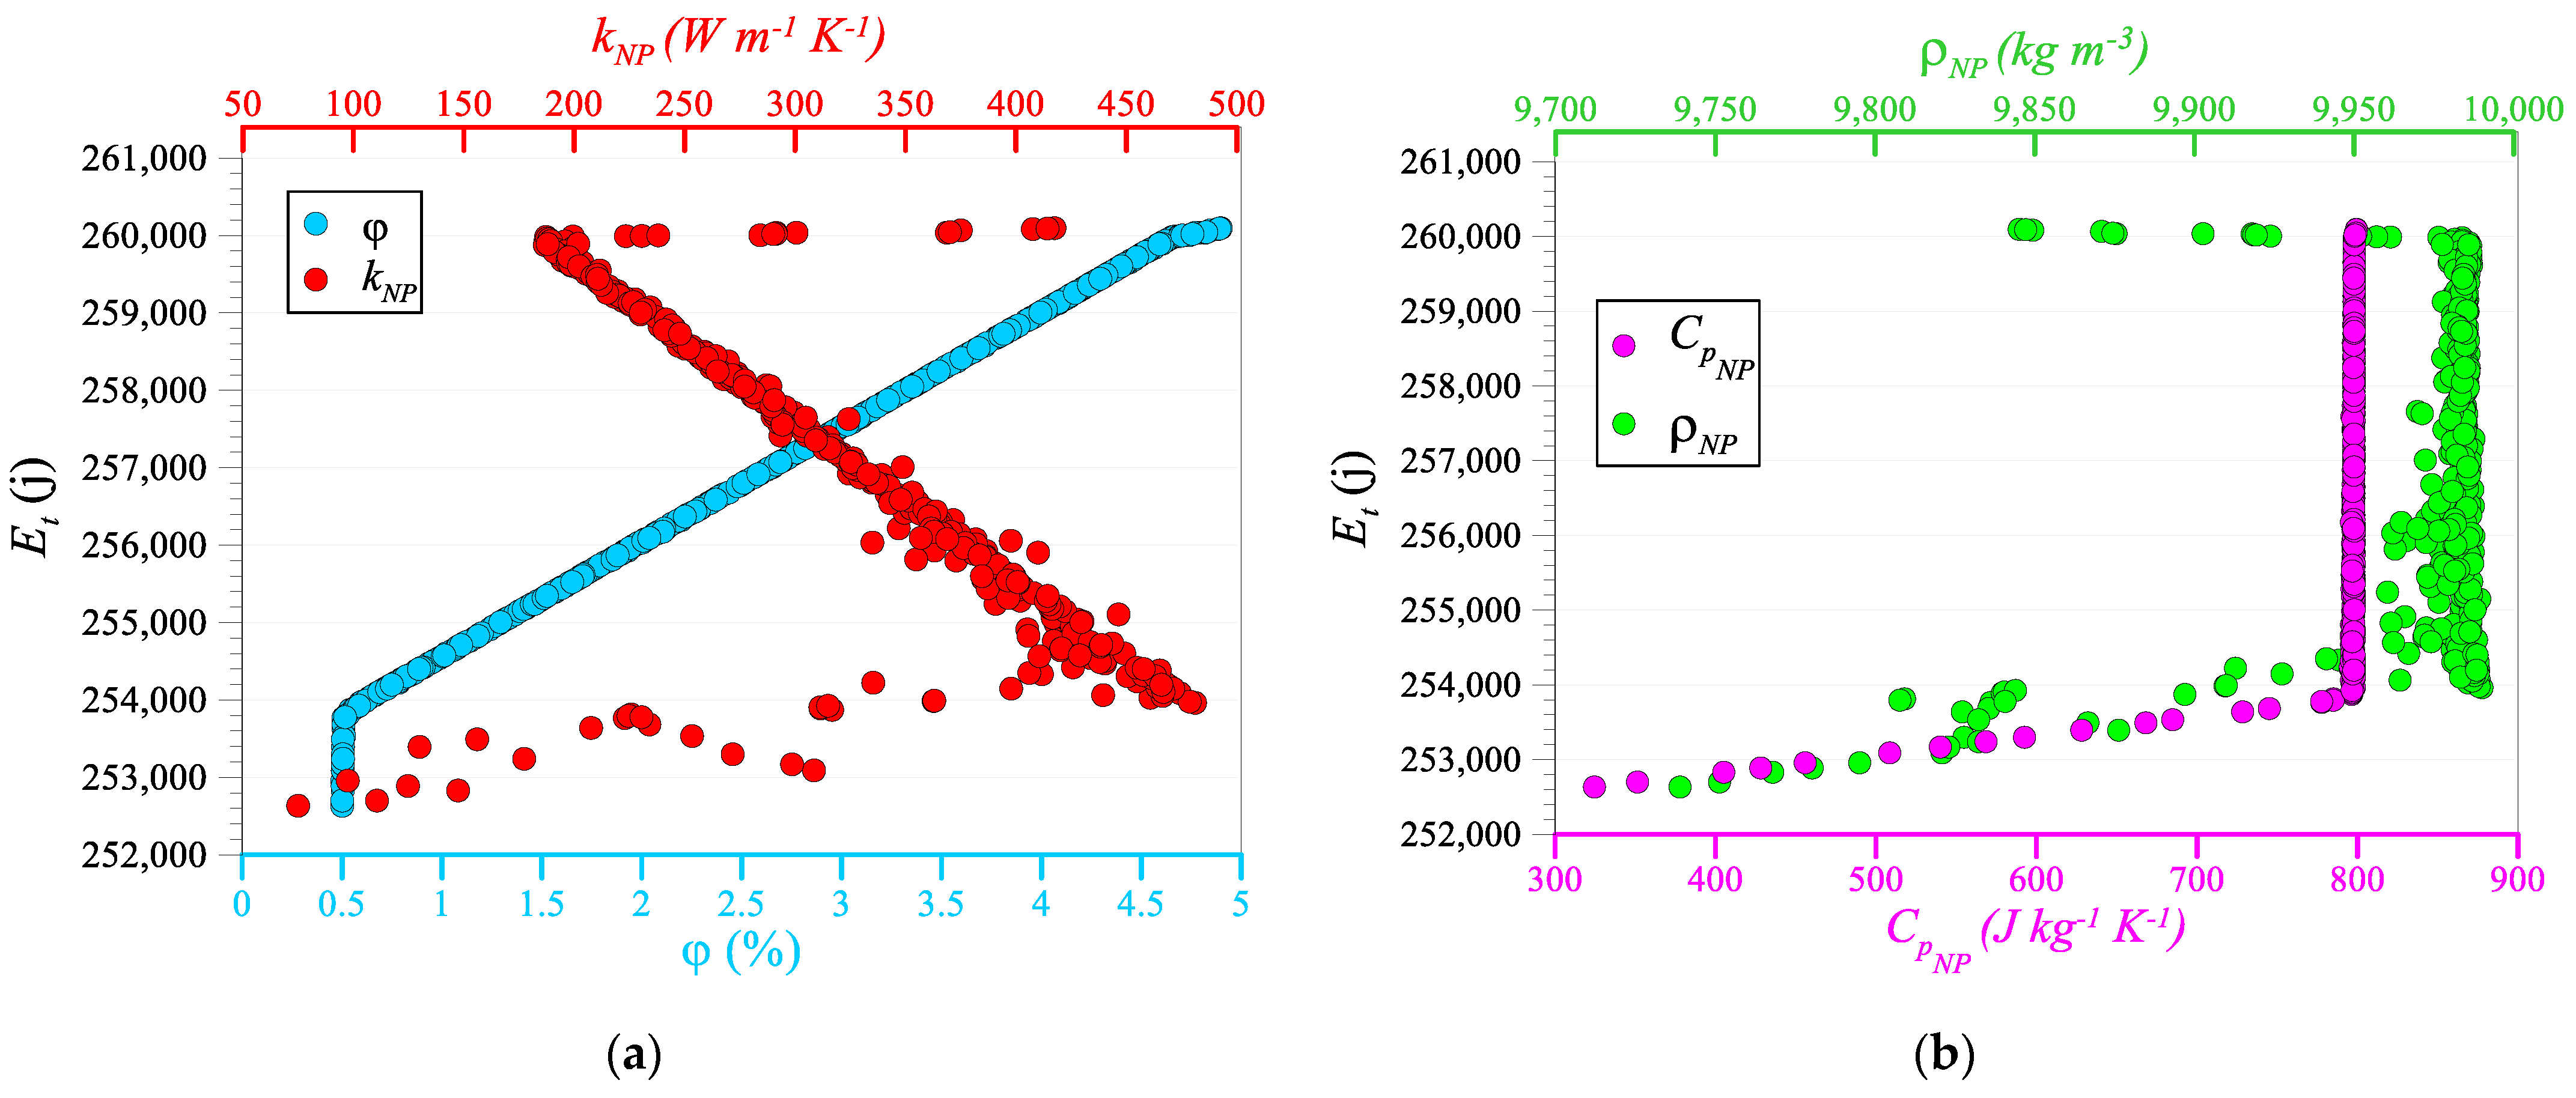
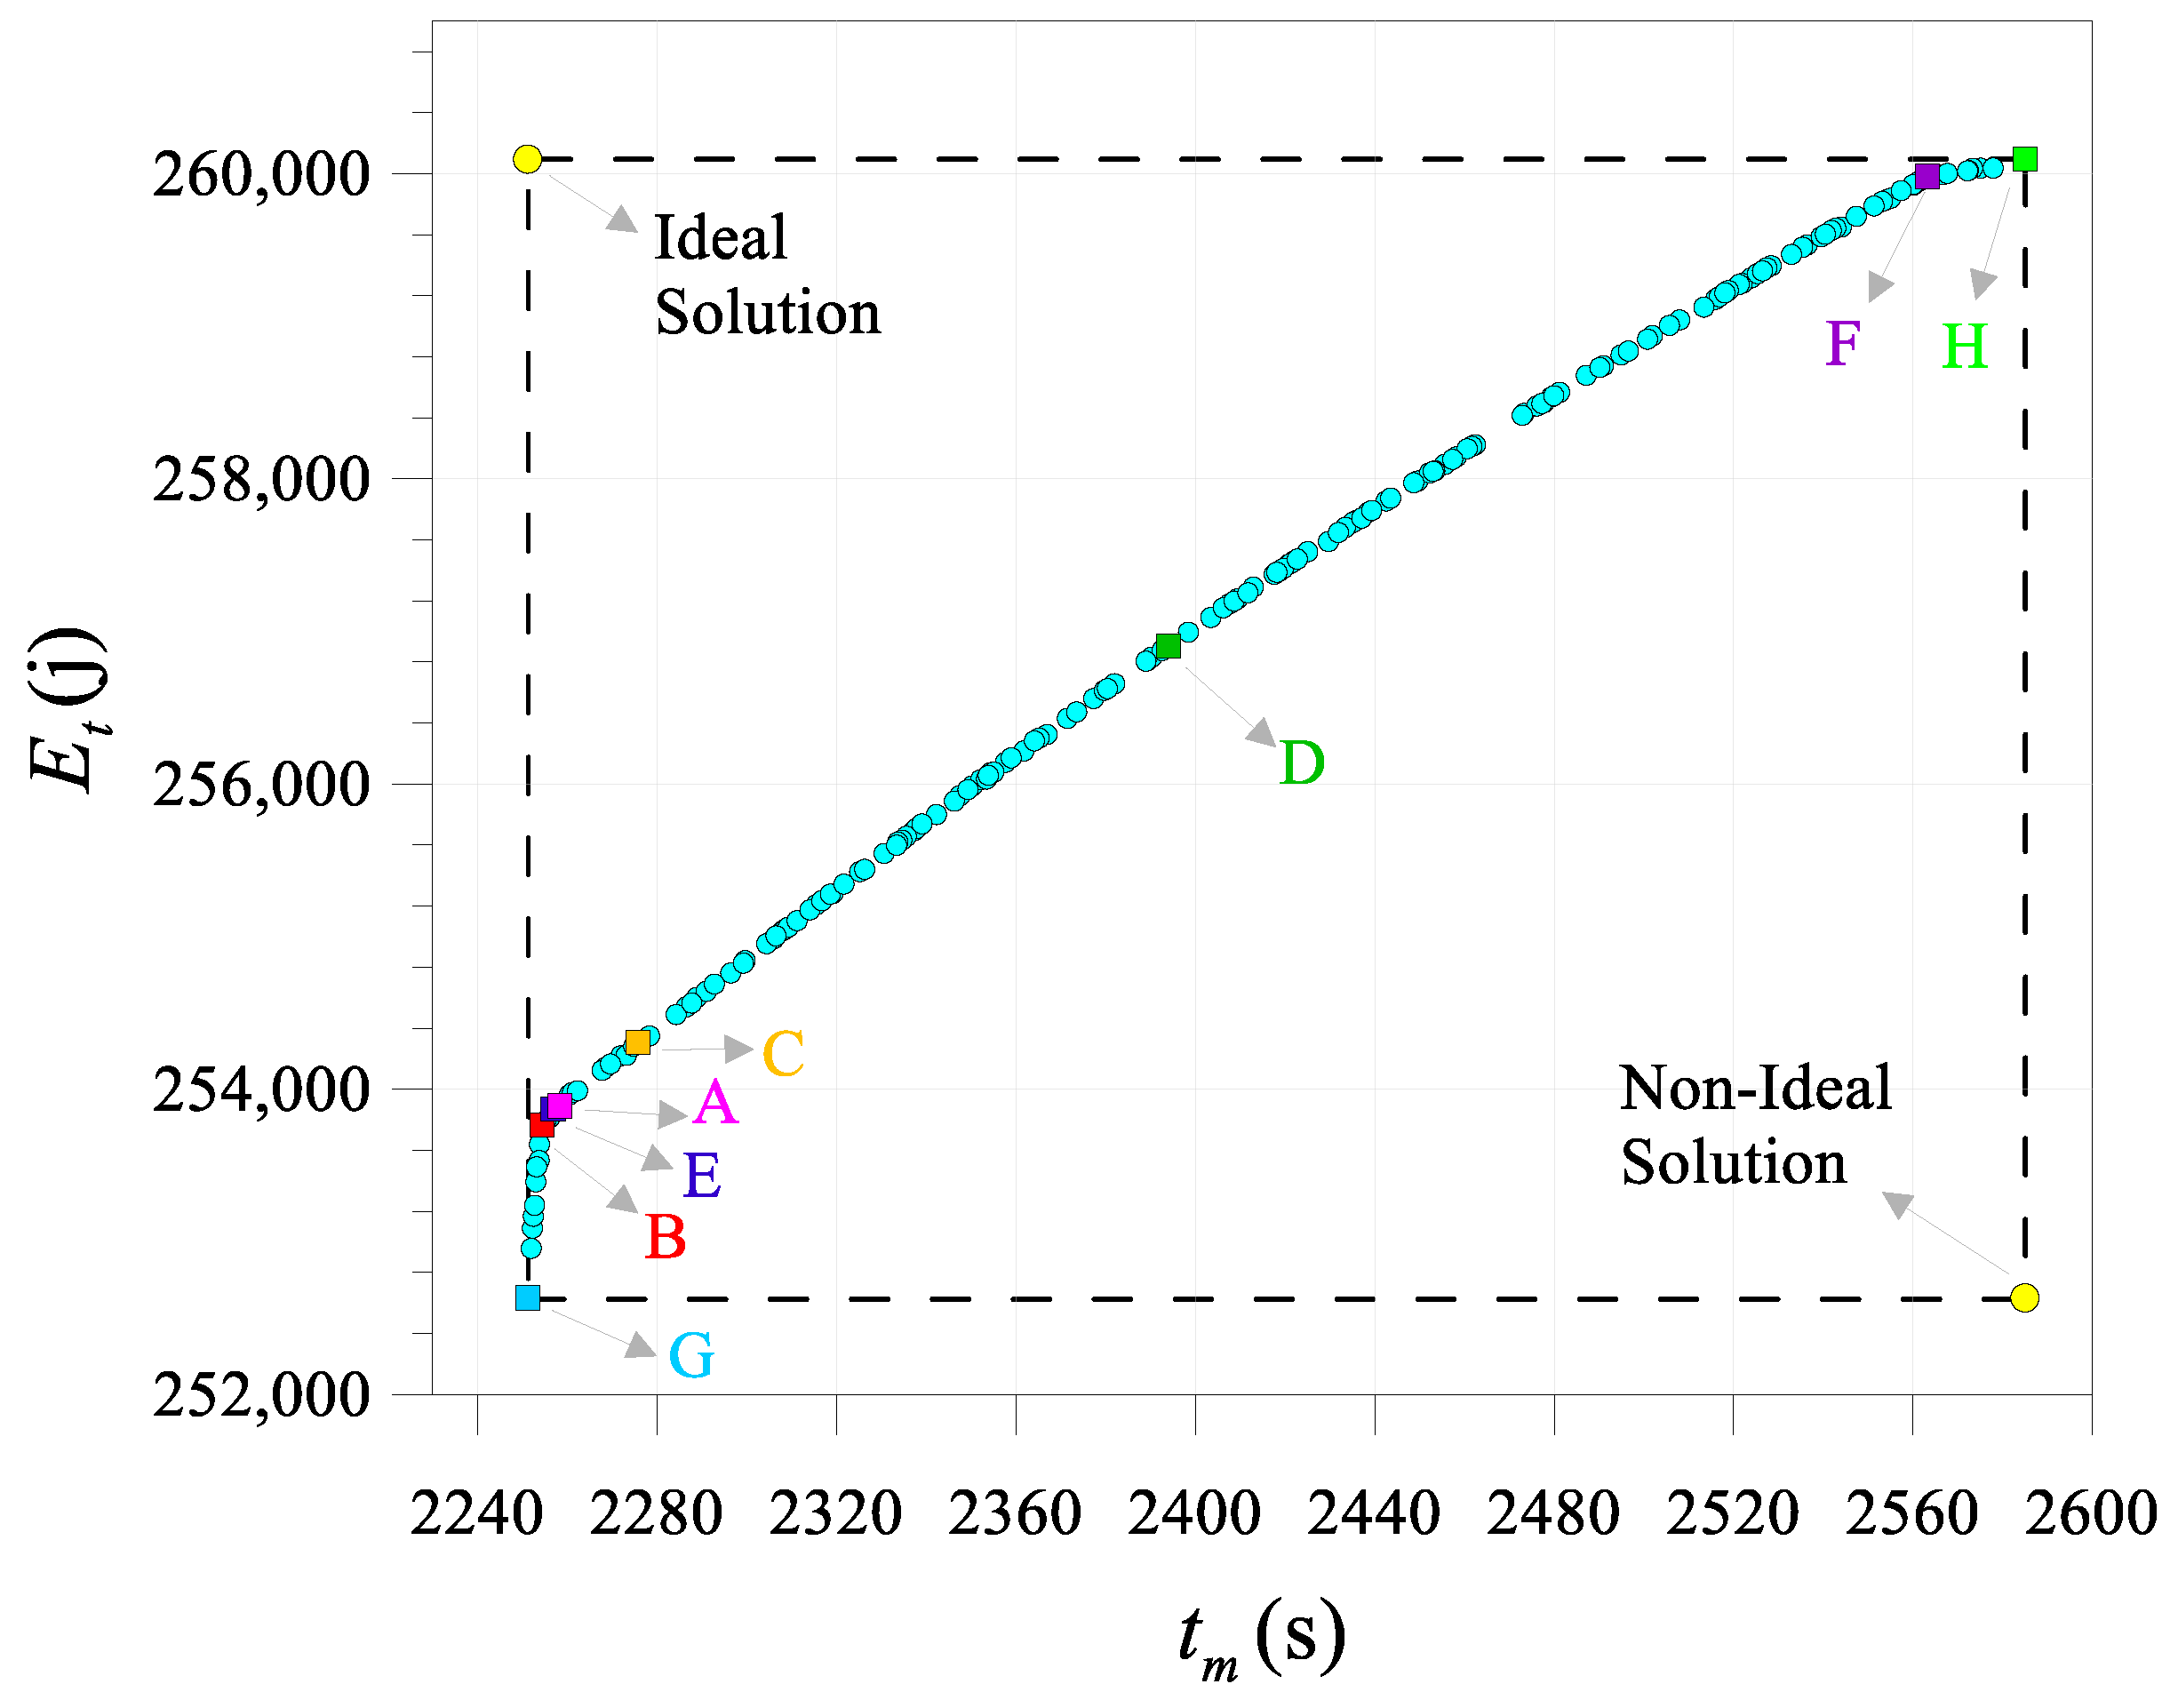
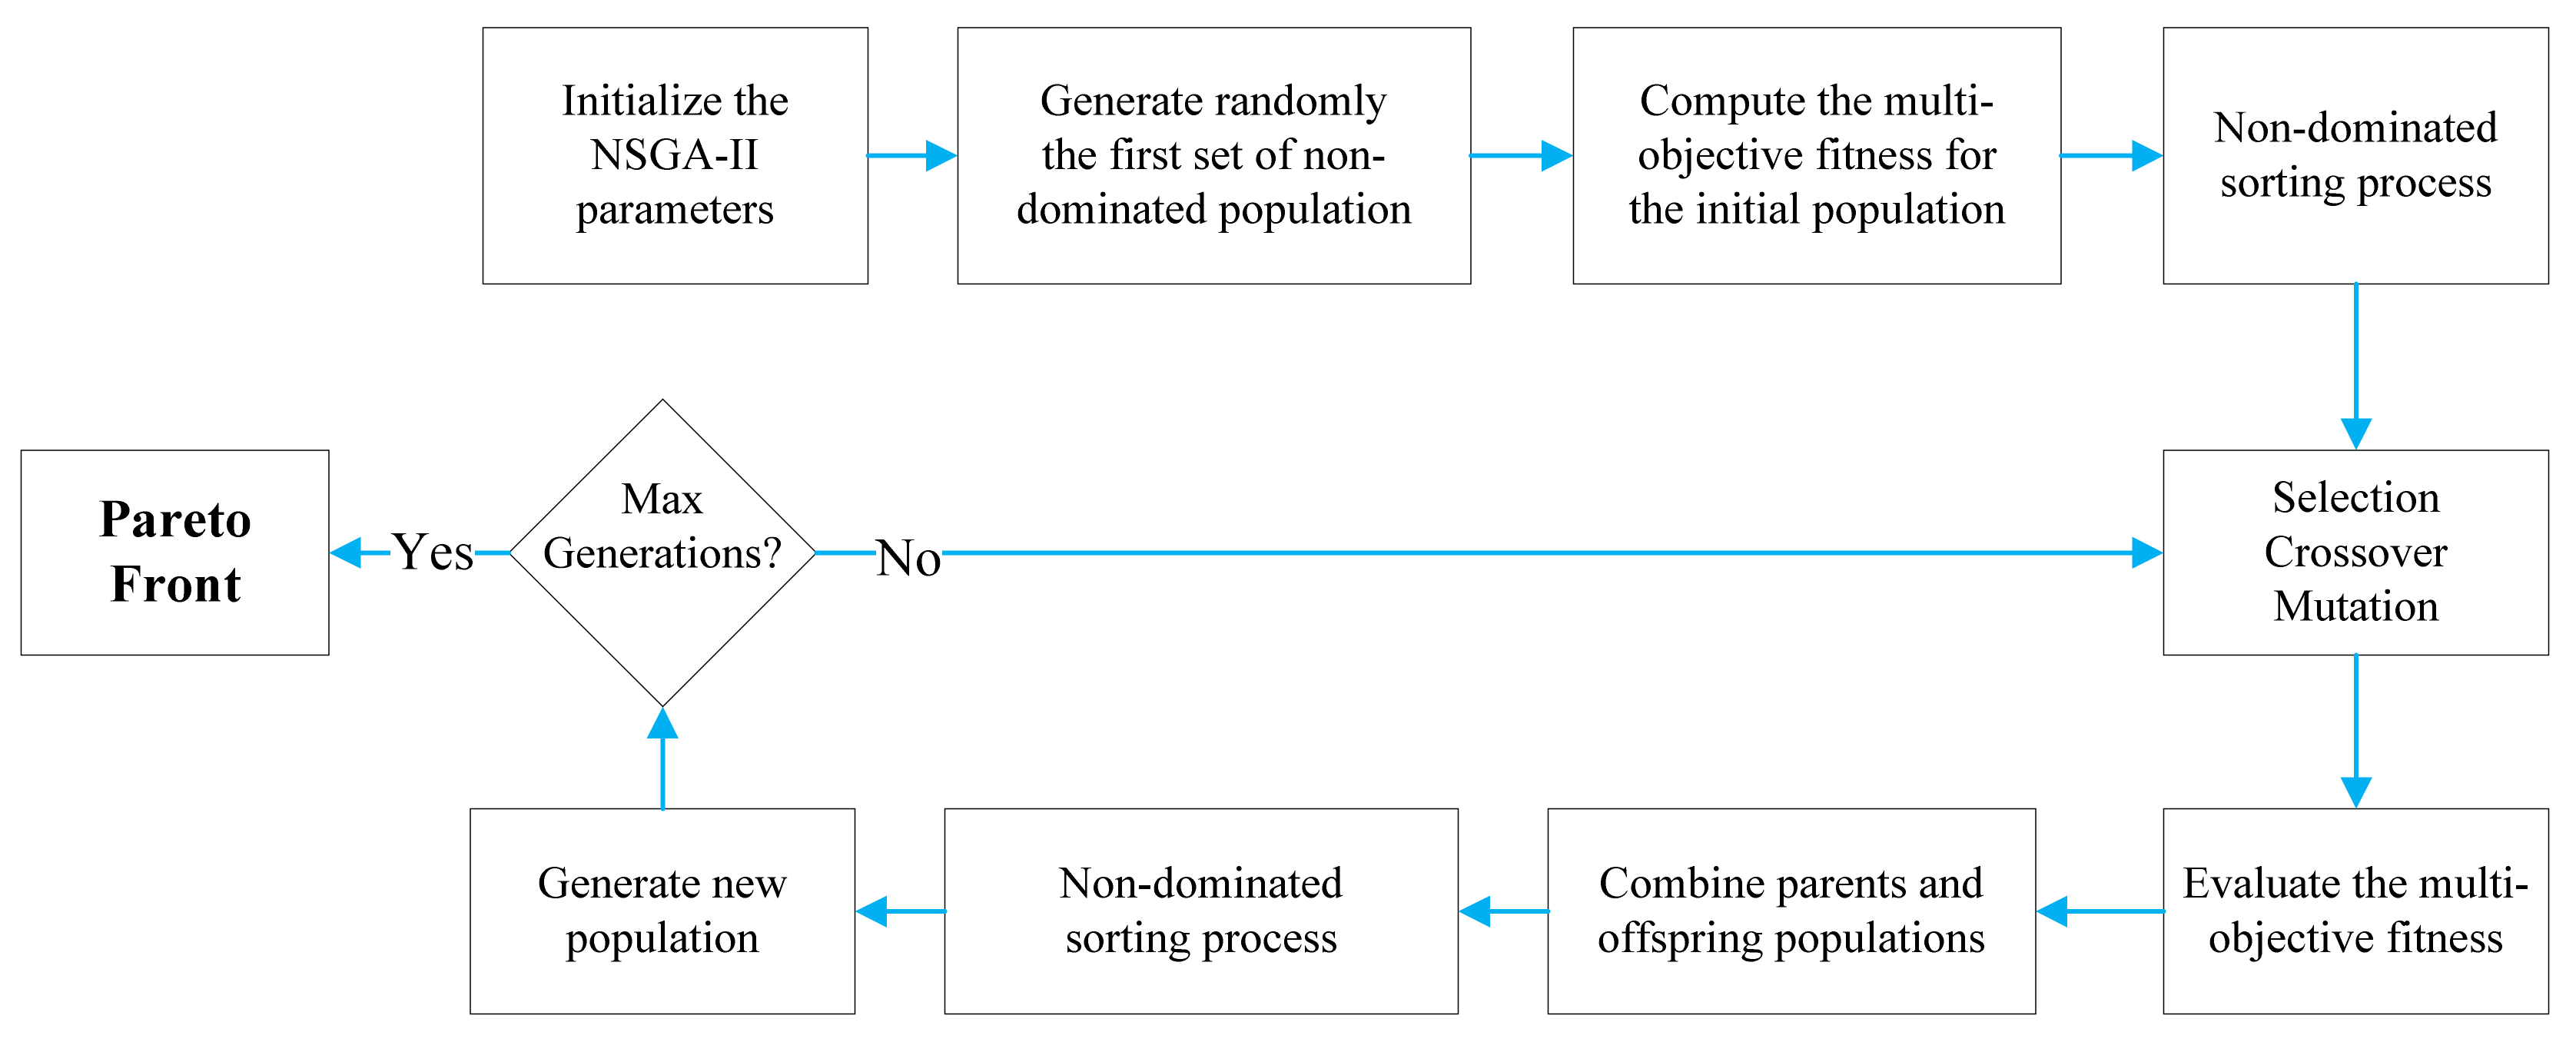
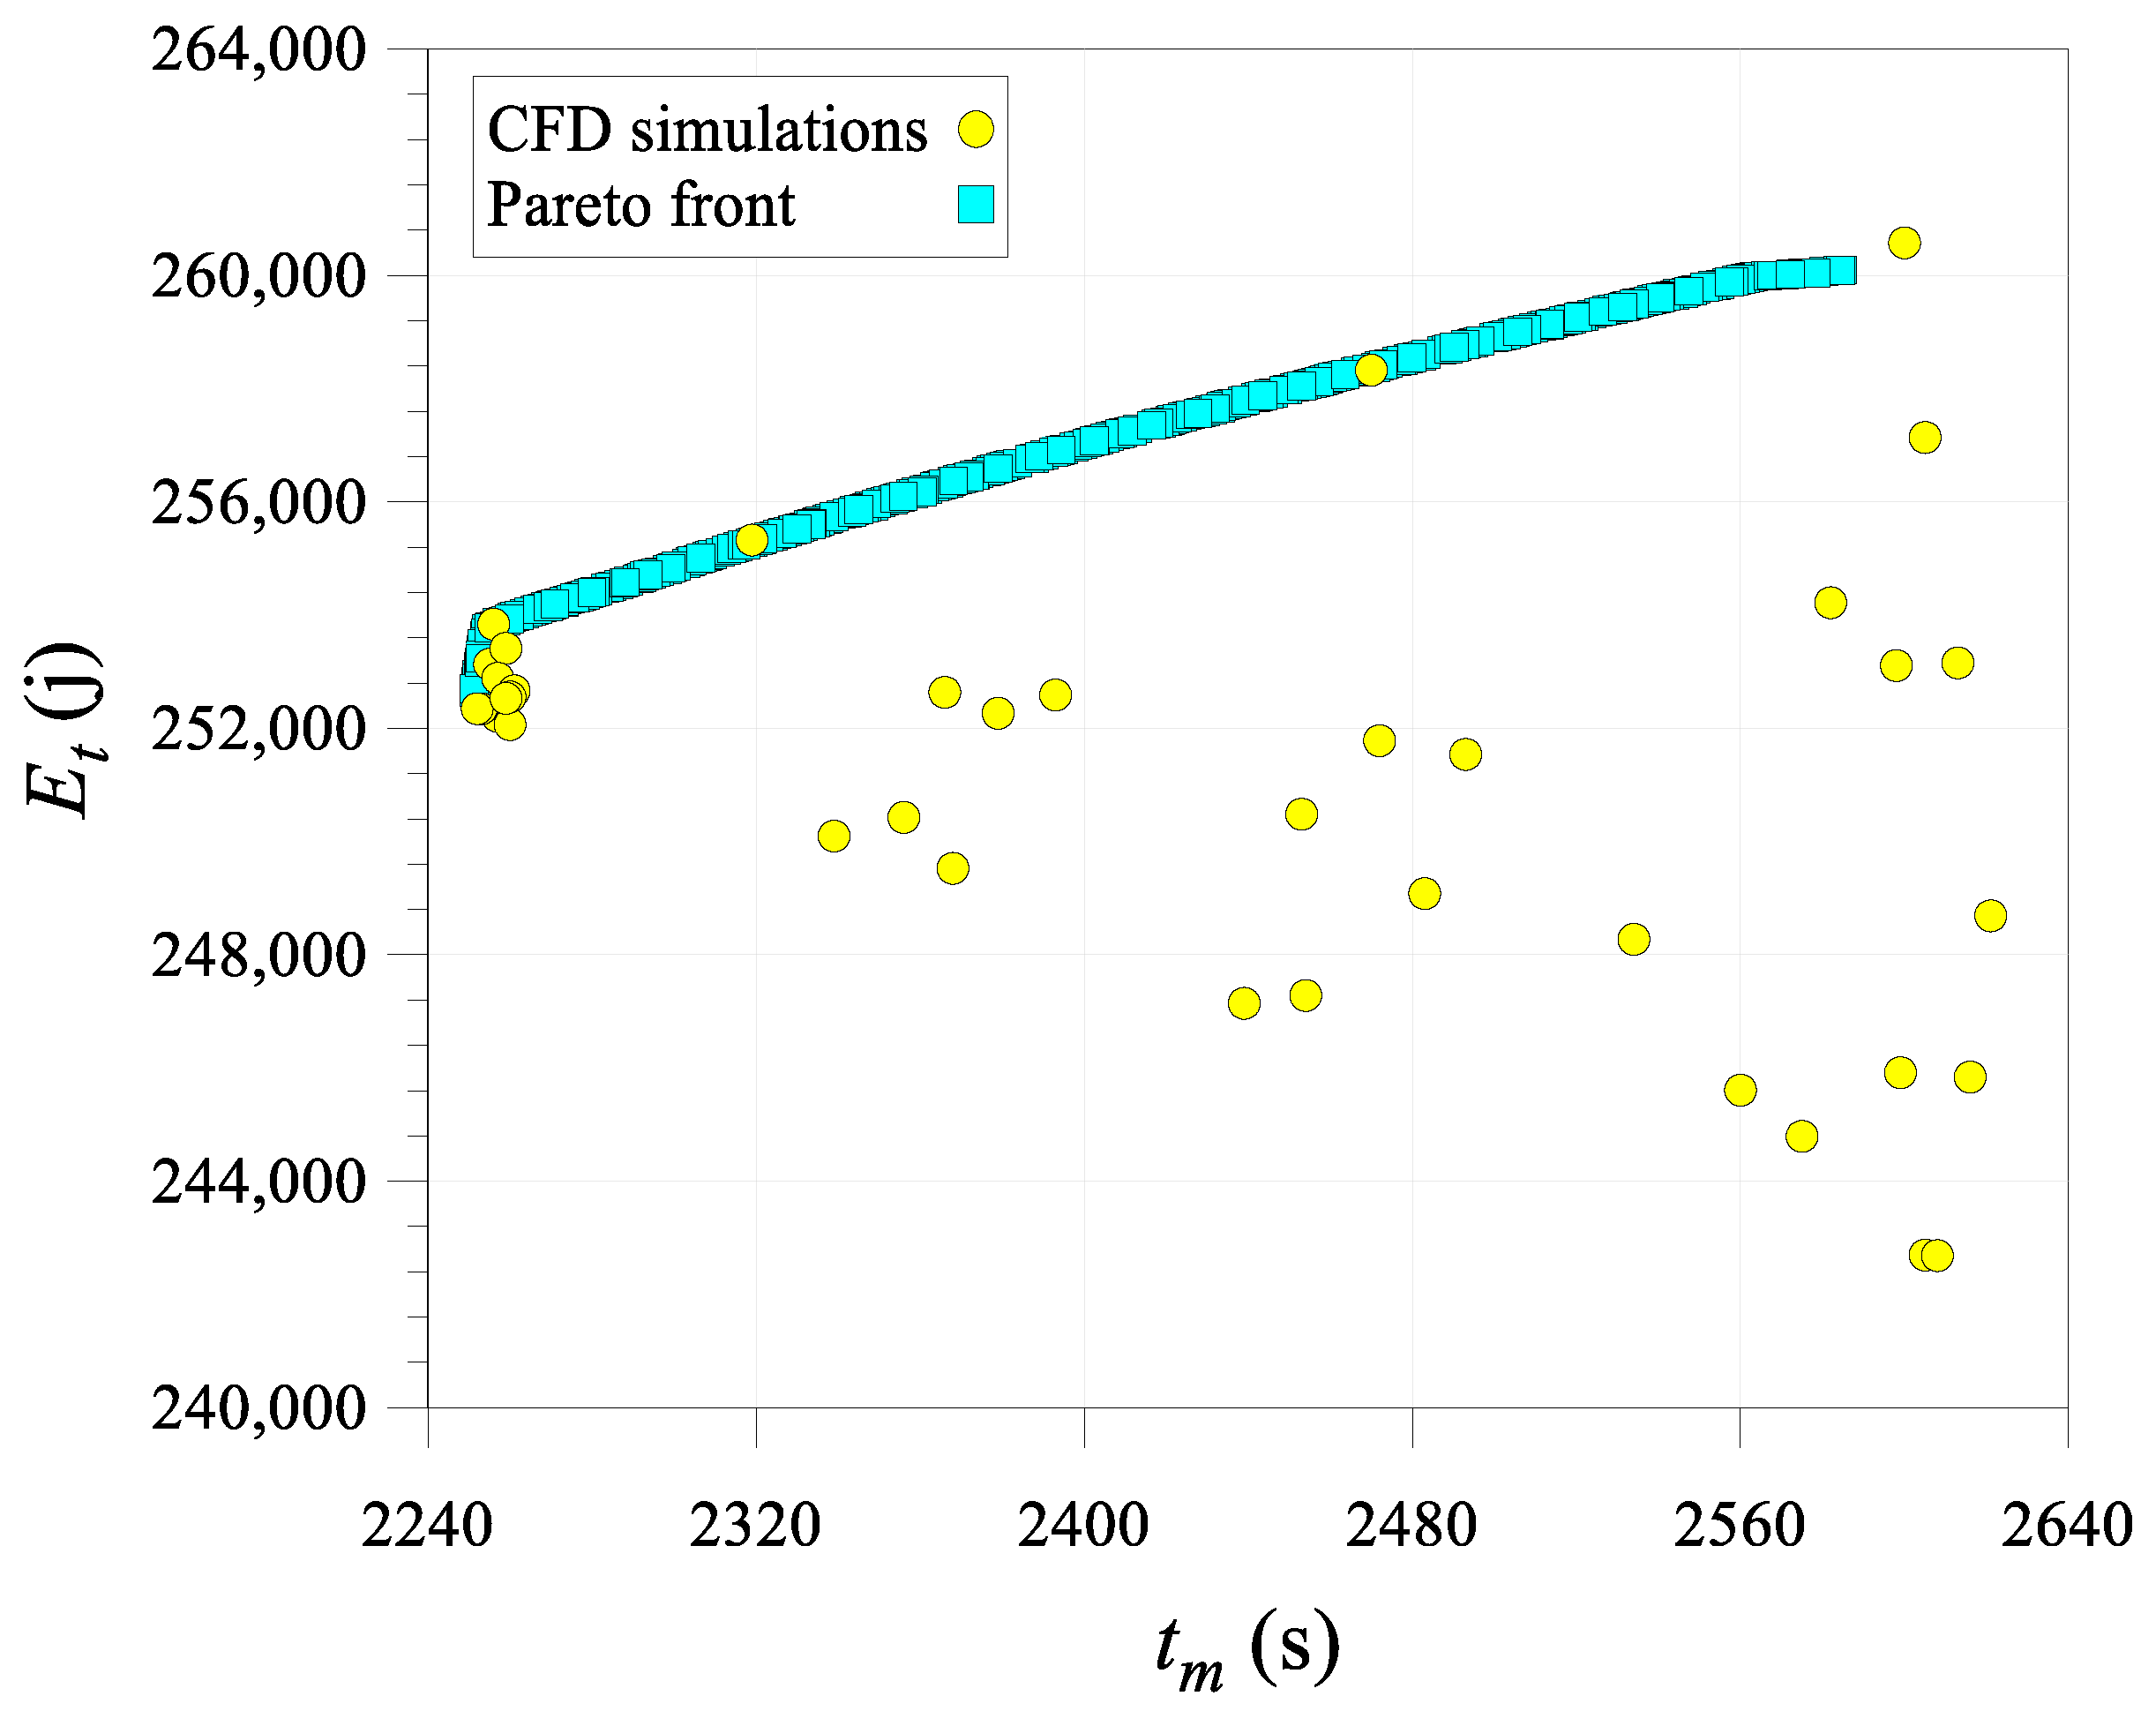
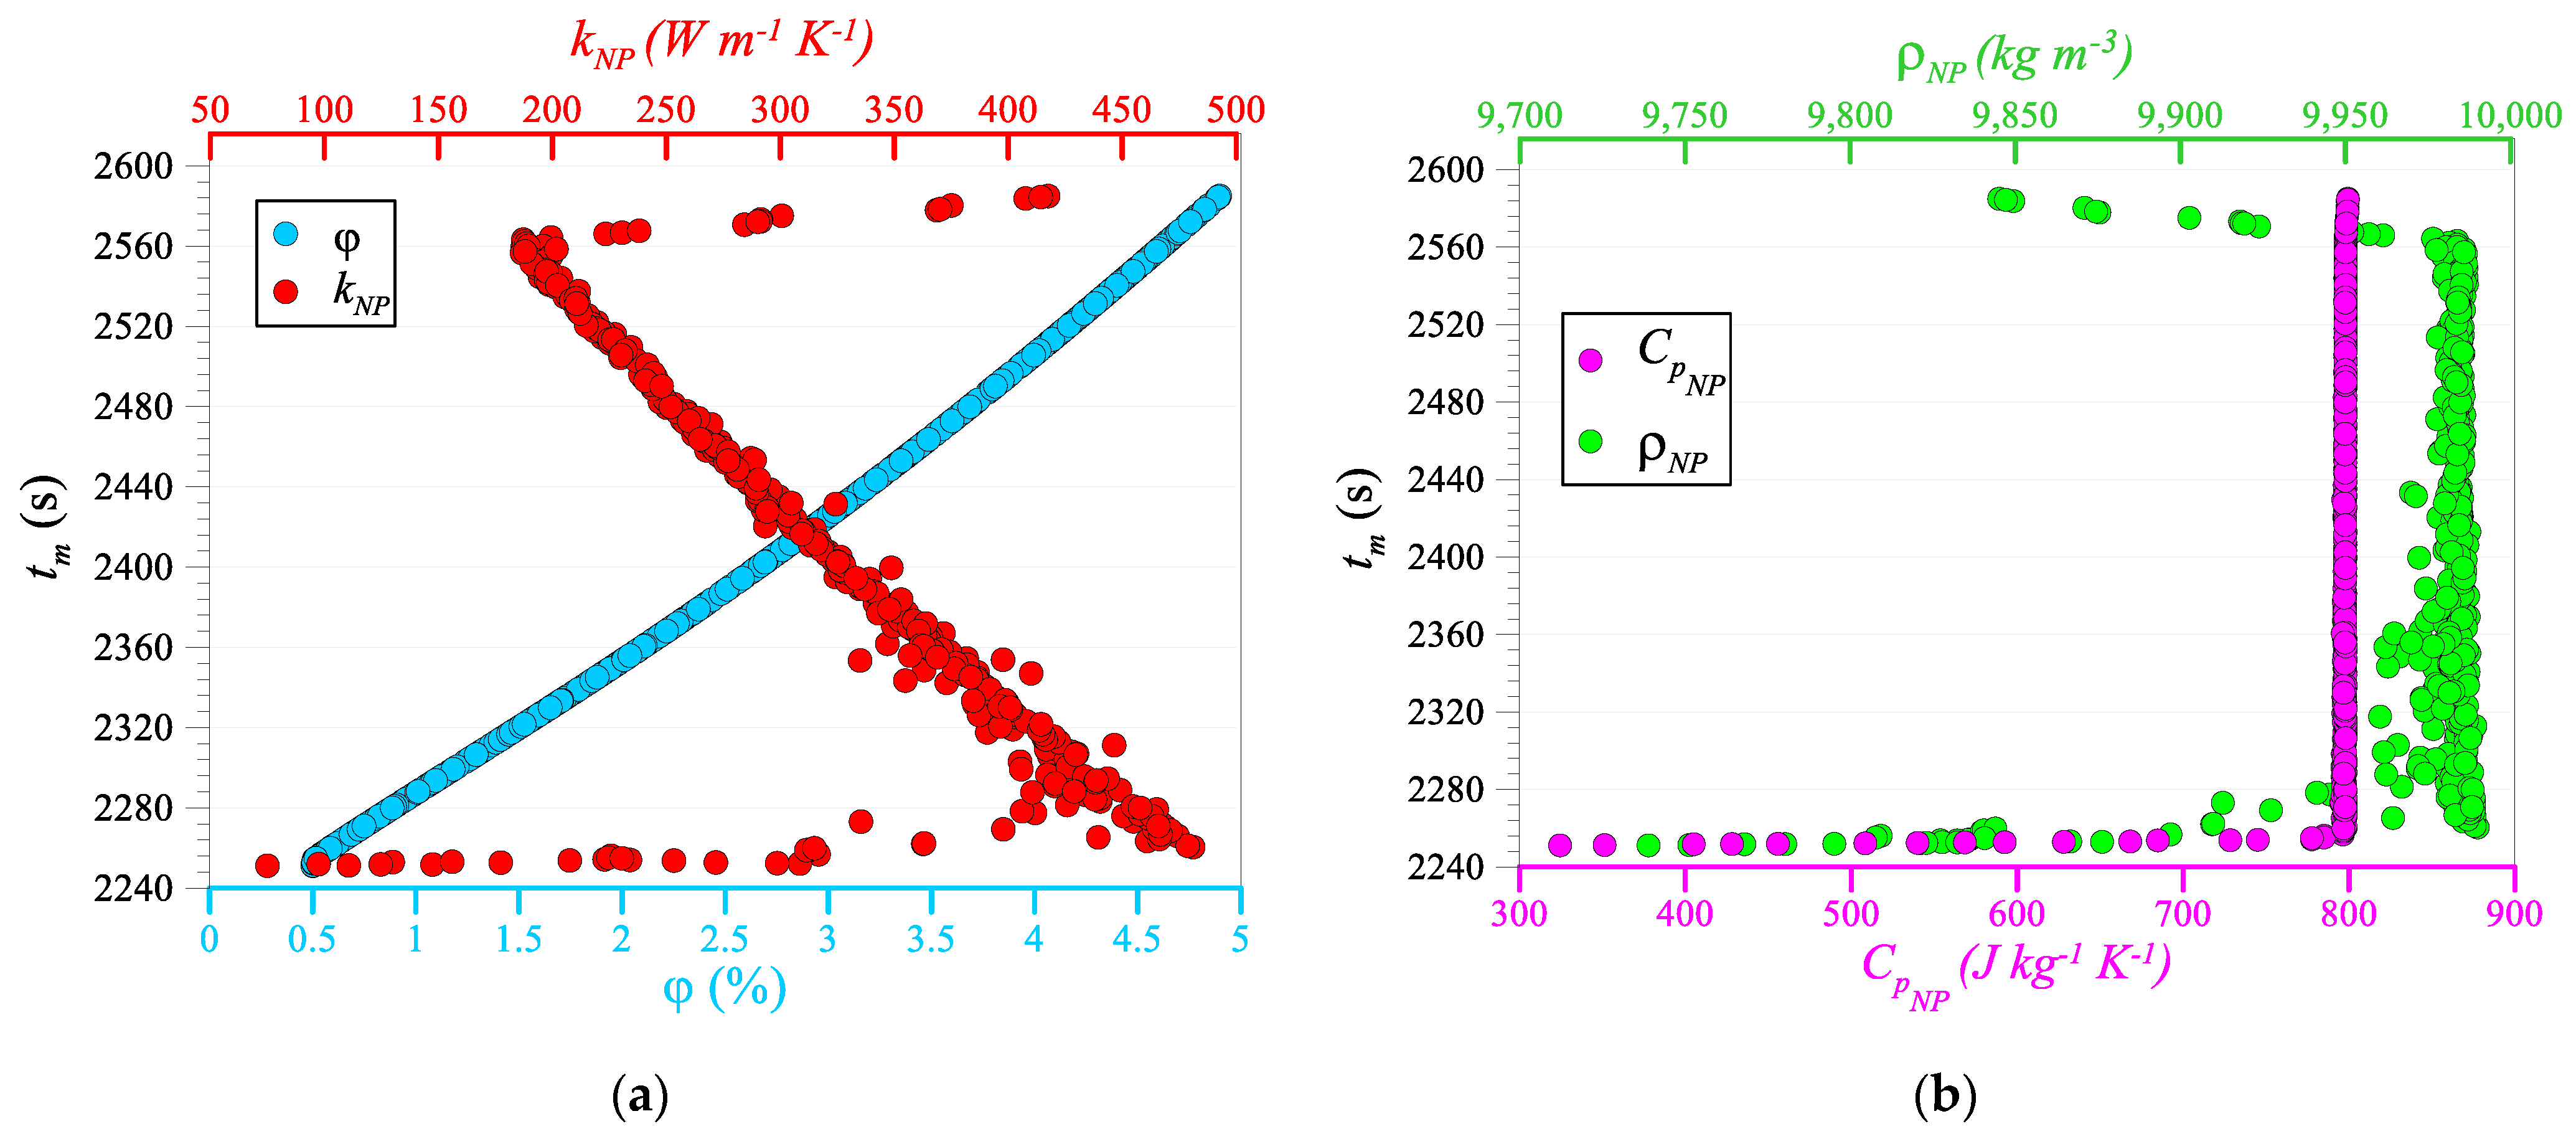
6. Multi-Objective Optimization
7. Multi-Criteria Decision Making
7.1. TOPSIS
- Forming the decision-making matrix where m and n are the numbers of alternatives and criteria, respectively.
- Normalizing the decision-making matrix utilizing the Euclidian technique:
- Computing the weighted normalization of
- Obtaining the best and worst alternatives for objectives with positive () and negative () effects:where
- Computing the alternative Euclidean distance for the best and worst alternatives:
- Ranking the alternatives from 0 to 1 as follows:
7.2. VIKOR
- Forming the decision-making matrix
- Obtaining the best and worst alternatives for all criteria.
- Computing the regret measure ( ) and utility measure (:
- Computing the VIKOR index ():where
7.3. Selection of Optimal Points
- Single criteria ( or );
- Balanced weights ();
- Unbalanced weights ( or ).
8. Conclusions
- is uniformly distributed for all Pareto optimal points in the range of 0.5–4.9%.
- By increasing in optimal solution, the melting time and stored energy are enhanced.
- Approximately 97% of optimal points lie within the range . Thus, the addition of nanoparticles with high thermal conductivity can increase the efficiency of TES systems.
- Around 86% of the optimal points lie between , indicating that the dispersion of high-density nano-additives has a beneficial effect on the paraffin wax melting process.
- Approximately 95% of optimal points have values greater than 795. Consequently, TES systems can benefit significantly from the addition of nano-additives with high specific heat.
Author Contributions
Funding
Institutional Review Board Statement
Informed Consent Statement
Data Availability Statement
Conflicts of Interest
Nomenclature
| Amushy | mushy zone parameter | (kg m−3 s−1) |
| Cp | specific heat | (J kg−1 K−1) |
| g | gravity acceleration | (m s−2) |
| H | enthalpy | (J kg−1) |
| h | sensible enthalpy | (J kg−1) |
| k | thermal conductivity | (W m−1 K−1) |
| L | latent heat of fusion | (J kg−1) |
| P | pressure | (pa) |
| Re | Reynolds number | (-) |
| r | radial coordinates | (m) |
| momentum source term | (pa m−1) | |
| t | time | (s) |
| T | temperature | (K) |
| velocity vector | (m3) | |
| x | axial coordinates | (m) |
| Subscripts | ||
| avg | average | |
| l | liquid | |
| m | melting | |
| NePCM | nano-enhanced phase change material | |
| NP | nano-particles | |
| PCM | phase change material | |
| ref | reference | |
| s | solid | |
| Greek symbols | ||
| coefficient of thermal expansion | (K−1) | |
| liquid fraction | (-) | |
| nano-additives’ volume fraction | (%) | |
| dynamic viscosity | (kg m−1 s−1) | |
| density | (kg m−3) | |
Abbreviations
| ANN | Artificial Neural Network |
| CFD | Computational Fluid Dynamics |
| DI | Deviation Index |
| FVM | Finite Volume Method |
| GMDH | Group Method of Data Handling |
| HTF | Heat Transfer Fluid |
| LHTES | Latent Heat Thermal Energy Storage |
| MAPE | Mean Absolute Percentage Error |
| MCDM | Multi-Criteria Decision Making |
| NePCM | Nano-Enhanced Phase Change Material |
| NSGA-II | Non-Dominated Sorting Genetic Algorithm |
| PCM | Phase Change Material |
| RMSE | Root Mean Squared Error |
| TES | Thermal Energy Storage |
References
- Goldemberg, J. World Energy Assessment; Energy and the Challenge of Sustainability; United Nations Development Programme: New York, NY, USA, 2001. [Google Scholar]
- IEA Statistics. Key World Energy Statistics; International Energy Agency: Paris, France, 2014. [Google Scholar]
- Kuravi, S.; Trahan, J.; Goswami, D.Y.; Rahman, M.M.; Stefanakos, E.K. Thermal energy storage technologies and systems for concentrating solar power plants. Prog. Energy Combust. Sci. 2013, 39, 285–319. [Google Scholar] [CrossRef]
- Zanganeh, G.; Commerford, M.; Haselbacher, A.; Pedretti, A.; Steinfeld, A. Stabilization of the outflow temperature of a packed-bed thermal energy storage by combining rocks with phase change materials. Appl. Therm. Eng. 2014, 70, 316–320. [Google Scholar] [CrossRef]
- Abu-Hamdeh, N.H.; Melaibari, A.A.; Alquthami, T.S.; Khoshaim, A.; Oztop, H.F.; Karimipour, A. Efficacy of incorporating PCM into the building envelope on the energy saving and AHU power usage in winter. Sustain. Energy Technol. Assess. 2021, 43, 100969. [Google Scholar] [CrossRef]
- Li, Q.; Wang, Y.; Ma, L.; Arıcı, M.; Li, D.; Yıldız, Ç.; Zhu, Y. Effect of sunspace and PCM louver combination on the energy saving of rural residences: Case study in a severe cold region of China. Sustain. Energy Technol. Assess. 2021, 45, 101126. [Google Scholar] [CrossRef]
- Kenzhekhanov, S.; Memon, S.A.; Adilkhanova, I. Quantitative evaluation of thermal performance and energy saving potential of the building integrated with PCM in a subarctic climate. Energy 2020, 192, 116607. [Google Scholar] [CrossRef]
- Palacio, M.; Rincón, A.; Carmona, M. Experimental comparative analysis of a flat plate solar collector with and without PCM. Sol. Energy 2020, 206, 708–721. [Google Scholar] [CrossRef]
- Javadi, F.; Metselaar, H.; Ganesan, P. Performance improvement of solar thermal systems integrated with phase change materials (PCM), a review. Sol. Energy 2020, 206, 330–352. [Google Scholar] [CrossRef]
- Kumar, A.; Tiwari, A.K.; Said, Z. A comprehensive review analysis on advances of evacuated tube solar collector using nanofluids and PCM. Sustain. Energy Technol. Assess. 2021, 47, 101417. [Google Scholar] [CrossRef]
- Mazzeo, D.; Matera, N.; Cornaro, C.; Oliveti, G.; Romagnoni, P.; De Santoli, L. EnergyPlus, IDA ICE and TRNSYS predictive simulation accuracy for building thermal behaviour evaluation by using an experimental campaign in solar test boxes with and without a PCM module. Energy Build. 2020, 212, 109812. [Google Scholar] [CrossRef]
- Kong, X.; Wang, L.; Li, H.; Yuan, G.; Yao, C. Experimental study on a novel hybrid system of active composite PCM wall and solar thermal system for clean heating supply in winter. Sol. Energy 2020, 195, 259–270. [Google Scholar] [CrossRef]
- Nariman, A.; Kalbasi, R.; Rostami, S. Sensitivity of AHU power consumption to PCM implementation in the wall-considering the solar radiation. J. Therm. Anal. Calorim. 2021, 143, 2789–2800. [Google Scholar] [CrossRef]
- Mofijur, M.; Mahlia, T.M.I.; Silitonga, A.S.; Ong, H.C.; Silakhori, M.; Hasan, M.H.; Putra, N.; Rahman, S. Phase change materials (PCM) for solar energy usages and storage: An overview. Energies 2019, 12, 3167. [Google Scholar] [CrossRef] [Green Version]
- Savvakis, N.; Tsoutsos, T. Theoretical design and experimental evaluation of a PV+ PCM system in the mediterranean climate. Energy 2021, 220, 119690. [Google Scholar] [CrossRef]
- Duan, J. A novel heat sink for cooling concentrator photovoltaic system using PCM-porous system. Appl. Therm. Eng. 2021, 186, 116522. [Google Scholar] [CrossRef]
- Ahmadi, R.; Monadinia, F.; Maleki, M. Passive/active photovoltaic-thermal (PVT) system implementing infiltrated phase change material (PCM) in PS-CNT foam. Sol. Energy Mater. Sol. Cells 2021, 222, 110942. [Google Scholar] [CrossRef]
- Mahdi, M.S.; Mahood, H.B.; Mahdi, J.M.; Khadom, A.A.; Campbell, A.N. Improved PCM melting in a thermal energy storage system of double-pipe helical-coil tube. Energy Convers. Manag. 2020, 203, 112238. [Google Scholar] [CrossRef]
- Mahdi, M.S.; Mahood, H.B.; Campbell, A.N.; Khadom, A.A. Natural convection improvement of PCM melting in partition latent heat energy storage: Numerical study with experimental validation. Int. Commun. Heat Mass Transf. 2021, 126, 105463. [Google Scholar] [CrossRef]
- Motahar, S. Experimental study and ANN-based prediction of melting heat transfer in a uniform heat flux PCM enclosure. J. Energy Storage 2020, 30, 101535. [Google Scholar] [CrossRef]
- Mahdi, M.S.; Mahood, H.B.; Alammar, A.A.; Khadom, A.A. Numerical investigation of PCM melting using different tube configurations in a shell and tube latent heat thermal storage unit. Therm. Sci. Eng. Prog. 2021, 25, 101030. [Google Scholar] [CrossRef]
- Abu-Hamdeh, N.H.; Alsulami, R.A.; Rawa, M.J.; Alazwari, M.A.; Goodarzi, M.; Safaei, M.R. A Significant Solar Energy Note on Powell-Eyring Nanofluid with Thermal Jump Conditions: Implementing Cattaneo-Christov Heat Flux Model. Mathematics 2021, 9, 2669. [Google Scholar] [CrossRef]
- Alazwari, M.A.; Safaei, M.R. Non-Isothermal Hydrodynamic Characteristics of a Nanofluid in a Fin-Attached Rotating Tube Bundle. Mathematics 2021, 9, 1153. [Google Scholar] [CrossRef]
- Alazwari, M.A.; Safaei, M.R. Combination Effect of Baffle Arrangement and Hybrid Nanofluid on Thermal Performance of a Shell and Tube Heat Exchanger Using 3-D Homogeneous Mixture Model. Mathematics 2021, 9, 881. [Google Scholar] [CrossRef]
- Alazwari, M.A.; Abu-Hamdeh, N.H.; Goodarzi, M. Entropy Optimization of First-Grade Viscoelastic Nanofluid Flow over a Stretching Sheet by Using Classical Keller-Box Scheme. Mathematics 2021, 9, 2563. [Google Scholar] [CrossRef]
- Abu-Hamdeh, N.H.; Alsulami, R.A.; Rawa, M.J.; Aljinaidi, A.A.; Alazwari, M.A.; Eltaher, M.A.; Almitani, K.H.; Alnefaie, K.A.; Abusorrah, A.M.; Sindi, H.F. A detailed hydrothermal investigation of a helical micro double-tube heat exchanger for a wide range of helix pitch length. Case Stud. Therm. Eng. 2021, 28, 101413. [Google Scholar] [CrossRef]
- Goodarzi, M.; Elkotb, M.A.; Alanazi, A.K.; Abo-Dief, H.M.; Mansir, I.B.; Tirth, V.; Gamaoun, F. Applying Bayesian Markov chain Monte Carlo (MCMC) modeling to predict the melting behavior of phase change materials. J. Energy Storage 2021, 103570. [Google Scholar] [CrossRef]
- Zhang, X.; Tang, Y.; Zhang, F.; Lee, C.S. A novel aluminum–graphite dual-ion battery. Adv. Energy Mater. 2016, 6, 1502588. [Google Scholar] [CrossRef] [Green Version]
- Wang, M.; Jiang, C.; Zhang, S.; Song, X.; Tang, Y.; Cheng, H.-M. Reversible calcium alloying enables a practical room-temperature rechargeable calcium-ion battery with a high discharge voltage. Nat. Chem. 2018, 10, 667–672. [Google Scholar] [CrossRef]
- Wang, K.; Li, S. Robust distributed modal regression for massive data. Comput. Stat. Data Anal. 2021, 160, 107225. [Google Scholar] [CrossRef]
- Maleki, H.; Safaei, M.R.; Leon, A.S.; Muhammad, T.; Nguyen, T.K. Improving shipboard electronics cooling system by optimizing the heat sinks configuration. J. Ocean. Eng. Sci. 2021. [Google Scholar] [CrossRef]
- Mojaver, P.; Khalilarya, S.; Chitsaz, A.; Assadi, M. Multi-objective optimization of a power generation system based SOFC using Taguchi/AHP/TOPSIS triple method. Sustain. Energy Technol. Assess. 2020, 38, 100674. [Google Scholar] [CrossRef]
- Tian, Z.; Abdollahi, A.; Shariati, M.; Amindoust, A.; Arasteh, H.; Karimipour, A.; Goodarzi, M.; Bach, Q.-V. Turbulent flows in a spiral double-pipe heat exchanger: Optimal performance conditions using an enhanced genetic algorithm. Int. J. Numer. Methods Heat Fluid Flow 2019, 30, 39–53. [Google Scholar] [CrossRef]
- Goodarzi, M.; Kherbeet, A.S.; Afrand, M.; Sadeghinezhad, E.; Mehrali, M.; Zahedi, P.; Wongwises, S.; Dahari, M. Investigation of heat transfer performance and friction factor of a counter-flow double-pipe heat exchanger using nitrogen-doped, graphene-based nanofluids. Int. Commun. Heat Mass Transf. 2016, 76, 16–23. [Google Scholar] [CrossRef]
- Sheikh, R.; Gholampour, S.; Fallahsohi, H.; Goodarzi, M.; Mohammad Taheri, M.; Bagheri, M. Improving the efficiency of an exhaust thermoelectric generator based on changes in the baffle distribution of the heat exchanger. J. Therm. Anal. Calorim. 2021, 143, 523–533. [Google Scholar] [CrossRef]
- Bahmani, M.H.; Akbari, O.A.; Zarringhalam, M.; Shabani, G.A.S.; Goodarzi, M. Forced convection in a double tube heat exchanger using nanofluids with constant and variable thermophysical properties. Int. J. Numer. Methods Heat Fluid Flow 2019, 30, 3247–3265. [Google Scholar] [CrossRef]
- Bahmani, M.H.; Sheikhzadeh, G.; Zarringhalam, M.; Akbari, O.A.; Alrashed, A.A.; Shabani, G.A.S.; Goodarzi, M. Investigation of turbulent heat transfer and nanofluid flow in a double pipe heat exchanger. Adv. Powder Technol. 2018, 29, 273–282. [Google Scholar] [CrossRef]
- Shahsavar, A.; Khanmohammadi, S.; Karimipour, A.; Goodarzi, M. A novel comprehensive experimental study concerned synthesizes and prepare liquid paraffin-Fe3O4 mixture to develop models for both thermal conductivity & viscosity: A new approach of GMDH type of neural network. Int. J. Heat Mass Transf. 2019, 131, 432–441. [Google Scholar]
- Peng, Y.; Khaled, U.; Al-Rashed, A.A.; Meer, R.; Goodarzi, M.; Sarafraz, M. Potential application of Response Surface Methodology (RSM) for the prediction and optimization of thermal conductivity of aqueous CuO (II) nanofluid: A statistical approach and experimental validation. Phys. A Stat. Mech. Appl. 2020, 554, 124353. [Google Scholar] [CrossRef]
- Ghalambaz, M.; Zhang, J. Conjugate solid-liquid phase change heat transfer in heatsink filled with phase change material-metal foam. Int. J. Heat Mass Transf. 2020, 146, 118832. [Google Scholar] [CrossRef]
- Zhao, C.; Opolot, M.; Liu, M.; Bruno, F.; Mancin, S.; Hooman, K. Phase change behaviour study of PCM tanks partially filled with graphite foam. Appl. Therm. Eng. 2021, 196, 117313. [Google Scholar] [CrossRef]
- Ghalambaz, M.; Zadeh, S.M.H.; Mehryan, S.; Pop, I.; Wen, D. Analysis of melting behavior of PCMs in a cavity subject to a non-uniform magnetic field using a moving grid technique. Appl. Math. Model. 2020, 77, 1936–1953. [Google Scholar] [CrossRef]
- Fauzi, H.; Metselaar, H.S.; Mahlia, T.I.; Silakhori, M.; Ong, H.C. Investigation of thermal characteristic of eutectic fatty acid/damar gum as a composite phase change material (CPCM). In Exergy for A Better Environment and Improved Sustainability 2; Springer: Berlin/Heidelberg, Germany, 2018; pp. 607–616. [Google Scholar]
- Fauzi, H.; Metselaar, H.S.; Mahlia, T.; Silakhori, M.; Ong, H.C. Thermal characteristic reliability of fatty acid binary mixtures as phase change materials (PCMs) for thermal energy storage applications. Appl. Therm. Eng. 2015, 80, 127–131. [Google Scholar] [CrossRef]
- Fauzi, H.; Metselaar, H.S.; Mahlia, T.; Silakhori, M. Sodium laurate enhancements the thermal properties and thermal conductivity of eutectic fatty acid as phase change material (PCM). Sol. Energy 2014, 102, 333–337. [Google Scholar] [CrossRef]
- Fauzi, H.; Metselaar, H.S.; Mahlia, T.; Silakhori, M.; Nur, H. PCM: Optimizing the therma property and thermal conductivity of myristicacic/palmitic acid eutectic mixture with acid-based surfactants. Appl. Therm. Eng. 2013, 60, 261–265. [Google Scholar] [CrossRef]
- Oliveski, R.D.C.; Becker, F.; Rocha, L.A.O.; Biserni, C.; Eberhardt, G.E.S. Design of fin structures for phase change material (PCM) melting process in rectangular cavities. J. Energy Storage 2021, 35, 102337. [Google Scholar] [CrossRef]
- Bouzennada, T.; Mechighel, F.; Ismail, T.; Kolsi, L.; Ghachem, K. Heat transfer and fluid flow in a PCM-filled enclosure: Effect of inclination angle and mid-separation fin. Int. Commun. Heat Mass Transf. 2021, 124, 105280. [Google Scholar] [CrossRef]
- Desai, A.N.; Shah, H.; Singh, V. The novel inverted fin configurations for enhancing the thermal performance of PCM based thermal control unit: A numerical study. Appl. Therm. Eng. 2021, 195, 117155. [Google Scholar] [CrossRef]
- Elarem, R.; Alqahtani, T.; Mellouli, S.; Aich, W.; Khedher, N.B.; Kolsi, L.; Jemni, A. Numerical study of an Evacuated Tube Solar Collector incorporating a Nano-PCM as a latent heat storage system. Case Stud. Therm. Eng. 2021, 24, 100859. [Google Scholar] [CrossRef]
- Ho, C.; Hsu, S.-T.; Yang, T.-F.; Chen, B.-L.; Rashidi, S.; Yan, W.-M. Cooling performance of mini-channel heat sink with water-based nano-PCM emulsion-An experimental study. Int. J. Therm. Sci. 2021, 164, 106903. [Google Scholar] [CrossRef]
- Yadav, C.; Sahoo, R.R. Thermal analysis comparison of nano-additive PCM-based engine waste heat recovery thermal storage systems: An experimental study. J. Therm. Anal. Calorim. 2021, 1–18. [Google Scholar] [CrossRef]
- Yadav, C.; Sahoo, R.R. Effect of nano-enhanced PCM on the thermal performance of a designed cylindrical thermal energy storage system. Exp. Heat Transf. 2021, 34, 356–375. [Google Scholar] [CrossRef]
- Chen, H.; Li, S.; Wei, P.; Gong, Y.; Nie, P.; Chen, X.; Wang, C. Experimental study on characteristics of a nano-enhanced phase change material slurry for low temperature solar energy collection. Sol. Energy Mater. Sol. Cells 2020, 212, 110513. [Google Scholar] [CrossRef]
- Kumar, A.; Kothari, R.; Sahu, S.K.; Kundalwal, S.I. Thermal performance of heat sink using nano-enhanced phase change material (NePCM) for cooling of electronic components. Microelectron. Reliab. 2021, 121, 114144. [Google Scholar] [CrossRef]
- Li, Z.; Hu, N.; Tu, J.; Fan, L. Experimental Investigation of Heat Storage and Heat Transfer Rates during Melting of Nano-Enhanced Phase Change Materials (NePCM) in a Differentially-Heated Rectangular Cavity. J. Therm. Sci. 2020, 29, 503–511. [Google Scholar] [CrossRef]
- Praveen, B.; Suresh, S.; Pethurajan, V. Heat transfer performance of graphene nano-platelets laden micro-encapsulated PCM with polymer shell for thermal energy storage based heat sink. Appl. Therm. Eng. 2019, 156, 237–249. [Google Scholar] [CrossRef]
- Ramakrishnan, S.; Wang, X.; Sanjayan, J. Effects of various carbon additives on the thermal storage performance of form-stable PCM integrated cementitious composites. Appl. Therm. Eng. 2019, 148, 491–501. [Google Scholar] [CrossRef]
- Singh, R.P.; Sze, J.Y.; Kaushik, S.; Rakshit, D.; Romagnoli, A. Thermal performance enhancement of eutectic PCM laden with functionalised graphene nanoplatelets for an efficient solar absorption cooling storage system. J. Energy Storage 2021, 33, 102092. [Google Scholar] [CrossRef]
- Mahdi, J.M.; Nsofor, E.C. Melting enhancement in triplex-tube latent heat energy storage system using nanoparticles-metal foam combination. Appl. Energy 2017, 191, 22–34. [Google Scholar] [CrossRef]
- Senobar, H.; Aramesh, M.; Shabani, B. Nanoparticles and metal foams for heat transfer enhancement of phase change materials: A comparative experimental study. J. Energy Storage 2020, 32, 101911. [Google Scholar] [CrossRef]
- Yousef, M.S.; Hassan, H. Energy payback time, exergoeconomic and enviroeconomic analyses of using thermal energy storage system with a solar desalination system: An experimental study. J. Clean. Prod. 2020, 270, 122082. [Google Scholar] [CrossRef]
- Kabeel, A.; Abdelgaied, M.; Harby, K.; Eisa, A. Augmentation of diurnal and nocturnal distillate of modified tubular solar still having copper tubes filled with PCM in the basin. J. Energy Storage 2020, 32, 101992. [Google Scholar] [CrossRef]
- Bhardwaj, A.; Kumar, R.; Kumar, S.; Goel, B.; Chauhan, R. Energy and exergy analyses of drying medicinal herb in a novel forced convection solar dryer integrated with SHSM and PCM. Sustain. Energy Technol. Assess. 2021, 45, 101119. [Google Scholar] [CrossRef]
- Prieto, C.; Lopez-Roman, A.; Martínez, N.; Morera, J.M.; Cabeza, L.F. Improvement of Phase Change Materials (PCM) Used for Solar Process Heat Applications. Molecules 2021, 26, 1260. [Google Scholar] [CrossRef] [PubMed]
- Kutlu, C.; Zhang, Y.; Elmer, T.; Su, Y.; Riffat, S. A simulation study on performance improvement of solar assisted heat pump hot water system by novel controllable crystallization of supercooled PCMs. Renew. Energy 2020, 152, 601–612. [Google Scholar] [CrossRef]
- Dong, Y.; Liu, Y.; Wang, D.; Wang, Y.; Du, H.; Liu, J. Review of latent thermal energy storage systems for solar air-conditioning systems. Int. J. Energy Res. 2020, 44, 669–707. [Google Scholar] [CrossRef]
- Masoumi, H.; Khoshkhoo, R.H. Investigation of melting of nanoparticle-enhanced phase change materials (NePCMs) in a shell-and-tube heat exchanger with longitudinal fins. Heat Mass Transf. 2021, 57, 681–701. [Google Scholar] [CrossRef]
- Shi, E.; Zonouzi, S.A.; Aminfar, H.; Mohammadpourfard, M. Enhancement of the performance of a NEPCM filled shell-and-multi tube thermal energy storage system using magnetic field: A numerical study. Appl. Therm. Eng. 2020, 178, 115604. [Google Scholar] [CrossRef]
- Karami, R.; Kamkari, B. Experimental investigation of the effect of perforated fins on thermal performance enhancement of vertical shell and tube latent heat energy storage systems. Energy Convers. Manag. 2020, 210, 112679. [Google Scholar] [CrossRef]
- Mahdavi, M.; Tiari, S.; Pawar, V. A numerical study on the combined effect of dispersed nanoparticles and embedded heat pipes on melting and solidification of a shell and tube latent heat thermal energy storage system. J. Energy Storage 2020, 27, 101086. [Google Scholar] [CrossRef]
- Mahood, H.B.; Mahdi, M.S.; Monjezi, A.A.; Khadom, A.A.; Campbell, A.N. Numerical investigation on the effect of fin design on the melting of phase change material in a horizontal shell and tube thermal energy storage. J. Energy Storage 2020, 29, 101331. [Google Scholar] [CrossRef]
- Pu, L.; Zhang, S.; Xu, L.; Li, Y. Thermal performance optimization and evaluation of a radial finned shell-and-tube latent heat thermal energy storage unit. Appl. Therm. Eng. 2020, 166, 114753. [Google Scholar] [CrossRef]
- Parsazadeh, M.; Duan, X. Numerical study on the effects of fins and nanoparticles in a shell and tube phase change thermal energy storage unit. Appl. Energy 2018, 216, 142–156. [Google Scholar] [CrossRef]
- Yang, L.; Huang, J.-N.; Zhou, F. Thermophysical properties and applications of nano-enhanced PCMs: An update review. Energy Convers. Manag. 2020, 214, 112876. [Google Scholar] [CrossRef]
- Awais, M.; Ullah, N.; Ahmad, J.; Sikandar, F.; Ehsan, M.M.; Salehin, S.; Bhuiyan, A.A. Heat transfer and pressure drop performance of Nanofluid: A state-of-the-art review. Int. J. Thermofluids 2021, 9, 100065. [Google Scholar] [CrossRef]
- Maleki, H.; Safaei, M.R.; Alrashed, A.A.; Kasaeian, A. Flow and heat transfer in non-Newtonian nanofluids over porous surfaces. J. Therm. Anal. Calorim. 2019, 135, 1655–1666. [Google Scholar] [CrossRef]
- Hajmohammadi, M.; Maleki, H.; Lorenzini, G.; Nourazar, S. Effects of Cu and Ag nano-particles on flow and heat transfer from permeable surfaces. Adv. Powder Technol. 2015, 26, 193–199. [Google Scholar] [CrossRef]
- Maleki, H.; Safaei, M.R.; Togun, H.; Dahari, M. Heat transfer and fluid flow of pseudo-plastic nanofluid over a moving permeable plate with viscous dissipation and heat absorption/generation. J. Therm. Anal. Calorim. 2019, 135, 1643–1654. [Google Scholar] [CrossRef]
- Maleki, H.; Alsarraf, J.; Moghanizadeh, A.; Hajabdollahi, H.; Safaei, M.R. Heat transfer and nanofluid flow over a porous plate with radiation and slip boundary conditions. J. Cent. South. Univ. 2019, 26, 1099–1115. [Google Scholar] [CrossRef]
- Aziz, A.; Jamshed, W.; Aziz, T. Mathematical model for thermal and entropy analysis of thermal solar collectors by using Maxwell nanofluids with slip conditions, thermal radiation and variable thermal conductivity. Open Phys. 2018, 16, 123–136. [Google Scholar] [CrossRef]
- Al Kalbani, K.; Alam, M.; Rahman, M. Finite element analysis of unsteady natural convective heat transfer and fluid flow of nanofluids inside a tilted square enclosure in the presence of oriented magnetic field. Am. J. Heat Mass Transf. 2016, 3, 186–224. [Google Scholar]
- Abro, K.A.; Hussain, M.; Baig, M.M. An analytic study of molybdenum disulfide nanofluids using the modern approach of Atangana-Baleanu fractional derivatives. Eur. Phys. J. Plus 2017, 132, 1–10. [Google Scholar] [CrossRef]
- Hamad, H.S.; Kapur, N.; Khatir, Z.; Querin, O.; Thompson, H.; Wilson, M. CFD-Enabled Optimization of Polymerase Chain Reaction Thermal Flow Systems. In Advances in Heat Transfer and Thermal Engineering; Springer: Berlin/Heidelberg, Germany, 2021; pp. 409–416. [Google Scholar]
- De Aguiar, P.F.; Bourguignon, B.; Khots, M.; Massart, D.; Phan-Than-Luu, R. D-optimal designs. Chemom. Intell. Lab. Syst. 1995, 30, 199–210. [Google Scholar] [CrossRef]
- Schlichting, H.; Gersten, K. Boundary-Layer Theory; Springer: Berlin/Heidelberg, Germany, 2016. [Google Scholar]
- Suraparaju, S.K.; Natarajan, S.K. Experimental investigation of single-basin solar still using solid staggered fins inserted in paraffin wax PCM bed for enhancing productivity. Environ. Sci. Pollut. Res. 2021, 28, 20330–20343. [Google Scholar] [CrossRef] [PubMed]
- Nagar, S.; Sharma, K. Modern solar systems driven by nanoparticles-based fatty acids and paraffin wax phase change materials. J. Mater. Sci. 2021, 56, 4941–4966. [Google Scholar] [CrossRef]
- Manoj Kumar, P.; Mylsamy, K.; Saravanakumar, P. Experimental investigations on thermal properties of nano-SiO2/paraffin phase change material (PCM) for solar thermal energy storage applications. Energy Sources Part A Recov. Util. Environ. Eff. 2020, 42, 2420–2433. [Google Scholar] [CrossRef]
- Chen, G.; Su, Y.; Jiang, D.; Pan, L.; Li, S. An experimental and numerical investigation on a paraffin wax/graphene oxide/carbon nanotubes composite material for solar thermal storage applications. Appl. Energy 2020, 264, 114786. [Google Scholar] [CrossRef]
- Alawadhi, E. The design, properties, and performance of concrete masonry blocks with phase change materials. In Eco-Efficient Masonry Bricks and Blocks; Elsevier: Amsterdam, The Netherlands, 2015; pp. 231–248. [Google Scholar]
- Roy, U.; Pant, H.K. Current progress in heat exchangers with phase change materials (PCMs): A comprehensive investigation. In Advanced Analytic and Control Techniques for Thermal Systems with Heat Exchangers; Elsevier: Amsterdam, The Netherlands, 2020; pp. 219–230. [Google Scholar]
- Wang, Q.; Zhou, D.; Chen, Y.; Eames, P.; Wu, Z. Characterization and effects of thermal cycling on the properties of paraffin/expanded graphite composites. Renew. Energy 2020, 147, 1131–1138. [Google Scholar] [CrossRef]
- Sarbu, I.; Sebarchievici, C. A comprehensive review of thermal energy storage. Sustainability 2018, 10, 191. [Google Scholar] [CrossRef] [Green Version]
- Kandasamy, R.; Wang, X.-Q.; Mujumdar, A.S. Transient cooling of electronics using phase change material (PCM)-based heat sinks. Appl. Therm. Eng. 2008, 28, 1047–1057. [Google Scholar] [CrossRef]
- Humphries, W.R.; Griggs, E.I. A Design Handbook for Phase Change Thermal Control and Energy Storage Devices; National Aeronautics and Space Administration: Washington, DC, USA, 1977. [Google Scholar]
- Fan, L.-W.; Zhu, Z.-Q.; Zeng, Y.; Ding, Q.; Liu, M.-J. Unconstrained melting heat transfer in a spherical container revisited in the presence of nano-enhanced phase change materials (NePCM). Int. J. Heat Mass Transf. 2016, 95, 1057–1069. [Google Scholar] [CrossRef]
- Pak, B.C.; Cho, Y.I. Hydrodynamic and heat transfer study of dispersed fluids with submicron metallic oxide particles. Exp. Heat Transf. Int. J. 1998, 11, 151–170. [Google Scholar] [CrossRef]
- Vajjha, R.S.; Das, D.K.; Namburu, P.K. Numerical study of fluid dynamic and heat transfer performance of Al2O3 and CuO nanofluids in the flat tubes of a radiator. Int. J. Heat Fluid Flow 2010, 31, 613–621. [Google Scholar] [CrossRef]
- Maxwell, J.C. A Treatise on Electricity and Magnetism; Clarendon Press: Oxford, UK, 1873; Volume 1. [Google Scholar]
- Faraji, H.; El Alami, M.; Arshad, A.; Faraji, M. Numerical simulation of the melting of a NePCM for cooling of electronic components. Therm. Sci. Eng. Prog. 2021, 21, 100766. [Google Scholar] [CrossRef]
- Farahani, S.D.; Farahani, A.D.; Mosavi, A.H. Numerical simulation of NEPCM series two-layer solidification process in a triple tube with porous fin. Case Stud. Therm. Eng. 2021, 28, 101407. [Google Scholar] [CrossRef]
- Yadav, A.; Madhavan, A.A.; Vashishtha, V.K.; Yadav, H. Numerical Modelling of Thermal Cooling in PV Panels with NEPCM. In Recent Advances in Mechanical Engineering; Springer: Berlin/Heidelberg, Germany, 2021; pp. 249–255. [Google Scholar]
- Faraji, H.; Alami, M.E.; Arshad, A.; Hariti, Y. Numerical survey on performance of hybrid NePCM for cooling of electronics: Effect of heat source position and heat sink inclination. J. Therm. Sci. Eng. Appl. 2021, 13, 051010. [Google Scholar] [CrossRef]
- Nayak, M.; Dogonchi, A.S.; Elmasry, Y.; Karimi, N.; Chamkha, A.J.; Alhumade, H. Free convection and second law scrutiny of NEPCM suspension inside a wavy-baffle-equipped cylinder under altered Fourier theory. J. Taiwan Inst. Chem. Eng. 2021, 128, 288–300. [Google Scholar] [CrossRef]
- Khodadadi, M.; Farshad, S.A.; Ebrahimpour, Z.; Sheikholeslami, M. Thermal performance of nanofluid with employing of NEPCM in a PVT-LFR system. Sustain. Energy Technol. Assess. 2021, 47, 101340. [Google Scholar] [CrossRef]
- Parsazadeh, M.; Duan, X. Numerical and statistical study on melting of nanoparticle enhanced phase change material in a shell-and-tube thermal energy storage system. Appl. Therm. Eng. 2017, 111, 950–960. [Google Scholar] [CrossRef]
- Voller, V.R.; Prakash, C. A fixed grid numerical modelling methodology for convection-diffusion mushy region phase-change problems. Int. J. Heat Mass Transf. 1987, 30, 1709–1719. [Google Scholar] [CrossRef]
- Moreno, S.; Hinojosa, J.; Hernández-López, I.; Xaman, J. Numerical and experimental study of heat transfer in a cubic cavity with a PCM in a vertical heated wall. Appl. Therm. Eng. 2020, 178, 115647. [Google Scholar] [CrossRef]
- Gasia, J.; Groulx, D.; Tay, N.S.; Cabeza, L.F. Numerical study of dynamic melting enhancement in a latent heat thermal energy storage system. J. Energy Storage 2020, 31, 101664. [Google Scholar] [CrossRef]
- He, S.; Wang, W.; Wei, L.; Ding, J. Heat transfer enhancement and melting behavior of phase change material in a direct-contact thermal energy storage container. J. Energy Storage 2020, 31, 101665. [Google Scholar] [CrossRef]
- Maleki, H.; Ashrafi, M.; Ilghani, N.Z.; Goodarzi, M.; Muhammad, T. Pareto optimal design of a finned latent heat thermal energy storage unit using a novel hybrid technique. J. Energy Storage 2021, 44, 103310. [Google Scholar] [CrossRef]
- Mat, S.; Al-Abidi, A.A.; Sopian, K.; Sulaiman, M.Y.; Mohammad, A.T. Enhance heat transfer for PCM melting in triplex tube with internal–external fins. Energy Convers. Manag. 2013, 74, 223–236. [Google Scholar] [CrossRef]
- Fluent, A. Fluent 14.0 User’s Guide; Ansys Fluent Inc.: Canonsburg, PA, USA, 2011. [Google Scholar]
- Silva, T.; Vicente, R.; Soares, N.; Ferreira, V. Experimental testing and numerical modelling of masonry wall solution with PCM incorporation: A passive construction solution. Energy Build. 2012, 49, 235–245. [Google Scholar] [CrossRef]
- Seddegh, S.; Joybari, M.M.; Wang, X.; Haghighat, F. Experimental and numerical characterization of natural convection in a vertical shell-and-tube latent thermal energy storage system. Sustain. Cities Soc. 2017, 35, 13–24. [Google Scholar] [CrossRef]
- Akgün, M.; Aydın, O.; Kaygusuz, K. Experimental study on melting/solidification characteristics of a paraffin as PCM. Energy Convers. Manag. 2007, 48, 669–678. [Google Scholar] [CrossRef]
- Singh, R.P.; Kaushik, S.; Rakshit, D. Melting phenomenon in a finned thermal storage system with graphene nano-plates for medium temperature applications. Energy Convers. Manag. 2018, 163, 86–99. [Google Scholar] [CrossRef]
- Shaikh, M.; Uzair, M.; Allauddin, U. Effect of geometric configurations on charging time of latent-heat storage for solar applications. Renew. Energy 2021, 179, 262–271. [Google Scholar] [CrossRef]
- Sodhi, G.S.; Muthukumar, P. Compound charging and discharging enhancement in multi-PCM system using non-uniform fin distribution. Renew. Energy 2021, 171, 299–314. [Google Scholar] [CrossRef]
- Gil, A.; Oró, E.; Peiró, G.; Álvarez, S.; Cabeza, L.F. Material selection and testing for thermal energy storage in solar cooling. Renew. Energy 2013, 57, 366–371. [Google Scholar] [CrossRef]
- Oró, E.; Gil, A.; Miró, L.; Peiró, G.; Álvarez, S.; Cabeza, L.F. Thermal energy storage implementation using phase change materials for solar cooling and refrigeration applications. Energy Procedia 2012, 30, 947–956. [Google Scholar] [CrossRef] [Green Version]
- Edalatifar, M.; Tavakoli, M.B.; Ghalambaz, M.; Setoudeh, F. Using deep learning to learn physics of conduction heat transfer. J. Therm. Anal. Calorim. 2021, 146, 1435–1452. [Google Scholar] [CrossRef]
- Fattahi, H.; Ilghani, N.Z. Hybrid wavelet transform with artificial neural network for forecasting of shear wave velocity from wireline log data: A case study. Environ. Earth Sci. 2021, 80, 1–10. [Google Scholar] [CrossRef]
- Karimipour, A.; Bagherzadeh, S.A.; Taghipour, A.; Abdollahi, A.; Safaei, M.R. A novel nonlinear regression model of SVR as a substitute for ANN to predict conductivity of MWCNT-CuO/water hybrid nanofluid based on empirical data. Phys. A Stat. Mech. Appl. 2019, 521, 89–97. [Google Scholar] [CrossRef]
- Alrashed, A.A.; Gharibdousti, M.S.; Goodarzi, M.; de Oliveira, L.R.; Safaei, M.R.; Bandarra Filho, E.P. Effects on thermophysical properties of carbon based nanofluids: Experimental data, modelling using regression, ANFIS and ANN. Int. J. Heat Mass Transf. 2018, 125, 920–932. [Google Scholar] [CrossRef]
- Alrashed, A.A.; Karimipour, A.; Bagherzadeh, S.A.; Safaei, M.R.; Afrand, M. Electro-and thermophysical properties of water-based nanofluids containing copper ferrite nanoparticles coated with silica: Experimental data, modeling through enhanced ANN and curve fitting. Int. J. Heat Mass Transf. 2018, 127, 925–935. [Google Scholar] [CrossRef]
- Bahrami, M.; Akbari, M.; Bagherzadeh, S.A.; Karimipour, A.; Afrand, M.; Goodarzi, M. Develop 24 dissimilar ANNs by suitable architectures & training algorithms via sensitivity analysis to better statistical presentation: Measure MSEs between targets & ANN for Fe–CuO/Eg–Water nanofluid. Phys. A Stat. Mech. Appl. 2019, 519, 159–168. [Google Scholar]
- Ghasemi, A.; Hassani, M.; Goodarzi, M.; Afrand, M.; Manafi, S. Appraising influence of COOH-MWCNTs on thermal conductivity of antifreeze using curve fitting and neural network. Phys. A Stat. Mech. Appl. 2019, 514, 36–45. [Google Scholar] [CrossRef]
- Karimipour, A.; Bagherzadeh, S.A.; Goodarzi, M.; Alnaqi, A.A.; Bahiraei, M.; Safaei, M.R.; Shadloo, M.S. Synthesized CuFe2O4/SiO2 nanocomposites added to water/EG: Evaluation of the thermophysical properties beside sensitivity analysis & EANN. Int. J. Heat Mass Transf. 2018, 127, 1169–1179. [Google Scholar]
- Giwa, S.; Sharifpur, M.; Goodarzi, M.; Alsulami, H.; Meyer, J. Influence of base fluid, temperature, and concentration on the thermophysical properties of hybrid nanofluids of alumina–ferrofluid: Experimental data, modeling through enhanced ANN, ANFIS, and curve fitting. J. Therm. Anal. Calorim. 2021, 143, 4149–4167. [Google Scholar] [CrossRef]
- Bagherzadeh, S.A.; D’Orazio, A.; Karimipour, A.; Goodarzi, M.; Bach, Q.-V. A novel sensitivity analysis model of EANN for F-MWCNTs–Fe3O4/EG nanofluid thermal conductivity: Outputs predicted analytically instead of numerically to more accuracy and less costs. Phys. A Stat. Mech. Appl. 2019, 521, 406–415. [Google Scholar] [CrossRef]
- Peng, Y.; Parsian, A.; Khodadadi, H.; Akbari, M.; Ghani, K.; Goodarzi, M.; Bach, Q.-V. Develop optimal network topology of artificial neural network (AONN) to predict the hybrid nanofluids thermal conductivity according to the empirical data of Al2O3–Cu nanoparticles dispersed in ethylene glycol. Phys. A Stat. Mech. Appl. 2020, 549, 124015. [Google Scholar] [CrossRef]
- Ivakhnenko, A.G. Polynomial theory of complex systems. IEEE Trans. Syst. ManCybern. 1971, SMC-1, 364–378. [Google Scholar] [CrossRef] [Green Version]
- Nikolaev, N.; Iba, H. Adaptive Learning of Polynomial Networks: Genetic Programming, Backpropagation and Bayesian Methods; Springer Science & Business Media: Berlin/Heidelberg, Germany, 2006. [Google Scholar]
- Fattahi, H.; Hasanipanah, M.; Zandy Ilghani, N. Investigating Correlation of Physico-Mechanical Parameters and P-Wave Velocity of Rocks: A Comparative Intelligent Study. J. Min. Environ. 2021, 12, 863–875. [Google Scholar]
- Damavandi, M.D.; Mousavi, S.M.; Safikhani, H. Pareto optimal design of swirl cooling chambers with tangential injection using CFD, GMDH-type of ANN and NSGA-II algorithm. Int. J. Therm. Sci. 2017, 122, 102–114. [Google Scholar] [CrossRef]
- Damavandi, M.D.; Forouzanmehr, M.; Safikhani, H. Modeling and Pareto based multi-objective optimization of wavy fin-and-elliptical tube heat exchangers using CFD and NSGA-II algorithm. Appl. Therm. Eng. 2017, 111, 325–339. [Google Scholar] [CrossRef]
- Bagheri-Esfe, H.; Safikhani, H. Modeling of deviation angle and performance losses in wet steam turbines using GMDH-type neural networks. Neural Comput. Appl. 2017, 28, 489–501. [Google Scholar] [CrossRef]
- Safikhani, H. Modeling and multi-objective Pareto optimization of new cyclone separators using CFD, ANNs and NSGA II algorithm. Adv. Powder Technol. 2016, 27, 2277–2284. [Google Scholar] [CrossRef]
- Ahmadi, M.H.; Mohseni-Gharyehsafa, B.; Ghazvini, M.; Goodarzi, M.; Jilte, R.D.; Kumar, R. Comparing various machine learning approaches in modeling the dynamic viscosity of CuO/water nanofluid. J. Therm. Anal. Calorim. 2020, 139, 2585–2599. [Google Scholar] [CrossRef]
- Deb, K.; Pratap, A.; Agarwal, S.; Meyarivan, T. A fast and elitist multiobjective genetic algorithm: NSGA-II. IEEE Trans. Evol. Comput. 2002, 6, 182–197. [Google Scholar] [CrossRef] [Green Version]
- Verma, S.; Pant, M.; Snasel, V. A Comprehensive Review on NSGA-II for Multi-Objective Combinatorial Optimization Problems. IEEE Access 2021, 9, 57757–57791. [Google Scholar] [CrossRef]
- Esfe, M.H.; Motallebi, S.M. Optimization and modeling of thermal conductivity and viscosity of Cu/engine oil nanofluids by NSGA-II using RSM. Math. Methods Appl. Sci. 2021, 44, 7799–7810. [Google Scholar] [CrossRef]
- Li, Y.; Wang, S.; Duan, X.; Liu, S.; Liu, J.; Hu, S. Multi-objective energy management for Atkinson cycle engine and series hybrid electric vehicle based on evolutionary NSGA-II algorithm using digital twins. Energy Convers. Manag. 2021, 230, 113788. [Google Scholar] [CrossRef]
- Yu, R.; Han, H.; Yang, C.; Luo, W. Optimal design and decision making of an air cooling channel with hybrid ribs based on RSM and NSGA-II. J. Therm. Anal. Calorim. 2021, 1–16. [Google Scholar] [CrossRef]
- Vukadinović, A.; Radosavljević, J.; Đorđević, A.; Protić, M.; Petrović, N. Multi-objective optimization of energy performance for a detached residential building with a sunspace using the NSGA-II genetic algorithm. Sol. Energy 2021, 224, 1426–1444. [Google Scholar] [CrossRef]
- Lai, Y.-J.; Liu, T.-Y.; Hwang, C.-L. Topsis for MODM. Eur. J. Oper. Res. 1994, 76, 486–500. [Google Scholar] [CrossRef]
- Opricovic, S.; Tzeng, G.-H. Compromise solution by MCDM methods: A comparative analysis of VIKOR and TOPSIS. Eur. J. Oper. Res. 2004, 156, 445–455. [Google Scholar] [CrossRef]
- Ye, X.; Kang, Y.; Yan, Z.; Chen, B.; Zhong, K. Optimization study of return vent height for an impinging jet ventilation system with exhaust/return-split configuration by TOPSIS method. Build. Environ. 2020, 177, 106858. [Google Scholar] [CrossRef]
- Fetanat, A.; Mofid, H.; Mehrannia, M.; Shafipour, G. Informing energy justice based decision-making framework for waste-to-energy technologies selection in sustainable waste management: A case of Iran. J. Clean. Prod. 2019, 228, 1377–1390. [Google Scholar] [CrossRef]
- Shah, B.; Lakhani, H.; Abhishek, K.; Kumari, S. Application of fuzzy linguistic modeling aggregated with VIKOR for optimal selection of solar power plant site: An empirical study. In Renewable Energy and Climate Change; Springer: Berlin/Heidelberg, Germany, 2020; pp. 119–127. [Google Scholar]
- Kumar, R.; Kaushik, S.; Kumar, R.; Hans, R. Multi-objective thermodynamic optimization of an irreversible regenerative Brayton cycle using evolutionary algorithm and decision making. Ain Shams Eng. J. 2016, 7, 741–753. [Google Scholar] [CrossRef] [Green Version]
- Ahmadi, M.H.; Sayyaadi, H.; Dehghani, S.; Hosseinzade, H. Designing a solar powered Stirling heat engine based on multiple criteria: Maximized thermal efficiency and power. Energy Convers. Manag. 2013, 75, 282–291. [Google Scholar] [CrossRef]


| Nanomaterial | Cp (J kg−1 K−1) | ρ (kg m−3) | k (W m−1 K−1) |
|---|---|---|---|
| Cu | 385 | 8933 | 400 |
| Ag | 235 | 10,500 | 429 |
| CuO | 531.8 | 6320 | 76.5 |
| Al2O3 | 765 | 3970 | 40 |
| Co | 420 | 8900 | 100 |
| Fe3O4 | 670 | 5180 | 80.4 |
| MoS2 | 397.2 | 5060 | 85–110 |
| Optimization Variables | Unit | From | To |
|---|---|---|---|
| Thermal conductivity () | (W m−1 K−1) | 50 | 500 |
| Density () | (kg m−3) | 4000 | 10,000 |
| Specific heat () | (J kg−1 K−1) | 200 | 800 |
| Volume fraction () | - | 0.005 | 0.05 |
| Properties | Unit | Paraffin Wax (PCM) | Water (HTF) |
|---|---|---|---|
| Specific heat, Cp | (J kg−1 K−1) | 2890 | 4182 |
| Density, ρ | (kg m−3) | 800 | 998.2 |
| Thermal conductivity, k | (W m−1 K−1) | 0.12 (l), 0.21 (s) | 0.6 |
| Viscosity, μ | (kg m−1 s−1) | 0.001 × exp(−4.25 + 1790/T) | 0.001003 |
| Melting point, Tm | (K) | 319.15–321.15 | - |
| Latent heat, L | (J kg−1) | 173400 | - |
| Thermal expansion coefficient, β | (K−1) | 0.001 | - |
| Authors | Type of Study | MAPE (%) |
|---|---|---|
| Seddegh et al. [116] | Numerical | 3.95 |
| Experimental | 3.83 | |
| Akgun et al. [117] | Experimental (T13) | 4.79 |
| Experimental (T61) | 4.58 |
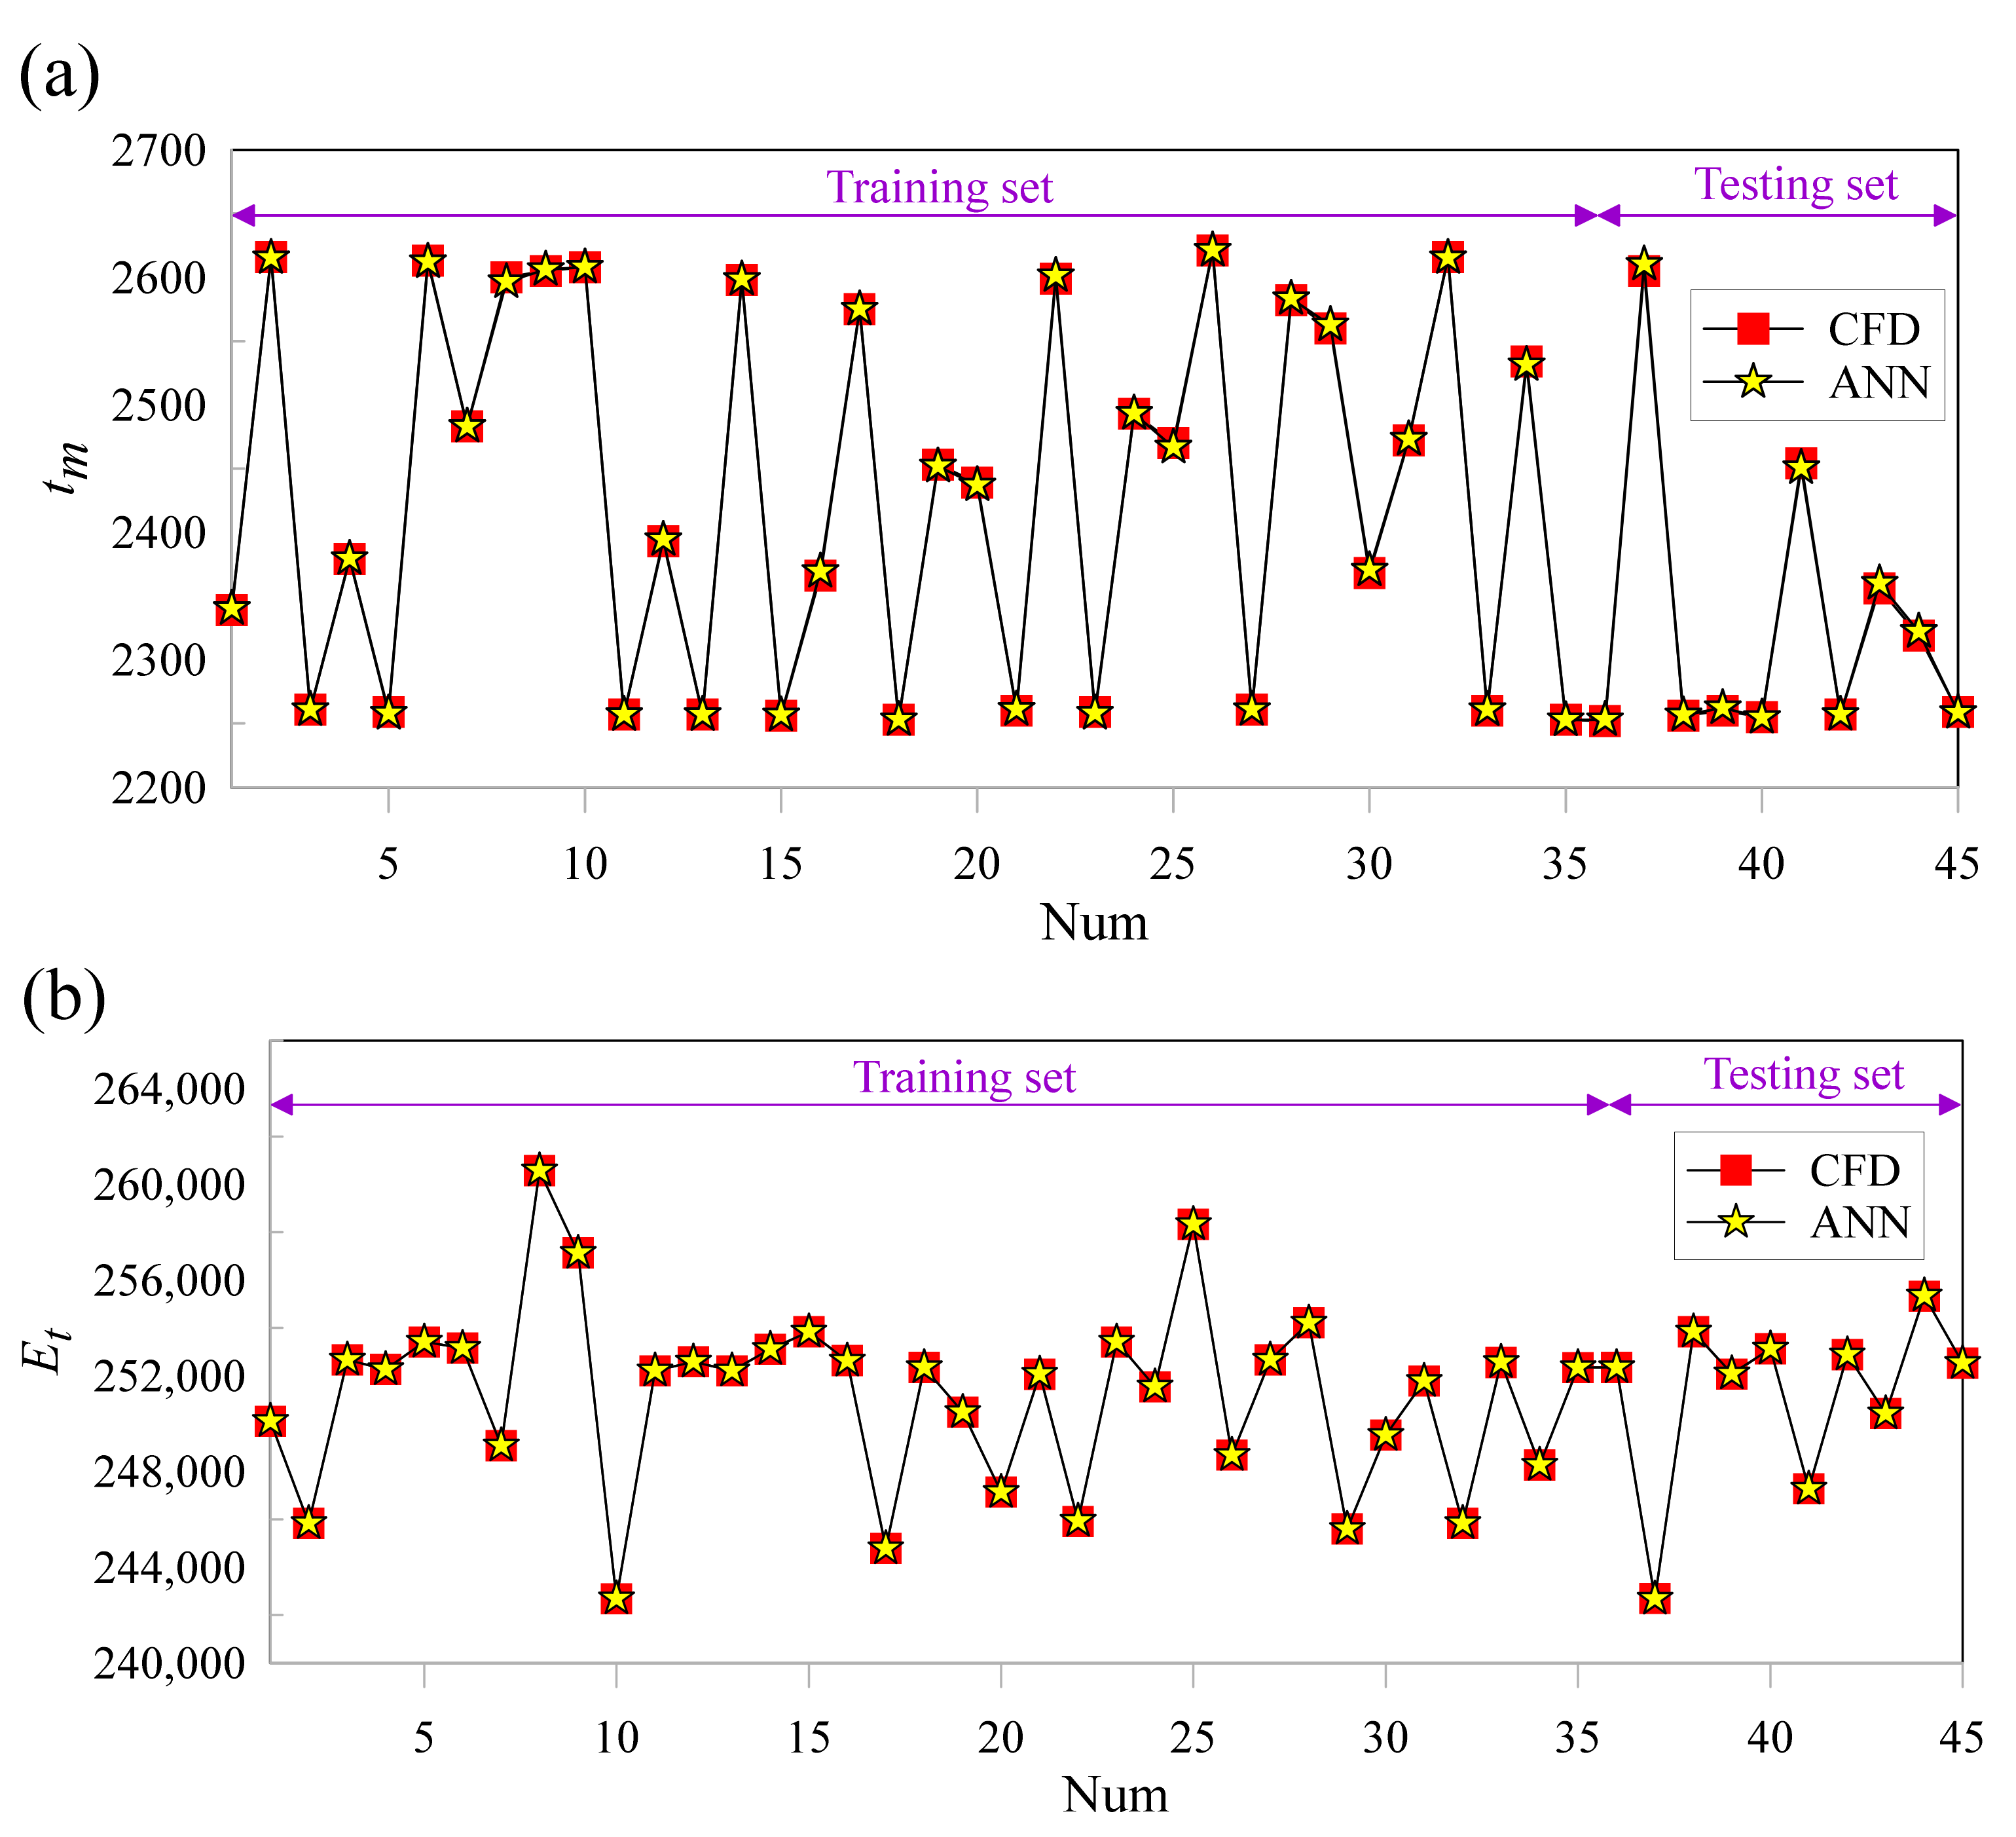
| Objective Functions | Training Datasets | Testing Datasets | ||
|---|---|---|---|---|
| RMSE | R2 | RMSE | R2 | |
| 1.4587 | 0.999898 | 2.7828 | 0.999409 | |
| 4.9103 | 0.999998 | 10.301 | 0.999992 | |
| DM Methods | Points | Weight | Input Variables | Objectives | |||||
|---|---|---|---|---|---|---|---|---|---|
| TOPSIS | A | 0.50 | 0.50 | 0.561 | 311.50 | 9839.86 | 796.60 | 2258.26 | 253,890.7 |
| B | 0.75 | 0.25 | 0.507 | 222.90 | 9836.27 | 777.63 | 2254.30 | 253,765.7 | |
| C | 0.25 | 0.75 | 0.822 | 463.07 | 9988.85 | 797.94 | 2275.79 | 254,306.3 | |
| VIKOR | D | 0.50 | 0.50 | 2.578 | 339.19 | 9984.34 | 797.84 | 2394.01 | 256,906.3 |
| E | 0.75 | 0.25 | 0.540 | 316.79 | 9897.01 | 796.32 | 2256.81 | 253,871.9 | |
| F | 0.25 | 0.75 | 4.656 | 187.24 | 9983.85 | 797.95 | 2563.21 | 259,981.6 | |
| Single-criteria () | G | 1 | 0 | 0.501 | 75.010 | 9738.90 | 324.50 | 2251.14 | 252,633.3 |
| Single-criteria () | H | 0 | 1 | 4.897 | 417.46 | 9845.12 | 799.33 | 2584.94 | 260,094.8 |
| Weight of Objectives | Deviation Index (DI) | ||
|---|---|---|---|
| TOPSIS | VIKOR | ||
| 0.50 | 0.50 | 0.15186 | 0.42798 |
| 0.75 | 0.25 | 0.15212 | 0.15133 |
| 0.25 | 0.75 | 0.16134 | 0.8122 |
| Points | ||||||
|---|---|---|---|---|---|---|
| NSGA-II | CFD | Error (%) | NSGA-II | CFD | Error (%) | |
| A | 2258.26 | 2255.34 | 0.13 | 253,890.7 | 253,850.2 | 0.016 |
| B | 2254.30 | 2250.21 | 0.18 | 253,765.7 | 253,720.4 | 0.018 |
| C | 2275.79 | 2269.17 | 0.29 | 254,306.3 | 254,241.8 | 0.025 |
| D | 2394.01 | 2389.87 | 0.17 | 256,906.3 | 256,840.7 | 0.026 |
| E | 2256.81 | 2254.91 | 0.08 | 253,871.9 | 253,770.1 | 0.040 |
| F | 2563.21 | 2557.44 | 0.23 | 259,981.6 | 259,901.9 | 0.031 |
| G | 2251.14 | 2250.65 | 0.02 | 252,633.3 | 252,545.3 | 0.035 |
| H | 2584.94 | 2587.73 | 0.11 | 260,094.8 | 260,001.5 | 0.036 |
Publisher’s Note: MDPI stays neutral with regard to jurisdictional claims in published maps and institutional affiliations. |
© 2021 by the authors. Licensee MDPI, Basel, Switzerland. This article is an open access article distributed under the terms and conditions of the Creative Commons Attribution (CC BY) license (https://creativecommons.org/licenses/by/4.0/).
Share and Cite
Algarni, M.; Alazwari, M.A.; Safaei, M.R. Optimization of Nano-Additive Characteristics to Improve the Efficiency of a Shell and Tube Thermal Energy Storage System Using a Hybrid Procedure: DOE, ANN, MCDM, MOO, and CFD Modeling. Mathematics 2021, 9, 3235. https://doi.org/10.3390/math9243235
Algarni M, Alazwari MA, Safaei MR. Optimization of Nano-Additive Characteristics to Improve the Efficiency of a Shell and Tube Thermal Energy Storage System Using a Hybrid Procedure: DOE, ANN, MCDM, MOO, and CFD Modeling. Mathematics. 2021; 9(24):3235. https://doi.org/10.3390/math9243235
Chicago/Turabian StyleAlgarni, Mohammed, Mashhour A. Alazwari, and Mohammad Reza Safaei. 2021. "Optimization of Nano-Additive Characteristics to Improve the Efficiency of a Shell and Tube Thermal Energy Storage System Using a Hybrid Procedure: DOE, ANN, MCDM, MOO, and CFD Modeling" Mathematics 9, no. 24: 3235. https://doi.org/10.3390/math9243235
APA StyleAlgarni, M., Alazwari, M. A., & Safaei, M. R. (2021). Optimization of Nano-Additive Characteristics to Improve the Efficiency of a Shell and Tube Thermal Energy Storage System Using a Hybrid Procedure: DOE, ANN, MCDM, MOO, and CFD Modeling. Mathematics, 9(24), 3235. https://doi.org/10.3390/math9243235