
Applications of Discrete Wavelet Transform for Feature Extraction to Increase the Accuracy of Monitoring Systems of Liquid Petroleum Products

 , , and
Abstract
:1. Introduction
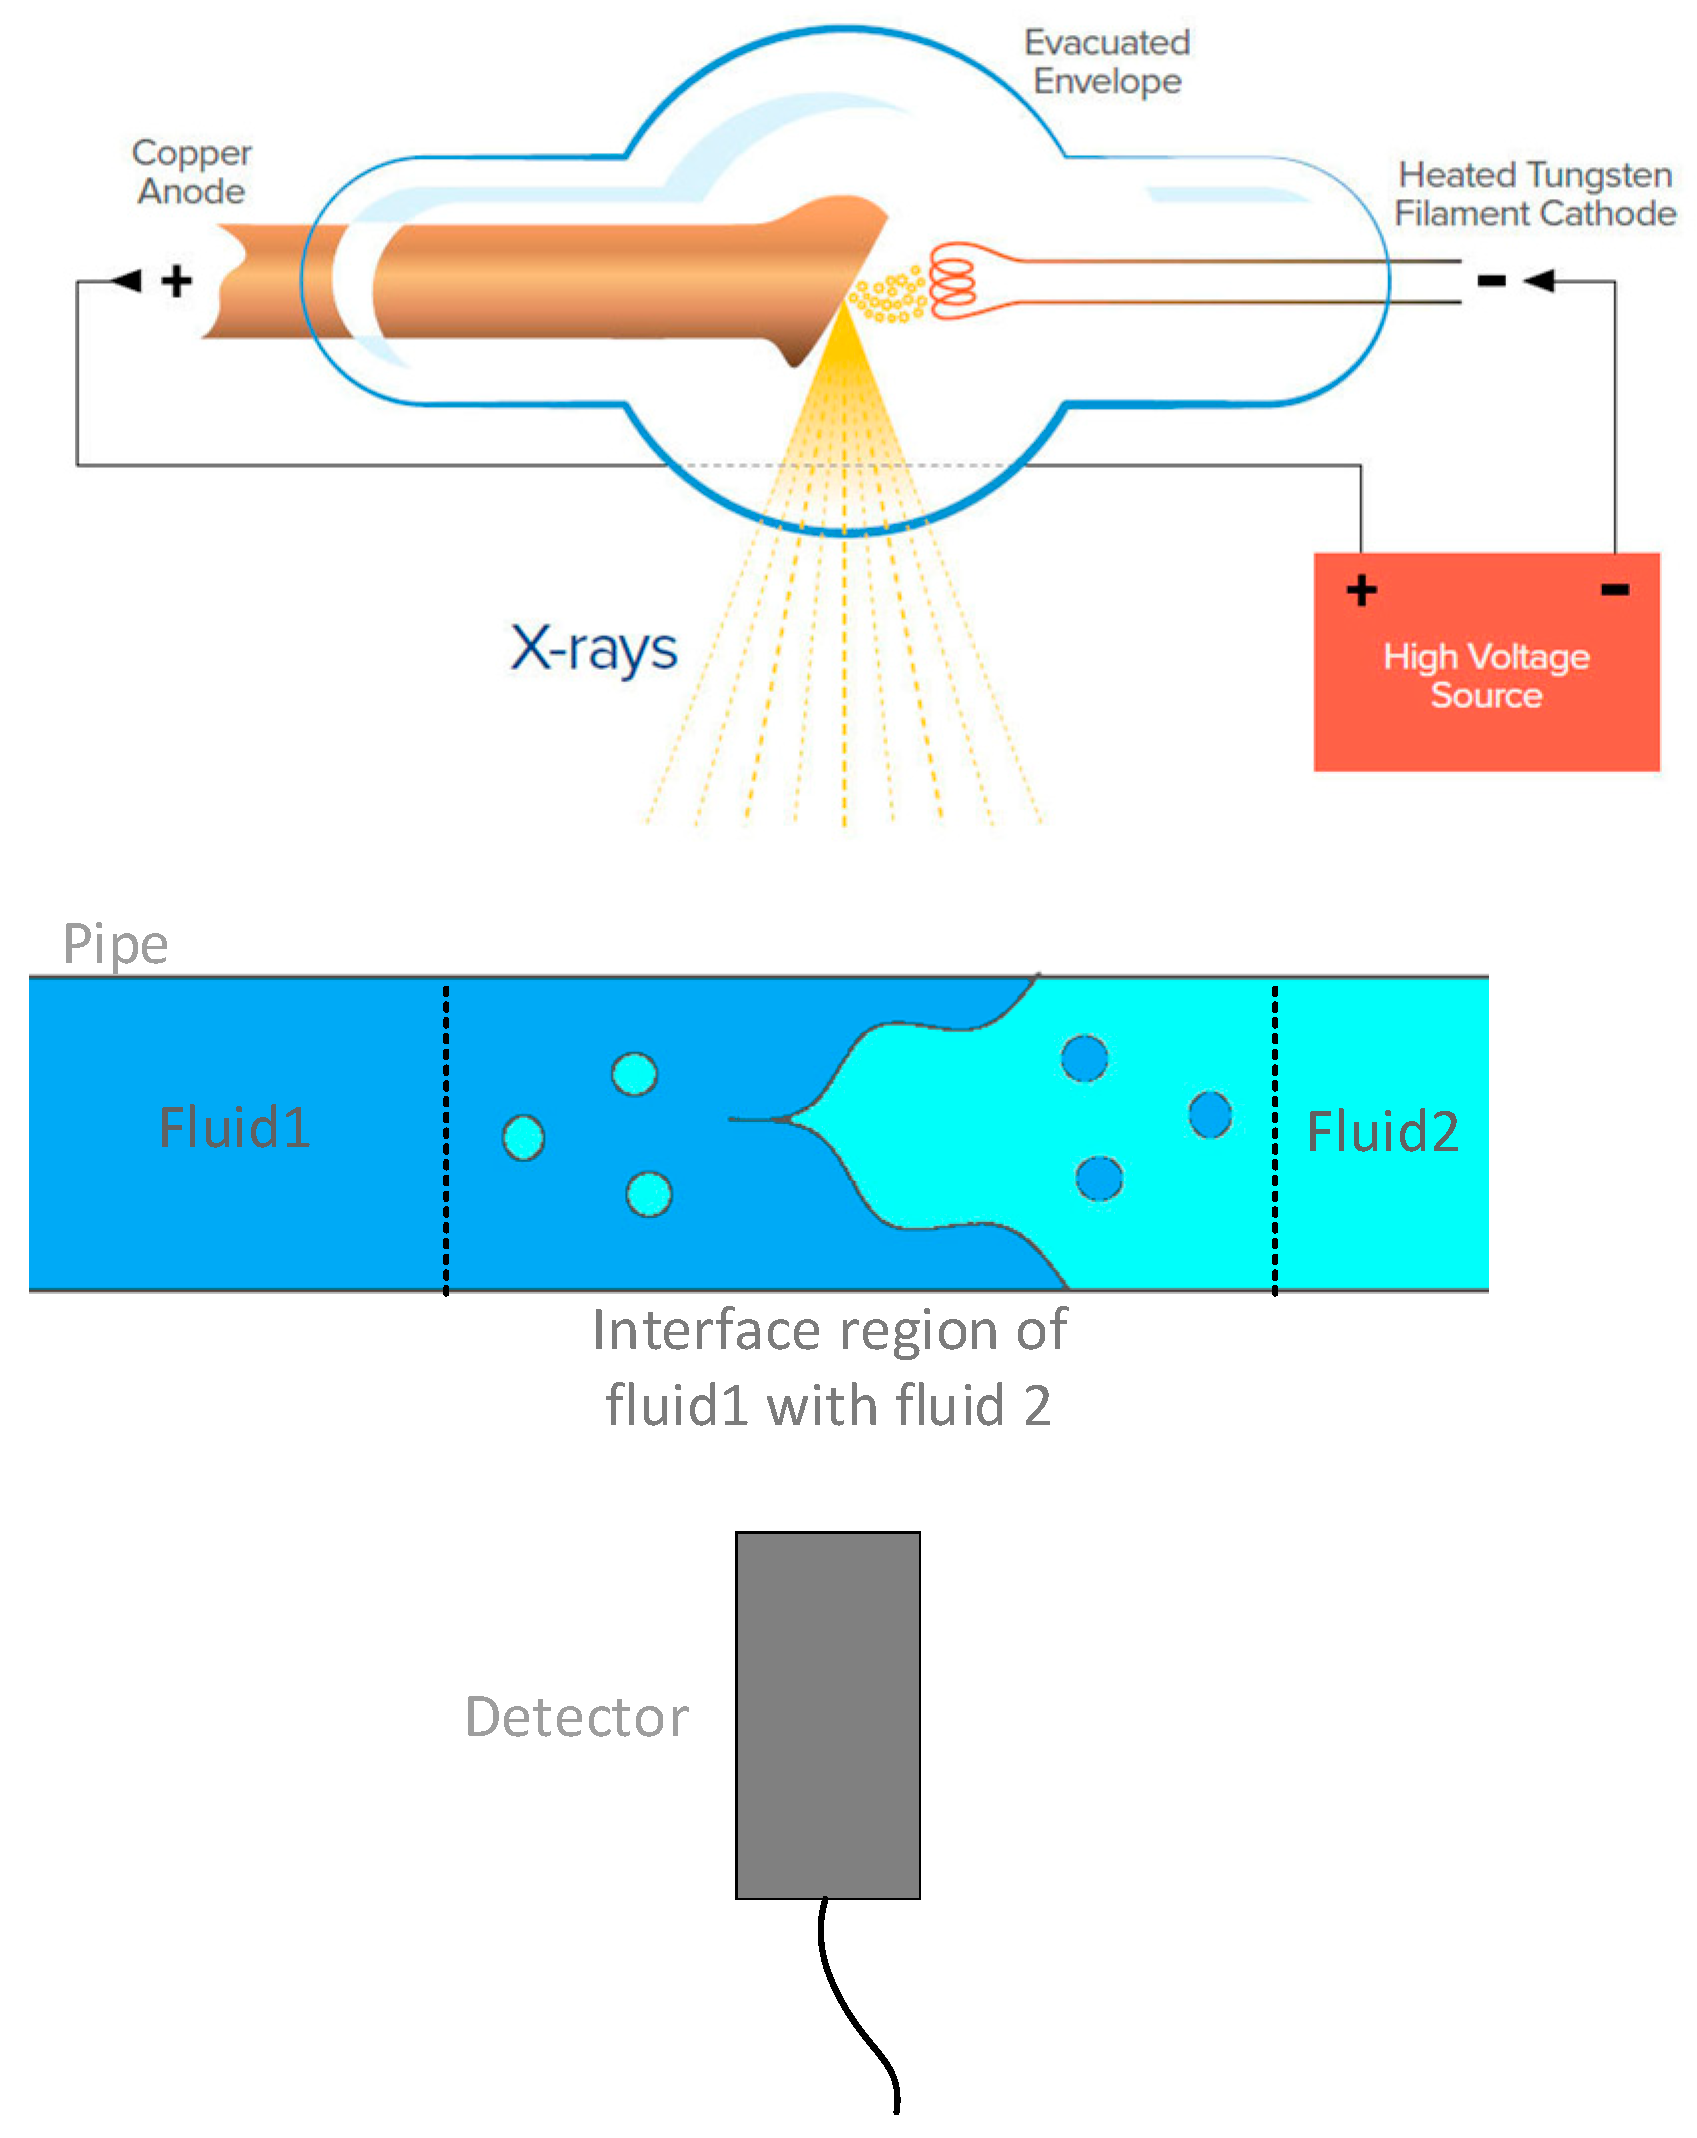
2. Simulation System
3. Discrete Wavelet Transform
4. MLP Neural Network
5. Result and Discussion
6. Conclusions
Author Contributions
Funding
Institutional Review Board Statement
Informed Consent Statement
Data Availability Statement
Conflicts of Interest
References
- Salgado, C.M.; Brandão, L.E.B.; Conti, C.C.; Salgado, W.L. Density prediction for petroleum and derivatives by gamma-ray attenuation and artificial neural networks. Appl. Radiat. Isot. 2016, 116, 143–149. [Google Scholar] [CrossRef] [PubMed]
- Salgado, W.L.; Dam, R.S.; Barbosa, C.M.; da Silva, A.X.; Salgado, C.M. Monitoring system of oil by-products interface in pipelines using the gamma radiation attenuation. Appl. Radiat. Isot. 2020, 160, 109125. [Google Scholar] [CrossRef]
- Åbro, E.; Johansen, G.A. Improved void fraction determination by means of multibeam gamma-ray attenuation measurements. Flow Meas. Instrum. 1999, 10, 99–108. [Google Scholar] [CrossRef]
- Nazemi, E.; Feghhi, S.A.H.; Roshani, G.H.; Peyvandi, R.G.; Setayeshi, S. Precise void fraction measurement in two-phase flows independent of the flow regime using gamma-ray attenuation. Nucl. Eng. Technol. 2016, 48, 64–71. [Google Scholar] [CrossRef] [Green Version]
- Roshani, G.H.; Nazemi, E.; Feghhi, S.A.H. Investigation of using 60Co source and one detector for determining the flow regime and void fraction in gas–liquid two-phase flows. Flow Meas. Instrum. 2016, 50, 73–79. [Google Scholar] [CrossRef]
- Chunguo, J.; Qiuguo, B. Flow regime identification of gas/liquid two-phase flow in vertical pipe using RBF neural networks. In Proceedings of the 2009 Chinese Control and Decision Conference, Guilin, China, 17–19 June 2009; IEEE: Piscataway, NJ, USA, 2009; pp. 5143–5147. [Google Scholar]
- Peyvandi, R.G.; Rad, S.I. Application of artificial neural networks for the prediction of volume fraction using spectra of gamma rays backscattered by three-phase flows. Eur. Phys. J. Plus 2017, 132, 1–8. [Google Scholar]
- Roshani, G.H.; Nazemi, E.; Roshani, M.M. Intelligent recognition of gas-oil-water three-phase flow regime and determination of volume fraction using radial basis function. Flow Meas. Instrum. 2017, 54, 39–45. [Google Scholar] [CrossRef]
- Roshani, G.H.; Nazemi, E.; Roshani, M.M. Identification of flow regime and estimation of volume fraction independent of liquid phase density in gas-liquid two-phase flow. Prog. Nucl. Energy 2017, 98, 29–37. [Google Scholar] [CrossRef]
- Roshani, G.H.; Nazemi, E.; Feghhi, S.A.H.; Setayeshi, S. Flow regime identification and void fraction prediction in two-phase flows based on gamma ray attenuation. Measurement 2015, 62, 25–32. [Google Scholar] [CrossRef]
- Nazemi, E.; Roshani, G.H.; Feghhi, S.A.H.; Setayeshi, S.; Zadeh, E.E.; Fatehi, A. Optimization of a method for identifying the flow regime and measuring void fraction in a broad beam gamma-ray attenuation technique. Int. J. Hydrog. Energy 2016, 41, 7438–7444. [Google Scholar] [CrossRef]
- Roshani, M.; Phan, G.T.; Ali, P.J.M.; Roshani, G.H.; Hanus, R.; Duong, T.; Corniani, E.; Nazemi, E.; Kalmoun, E.M. Evalu-ation of flow pattern recognition and void fraction measurement in two phase flow independent of oil pipeline’s scale layer thickness. Alex. Eng. J. 2021, 60, 1955–1966. [Google Scholar] [CrossRef]
- Roshani, M.; Phan, G.; Faraj, R.H.; Phan, N.-H.; Roshani, G.H.; Nazemi, B.; Corniani, E.; Nazemi, E. Proposing a gamma ra-diation based intelligent system for simultaneous analyzing and detecting type and amount of petroleum by-products. Nucl. Eng. Technol. 2021, 53, 1277–1283. [Google Scholar] [CrossRef]
- Karami, A.; Roshani, G.H.; Khazaei, A.; Nazemi, E.; Fallahi, M. Investigation of different sources in order to optimize the nuclear metering system of gas–oil–water annular flows. Neural Comput. Appl. 2020, 32, 3619–3631. [Google Scholar] [CrossRef]
- Roshani, M.; Sattari, M.A.; Ali, P.J.M.; Roshani, G.H.; Nazemi, B.; Corniani, E.; Nazemi, E. Application of GMDH neural network technique to improve measuring precision of a simplified photon attenuation based two-phase flowmeter. Flow Meas. Instrum. 2020, 75, 101804. [Google Scholar] [CrossRef]
- Hanus, R.; Zych, M.; Petryka, L.; Jaszczur, M.; Hanus, P. Signals features extraction in liquid-gas flow measurements using gamma densitometry. Part 1: Time domain. In EPJ Web of Conferences; EDP Sciences: Les Ulis, France, 2016; Volume 114, p. 02035. [Google Scholar] [CrossRef] [Green Version]
- Sattari, M.A.; Roshani, G.H.; Hanus, R.; Nazemi, E. Applicability of time-domain feature extraction methods and artificial intelligence in two-phase flow meters based on gamma-ray absorption technique. Measurement 2021, 168, 108474. [Google Scholar] [CrossRef]
- Hanus, R.; Zych, M.; Petryka, L.; Jaszczur, M.; Hanus, P. Signals features extraction in liquid-gas flow measurements using gamma densitometry. Part 2: Frequency domain. In EPJ Web of Conferences; EDP Sciences: Les Ulis, France, 2016; Volume 114, p. 02036. [Google Scholar] [CrossRef] [Green Version]
- Hosseini, S.; Roshani, G.H.; Setayeshi, S. Precise gamma based two-phase flow meter using frequency feature extraction and only one detector. Flow Meas. Instrum. 2020, 72, 101693. [Google Scholar] [CrossRef]
- Sattari, M.A.; Roshani, G.H.; Hanus, R. Improving the structure of two-phase flow meter using feature extraction and GMDH neural network. Radiat. Phys. Chem. 2020, 171, 108725. [Google Scholar] [CrossRef]
- Basahel, A.; Sattari, M.A.; Taylan, O.; Nazemi, E. Application of Feature Extraction and Artificial Intelligence Techniques for Increasing the Accuracy of X-ray Radiation Based Two Phase Flow Meter. Mathematics 2021, 9, 1227. [Google Scholar] [CrossRef]
- Roshani, G.; Nazemi, E. Intelligent densitometry of petroleum products in stratified regime of two phase flows using gamma ray and neural network. Flow Meas. Instrum. 2017, 58, 6–11. [Google Scholar] [CrossRef]
- Alamoudi, M.; Sattari, M.A.; Balubaid, M.; Eftekhari-Zadeh, E.; Nazemi, E.; Taylan, O.; Kalmoun, E.M. Application of Gamma Attenuation Technique and Artificial Intelligence to Detect Scale Thickness in Pipelines in Which Two-Phase Flows with Different Flow Regimes and Void Fractions Exist. Symmetry 2021, 13, 1198. [Google Scholar] [CrossRef]
- Roshani, G.H.; Ali, P.J.M.; Mohammed, S.; Hanus, R.; Abdulkareem, L.; Alanezi, A.A.; Nazemi, E.; Eftekhari-Zadeh, E.; Kalmoun, E.M. Feasibility Study of Using X-ray Tube and GMDH for Measuring Volume Fractions of Annular and Stratified Regimes in Three-Phase Flows. Symmetry 2021, 13, 613. [Google Scholar] [CrossRef]
- Roshani, M.; Phan, G.; Roshani, G.H.; Hanus, R.; Nazemi, B.; Corniani, E.; Nazemi, E. Combination of X-ray tube and GMDH neural network as a nondestructive and potential technique for measuring characteristics of gas-oil–water three phase flows. Measurement 2021, 168, 108427. [Google Scholar] [CrossRef]
- Hosseini, S.; Taylan, O.; Abusurrah, M.; Akilan, T.; Nazemi, E.; Eftekhari-Zadeh, E.; Bano, F.; Roshani, G.H. Application of Wavelet Feature Extraction and Artificial Neural Networks for Improving the Performance of Gas–Liquid Two-Phase Flow Meters Used in Oil and Petrochemical Industries. Polymers 2021, 13, 3647. [Google Scholar] [CrossRef] [PubMed]
- Hanus, R.; Zych, M.; Wilk, B.; Jaszczur, M.; Świsulski, D. Signals features extraction in radioisotope liquid-gas flow measurements using wavelet analysis. In EPJ Web of Conferences; EDP Sciences: Les Ulis, France, 2019; Volume 213, p. 02023. [Google Scholar]
- Yu, G.; Gu, J.; Hou, L.; Li, Z.; Wang, Y.; Zhang, Y. Application of wavelet transform in γ-ray spectra analysis. Sci. China Phys. Mech. Astron. 2013, 56, 1735–1739. [Google Scholar] [CrossRef]
- Zych, M.; Hanus, R.; Wilk, B.; Petryka, L.; Świsulski, D. Comparison of noise reduction methods in radiometric correlation measurements of two-phase liquid-gas flows. Measurement 2018, 129, 288–295. [Google Scholar] [CrossRef]
- Brown, F.B.; Barrett, R.F.; Booth, T.E.; Bull, J.S.; Cox, L.J.; Forster, R.A.; Goorley, T.J.; Mosteller, R.D.; Post, S.E.; Prael, R.E.; et al. MCNP™ version 5. Nucl. Instrum. Methods Phys. Res. Sect. B Beam Interact. Mater. At. 2004, 213, 82–86. [Google Scholar]
- Roshani, G.H.; Feghhi, S.A.H.; Mahmoudi-Aznaveh, A.; Nazemi, E.; Adineh-Vand, A. Precise volume fraction prediction in oil–water–gas multiphase flows by means of gamma-ray attenuation and artificial neural networks using one detector. Measurement 2014, 51, 34–41. [Google Scholar] [CrossRef]
- Roshani, G.H.; Nazemi, E.; Roshani, M.M. Flow regime independent volume fraction estimation in three-phase flows using dual-energy broad beam technique and artificial neural network. Neural Comput. Appl. 2016, 28, 1265–1274. [Google Scholar] [CrossRef]
- Hernandez, A.M.; Boone, J.M. Tungsten anode spectral model using interpolating cubic splines: Unfiltered X-ray spectra from 20 kV to 640 kV. Med. Phys. 2014, 41, 042101. [Google Scholar] [CrossRef] [PubMed] [Green Version]
- Übeylı, E.D.; Güler, İ. Feature extraction from Doppler ultrasound signals for automated diagnostic systems. Comput. Biol. Med. 2005, 35, 735–764. [Google Scholar] [CrossRef]
- Daubechies, I. The wavelet transform, time-frequency localization and signal analysis. IEEE Trans. Inform. Theory 1990, 36, 961–1005. [Google Scholar] [CrossRef] [Green Version]
- Soltani, S. On the use of the wavelet decomposition for time series prediction. Neurocomputing 2002, 48, 267–277. [Google Scholar] [CrossRef]
- Khounani, Z.; Hosseinzadeh-Bandbafha, H.; Nazemi, F.; Shaeifi, M.; Karimi, K.; Tabatabaei, M.; Aghbashlo, M.; Lam, S.S. Exergy analysis of a whole-crop safflower biorefinery: A step towards reducing agricultural wastes in a sustainable manner. J. Environ. Manag. 2021, 279, 111822. [Google Scholar] [CrossRef]
- Sattari, M.T.; Avram, A.; Apaydin, H.; Matei, O. Soil Temperature Estimation with Meteorological Parameters by Using Tree-Based Hybrid Data Mining Models. Mathematics 2020, 8, 1407. [Google Scholar] [CrossRef]
- Hosseinzadeh-Bandbafha, H.; Nazemi, F.; Khounani, Z.; Ghanavati, H.; Shafiei, M.; Karimi, K.; Lam, S.S.; Aghbashlo, M.; Tabatabaei, M. Safflower-based biorefinery producing a broad spectrum of biofuels and biochemicals: A life cycle assessment perspective. Sci. Total Environ. 2022, 802, 149842. [Google Scholar] [CrossRef] [PubMed]
- Roshani, G.H.; Roshani, S.; Nazemi, E.; Roshani, S. Online measuring density of oil products in annular regime of gas-liquid two phase flows. Measurement 2018, 129, 296–301. [Google Scholar] [CrossRef]
- Nazemi, F.; Karimi, K.; Denayer, J.F.; Shafiei, M. Techno-economic aspects of different process approaches based on brown macroalgae feedstock: A step toward commercialization of seaweed-based biorefineries. Algal Res. 2021, 58, 102366. [Google Scholar] [CrossRef]
- Razzaq, A.; Wang, Y.; Chupradit, S.; Suksatan, W.; Shahzad, F. Asymmetric inter-linkages between green technology innovation and consumption-based carbon emissions in BRICS countries using quantile-on-quantile framework. Technol. Soc. 2021, 66, 101656. [Google Scholar] [CrossRef]
- Charchi, N.; Li, Y.; Huber, M.; Kwizera, E.A.; Huang, X.; Argyropoulos, C.; Hoang, T. Small mode volume plasmonic film-coupled nanostar resonators. Nanoscale Adv. 2020, 2, 2397–2403. [Google Scholar] [CrossRef] [PubMed]
- Nazemi, E.; Feghhi, S.; Roshani, G.; Setayeshi, S.A.; Peyvandi, R.G. A radiation-based hydrocarbon two-phase flow meter for estimating of phase fraction independent of liquid phase density in stratified regime. Flow Meas. Instrum. 2015, 46, 25–32. [Google Scholar] [CrossRef]
- Roshani, S.; Roshani, S. Design of a high efficiency class-F power amplifier with large signal and small signal measure-ments. Measurement 2020, 149, 106991. [Google Scholar] [CrossRef]
- Pourbemany, J.; Mirjalily, G.; Abouei, J.; Raouf, A.H.F. Load Balanced Ad-Hoc On-Demand Routing Basedon Weighted Mean Queue Length Metric. In Proceedings of the Electrical Engineering (ICEE), Iranian Conference on IEEE, Mashhad, Iran, 8–10 May 2018; pp. 470–475. [Google Scholar]
- Lalbakhsh, A.; Afzal, M.U.; Esselle, K.P.; Manda, K. All-Metal Wideband Frequency-Selective Surface Bandpass Filter for TE and TM polarizations. IEEE Trans. Antennas Propag. 2022, in press. [Google Scholar]
- Pirasteh, A.; Roshani, S.; Roshani, S. A modified class-F power amplifier with miniaturized harmonic control circuit. AEU Int. J. Electron. Commun. 2018, 97, 202–209. [Google Scholar] [CrossRef]
- Lalbakhsh, A.; Afzal, M.U.; Hayat, T.; Esselle, K.P.; Manda, K. All-metal wideband metasurface for near-field transformation of medium-to-high gain electromagnetic sources. Sci. Rep. 2021, 11, 9421. [Google Scholar] [CrossRef] [PubMed]
- Jamshidi, M.B.; Roshani, S.; Talla, J.; Roshani, S.; Peroutka, Z. Size reduction and performance improvement of a microstrip Wilkinson power divider using a hybrid design technique. Sci. Rep. 2021, 11, 7773. [Google Scholar] [CrossRef] [PubMed]
- Lalbakhsh, A.; Alizadeh, S.M.; Ghaderi, A.; Golestanifar, A.; Mohamadzade, B.; Jamshidi, M.B.; Mandal, K.; Mohyuddin, W. A Design of a Dual-Band Bandpass Filter Based on Modal Analysis for Modern Communication Systems. Electronics 2020, 9, 1770. [Google Scholar] [CrossRef]
- Jamshidi, M.B.; Siahkamari, H.; Roshani, S.; Roshani, S. A compact Gysel power divider design using U-shaped and T-shaped reso-nators with harmonics suppression. Electromagnetics 2019, 39, 491–504. [Google Scholar] [CrossRef]
- Roshani, S.; Roshani, S.; Zarinitabar, A. A modified Wilkinson power divider with ultra harmonic suppression using open stubs and lowpass filters. Analog. Integr. Circuits Signal Process. 2019, 98, 395–399. [Google Scholar] [CrossRef]
- Lalbakhsh, A.; Mohamadpour, G.; Roshani, S.; Ami, M.; Roshani, S.; Sayem, A.S.M.; Alibakhshikenari, M.; Koziel, S. Design of a compact planar transmission line for miniaturized rat-race coupler with harmonics suppression. IEEE Access 2021, 9, 129207–129217. [Google Scholar] [CrossRef]
- Roshani, S.; Roshani, S. Design of a very compact and sharp bandpass diplexer with bended lines for GSM and LTE applica-tions. AEU. Int. J. Electron. Commun. 2019, 99, 354–360. [Google Scholar] [CrossRef]
- Lalbakhsh, A.; Jamshidi, M.B.; Siahkamari, H.; Ghaderi, A.; Golestanifar, A.; Linhart, R.; Talla, J.; Simorangkir, R.B.; Mandal, K. A Compact Lowpass Filter for Satellite Communication Systems Based on Transfer Function Analysis. AEU-Int. J. Electron. Commun. 2020, 124, 153318. [Google Scholar] [CrossRef]
- Roshani, S.; Roshani, S. A compact coupler design using meandered line compact microstrip resonant cell (MLCMRC) and bended lines. Wirel. Netw. 2021, 27, 677–684. [Google Scholar] [CrossRef]
- Pirasteh, A.; Roshani, S.; Roshani, S. Compact microstrip lowpass filter with ultrasharp response using a square-loaded mod-ified T-shaped resonator. Turk. J. Electr. Eng. Comput. Sci. 2018, 26, 1736–1746. [Google Scholar] [CrossRef]
- Nouriani, A.; McGovern, R.A.; Rajamani, R. Step Length Estimation Using Inertial Measurements Units. In Proceedings of the 2021 American Control Conference (ACC), New Orleans, LA, USA, 25–28 May 2021; IEEE: Piscataway, NJ, USA, 2021; pp. 666–671. [Google Scholar]
- Johar, M.G.M.; Ab Yajid, M.S.; Khatibi, A. Data Mining Technology and its Applications for Sales Productivity Analysis. Syst. Rev. Pharm. 2020, 11, 626–632. [Google Scholar]
- Ghanbari, B. A new model for investigating the transmission of infectious diseases in a prey-predator system using a non-singular fractional derivative. Math. Methods Appl. Sci. 2021. [Google Scholar] [CrossRef]
- Nabti, A.; Ghanbari, B. Global stability analysis of a fractional SVEIR epidemic model. Math. Methods Appl. Sci. 2021, 44, 8577–8597. [Google Scholar] [CrossRef]
- Alkabaa, A.S.; Nazemi, E.; Taylan, O.; Kalmoun, E.M. Application of Artificial Intelligence and Gamma Attenuation Techniques for Predicting Gas–Oil–Water Volume Fraction in Annular Regime of Three-Phase Flow Independent of Oil Pipeline’s Scale Layer. Mathematics 2021, 9, 1460. [Google Scholar] [CrossRef]
- Ghanbari, B. On the modeling of the interaction between tumor growth and the immune system using some new frac-tional and fractional-fractal operators. Adv. Differ. Equ. 2020, 2020, 585. [Google Scholar] [CrossRef]
- Djilali, S.; Ghanbari, B. The influence of an infectious disease on a prey-predator model equipped with a fractional-order derivative. Adv. Differ. Equ. 2021, 2021, 20. [Google Scholar] [CrossRef]
- Ghanbari, B. Chaotic behaviors of the prevalence of an infectious disease in a prey and predator system using fractional derivatives. Math. Methods Appl. Sci. 2021, 44, 9998–10013. [Google Scholar] [CrossRef]
- Ghanbari, B. A fractional system of delay differential equation with nonsingular kernels in modeling hand-foot-mouth disease. Adv. Differ. Equ. 2020, 2020, 536. [Google Scholar] [CrossRef]
- Ataii, F.; Khorasgani, S.M.S.; Abbasi, B.; Ghaffari, M. The Solution of Routing Problem of Vehicle with Capacity Aiming to Minimize Costs and Increase the Level of Satisfaction with the Use of Genetic Algorithms. Fen Bilimleri Derg. (CFD) 2015, 36. Available online: http://citeseerx.ist.psu.edu/viewdoc/download?doi:10.1.1.922.2811&rep=rep1&type=pdf (accessed on 19 October 2021).
- Khorasgani, S.M.S.; Ghaffari, M. Developing a cellular manufacturing model considering the alternative routes, tool assignment, and machine reliability. J. Ind. Eng. Int. 2018, 14, 627–636. [Google Scholar] [CrossRef] [Green Version]
- Moradi, M.J.; Hariri-Ardebili, M.A. Developing a Library of Shear Walls Database and the Neural Network Based Predictive Meta-Model. Appl. Sci. 2019, 9, 2562. [Google Scholar] [CrossRef] [Green Version]
- Nazemi, B.; Rafiean, M. Forecasting house prices in Iran using GMDH. Int. J. Hous. Mark. Anal. 2021, 14, 555–568. [Google Scholar] [CrossRef]
- Nazemi, B.; Rafiean, M. Modelling the affecting factors of housing price using GMDH-type artificial neural networks in Isfa-han city of Iran. Int. J. Hous. Mark. Anal. 2021. [Google Scholar] [CrossRef]
- Iyiola, K.; Rjoub, H. Using conflict management in improving owners and contractors relationship quality in the construction industry: The mediation role of trust. SAGE Open 2020, 10, 2158244019898834. [Google Scholar] [CrossRef]
- Reyes-Campos, J.; Alor-Hernández, G.; Machorro-Cano, I.; Olmedo-Aguirre, J.O.; Sánchez-Cervantes, J.L.; Rodríguez-Mazahua, L. Discovery of Resident Behavior Patterns Using Machine Learning Techniques and IoT Paradigm. Mathematics 2021, 9, 219. [Google Scholar] [CrossRef]
- de la Cruz, R.; Padilla, O.; Valle, M.A.; Ruz, G.A. Modeling Recidivism through Bayesian Regression Models and Deep Neural Networks. Mathematics 2021, 9, 639. [Google Scholar] [CrossRef]
- Yoder Clark, A.; Blumenfeld, N.; Lal, E.; Darbari, S.; Northwood, S.; Wadpey, A. Using K-Means Cluster Analysis and Decision Trees to Highlight Significant Factors Leading to Homelessness. Mathematics 2021, 9, 2045. [Google Scholar] [CrossRef]
- Zhuang, Y.; Yang, S.; Chupradit, S.; Nawaz, M.A.; Xiong, R.; Koksal, C. A nexus between macroeconomic dynamics and trade openness: Moderating role of institutional quality. Bus. Process. Manag. J. 2021, 27, 1703–1719. [Google Scholar] [CrossRef]
- Alazzawi, F.J.I.; Shannaq, B. Machine learning Model for Generating Software Engineering Work Ethic’s Course Syllabus Designed for Iraq’s Work Environment. Mach. Learn. 2020, 29, 14794–14805. [Google Scholar]
- Roshani, G.; Nazemi, E.; Roshani, M. Usage of two transmitted detectors with optimized orientation in order to three phase flow me-tering. Measurement 2017, 100, 122–130. [Google Scholar] [CrossRef]
- Zych, M.; Petryka, L.; Kępiński, J.; Hanus, R.; Bujak, T.; Puskarczyk, E. Radioisotope investigations of compound two-phase flows in an open channel. Flow Meas. Instrum. 2014, 35, 11–15. [Google Scholar] [CrossRef]
- Golijanek-Jędrzejczyk, A.; Mrowiec, A.; Hanus, R.; Zych, M.; Heronimczak, M.; Świsulski, D. The assessment of metrological properties of segmental orifice based on simulations and experiments. Measurement 2021, 181, 109601. [Google Scholar] [CrossRef]
- Vlasák, P.; Chára, Z.; Matoušek, V.; Konfršt, J.; Kesely, M. Experimental investigation of fine-grained settling slurry flow behaviour in inclined pipe sections. J. Hydrol. Hydromech. 2019, 67, 113–120. [Google Scholar] [CrossRef] [Green Version]
- Karami, A.; Roshani, G.H.; Nazemi, E.; Roshani, S. Enhancing the performance of a dual-energy gamma ray based three-phase flow meter with the help of grey wolf optimization algorithm. Flow Meas. Instrum. 2018, 64, 164–172. [Google Scholar] [CrossRef]
- Golmohammadi, A.; Bani-Asadi, H.; Esmaeeli, H.; Hadian, H.; Bagheri, F. Facility layout for cellular manufacturing system under dynamic conditions. Decis. Sci. Lett. 2016, 5, 407–416. [Google Scholar] [CrossRef]
- Khalaj, O.; Jamshidi, M.; Saebnoori, E.; Mašek, B.; Štadler, C.; Svoboda, J. Hybrid Machine Learning Techniques and Computational Mechanics: Estimating the Dynamic Behavior of Oxide Precipitation Hardened Steel; IEEE: Piscataway, NJ, USA, 2021. [Google Scholar]
- Nouriani, A.; Moradi, H. Smooth switching in power control of wind turbines using a combination strategy of hysteresis and modified middle regions. Sustain. Energy Technol. Assess. 2020, 37, 100585. [Google Scholar] [CrossRef]
- Jafarian-Namin, S.; Goli, A.; Qolipour, M.; Mostafaeipour, A.; Golmohammadi, A.M. Forecasting the wind power generation using Box-Jenkins and hybrid artificial intelligence: A case study. Int. J. Energy Sect. Manag. 2019, 13, 1038–1062. [Google Scholar] [CrossRef]
- Nouriani, A.; Moradi, H. Variable speed wind turbine power control: A comparison between multiple MPPT based methods. Int. J. Dyn. Control. 2021, 1–14. [Google Scholar] [CrossRef]
- Wu, H.; Zhang, F.; Zhang, Z. Fundamental spray characteristics of air-assisted injection system using aviation kerosene. Fuel 2021, 286, 119420. [Google Scholar] [CrossRef]
- Bhaskaran, S.; Marappan, R.; Santhi, B. Design and Analysis of a Cluster-Based Intelligent Hybrid Recommendation System for E-Learning Applications. Mathematics 2021, 9, 197. [Google Scholar] [CrossRef]
- Roshani, S.; Roshani, S. Two-Section Impedance Transformer Design and Modeling for Power Amplifier Applications. Appl. Comput. Electromagn. Soc. J. 2017, 32, 1042–1047. [Google Scholar]
- Mahmudova, S. Exploration of Intellectual Software Systems and Development of Conceptual Model. Rev. Comput. Eng. Res. 2020, 7, 1–11. [Google Scholar] [CrossRef]
- Alkawaz, M.H.; Veeran, M.T.; Bachok, R. Digital image forgery detection based on expectation maximization algorithm. In Proceedings of the 2020 16th IEEE International Colloquium on Signal Processing & Its Applications (CSPA), Langkawi, Malaysia, 28–29 February 2020; IEEE: Piscataway, NJ, USA, 2020; pp. 102–105. [Google Scholar]
- Elfaki, A.O.; Abouabdalla, O.A.; Fong, S.L.; Johar, G.M.; AIK, K.L.T.; Bachok, R. Review and future directions of the automated validation in software product line engineering. J. Theor. Appl. Inf. Technol. 2012, 42, 75–93. [Google Scholar]
- Jayawardena, C.D.W.; Ahmad, A.; Jaharadak, A.A. Synthesis of digital transformation beyond technology perspective: Digital strategy, leadership & culture. J. Crit. Rev. 2020, 7, 349–357. [Google Scholar]
- Al-Sanjary, O.I.; Ahmed, A.A.; Jaharadak AA, B.; Ali, M.A.; Zangana, H.M. Detection clone an object movement using an optical flow approach. In Proceedings of the 2018 IEEE Symposium on Computer Applications & Industrial Electronics (ISCAIE), Penang, Malaysia, 28–29 April 2018; IEEE: Piscataway, NJ, USA, 2018; pp. 388–394. [Google Scholar]
- Zajmi, L.; Ahmed, F.Y.; Jaharadak, A.A. Concepts, methods, and performances of particle swarm optimization, backpropagation, and neural networks. Appl. Comput. Intell. Soft Comput. 2018, 2018, 9547212. [Google Scholar] [CrossRef]
- Alsunki, A.A.M.; Ali, M.A.; Jaharadak, A.A.; Tahir, N.M. Framework of Software Developers Engagement Antecedents and Productivity-A Review. In Proceedings of the 2020 16th IEEE International Colloquium on Signal Processing & Its Applications (CSPA), Langkawi, Malaysia, 28–29 February 2020; IEEE: Piscataway, NJ, USA, 2020; pp. 302–307. [Google Scholar]
- Shafiei, A.; Jamshidi, M.B.; Khani, F.; Talla, J.; Peroutka, Z.; Gantassi, R.; Baz, M.; Cheikhrouhou, O.; Hamam, H. A Hybrid Technique Based on a Genetic Algorithm for Fuzzy Multiobjective Problems in 5G, Internet of Things, and Mobile Edge Computing. Math. Probl. Eng. 2021, 2021, 9194578. [Google Scholar] [CrossRef]
- Walid, W.; Awais, M.; Ahmed, A.; Masera, G.; Martina, M. Real-time implementation of fast discriminative scale space tracking algorithm. J. Real-Time Image Process. 2021, 18, 2347–2360. [Google Scholar] [CrossRef]
- Shiri, A. A Novel Implementation of CORDIC Algorithm Based on Dynamic Microrotation Generation. Mapta J. Electr. Comput. Eng. 2021, 3, 17–27. [Google Scholar]
- Nouriani, A.; McGovern, R.A.; Rajamani, R. Step Length Estimation with Wearable Sensors Using a Switched-Gain Nonlinear Observer; Elsevier: Amsterdam, The Netherlands, 2021. [Google Scholar]
- Jawad, A.J.A.M.; Al Azzawi, F.J.I.; Biswas, A.; Khan, S.; Zhou, Q.; Moshokoa, S.P.; Belic, M.R. Bright and singular optical solitons for Kaup–Newell equation with two fundamental integration norms. Optik 2019, 182, 594–597. [Google Scholar] [CrossRef]
- Ghanbari, B.; Yusuf, A.; Inc, M.; Baleanu, D. The new exact solitary wave solutions and stability analysis for the (2+1)-dimensional Zakharov—Kuznetsov equation. Adv. Differ. Equ. 2019, 2019, 49. [Google Scholar] [CrossRef] [Green Version]
- Roshani, G.; Hanus, R.; Khazaei, A.; Zych, M.; Nazemi, E.; Mosorov, V. Density and velocity determination for single-phase flow based on radiotracer technique and neural networks. Flow Meas. Instrum. 2018, 61, 9–14. [Google Scholar] [CrossRef]
- Ghanbari, B. Abundant exact solutions to a generalized nonlinear Schrödinger equation with local fractional derivative. Math. Methods Appl. Sci. 2021, 44, 8759–8774. [Google Scholar] [CrossRef]
- Ghanbari, B.; Nisar, K.S.; Aldhaifallah, M. Abundant solitary wave solutions to an extended nonlinear Schrödinger’s equation with conformable derivative using an efficient integration method. Adv. Differ. Equ. 2020, 2020, 328. [Google Scholar] [CrossRef]
- Srivastava, H.M.; Günerhan, H.; Ghanbari, B. Exact traveling wave solutions for resonance nonlinear Schrödinger equation with intermodal dispersions and the Kerr law nonlinearity. Math. Methods Appl. Sci. 2019, 42, 7210–7221. [Google Scholar] [CrossRef]
- Nurgalieva, K.S.; Saychenko, L.A.; Riazi, M. Improving the efficiency of oil and gas wells complicated by the formation of asphalt-resin-paraffin deposits. Energies 2021, 14, 6673. [Google Scholar] [CrossRef]
- Tikhomirova, E.A.; Sagirova, L.R.; Khaibullina, K.S. A review on methods of oil saturation modelling using IRAP RMS. In IOP Conference Series: Earth and Environmental Science; IOP Publishing: Bristol, UK, 2019; Volume 378. [Google Scholar] [CrossRef]
- Movchan, I.; Yakovleva, A.; Movchan, A.; Shaygallyamova, Z. Early assessment of seismic hazard in terms of voronezh massif-moscow depression contact. Min. Miner. Depos. 2021, 15, 62–70. [Google Scholar] [CrossRef]
- Khaibullina, K.S.; Sagirova, L.R.; Sandyga, M.S. Substantiation and selection of an inhibitor for preventing the formation of asphalt-resin-paraffin deposits. Substanciação e seleção de um inibidor para evitar a formação de depósitos de asfalto-resina-parafina. Period. Tche Quim. 2020, 17, 541–551. [Google Scholar]
- Khaibullina, K.S.; Korobov, G.Y.; Lekomtsev, A.V. Development of an asphalt-resin-paraffin deposits inhibitor and substantiation of the technological parameters of its injection into the bottom-hole formation zone. Desenvolvimento de um inibidor de depósito de asfalto-resinaparafina e subscantiação dos parâmetros tecnológicos de sua injeção na zona de formação de furo inferior. Period. Tche Quim. 2020, 17, 769–781. [Google Scholar]
- Khaibullina, K. Technology to remove asphaltene, resin and paraffin deposits in wells using organic solvents. In Proceedings of the SPE Annual Technical Conference and Exhibition, Dubai, United Arab Emirates, 26 September 2016. [Google Scholar] [CrossRef]
- Syah, R.; Alizadeh, S.M.; Nurgalieva, K.S.; Guerrero, J.W.G.; Nasution, M.K.M.; Davarpanah, A.; Metwally, A.S.M. A laboratory approach to measure enhanced gas recovery from a tight gas reservoir during supercritical carbon dioxide injection. Sustainability 2021, 13, 11606. [Google Scholar] [CrossRef]
- Cui, L.; Weng, S.; Kirikkaleli, D.; Bashir, M.A.; Rjoub, H.; Zhou, Y. Exploring the role of natural resources, natural gas and oil production for economic growth of China. Resour. Policy 2021, 74, 102429. [Google Scholar] [CrossRef]
- Djilali, S.; Ghanbari, B. Dynamical behavior of two predators–one prey model with generalized functional response and time-fractional derivative. Adv. Differ. Equ. 2021, 2021, 235. [Google Scholar] [CrossRef]
- Ghanbari, B. On novel nondifferentiable exact solutions to local fractional Gardner’s equation using an effective technique. Math. Methods Appl. Sci. 2021, 44, 4673–4685. [Google Scholar] [CrossRef]
- Wang, K.; Wang, H.; Li, S. Renewable quantile regression for streaming datasets. Knowl.-Based Syst. 2021, 235. [Google Scholar] [CrossRef]
- Ghanbari, B. On approximate solutions for a fractional prey–predator model involving the Atangana–Baleanu deriva-tive. Adv. Differ. Equ. 2020, 2020, 679. [Google Scholar] [CrossRef]
- Ghanbari, B.; Atangana, A. Some new edge detecting techniques based on fractional derivatives with non-local and non-singular kernels. Adv. Differ. Equ. 2020, 2020, 435. [Google Scholar] [CrossRef]
- Wang, K.; Li, S. Robust distributed modal regression for massive data. Comput. Stat. Data Anal. 2021, 160, 107225. [Google Scholar] [CrossRef]
- Ghanbari, B.; Inc, M.; Rada, L. Solitary Wave Solutions to the Tzitzéica Type Equations Obtained by a New Efficient Approach. J. Appl. Anal. Comput. 2019, 9, 568–589. [Google Scholar] [CrossRef]
- Rahman, G.; Nisar, K.S.; Ghanbari, B.; Abdeljawad, T. On generalized fractional integral inequalities for the monotone weighted Chebyshev functionals. Adv. Differ. Equ. 2020, 2020, 368. [Google Scholar] [CrossRef]
- Taylor, J.G. Neural Networks and Their Applications; John Wiley & Sons Ltd.: Brighton, UK, 1996. [Google Scholar]
- Gallant, A.R.; White, H. On learning the derivatives of an unknown mapping with multilayer feedforward networks. Neural Netw. 1992, 5, 129–138. [Google Scholar] [CrossRef] [Green Version]

 means down-sampling by two.
means down-sampling by two.
means down-sampling by two.


| ANN Type | MLP | ||
|---|---|---|---|
| Ethylene Glycol | Gasoil | Crude Oil | |
| No. of input layer neurons | 5 | 5 | 5 |
| No. of 1st hidden layer neurons | 12 | 20 | 16 |
| No. of 2nd hidden layer neurons | 8 | 10 | 7 |
| No. of 3rd hidden layer neurons | 4 | 5 | 3 |
| No. of output layer neurons | 1 | 1 | 1 |
| No. of epochs | 650 | 800 | 550 |
| Activation function used for each hidden neuron | Tansig | Tansig | Tansig |
| Training Data | Validation Data | Test Data | ||||
|---|---|---|---|---|---|---|
| RMSE | MAE | RMSE | MAE | RMSE | MAE | |
| Ethylene glycol | 1.42 | 1.28 | 1.76 | 1.54 | 1.49 | 1.29 |
| Crude oil | 1.21 | 1.08 | 1.28 | 1.19 | 1.42 | 1.30 |
| Gasoil | 1.49 | 1.07 | 1.73 | 1.54 | 1.60 | 1.41 |
Publisher’s Note: MDPI stays neutral with regard to jurisdictional claims in published maps and institutional affiliations. |
© 2021 by the authors. Licensee MDPI, Basel, Switzerland. This article is an open access article distributed under the terms and conditions of the Creative Commons Attribution (CC BY) license (https://creativecommons.org/licenses/by/4.0/).
Share and Cite
Balubaid, M.; Sattari, M.A.; Taylan, O.; Bakhsh, A.A.; Nazemi, E. Applications of Discrete Wavelet Transform for Feature Extraction to Increase the Accuracy of Monitoring Systems of Liquid Petroleum Products. Mathematics 2021, 9, 3215. https://doi.org/10.3390/math9243215
Balubaid M, Sattari MA, Taylan O, Bakhsh AA, Nazemi E. Applications of Discrete Wavelet Transform for Feature Extraction to Increase the Accuracy of Monitoring Systems of Liquid Petroleum Products. Mathematics. 2021; 9(24):3215. https://doi.org/10.3390/math9243215
Chicago/Turabian StyleBalubaid, Mohammed, Mohammad Amir Sattari, Osman Taylan, Ahmed A. Bakhsh, and Ehsan Nazemi. 2021. "Applications of Discrete Wavelet Transform for Feature Extraction to Increase the Accuracy of Monitoring Systems of Liquid Petroleum Products" Mathematics 9, no. 24: 3215. https://doi.org/10.3390/math9243215
APA StyleBalubaid, M., Sattari, M. A., Taylan, O., Bakhsh, A. A., & Nazemi, E. (2021). Applications of Discrete Wavelet Transform for Feature Extraction to Increase the Accuracy of Monitoring Systems of Liquid Petroleum Products. Mathematics, 9(24), 3215. https://doi.org/10.3390/math9243215