1. Introduction
The widespread availability of tools for sound acquisition, as well as the cost reduction of audio data storage systems, require new methods for automatic processing. Such tasks as the generation of meeting minutes, the processing of telephone conversations, and the automatic transcription of news or entertainment programs, not only require speech recognition [
1], but also involve audio annotation by speakers, which is usually referred to as speaker diarization.
Diarization is the process of partitioning an input audio stream into homogeneous segments according to the speaker identity [
2]. This means that the goal is to determine who is speaking in each audio segment. Diarization can be used as a preliminary stage in speech recognition systems, in automatic translation or meeting recording transcription. The choice of a suitable diarization scenario depends on the specific task and corresponding data. So, processed data can be characterized based on the channel specifics (telephone, microphone or microphone array), the presence of noise and the reverberation level, etc. Preliminary information can also influence the choice of diarization methods: whether the exact number of speakers is known or whether individual speech samples of their voices are available. When it comes to meeting minutes, it is helpful to know in advance if the participants can move around the room or tend to interrupt each other. All of these factors can significantly affect the quality of diarization [
3].
The diarization scenario may consist of the following steps [
4]. The first step usually tends to apply the voice activity detector (VAD) in order to obtain the markup of speech and non-speech segments of an audio recording. This stage can be affected by the quality of the recording or the presence of speaker interruptions, as mentioned above. Nevertheless, the accuracy in the finding of speech boundaries can affect the overall quality of diarization. The next step is the extraction of speaker features (speaker models) for each speech segment. This is necessary for the main purpose of diarization, in order to determine exactly who is speaking in a given segment. At this stage, well-proven representations of the speaker patterns are used: i-vectors obtained via factor analysis [
5], x-vectors extracted using a time delay neural network [
6] or other types of DNN-embeddings [
7]. Having been obtained for each segment, the speaker representations are subject to clustering procedures during the third step of diarization. Pre-selected similarity metrics are used to divide speech segments into clusters and to match the speaker label to each cluster. Thus, in the output of the diarization system, the markup “who speaks when” is obtained. In our paper we consider approaches to improve the quality of diarization at each stage, with particular attention to the detection of speech boundaries.
The accuracy of speech boundary detection can be improved through the choice of an appropriate VAD method. Recently, in addition to standard energy-based voice activity detectors, neural network-based VADs are gaining popularity, which allows one to obtain better resistance to noise conditions [
8]. In this paper, we consider the use of the DNN-based VAD described in [
9] for a diarization task applied to the AMI Meeting Corpus [
10]. To deal with the inherent problems of multi-dialogue recordings such as speaker interruptions and the simultaneous utterances of multiple speakers, we examine options for fusing VAD with other speech analytic systems. At a certain stage we apply instantaneous speaker number estimation, which we further refer to as a speaker counter (SC) model. The model resolves a classification problem, where each class represents the number of simultaneous speakers detected. If the speaker counter is analyzed in terms of two classes, “zero speakers” and “one or more speakers”, it can be considered an alternative to VAD, and fusing VAD and SC can increase accuracy in locating speech boundaries. In turn, the performance of SC in conversations with frequent interruptions can be improved by fusing SC with the model which detects overlapping speech segments [
11]. We refer to this model as the overlapping speech detector (OSD). The fusion of these two models allows one to tackle the problem of simultaneous speaker detection from separate perspectives.
Information about acoustic conditions in terms of the speech-to-noise ratio (SNR) and reverberation time (RT60) for each audio segment can also be used to distinguish speech and non-speech frames. We apply an automatic quality estimation (QE) system, described in [
9], to cluster estimated SNR-RT60 vectors into speech and non-speech clusters and thereby retrieve an approximate voice activity markup. Although this method is not accurate, we investigate its usefulness in fusing it with the base DNN-VAD.
The next stage of the diarization process consists of generating speaker models for each segment located during the previous stages of speech detection. The algorithms at this stage can be implemented through speaker DNN-embedding extraction, similar to the speaker verification task. The current state-of-the-art systems in speaker verification are completely guided by the deep learning paradigm. Previously, the frame-level portion of these extractors was based on TDNN (time delay neural network) blocks that contained only five convolutional layers with temporal context [
6]. Such types of embeddings, referred to as x-vectors, are often applied to diarization tasks in state-of-the-art systems [
12]. The newer ECAPA-TDNN (emphasized channel attention, propagation and aggregation TDNN) [
13] architecture develops the idea of TDNN and contains additional blocks with hierarchical filters for the extraction of different scale features. ECAPA-TDNN and various modifications of the well-known ResNet [
7] architecture are compared in our research in terms of EER, minDCF, and DER metrics.
The speaker models obtained for each speech segment must then be clustered. The purpose of clustering is to associate segments from the same speaker to one another. The clustering procedure ideally yields one cluster per each speaker in the recording, with all the segments from a given speaker contained in a single cluster. The common approach used in diarization systems is agglomerative hierarchical clustering, which can be used in the absence of prior knowledge about the number of speakers [
14,
15,
16]. As an alternative method, spectral clustering [
17] can also be used, as well as methods that require the specification of the number of clusters, such as KMeans or DBSCAN [
18].
In this study, we aimed to enhance separate parts of the neural-based diarization system and analyze their contributions to the final assessment. In particular, our experiments were based on the following system components: feature extraction, VAD methods, speaker extractor models, speaker verification, and diarization. VAD results coupled with SC and QE estimates were applied to speaker extractor and diarization models’ results through fusion algorithms in order to achieve an increase in diarization quality. Thus, separate state-of-the-art and proposed diarization system components, as well as the pipeline in their entirety, are studied and evaluated.
Since the study focuses specifically on cases of noisy overlapping speech acquired by a far-field microphone in real-life conversation conditions, it is important to take into account the same conditions when comparing our solution with those of other studies. In this sense, our proposed neural network-based VAD is compared to the publicly-available SileroVAD [
19] on the evaluation subset of the Third DIHARD Speech Diarization Challenge. Our method demonstrated an ability to deal with noisy conditions and showed a 16.9% EER versus the 26.37% EER of SileroVAD. However, it is not always possible to correctly compare the results of different studies. For example, the accuracy of our proposed speaker counter detector, obtained on a realistic AMI dataset, was 65.6%, and, although this percentage was less than those presented in similar works, unlike those works, we did not employ synthesized datasets. As described below, our results in regard to diarization of the AMI evaluation set are comparable to the state-of-the-art papers, and the proposed fusion methods can be further improved.
The paper is structured as follows.
Section 2 presents the datasets applied for the training and evaluation of the presented diarization pipeline and its system components and discusses the methods of feature extraction applied in these components.
Section 3 describes the separate system pipeline components, namely, the approaches to VAD, SC, OSD, and QE, speaker extraction models, and the fusion methods applied to these system components.
Section 4 is devoted to the experimental evaluation of the system components and the diarization pipeline. Finally,
Section 5 discusses the results achieved during the study and addresses the prospects of future developments in the considered direction of research.
2. Data Processing
In this section we describe the data used to train and test all systems included in the investigated diarization pipeline. The section begins by describing the process of extracting features from raw audio as the first and primary stage of data processing.
2.1. Feature Extraction
For audio signal processing, we extract several feature types from the raw audio signal that can be fed into machine learning models. In our paper, feature extraction methods vary depending on the diarization system units, the main components of which are speaker embedding extractor, VAD, SC, OSD, and QE models.
All speaker embedding extractors presented in this paper expect log Mel-filterbank (LMFB) energy coefficients extracted from raw input signals using the standard Kaldi recipe [
20] at the sampling rates of 8 kHz or 16 kHz:
Extracted features additionally go through either one of the two different post-processing steps, depending on the type of speaker embedding extractor used afterwards:
The application of the above methods for each type of speaker-embedding extractor is discussed in
Section 3.5.
To obtain speech segments from the audio signal, we apply a neural network-based voice activity detector (VAD) system developed by us. The model receives mel-frequency cepstral coefficients (MFCCs) extracted from the raw signal with a sampling rate of 8 kHz.
Modified versions of the voice activity detection system integrate OSD, SC or QE models with DNN-VAD. As the features, the OSD and SC neural network models use the short-term Fourier transform (STFT) coefficients extracted from the preprocessed input audio with a sampling rate of 16 kHz. The QE models use LMFB feature coefficients with CMN-normalization. The parameters of the extracted features are presented in
Table 1.
2.2. Datasets
In this paper, two different sets are used for the test protocol. The target dataset for measuring the quality of diarization is the AMI corpus. This dataset is also used to train SC and OSD models, evaluate individual parts of the system (SC, OSD, clustering) and fusion. Additionally, during the study, Voxceleb1 and NIST SRE 2019 evaluation datasets are used to measure the quality of speaker verification models. In the current work, we decided to investigate the degradation of speaker extraction systems trained on the utterances sampled at 8 kHz, compared to the systems trained on files sampled at 16 kHz. For this purpose, two different datasets were created. For all datasets, the division into train/dev/test sets suggested by their original authors was used. The application of each of these datasets is discussed in detail below.
The main dataset for assessing the quality of diarization is the
AMI corpus [
10]. The dataset consists of over 100 h of meeting recordings. In general, the total number of participants in a single meeting is four (approximately 80%), and rarely three or five. The meetings were recorded in specially equipped rooms of various configurations and locations using microphone arrays, lapel microphones and headphones. In addition, each meeting attendee was provided with graphics such as videos, slides, whiteboards, and notebooks. All recordings were synchronized. The dataset contains both the recordings of real meetings and meetings with predefined scenarios and roles. For about 70% of the recording duration only one speaker is active, whereas for about 20% of the duration speech is absent, and only 10% corresponds to the simultaneous speech of several people.
Several recent studies on the diarization problem include experiments based on the AMI corpus to measure quality. The proposed methods can differ in speaker extractor models, clustering methods, whether they include or exclude overlapping speech in the scoring, as well as whether they use references or predicted speech/non-speech labels. It is also essential to use the same evaluation protocols for the AMI database for a fair comparison, in particular, to select data from the same set of microphones: Headset-Mix, Lapel-Mix or Distant-Mic. The work [
21] closest to our solution compares the x-vector TDNN and ECAPA-TDNN architectures for speaker model extraction and ignores overlapping speech segments during scoring. In this work, the best results are obtained using the ECAPA-TDNN architecture with a spectral clustering back-end, which achieved 3.01% DER for the case of the estimated number of speakers and 2.65% DER for the case of a known number of speakers on the AMI Headset-Mix evaluation set. Another work [
22] compares the well-known agglomerative hierarchical clustering (AHC) method and a proposed modification of the variational Bayes diarization back-end (VBx) method, which clusters x-vectors using a Bayesian hidden Markov model (BHMM). The AHC in their experiments showed 3.96% DER, whereas VBx with a single Gaussian model per speaker showed 2.10% DER for the AMI Headset-Mix evaluation set. Since the analysis in both of the abovementioned papers focuses on oracle VAD, they can be comparable with our results, presented in
Section 4.3.
In our research, we applied full-corpus-ASR [
10] partitioning of meetings and used the evaluation part of the lapel-mix AMI corpus for diarization experiments and system fusion. For the training and evaluation of the speaker counter and overlapping speech detector models the training and evaluation parts of the Array1-01 AMI corpus were used, respectively. Additionally, the following datasets were used during the intermediate steps of our proposed approach.
The
Voxceleb1 dataset [
23,
24] is composed of audio files extracted from YouTube videos and contains 4874 utterances recorded at 16 kHz. The speakers span a wide range of different ethnicities, accents, professions and ages. Segments include interviews from red carpets, outdoor stadiums and indoor studios, speeches given to large audiences, excerpts from professionally-shot multimedia, and even crude videos shot on hand-held devices. Crucially, all are degraded with real-world noise, consisting of background chatter, laughter, overlapping speech, and room acoustics [
25]. The quality of the recording equipment and channel noise quantity also vary quite noticeably.
The
NIST SRE 2019 evaluation dataset [
26] is composed of PSTN and VoIP data collected outside of North America, spoken in Tunisian Arabic, and contains 1364 enrollment and 13,587 test utterances recorded at 8 kHz. Speakers were encouraged to use different telephone instruments (e.g., cell phones, landlines) in a variety of settings (e.g., a noisy cafe, a quiet office) for their initiated calls [
26]. Enrollment segments approximately contain 60 s of speech to build the model of the target speaker. The speech duration of the test segments is further uniformly sampled with lengths varying from approximately 10 s to 60 s.
The
16 kHz training set. For this set we concatenated VoxCeleb1 and VoxCeleb2 (SLR47) [
25] corpora. We used videos from VoxCeleb1 and VoxCeleb2, and concatenated all the corresponding audio files into one chunk. Augmented data were generated using the standard Kaldi augmentation recipe (reverberation, babble, music and noise) using the freely available MUSAN and simulated room impulse response (RIR). In total, the training dataset contains 833,840 recordings from 7205 speakers.
The 8 kHz training set. For this set we used a wide variety of datasets, containing telephone and microphone data from private datasets and from those available online. The dataset includes Switchboard2 Phases 1, 2 and 3, Switchboard Cellular, Mixer 6 Speech, data from NIST SREs from 2004 through 2010 and 2018, concatenated VoxCeleb 1 and 2 data, extended versions of the Russian speech subcorpus named RusTelecom v2 and the RusIVR corpus. RusTelecom is a private Russian speech corpus of telephone speech, collected by call centers in Russia. RusIVR is a private Russian speech corpus containing speech, collected in different scenarios, such as noisy microphones, telephone calls, recordings from distant recorders, etc. All files are sampled at 8 kHz. In order to increase the amount and diversity of the training data, augmentation using the standard Kaldi augmentation recipe (reverberation, babble, music and noise) was applied using the freely available MUSAN and simulated room impulse response (RIR) datasets. In total, this training dataset contains 1,679,541 recordings from 33,466 speakers.
3. Methods
In this section a detailed description of the main systems included in our diarization pipeline is provided. The first four subsections (VAD, SC, OSD and QE) describe the models used in various types of speech boundary detection and the fusion of these models.
Section 3.5 is devoted to speaker extraction models and the methods used for their training.
3.1. Voice Activity Detection
This work proposes a fusion method of three different models, each of which shows different quality on the same evaluation subset of the AMI corpus. The first one is the voice activity detector (VAD), which is trained purposefully for the task of speech boundary detection on the AMI corpus. In our case, we use the method proposed in [
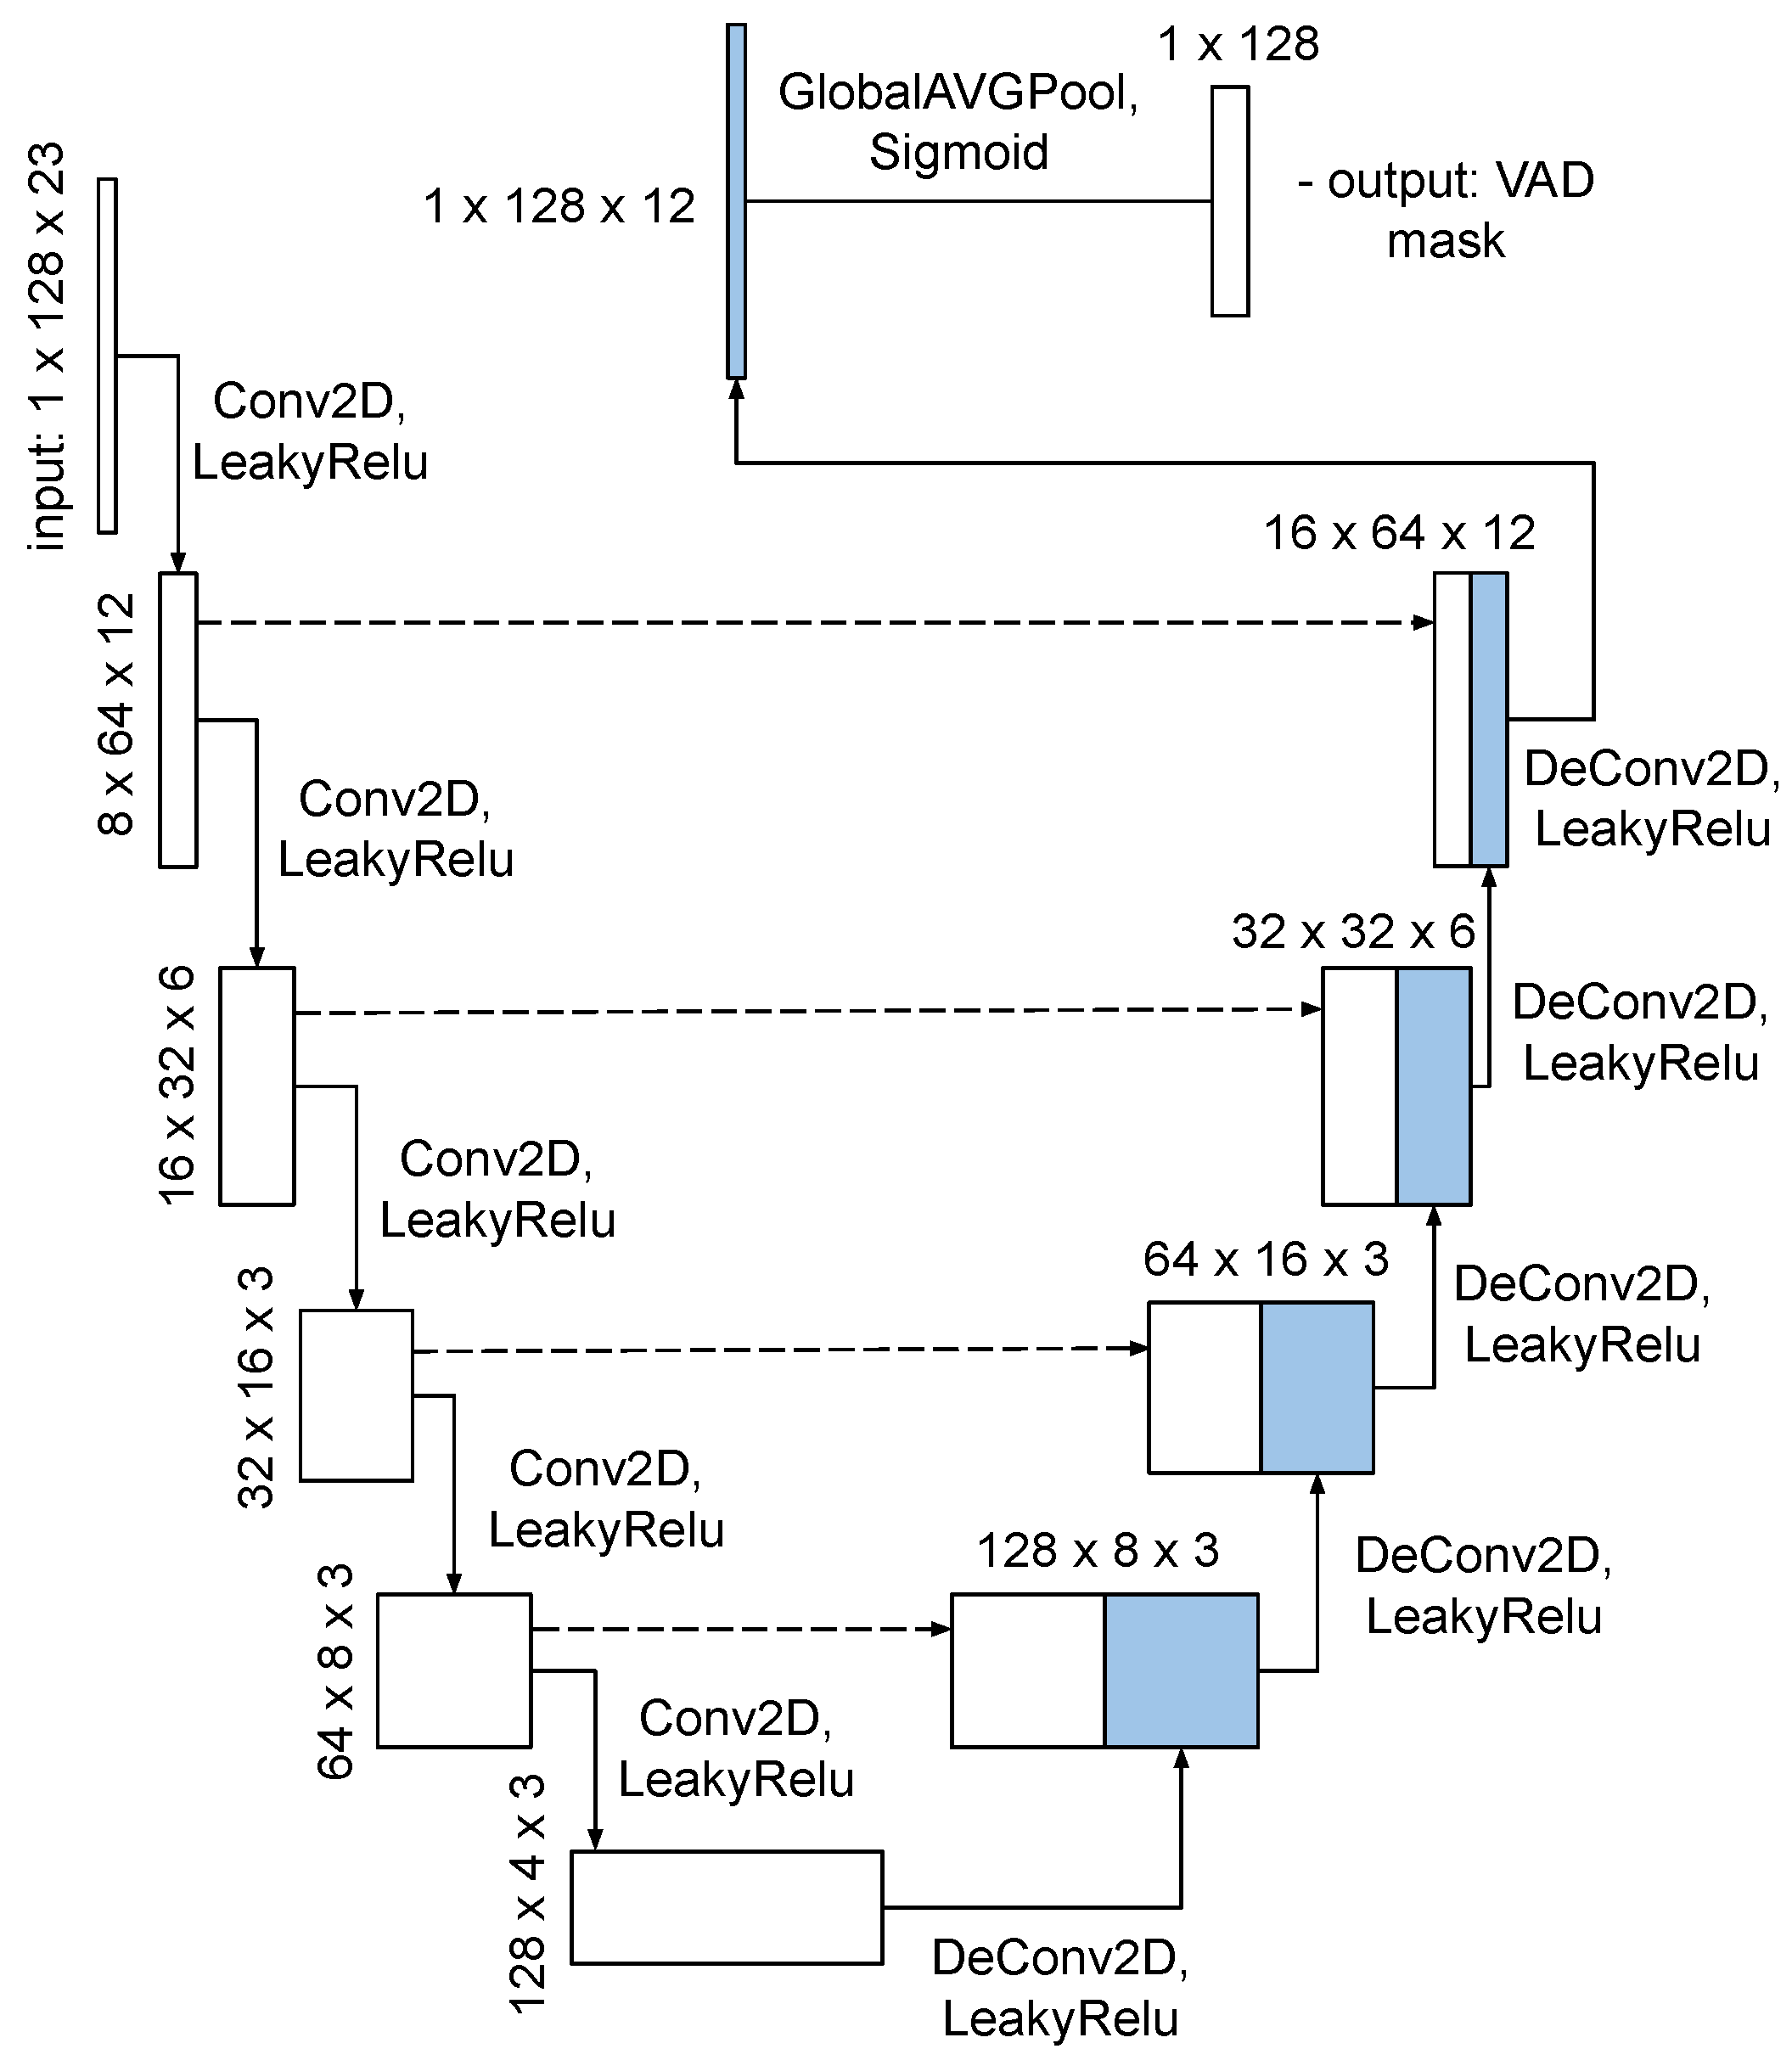
7], which adapts the idea of using the U-Net architecture for segmentation from the spatial to the time domain. This architecture was originally introduced in [
27], as a fairly precise method for object localization in microscopic images. U-Net is a convolutional architecture, that involves the idea of the deconvolution of small and deep image representation with many small layers into an image of the original size by applying the upsampling operation. In this study, we apply a reduced version of the original U-Net architecture, which is presented in
Figure 1. Since the task of detecting speech activity is a task of segmentation in the time domain, we apply the combination of Dice and cross-entropy losses as the main loss-function in the VAD model training process [
28].
The training process pipeline of the model for the AMI task consists of two stages:
During the first stage of training we use the concatenation of the NIST 2002/2008 speech recognition datasets and the RusTelecom corpus, described in
Section 2.2. This data setup leads to a confident VAD quality of about a 10% equal error rate (EER) on different configurations of the model. Adaptation on the AMI corpus is described via the same training process as during the first stage, but using a smaller learning rate for the fitting of new data without the loss of already learned knowledge. In general, and also in our specific case, the adaptation process should last for a small amount of training iterations to prevent the overfitting on the new adaptation dataset and the reduction of the previous ability to detect speech in common.
To compare VAD performance under the same conditions, we computed EER scores on the evaluation subset of the Third DIHARD Speech Diarization Challenge using our VAD and a similar method called SileroVAD [
19]. The results were 16.9% EER using our method and 26.37% using SileroVAD.
3.2. Speaker Counter Model
Another model, the results of which can be interpreted as a time-domain speech detection markup, involves a detector of the number of simultaneous speakers, known as a speaker counter (SC).Theoretically, the estimation of the number of concurrent speakers is closely related to the problem of speaker identification, which is considered one of the tasks involved in speaker diarization [
2,
29,
30,
31].
We have compared the results of our model with the state-of-the-art systems in speaker number estimation presented in [
11,
32], which are based on convolutional neural networks. We have taken into consideration the models from the cited papers and the model presented in the current work, trained on 1-s recording segments to count the number of speakers. In [
32], the authors present a model trained and evaluated on a synthetic dataset, which performs the speaker counting task with an average F1-score of 92.15% for classes with 0–3 speakers. In [
11], the authors present a model trained and evaluated on mixtures of speaker recordings of the LibriSpeech dataset; this model achieves 77.3% accuracy for classes with 1–4 speakers.
Previously referenced works in the field mainly consider the synthetic mixtures of different speaker recordings and thus obtain permissible results for active speaker number estimations. We, however, focus specifically on real-life recordings of natural conversations that are contained in the AMI corpus, which reduces estimation quality. Our study has shown that no similar works in the field contain results based specifically on the AMI corpus; thus, exact comparison with our results is not possible. To train the model we applied data augmentation to the AMI corpus, and tested the model on the evaluation set of this corpus. The model achieved an F1-score of 65.6% in real-speech conditions. The results are further discussed in
Section 4.4.
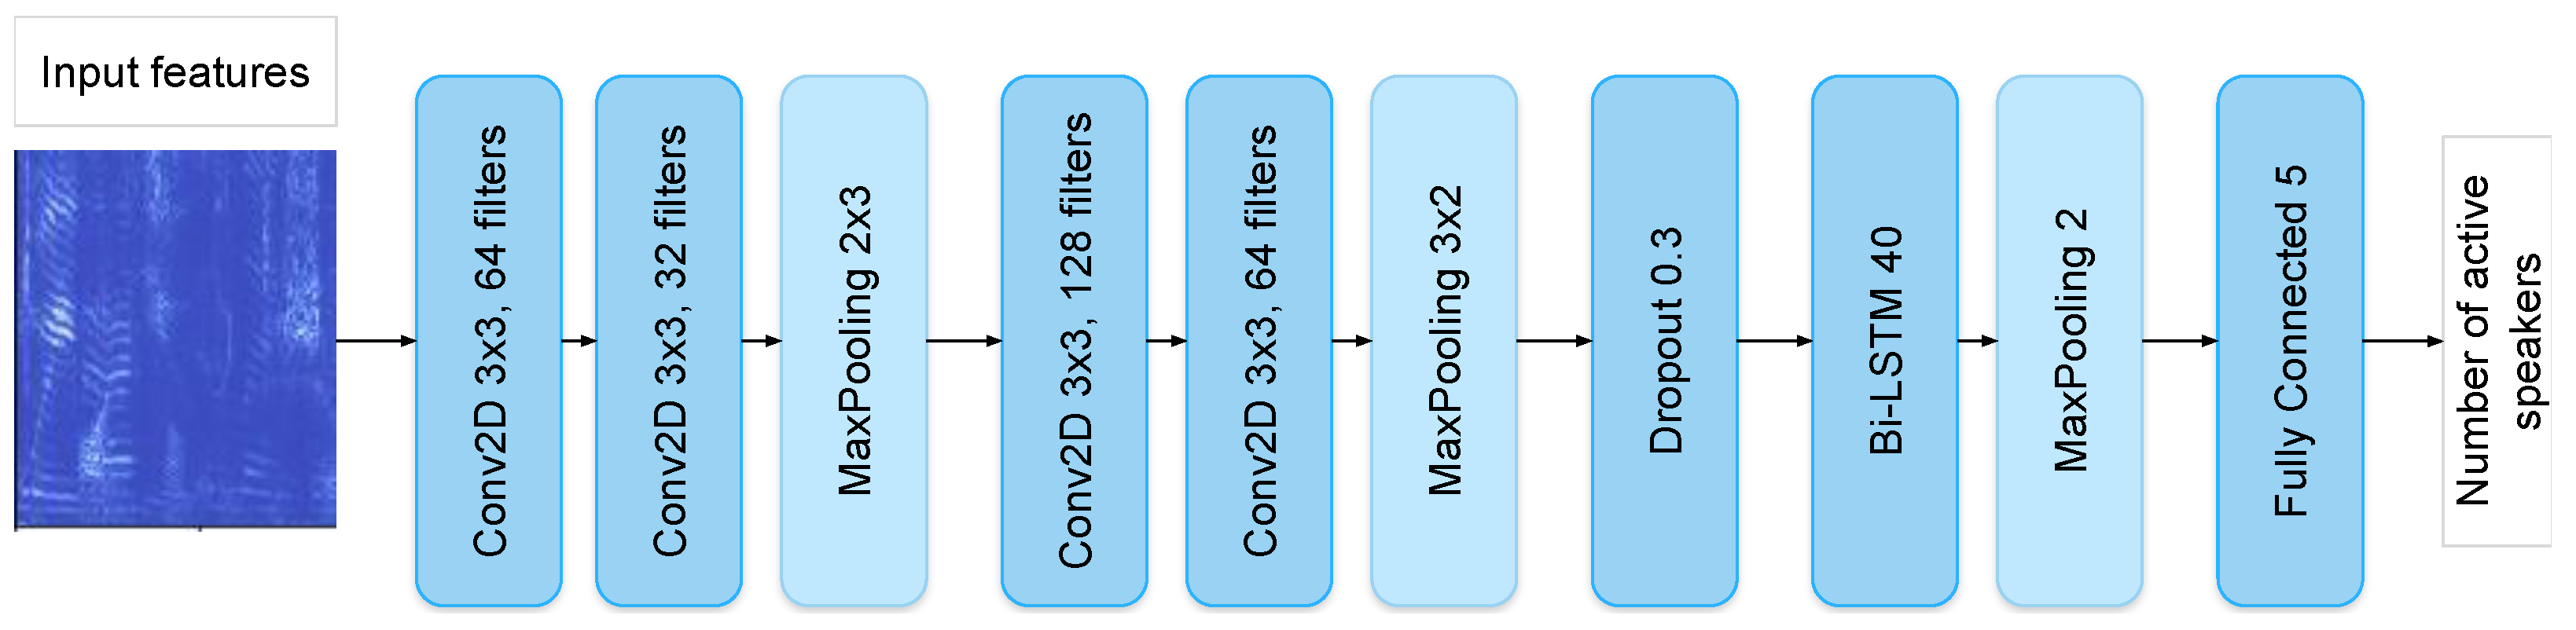
The SC model solves the task of estimating the number of concurrent speakers, which is formulated as a classification task with 5 classes, from 0 to 4+ concurrent speakers. The model is based on the architecture described in [
33]. The solution is based on the application of several deep neural network (DNN) models, a diagram of which is presented in
Figure 2. These models consist of several convolutional layers, max-pooling layers, a Bi-LSTM layer with 40 hidden units for processing input features, and a fully connected layer, which implements the classification of the number of active speakers. The softmax function is used for the output layer; thus, the prediction is specified by the highest probability of the output distribution [
34].
To create the markup that is applicable to the SC model, we employed the manual annotations provided with the AMI corpus. These annotations specify the speech segments for each speaker. To obtain the markup with the number of active speakers, the beginning and end time stamps of all speech segments are combined into one set and sorted. This sorted set is then divided into subsegments, and for each subsegment the number of concurrent speakers is calculated using the original annotation [
34]. Thus, we extract the subsegments where the number of simultaneous speakers remains unchanged, from 0 (silence) to 4+ overlapping speakers in a subsegment.
3.3. Overlapping Speech Detection
The model for the task of overlapping speech detection is similar to the SC model in its architecture (see
Figure 2), but employs a different type of speech markup. The overlapping speech detector (OSD) is applied for the detection of overlapping speech segments in a conversation involving multiple speakers [
11,
35,
36,
37,
38,
39,
40]. The OSD performs a binary classification task of detecting overlapping and non-overlapping speech. The markup for this task is produced using the speaker number markup of the SC task:
where
is an OSD segment class label and
is an SC segment class label. The model presented in
Figure 2 is trained with the OSD labels to perform the detection of overlaps. The model accepts the features extracted from short audio segments as input, whereas the output corresponds to the probabilities of the classes overlapping/non-overlapping per each speech segment.
3.4. QE-Vectors System
As an alternative method of separating speech and non-speech segments, we used the information about the acoustic characteristics of the signal from the microphone array of the AMI corpus. During evaluation, for each 0.5 s signal frame we estimated the SNR and RT60 parameters using the signal quality estimation (QE) model described in [
9]. SNR and RT60 parameters were predicted for all 8 channels of the microphone array, so for each 0.5 s frame we obtained a vector of 16 values. The resulting vectors were clustered using the K-means method into two clusters. To decide which of the clusters represented the speech segments and which represented non-speech, the centers of each cluster were compared with the mean speech vector, which is calculated in advance for the speech segments of the development part of the AMI database. This way it was possible to retrieve the markup of speech and non-speech segments for further fusing with a more accurate method, such as base DNN-VAD.
3.5. Speaker Extractor Models
This section contains the descriptions of the foremost architectural details, training techniques, and distinctive features of the implemented speaker verification models. The most common approaches for speaker verification today are based on blocks with one-dimensional (TDNN) or two-dimensional (ResNet) convolutions, which influenced our choice regarding the speaker extractors’ architecture. Thus, in this paper, we explore the ECAPA-TDNN architecture, which develops the idea of an x-vector TDNN, and ResNet-based models, trained on 8 kHz and 16 kHz datasets. We used ResNet34 as a baseline model and attempted to increase the quality of the speaker model by increasing the depth and width of the layers and by investigating the model architectural configuration.
ECAPA-TDNN. Emphasized channel attention, propagation and aggregation in TDNN (ECAPA-TDNN), proposed in [
13], is a modification of the standard time delay neural network (TDNN) architecture, containing squeeze-excitation (SE) blocks and Res2Net modules in the frame level with hierarchical filters for the extraction of features of different scales. To process signals of arbitrary duration, the architecture uses attentive statistic pooling instead of the usual statistic pooling. For this work, we chose the official pre-trained model from
https://github.com/speechbrain/speechbrain (accessed on 2 March 2021), which was trained on the original VoxCeleb1 and VoxCeleb2 datasets with SpecAugment [
41], speed perturbation, noise, and reverberation augmentation. In detail, the model configuration and training are described in [
42].
ResNet34. This extractor is based on the ResNet34 model with some modifications, as well as the Maxout activation function on the embedding layer, set to one stride in the first BasicBlock and changed to a simple Conv2D stem block. This model was trained on the 16 kHz dataset with local CMN-normalization and global CMVN-normalization, sequentially. During the training process, the extractor handles short audio segments with the length fixed at 2 s using AM-Softmax loss. During the training stage, the parameters
m and
s were set equal to 0.2 and 30, respectively. The learning rate was set to 0.001 for the first two epochs, and then it was decreased by a factor of 10 for each consecutive epoch. Detailed information about the model configuration is presented in [
7].
ResNet72. For this extractor, the ResNet architecture from [
43] was adapted to the task of speaker verification. The model was trained on the 16-kHz dataset with local CMN-normalization. As a loss function, we used adaptive curriculum learning [
44]. Parameters
m and
s were respectively equal to 0.35 and 32 during the whole training stage. The optimization process was based on the SGD optimizer with the momentum of 0.9 and weight decay of 10–5 for the head and 10–6 for the rest of the layers. Moreover, for learning rate control the OneCycleLR scheduler was used with the maximum learning rate fixed to 2. To increase the training speed, we also used AMP (Automatic Mixed Precision) with half-precision, which raised the batch size per GPU. The model was trained during 15 epochs on randomly sampled 4-s crops of each utterance from the training dataset. The comprehensive description of the model configuration is presented in [
45].
ResNet101_8k. The ResNet101 model modification included the Maxout activation function on the embedding layer, set to one stride in the first BotleneckBlock and changed to a simple Conv2D stem block, which provided the basis for this extractor. The training set for this model was the 8 kHz dataset with local CMN-normalization performed in several stages. In the first stage, the model was trained for 20 epochs on randomly sampled 6-s crops of each training dataset utterance. AAM-Softmax losses with parameters m and s were respectively equal to 0.35 and 32. In the second stage, crop duration was increased to 12 s and the parameters of AAM-Softmax loss were set to 0.45 and 32, respectively. Then, the model went through 10 epochs of training with these settings.
ResNet101_48_8k. The ResNet101_8k model was set to be used directly as a basis for the extractor at hand, with the extension number of convolution layers in the model architecture ranging from 32 N to 48 N, where for different model blocks. Higher quality was achieved through an increase in the size of convolutional layers; however, the increase in the number of model parameters resulted in an increase of training time compared to the ResNet101_8k model.
3.6. Model Fusion
In order to improve the accuracy of speech boundary detection, we conduct a series of experiments by fusing the speech markups obtained using DNN-VAD with the markups obtained using other systems discussed above: SC, OD and QE. The following options for fusion were considered:
VAD + QE, on the assumption that information about acoustic conditions (RT60, SNR) can correlate with the speech component properties and thereby improve VAD markup;
VAD + SC, on the assumption that the above-described model for counting the number of speakers can be considered as an alternative approach to the detection of speech activity;
VAD + QE + SC + OD, on the assumption that the SC + OD fusion is shown to produce good quality estimates (see
Section 4.4), and the combination of different approaches in the conditions of a multispeaker conversation can improve the accuracy of voice annotation compared to baseline DNN-VAD.
According to the diarization pipeline, the obtained speech markup was then used for speaker model extraction; so, the accuracy of speech boundary detection affected the overall diarization quality. We describe the details of the applied voice annotation system fusion and analyze the influence of different fusion approaches on speaker diarization quality in terms of DER in
Section 4.5.
4. Experiments
Our main experiment was aimed at the fusion of different speech analytics techniques to improve the overall quality of diarization. A description is available in
Section 4.5, which includes the comparison of different combinations of speech markup methods in terms of DER: VAD, QE, SC and OSD, outlined above. In the final experiment we intended to apply the speaker extractor model chosen in
Section 4.1 and
Section 4.2, the selected clustering method (
Section 4.3), and the SC + OSD fusion method (
Section 4.4) in combination.
Thus,
Section 4.1,
Section 4.2,
Section 4.3 and
Section 4.4 describe preliminary experiments aimed at independently improving each of the stages of fusion.
Section 4.1 contains the comparison of different speaker extractor models in the speaker verification task. We tested the generalizability of different neural network architectures trained on the 16 kHz training set and the combined 8 kHz training set described in
Section 2.2 to cope with unknown evaluation data.
Section 4.2 compares the same speaker extractor models for an AMI-based diarization problem using ideal VAD markup. As a result of these experiments, we defined the ResNet101_8k model as the most optimal, so it was chosen for the final experiments.
Section 4.3 is devoted to the next stage of the diarization pipeline—the comparison of clustering methods for extracted voice models of speakers. The experiments were carried out on the ResNet101_8k and ECAPA_TDNN models. Finally,
Section 4.4 focuses on SC and OSD fusion to refine speech boundaries under interruption conditions.
4.1. Speaker Verification
We investigated the quality of different speaker extractors for the speaker verification task on the Voxceleb1 test and NIST SRE 2019 eval sets. Since the speaker verification system receives two sets of speech recordings during the evaluation process, originating either from the same speaker or from two different speakers, there arise two types of errors: the false acceptance rate (FA) and the false rejection rate (FR), which are dependent on the decision threshold. Then, the equal error rate (EER) is the point at which both rates are equal to each other. The lower the EER value, the higher the overall accuracy of the biometric system [
46].
In order to take into account the different FR and FA error costs, there exists the detection cost function (DCF or
) measure, which is described by the following equation:
where
and
are the estimated cost parameters for false accept and false reject errors,
is a prior probability of targets in the considered application; error-rates
and
are determined by counting errors during evaluation, and
is the decision threshold.
The optimal value of DCF obtained via the adjustment of the detection threshold is minDCF. In our experiments we used the EER measure and minDCF with the a priori probability of the specified target speaker () set to 0.01, = 1, = 1.
The main idea of this experiment consisted of comparing the models trained on different types of data (8 kHz or 16 kHz) and tested on the test subsets of the same data (8 kHz or 16 kHz as well). For this task, we upsampled the 8 kHz audio files to 16 kHz or downsampled the 16 kHz audio files to 8 kHz. For ECAPA-TDNN, we used the official implementation of the model and data processing pipeline from [
42]. Note that VAD was not used for feature processing for ECAPA-TDNN, according to the official implementation. No normalization or adaptation techniques were used for speaker embedding comparisons. Simple cosine similarity between speaker embedding vectors was used as a score for speaker model comparisons. The results of the comparison between the speaker verification models are presented in
Table 2. To determine the confidence intervals for the EER estimates, we used the fast equal error rate confidence interval (FEERCI) algorithm to calculate non-parametric, bootstrapped EER confidence intervals [
47]. The main idea of this approach is to use random subsets from genuine and imposter score lists for estimation. We used 95% confidence intervals on 50 bootstrap iterations for this task. We estimated the confidence intervals for the fixed architecture of the model and its weights due to the significant computational complexity of the task of retraining the speaker recognition model. Based on the results, the following conclusions can be drawn:
The system trained for specific data types works better on the test set of the corresponding type. Data type mismatches led to significant quality degradations for all tested systems;
The quality degradation of models trained on a combined dataset (ResNet101_8k, ResNet101_48_8k) was less than the degradation of the models trained only on VoxCeleb datasets. This can be explained by the growth of the generalizing ability of the network with the increase in samples of the training dataset;
The ResNet-based models trained on VoxCeleb datasets showed better quality on out-of-domain tasks, compared to ECAPA-TDNN, which can be observed by comparing the results of speaker verification. However, ECAPA-TDNN shows a better result on the in-domain test dataset.
4.2. Diarization
The quality of various speaker verification systems was compared during the task of diarization. The embeddings of each continuous speech segment were extracted with the chosen sliding window and shift duration values. We investigated the influence of these parameters based on the results of diarization in terms of the diarization error rate (DER), which consists of three types of error: speaker error, missed speech, and false alarm. DER is denoted as
where
is the speaker error, the percentage of the scored time when a speaker ID is assigned to the wrong speaker. This type of error does not account for overlapping speakers or any error situated within non-speech frames.
is missed speech—the percentage of scored time when a hypothesized non-speech segment corresponds to a reference speaker segment.
is false-alarm speech, the percentage of scored time when a hypothesized speaker is labeled as non-speech in the reference annotation [
48].
We used the DER metric configured according to NIST: a forgiveness collar of 0.25 s was used and the speaker overlap regions were ignored during scoring. We used the ideal VAD markup computed from the ground truth information from the AMI dataset. The results of the comparison of the speaker verification models in terms of DER are presented in
Table 3. The development set was used for tuning the spectral clustering parameters. The tuned parameters were used to perform the diarization task on the evaluation set.
To determine the confidence intervals for the DER estimates we used the following algorithm:
Input: ; w—diarization results for each file in subset, n—number of unique files in subset;
Choose random subsets of size from the entire subset and compute the DER metric for the files in each of size subsets. We use files to maximize the size of subset, while assuring a sufficient variability of subsets;
Repeat the 2nd step 50 times, sort all computed DER results, compute mean and 95% confidence interval thresholds.
Based on the presented results, the following conclusions were drawn:
The quality of the ResNet-based model outperformed ECAPA-TDNN in the diarization task for the AMI dataset;
The best quality on the evaluation set of AMI was achieved using the sliding window and shift duration values set to 2.0 s and 1.0 s. respectively;
High-quality diarization was achieved using the model trained on the 8 kHz dataset, indicating that the data variability of the training dataset was no less important for achieving better diarization results than the type of train data. The quality of the model trained on the 8 kHz dataset matched or even exceeded the quality of models trained on test-like data;
The sizes of the development and evaluation parts of the AMI dataset were probably insufficient for quality assessments with high confidence intervals. For example, the quality of all systems on the evaluation set for sliding window and a shift duration values of 1.5 s and 0.75 s, accordingly, were comparable in the confidence interval. Furthermore, the quality of ResNet72, ResNet101_8k and ResNet101_48_8k models for the window and shift parameters larger than the abovementioned values were comparable.
Here and in other tables of this paper, some metrics contains range values which correspond to boundaries of confidence intervals. These values are separated with a minus sign (“−”).
4.3. Clustering
This section compares the clustering algorithm proposed in [
17,
21] with other clustering methods from Kaldi and sklearn (
https://scikit-learn.org/stable/ accessed on 18 May 2021) libraries. For this set of experiments, we used the ResNet101_8k speaker verification system with the best configuration for this model, as discussed in
Section 4.2. First, we applied clustering methods with a reference number of clusters, where the number of speakers was computed based on original AMI annotation.
Spectral Clustering with cosine affinity and unnormalized modification;
Spectral Clustering with cosine affinity and without unnormalized modification from the sklearn package;
The k-means clustering algorithm from the sklearn package;
Gaussian mixture model with tied covariance matrices, trained on speaker-embedding vectors. The number of used gaussians was chosen according to the reference number of speakers;
The density-based spatial clustering of applications with noise (DBSCAN) algorithm was tested but a stable configuration yielding sufficient quality was not achieved; thus, the results of the method at hand are not presented in
Table 4.
Second, several clustering algorithms with automatic estimation of the number of clusters were compared.
All the results achieved for the clustering methods are presented in
Table 4. Based on these results, better performance was achieved using an unnormalized modification of the spectral clustering algorithm for both cases of the specified reference number of speaker clusters and for the estimated number of clusters.
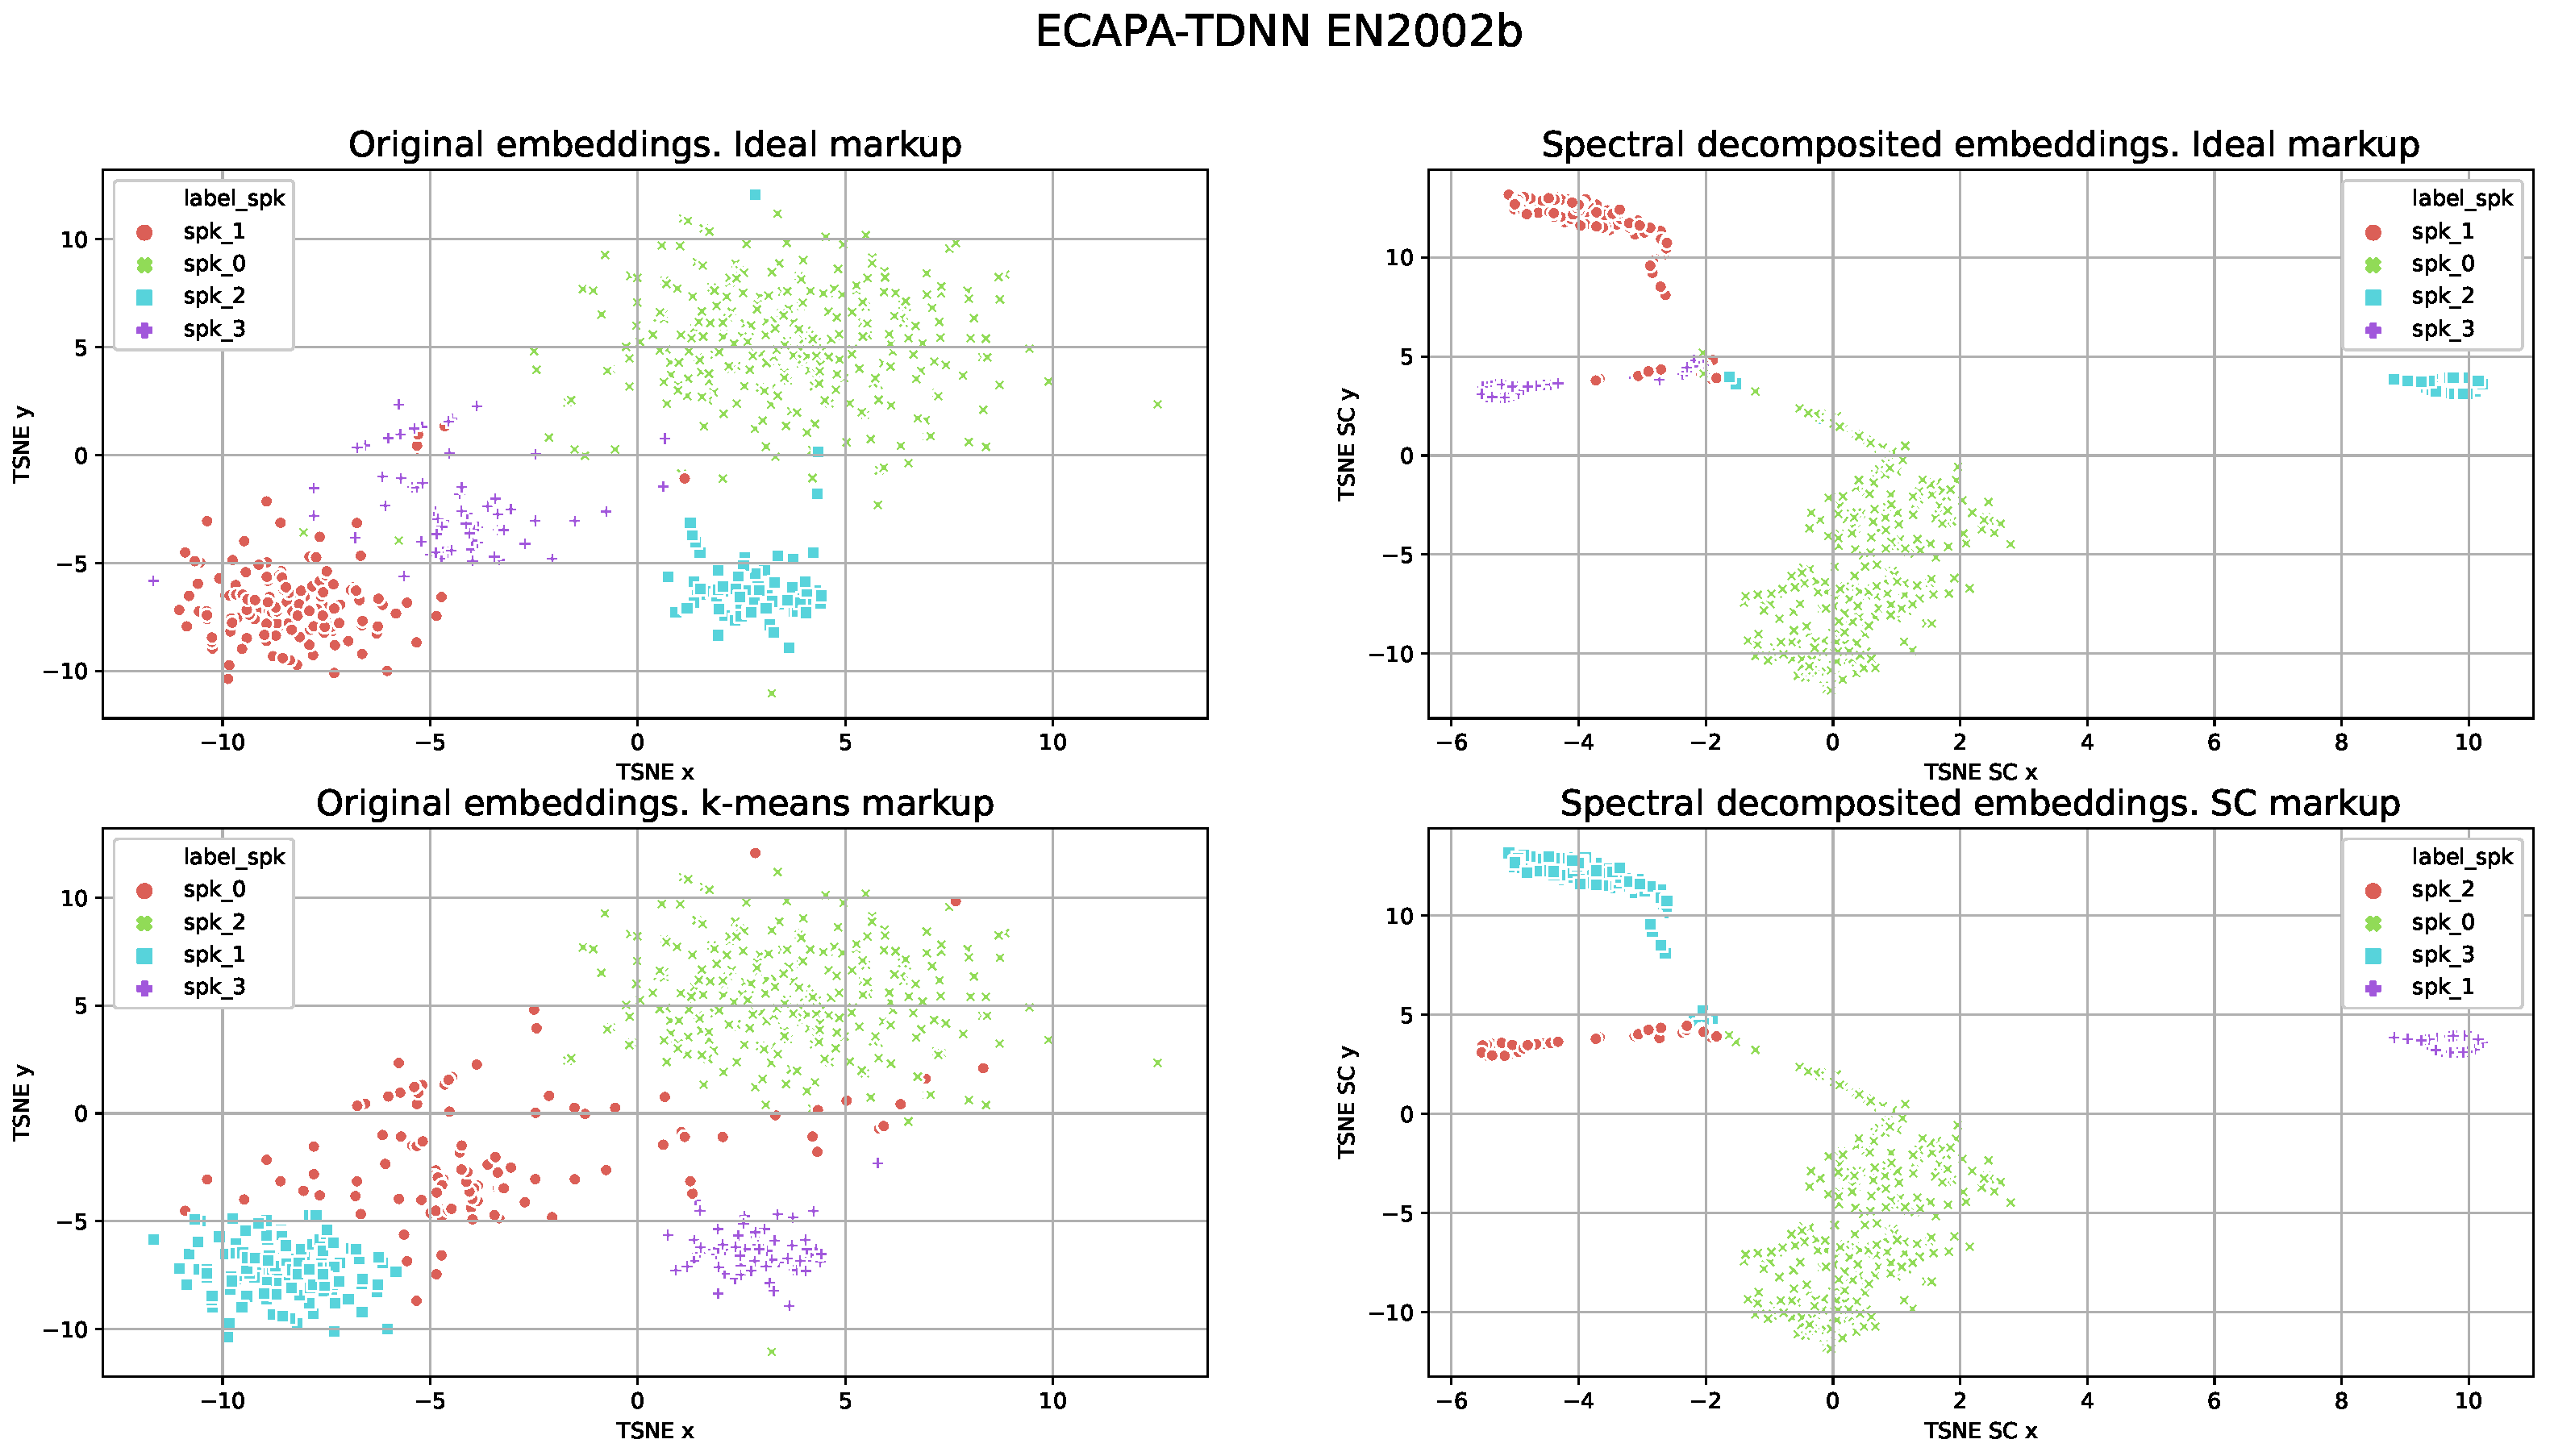
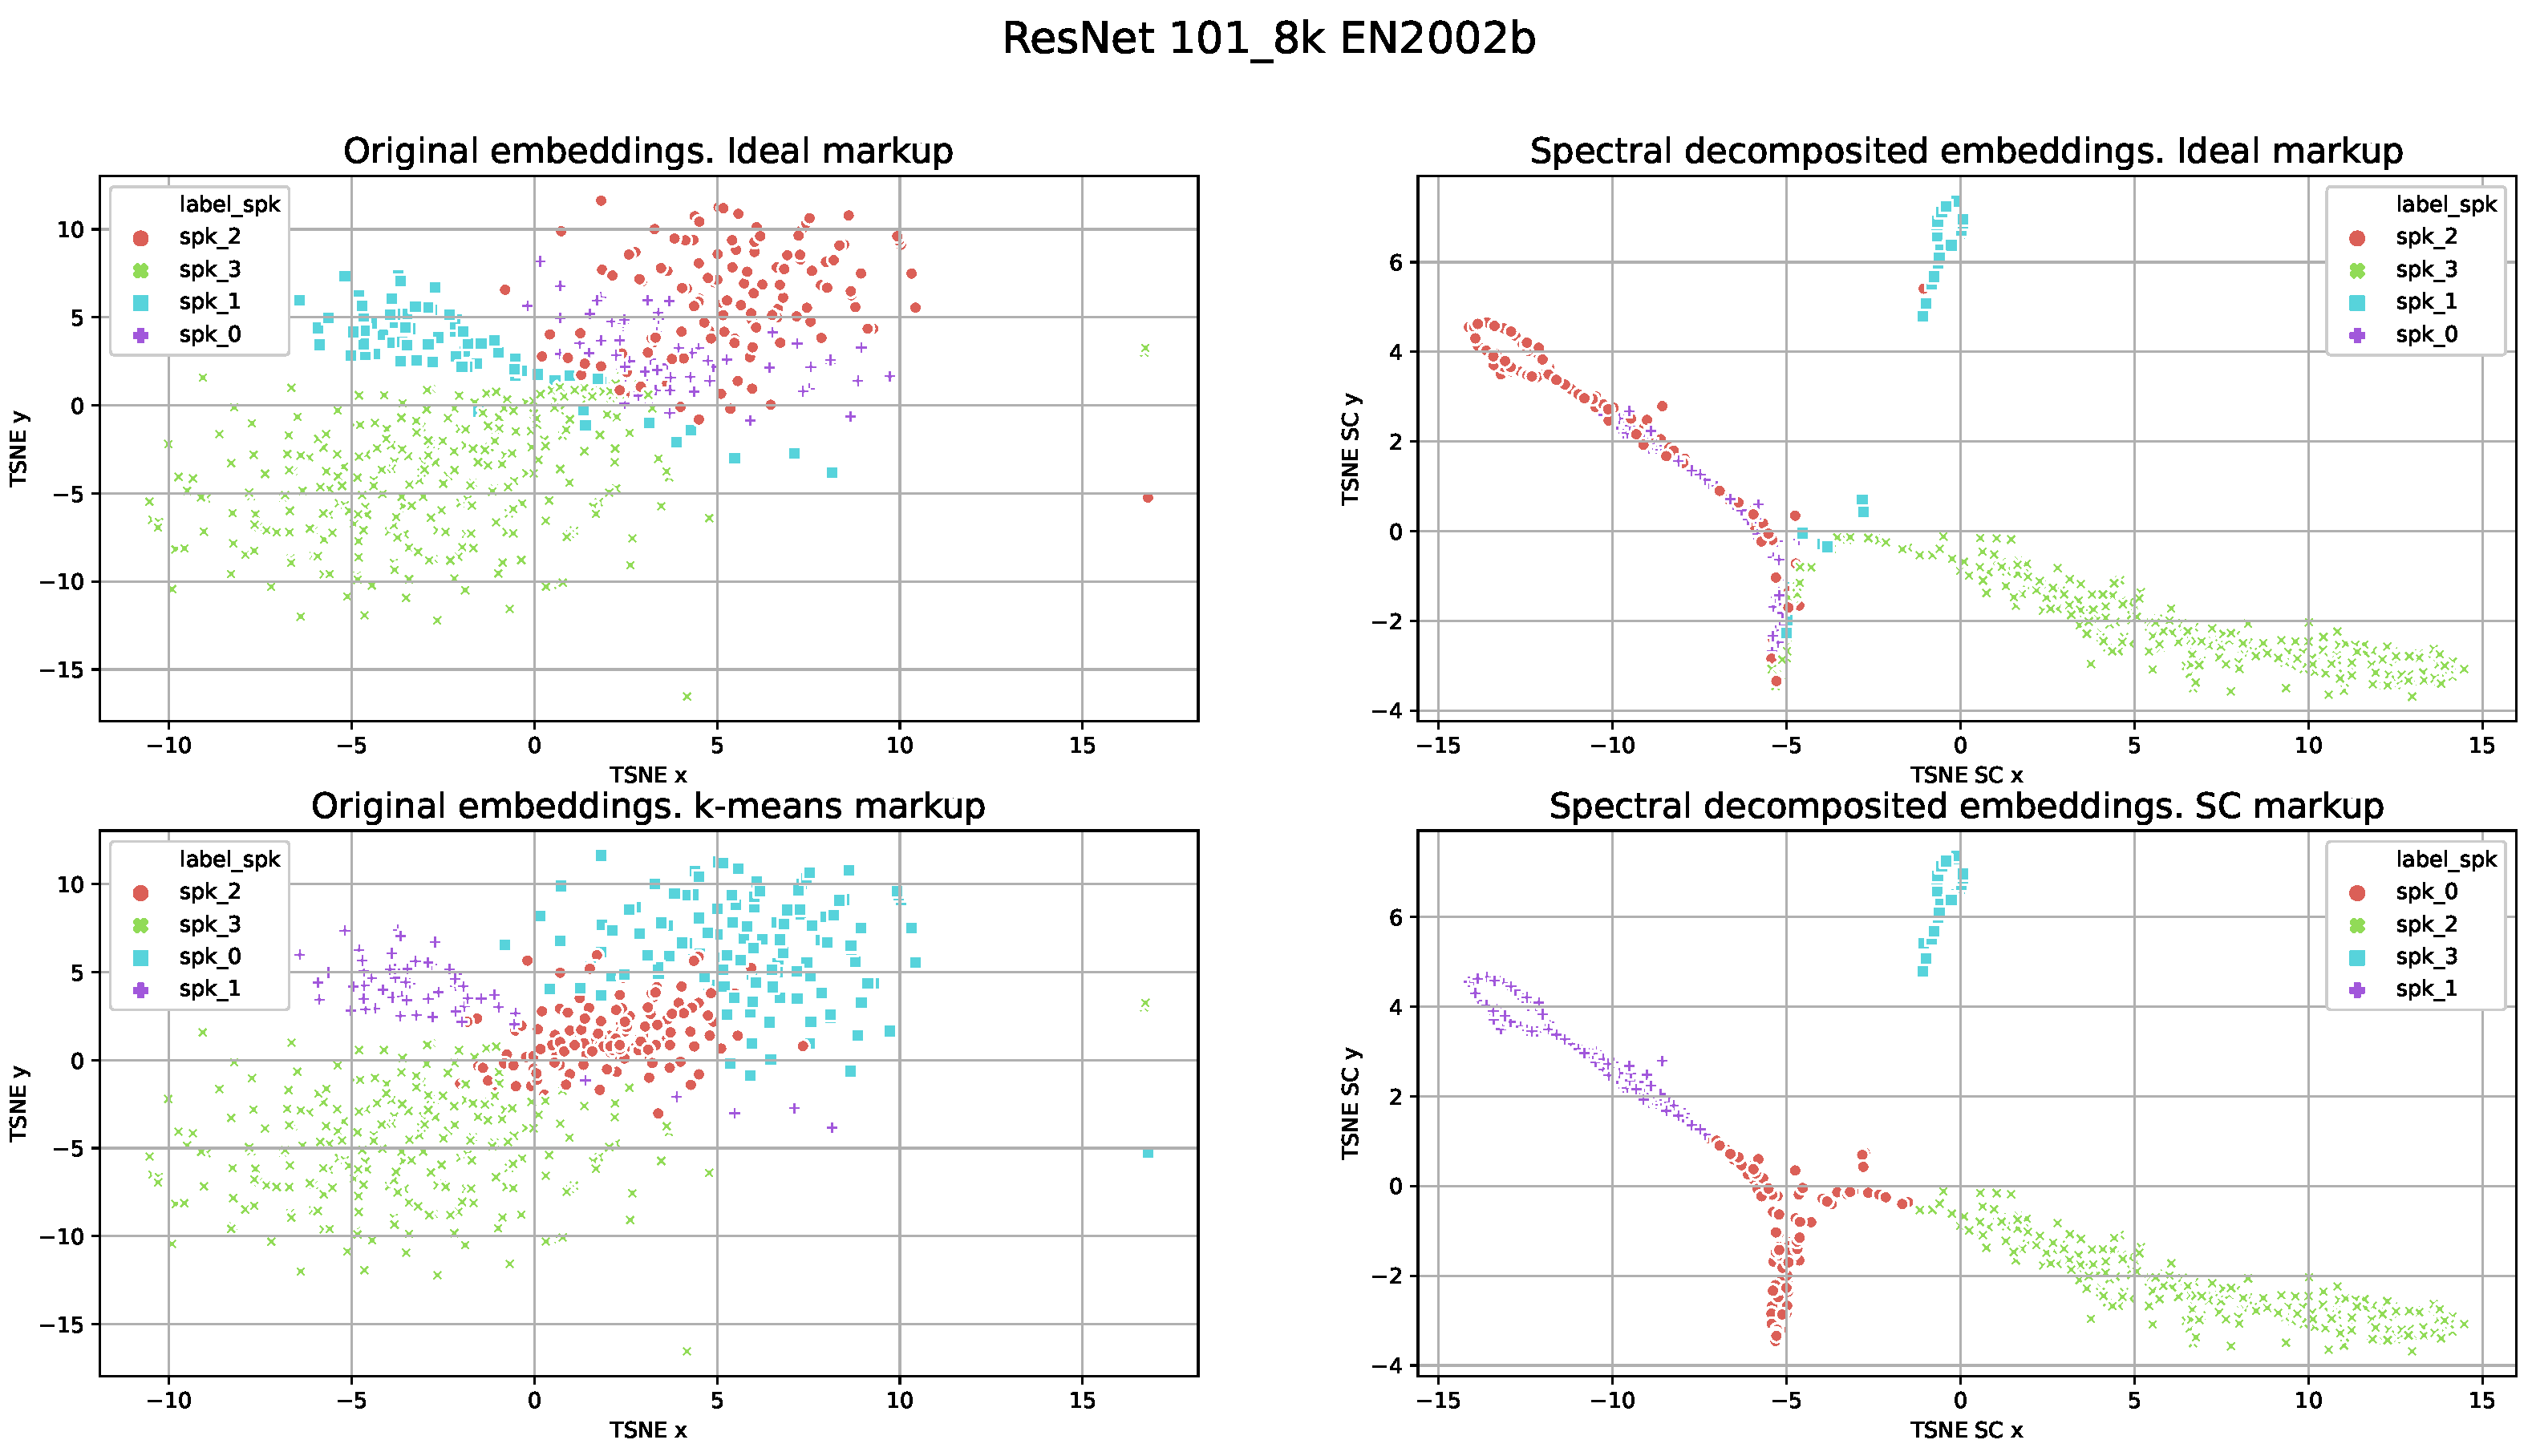
For the visualization of the markups produced by different speaker models, we used t-distributed stochastic neighbor embedding (TSNE). TSNE results for the ResNet101_8k and the ECAPA-TDNN models are presented in
Figure 3 and
Figure 4, respectively. The original speaker embeddings and their decomposed representations after spectral decomposition performed internally by SC are visualized. We used the ideal clustering markup with removed speech segments of overlapping speech, estimated after K-means testing for the original speaker embeddings after SC clustering. Note that for both models the results of DER for this file consisted of approximately 1–2% of samples.
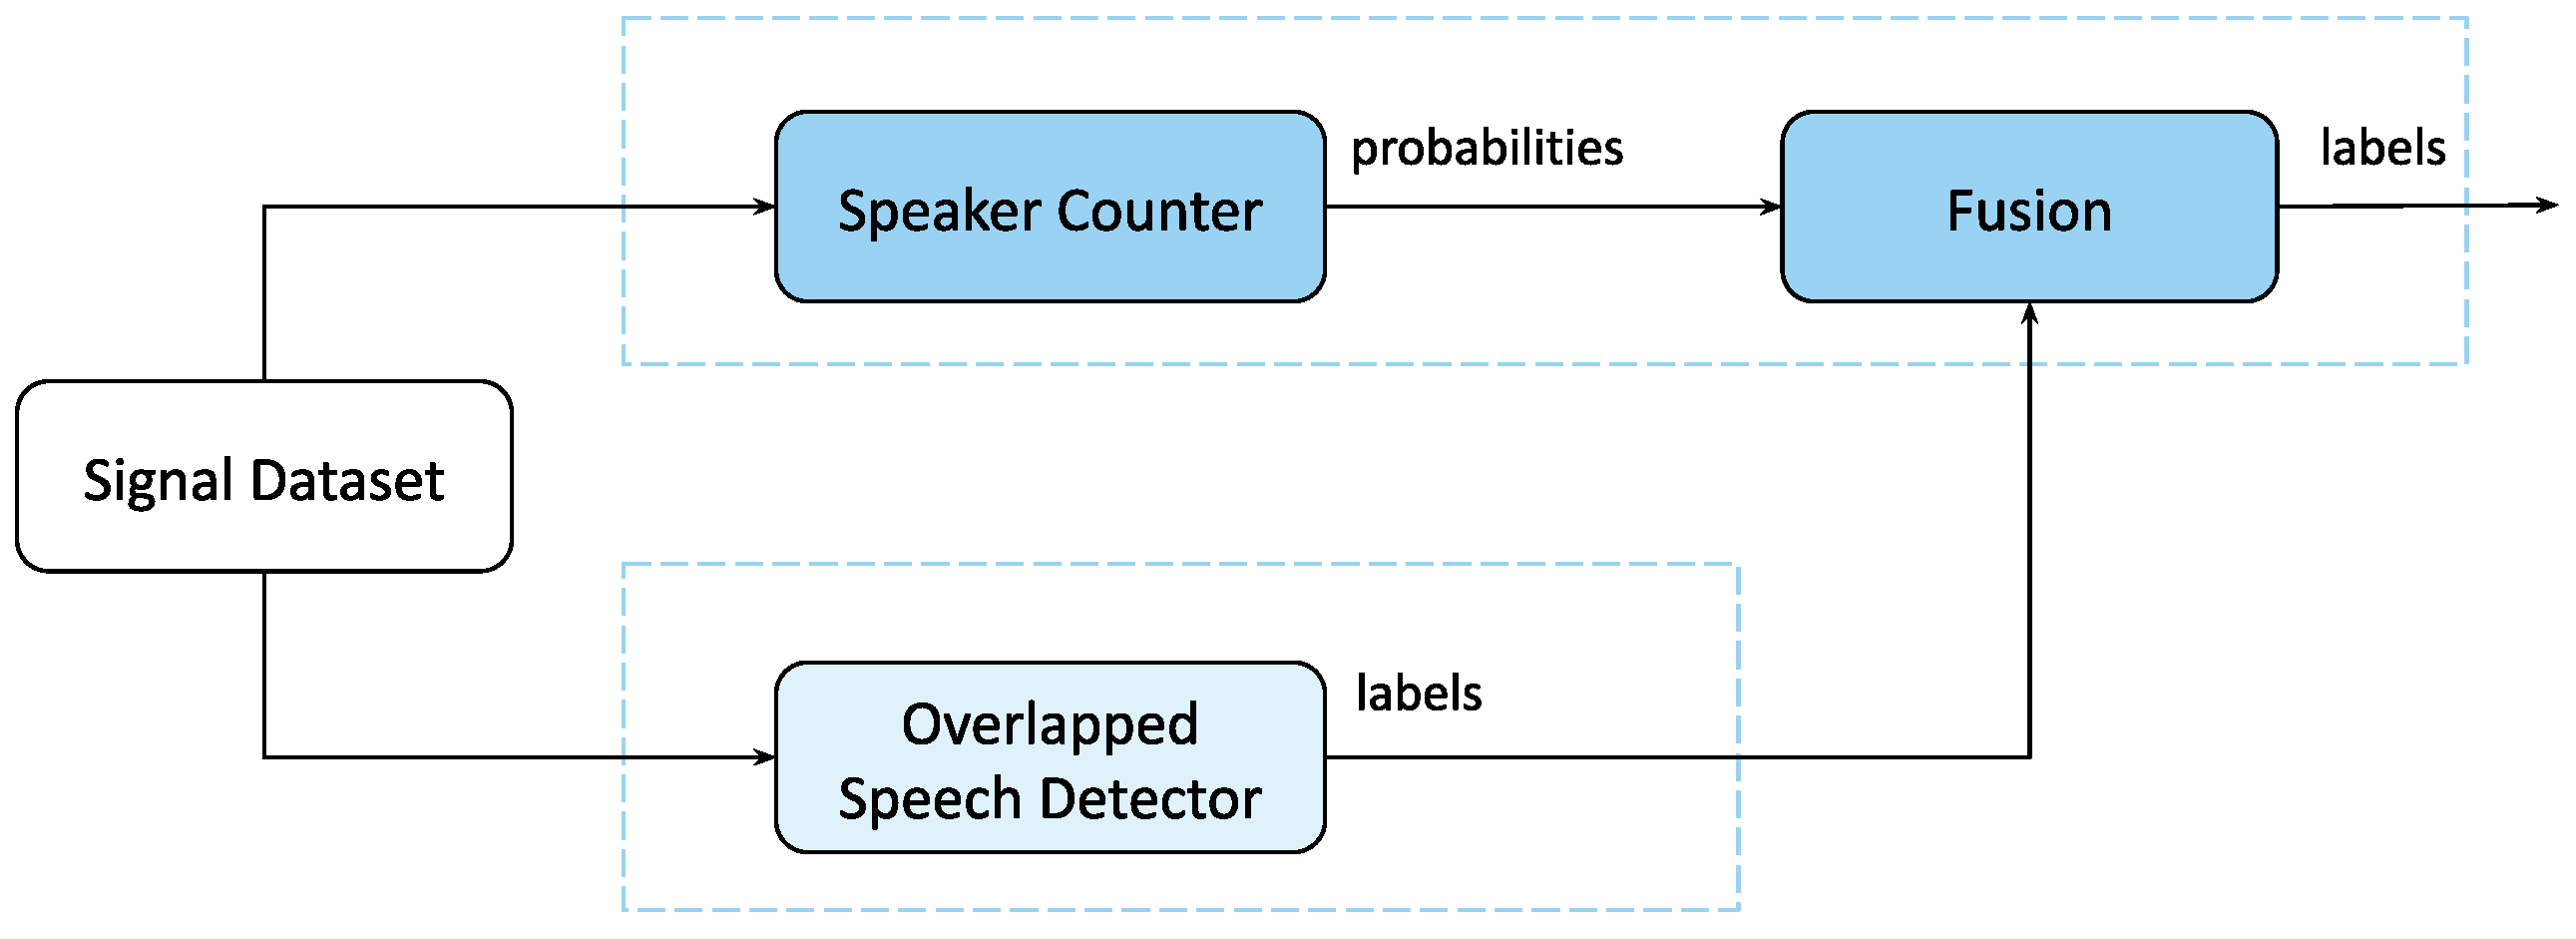
4.4. Fusion of SC and OSD Models
The fusion of the SC and OSD models was proposed to improve the quality of diarization during simultaneous speech. Combining these models, the SC performance can potentially be improved at the points of overlapping speech (
Figure 5). In a case in which the SC model does not perform well for the speaker number classes of 2, 3 and 4+ simultaneous speakers, but the binary problem of overlap/non-overlap detection yields sufficient estimation quality, the performance of SC may be tuned according to OSD estimates [
34]. If SC underestimates the number of speakers, marking most samples as one speaker, then, by fusing SC with OSD the samples with one speaker can be excluded, eliminating the classification error for samples with more than two reference speakers estimated as one speaker. On the other hand, SC may overestimate the number of speakers. In this case, by fusing the models and excluding samples containing 2–4+ speakers, the estimation quality for zero and one speakers can be improved [
34].
The principle of the proposed fusion method lies in adjusting the SC class probabilities based on the decision of OSD [
34]. If the decisions of the two models are logically in concurrence with one another, the SC probabilities are increased by applying a weight coefficient
. On the other hand, if the decisions of the two models are not in concurrence, the SC probabilities are reduced. Specifically, if OSD defines a speech segment as non-overlapping, then this estimate is used to increase SC probabilities for labels 0 and 1 (no active speaker, one active speaker), and reduce the probabilities for labels 2, 3, and 4+ (2, 3, 4+ active speakers). For segments with estimated overlapping speech, the SC probabilities for labels 2, 3, 4+ are increased, and reduced for labels 0 and 1. The fusion process is generalized by means of the following equation [
34]:
where
are the probabilities of
labels for a given segment,
and
are the OSD and SC estimates, respectively, and
is the weight coefficient. The value for
was chosen to be equal to 0.5 during our fusion experiments.
Table 5 also presents the confidence intervals for the F1-score. To calculate the confidence interval, we take the model results calculated on all files, randomly select 80% of labels, calculate the F1-score for them, and repeat this procedure 50 times. Then we compute 95% confidence intervals by applying the Python module scipy.stats (
https://docs.scipy.org/doc/scipy/reference/stats.html accessed on 21 June 2021), taking into account the fact that the obtained F1-score values belong to a normal distribution.
The SC model fused with OSD yields better speaker number estimation quality compared to the non-fused SC model. Experimental results show an increase in recognition quality for all classes, in particular for labels 1 and 2. The recall metric shows no increase, probably due to the fact that SC is initially efficient in classifying segments with numbers of speakers larger than two. The recall increases only when the number of speakers is equal to 1. This means that SC often tends to overestimate the number of speakers. A noticeable increase occurs in the precision metric. This indicates that SC has become more efficient in cases where the number of speakers is equal to 1, whereas previously it tended to overestimate the number of speakers in this case.
4.5. Fusion of Voice Annotation Methods
In the following experiments, we investigated the system VAD markup and reference number of speakers used for diarization. We focused on ways to improve the speech markup by fusing the results of various algorithms presented earlier in this study. For this purpose, a better configuration of VAD was obtained in terms of DER for the AMI evaluation dataset. We used results estimated by applying only the VAD markup as a baseline for other fusion results. We used the ResNet101_8k speaker verification system with the best configuration for the construction of diarization vectors using the system VAD markup. For each segment of the source utterance, the fusion algorithm computed a simple weighted sum of the probability of the presence of speech in the segment according to Equation (
6), where
corresponds to the probability of definition of an utterance segment as speech by VAD,
corresponds to the probability of definition of the utterance segment as speech by another method, and
serves as a weight coefficient. Note that the coefficient
in this regard differs from the coefficient applied in SC + OSD fusion in
Section 4.4. The best configuration of the independent fusion of VAD with QE and SC with OSD for the case when more than two methods are used is denoted as
Note that the better VAD configuration is slightly different for the development and evaluation sets of AMI. The experimental results of fusion are presented in
Table 6. The weight
differs depending on the methods to which fusion is applied. This allows one to estimate the best values of
, which are presented in the table as well. Based on these results, the following conclusions can be drawn:
Using the fused VAD significantly reduces the diarization error compared the baseline VAD system. In cases of the diarization of utterances recorded in simple environments (e.g., low noise and reverberation levels), it can be assumed that VAD error will prevail over speaker errors in terms of DER.
The QE and SC algorithms can be used for the clarification of FR errors, which leads to an error decrease in terms of DER. This effect can be observed for the high values of the fusion weight coefficient, when QE and SC help to clarify the markup in case of VAD uncertainty.
The application of all the algorithms considered in the article in concurrence leads to a significant improvement in the quality of diarization and reduces both FR and FA errors. This effect can be observed for small values, and probably indicates that VAD can be replaced by a fusion of the QE, SC and OSD methods.
The computation of the confidence interval for the DER metric was inspired by the Python scipy.stats.bootstrap method, and consisted of the following steps:
Create samples of length from the set of AMI scenarios, where N is the number of scenarios;
Compute the overall DER on that extracted subset;
Repeat steps 1. and 2. M times. In our case .
Compute 0.05 and 0.95 quantiles for the obtained array. The two resulting numbers correspond to the lower and upper bounds of the confidence interval.
5. Discussion
The performance of various speaker verification systems were investigated in this work with the aim of improving diarization quality. We found that the ResNet model outperformed the ECAPA-TDNN model, despite achieving worse quality in the in-domain task compared to the AMI speaker verification task. The best model configuration, diarization setup, and clustering methods were obtained for the AMI dataset to obtain better diarization quality in terms of DER. As far as the authors know, we report state-of-the-art results for the AMI dataset, reaching 1.58% DER for the AMI evaluation set for the lapel-mix microphone using a deeper ResNet model with better speaker discrimination ability. During our investigation we found that the data variability of the training dataset is important for the achievement of better diarization results, even while using 16 kHz telephone data. Further improving the quality of speaker verification models seems to be a good way to improve the quality of diarization. We confirmed the best quality of clustering for the unnormalized modification of spectral clustering compared to all other investigated methods of clustering.
In the case of the use of VAD markup, some ways to fuse different methods allowing an improvement in the quality of the estimated speech markup were considered. The fusion of VAD with methods of quality estimation, the speaker counter, and the overlapping speech detector allowed us to significantly decrease DER values from 40.35% DER to 14.31% DER. This improvement was achieved by reducing the number of errors of false rejection of speech fragments, as well as clarifying the markup of speech fragments by reducing the number of errors of false acceptance. At the same time, the number of errors involving the mixing up of speakers was still quite high, which was probably due to the difficulties in identifying mixed speech. Finding solutions for the diarization of mixed speech remains an important challenge.
By fusing the SC and OSD methods, the performance of speaker number estimation improved from 0.562 (by applying only SC) to 0.656 in terms of the F1-score. However, the estimation quality was less if the unbalanced real-life data from the AMI corpus was used for training, compared to the results obtained on synthetic mixtures of speakers. This is quite expected an explainable due to the nature of real conversations, specifically acquired from the far-field. It has been noted, though, that data augmentation which improves the balance of classes increases the estimation quality of the model. Therefore, further steps in our research include improving the fused SC and OSD system by training it on a more balanced and diverse dataset.


 ,
, 


