Article

A Fractional-Order Chaotic Sparrow Search Algorithm for Enhancement of Long Distance Iris Image

1
MOE Key Lab for Intelligent Networks and Network Security, School of Automation Science and Engineering, Faculty of Electronic and Information Engineering, Xi’an Jiaotong University, Xi’an 710049, China
2
International Collage, Hunan University of Arts and Sciences, Changde 415000, China
3
School of Physics and Electronics, Central South University, Changsha 410083, China
4
School of Computing and Information Technology, University of Wollongong, Wollongong, NSW 2522, Australia
*
Author to whom correspondence should be addressed.
Mathematics 2021, 9(21), 2790; https://doi.org/10.3390/math9212790
Submission received: 15 October 2021 / Revised: 29 October 2021 / Accepted: 29 October 2021 / Published: 3 November 2021

Abstract

:
At present, iris recognition has been widely used as a biometrics-based security enhancement technology. However, in some application scenarios where a long-distance camera is used, due to the limitations of equipment and environment, the collected iris images cannot achieve the ideal image quality for recognition. To solve this problem, we proposed a modified sparrow search algorithm (SSA) called chaotic pareto sparrow search algorithm (CPSSA) in this paper. First, fractional-order chaos is introduced to enhance the diversity of the population of sparrows. Second, we introduce the Pareto distribution to modify the positions of finders and scroungers in the SSA. These can not only ensure global convergence, but also effectively avoid the local optimum issue. Third, based on the traditional contrast limited adaptive histogram equalization (CLAHE) method, CPSSA is used to find the best clipping limit value to limit the contrast. The standard deviation, edge content, and entropy are introduced into the fitness function to evaluate the enhancement effect of the iris image. The clipping values vary with the pictures, which can produce a better enhancement effect. The simulation results based on the 12 benchmark functions show that the proposed CPSSA is superior to the traditional SSA, particle swarm optimization algorithm (PSO), and artificial bee colony algorithm (ABC). Finally, CPSSA is applied to enhance the long-distance iris images to demonstrate its robustness. Experiment results show that CPSSA is more efficient for practical engineering applications. It can significantly improve the image contrast, enrich the image details, and improve the accuracy of iris recognition.

1. Introduction

1.1. Research Background

Biometric identification has became an important approach to protect information security. It uses the human body’s biologic characteristics such as iris, face, vein, and fingerprint recognition. Among these, iris images offer some excellent characteristics for identity recognition, such as uniqueness, stability, contactless, and anti-counterfeiting. At present, iris authentication and recognition is one of the most secure and reliable biometric technologies [1].
In the applications of long-distance iris recognition, the quality of iris image is generally lower than that of traditional cooperative iris image due to the constraints of acquisition environment and human cooperation [2]. Low-quality iris images have low contrast, unclear details, and some noise. These are inferior for identity recognition due to the loss of some texture information [3]. On the other hand, the iris edge and pupil center may not be accurately located. This will lead to iris segmentation errors, bring difficulties to subsequent image analysis and affect the accuracy of iris recognition [4]. Therefore, the enhancement of iris image is necessary to provide more effective features for feature detection and recognition. However, the iris image enhancement is quite different from the traditional image enhancement. It not only needs to enhance the visual clarity, but also requires the enhanced image to have good performance in detection and recognition [5].
Generally, the process of biometric recognition is generally divided in four steps, i.e., image acquisition, image preprocessing, feature extraction, and feature matching. Image enhancement is a critical part of image preprocessing and plays an important role in computer vision, pattern recognition, and other fields. The purpose of image enhancement is to enhance the appearance of the image by correcting the image in order to produce an intuitive, vivid, and suitable image for further image analysis [6].
Among the existing methods, histogram equalization (HE) is one of the most widely used algorithm in image enhancement [7]. It can improve the appearance of the image by stretching the histogram for satisfying the image contrast [8]. Histogram stretching is designed based on the gray grouping method, which can be applied to images with low contrast and low brightness. It has advantages with respect to the high efficiency and simplicity. Although it is an effective method in iris image enhancement technology [9], if there is a high peak in the histogram, it may unfortunately over-enhance the image [10]. In order to overcome the above problems, many researchers have developed some local enhancement methods. For instance, the adaptive histogram equalization (AHE) [11] and the contrast-limited adaptive histogram equalization algorithm (CLAHE) [12] are two classical and most recent advances in this field. In AHE, the local information is considered while enhancing the image. Thus, it can enhance textures and details of the image. Then, the image could have contained sharper edges. However, this method produces a lot of noise and needs long computation time. On the basis of AHE, the histogram of each sub-image is limited by CLAHE. The noise generated by AHE is reduced so that the image contrast will be more vivid. However, the clipping value in the CLAHE cannot be selected adaptively. In [13], Vidya et al. proposed a novel triangular fuzzy membership (TFM) function-based CLAHE (TFM-CLAHE) to solve this problem. The algorithm has good effect on the iris, face, fingerprint, and other biological images. However, the work in [13] only uses some objective indicators such as Peak Signal Noise Ratio (PSNR), Mean Square Error (MSE), and Average Information Content (AIC) to evaluate the effect of TFM-CLAHE.

1.2. Related Works

In order to solve the above problems, in recent years, many researchers have developed different swarm intelligence (SI) optimization algorithms for image enhancement, such as particle swarm optimization algorithm [14], and immune algorithm [15]. Table 1 summarizes several newly published related works.
As can be seen from Table 1, for this hot research field, many SI optimization algorithms have been used to enhance various types of images. This type of algorithm has advantages such as simple implementation and easy expansion. They have attracted increasing attention from the related research community. Among them, a sparrow search algorithm (SSA) proposed by Xue and Shen in 2020 is a novel SI optimization algorithm [28]. Compared with other SI optimization algorithms, SSA has higher search accuracy, faster convergence speed, better stability, and stronger robustness. However, like other swarm intelligence optimization algorithms, SSA is also prone to fall into a local optimum. At present, there are some other efforts trying to improve the SSA. For example, Liu et al. [29] used the chaos to strengthen the diversity of the population and use Cauchy–Gaussian mutation to avoid obvious local optimization. Zhou et al. [30] modified the location update of scrounger by introducing GA strategy to achieve a higher convergence rate than the traditional SSA. Therefore, using a modified SSA to enhance the long-distance iris image so as to improve its recognition accuracy has a potential application value.

1.3. Contributions

In this paper, we further propose an innovative modified sparrow search algorithm named chaotic pareto sparrow search algorithm (CPSSA) to enhance the long-distance iris image. The algorithm includes the following steps:
(1)
The population is initialized by fractional chaotic mapping to make the initial individual sparrows distributed as evenly as possible.
(2)
The locations of the finder and scroungers are updated with the Pareto distribution to speed up its global convergence and to avoid falling into a local optimum.
(3)
The standard deviation, edge content, and entropy are integrated into the evaluation function to assess the enhancement effect of the obtained iris image.
Through the simulation experiments based on 12 benchmark test functions, we have validated and verified that the performance of accuracy and stability of CPSSA are much better than the original SSA, PSO, and ABC. Furthermore, the CPSSA algorithm is successfully applied to long-distance iris image enhancement, where our experimental results show that among all the algorithms tested in this paper, the CPSSA has the best performance. The recognition rate of the enhanced iris image has been significantly improved. The rest of this paper is organized as follows. Section 2 represents details of the modified SSA. Section 3 shows the results of the CPSSA based on the benchmark function, and the experimental results for enhancing the long-distance iris image are carried out. Section 4 summarizes the complete analysis and concludes the paper.

2. Methods

2.1. The Sparrow Search Algorithm

In nature, as social birds, sparrows have three roles for the division of labor in the population: finders, scroungers, and scouts. Finders are sparrows who are looking for food. Scroungers are other sparrows who use the position of finders to get food. Scouts are sparrows who are watching for danger. Among them, the finders and the scroungers can convert roles between each other. However, the proportion remains constant. Finders generally account for 10–20% of the population. As the guide of foraging, finders search a wide range and constantly update their position to obtain the foods while the scroungers continue to forage with the finders to attain a status of a higher fitness. However, due to the threats of predators at any time, 10–20% sparrows in the population will be selected randomly as scouts. Scouts will give off a warning signal to the population immediately when a danger occurs. Then, the whole population will be in an anti-predator state. In the SSA, the sparrow foraging process is simulated to obtain the solution of the optimization problem. Assuming that there are N sparrows in a D-dimensional search space, the position of the ith sparrow in the D-dimensional search space is X i = x i 1 , , x i j , , x i D , where i = 1 , 2 , , N .
The position of the finders is updated with
x i j t + 1 = x i j t exp i α M a x C y c l e , R 2 < S T x i j t + Q L , R 2 S T
where t indicates the current iteration, j = 1 , 2 , , D . M a x C y c l e represents the maximum number of iterations. α ( 0 , 1 ] is a random number, and R 2 0 , 1 and S T 0.5 , 1 indicates the alarm value and the safety threshold, respectively. Q is a random number subject to standard normal distribution. L is a matrix of 1 × D and the elements are initialized to 1.
The position update formula for the scrounger is described as
X i , j t + 1 = Q exp x worst t x i j t i 2 , i f , i > N / 2 X P t + 1 + X i , j t X P t + 1 A + L , o t h e r w i s e
where X P t + 1 represents the best position of the finders at iteration t + 1 and x worst t represents the current global worst location. A is a matrix of 1 × D . All the elements inside matrix A are assigned 1 or 1 , randomly. A + = A T A A T 1 .
Moreover, the location of the scouts is updated by
X i , j t + 1 = X best t + β · X i , j t X best t , if f i > f g X i , j t + K · X i , j t X worst t f i f w + ε , if f i = f g
where X b e s t is the best position at iteration t. β is a random number with a normal distribution, for which an average value is 0 and a variance is 1. It works as a step size control parameter. f i , f g , and f w represent the current sparrow fitness value, the best fitness value, and the worst fitness value, respectively. K is a random number between 1 and 1. ϵ is a very small constant to avoid zero-division-error.

2.2. Chaotic Pareto Sparrow Search Algorithm

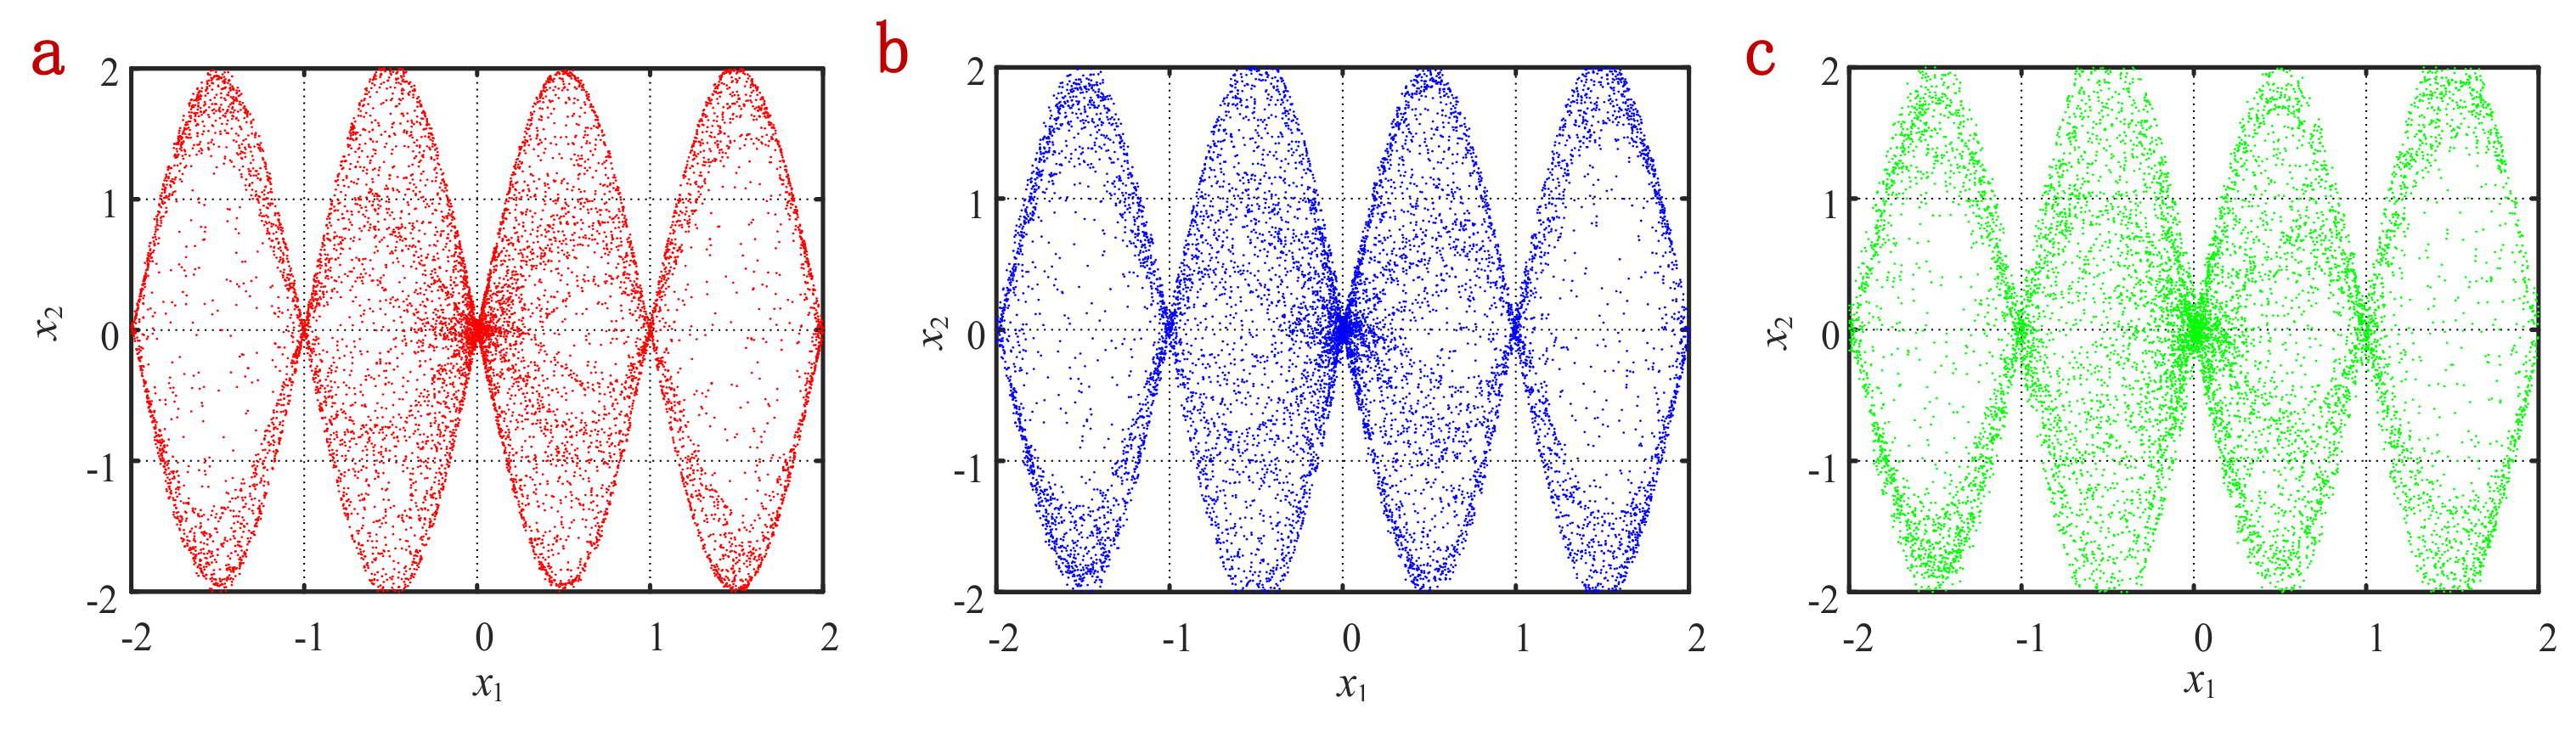
2.2.1. Initializing Population with Fractional Chaotic Sequence

Chaos, as a universal nonlinear phenomenon in nature, is widely applied to the optimization search problem because the chaotic variables have the characteristics of randomness, ergodicity, and regularity. It can not only effectively maintain the diversity of the population, but also help the algorithm jump out of the local optimization and improve the global search ability [31]. Fractional order chaos can produce chaotic sequences with more uniform ergodicity and faster convergence speed [32]. He et al. [32] proposed a fractional-order 2D-SIMM chaotic system, which is given by Equation (4):
C Δ t 0 q x 1 ( t ) = a sin ( ω x 2 ( t + q 1 ) ) sin ( b / x 1 ( t + q 1 ) ) x 1 ( t + q 1 ) C Δ t 0 q x 2 ( t ) = a sin ( ω x 1 ( t + q ) ) sin ( b / x 2 ( t + q 1 ) ) x 2 ( t + q 1 )
where a, b, and ω are the system parameters; a , b , ω ( 0 , + ) , t R ; and  C Δ t 0 q is the Caputo-like fractional difference. Definitions regarding C Δ t 0 q are presented in Definitions 1 and 2.
Definition 1
([33]). Suppose that u : N t 0 R , the discrete fractional-order integral with order q ( q > 0 ) is defined as
Δ t 0 q u ( t ) : = 1 Γ ( q ) s = t 0 t q ( t σ ( s ) ) ( q 1 ) u ( s ) ,
where t R and t 0 is the start time, Γ ( q ) is the Gamma function, and t ( q ) is the falling factoria.
For the Gamma function, it is defined by Γ ( q ) = 0 + e q 1 e t d t . When σ ( s ) = s + 1 , the falling factoria is given by
t ( q ) = Γ ( t + 1 ) Γ ( t + 1 q ) .
Definition 2
([33]). For q > 0 , q N and u ( t ) defined on N t 0 , the fractional-order Caputo-like delta difference is defined as
C Δ t 0 q u ( t ) : = Δ t 0 ( m q ) Δ m u ( t ) = 1 Γ ( m q ) s = t 0 t ( m q ) ( t σ ( s ) ) ( m q 1 ) Δ m u ( s ) ,
where t N t 0 + m q , q is the fractional difference order, and  m = q .
As a result, the numerical solution of this system is given as [32]
x 1 i + 1 = x 1 ( 0 ) + 1 Γ ( q ) j = 1 i + 1 Γ i j + q Γ i j + 1 a sin ω x 2 j 1 sin b x 1 j 1 x 1 j 1 x 2 i + 1 = x 2 ( 0 ) + 1 Γ ( q ) j = 1 i + 1 Γ i j + q Γ i j + 1 a sin ω x 1 j 1 sin b x 2 j 1 x 2 j 1 ,
where q ( 0 , 1 ] , and Γ · is the gamma function. Let a = 2 , b = 3 , and  ω = π , the  phase diagrams are shown in Figure 1.
The process of initializing population with fractional chaotic sequence is as follows:
(1)
Let a = 2 , b = 3 , ω = π , and q = 0.9 .
(2)
Two chaotic sequences x 1 or x 2 are generated by Equation (8).
(3)
Take one of the chaotic sequences in step 2, for instance, x 1 , and map it to the solution space of the problem to be solved.
Thus, the newly generated chaotic sequence Z is used as the initial value of sparrow population, which is given by
Z = l b + u b l b x 1
where u b and l b are the maximum and minimum value of the problem to be solved, respectively.

2.2.2. Updating Finders’ and Scroungers’ Locations

In the classical sparrow algorithm, when R 2 < S T , the location update of the finder is related to the maximum number of iterations. The more iteration it runs, the better the results it yields. However, it certainly needs more computation time. According to the optimization method proposed in [34], the Pareto distribution is very useful for finders’ location. If the cumulative distribution function of a random variable has the following expression, it is said to obey the Pareto distribution [34].
F ( x 3 ) = 1 k x 3 h , x 3 k 0 , x 3 < k
where k > 0 is the scale parameter and h > 0 is the shape parameter which indicates the Pareto’s index of inequality.
We can use Pareto distribution to improve the position of the finders in the SSA when R 2 < S T . The formula is given by
x i j t + 1 = x i j t + Q L , R 2 S T x i j t + α P a r e t o ( k , h ) ( x i t x b e s t ) , R 2 < S T
where P a r e t o k , h represents a random number drawn from the Pareto distribution.
When scroungers in SSA are close to the optimal position, the algorithm can converge rapidly. However, this will reduce the variety of the sparrow community, and the algorithm result is more likely to sink into a local optimum. The Pareto distribution is helpful for the algorithm to escape the local optimum [35]. Therefore, the updating position formula of the scroungers in SSA is modified, which is given by
x i j t + 1 = Q · exp x w j t x i j t i 2 , i > n / 2 x i j t + α P a r e t o ( k , h ) ( x i t x b e s t ) , otherwise .

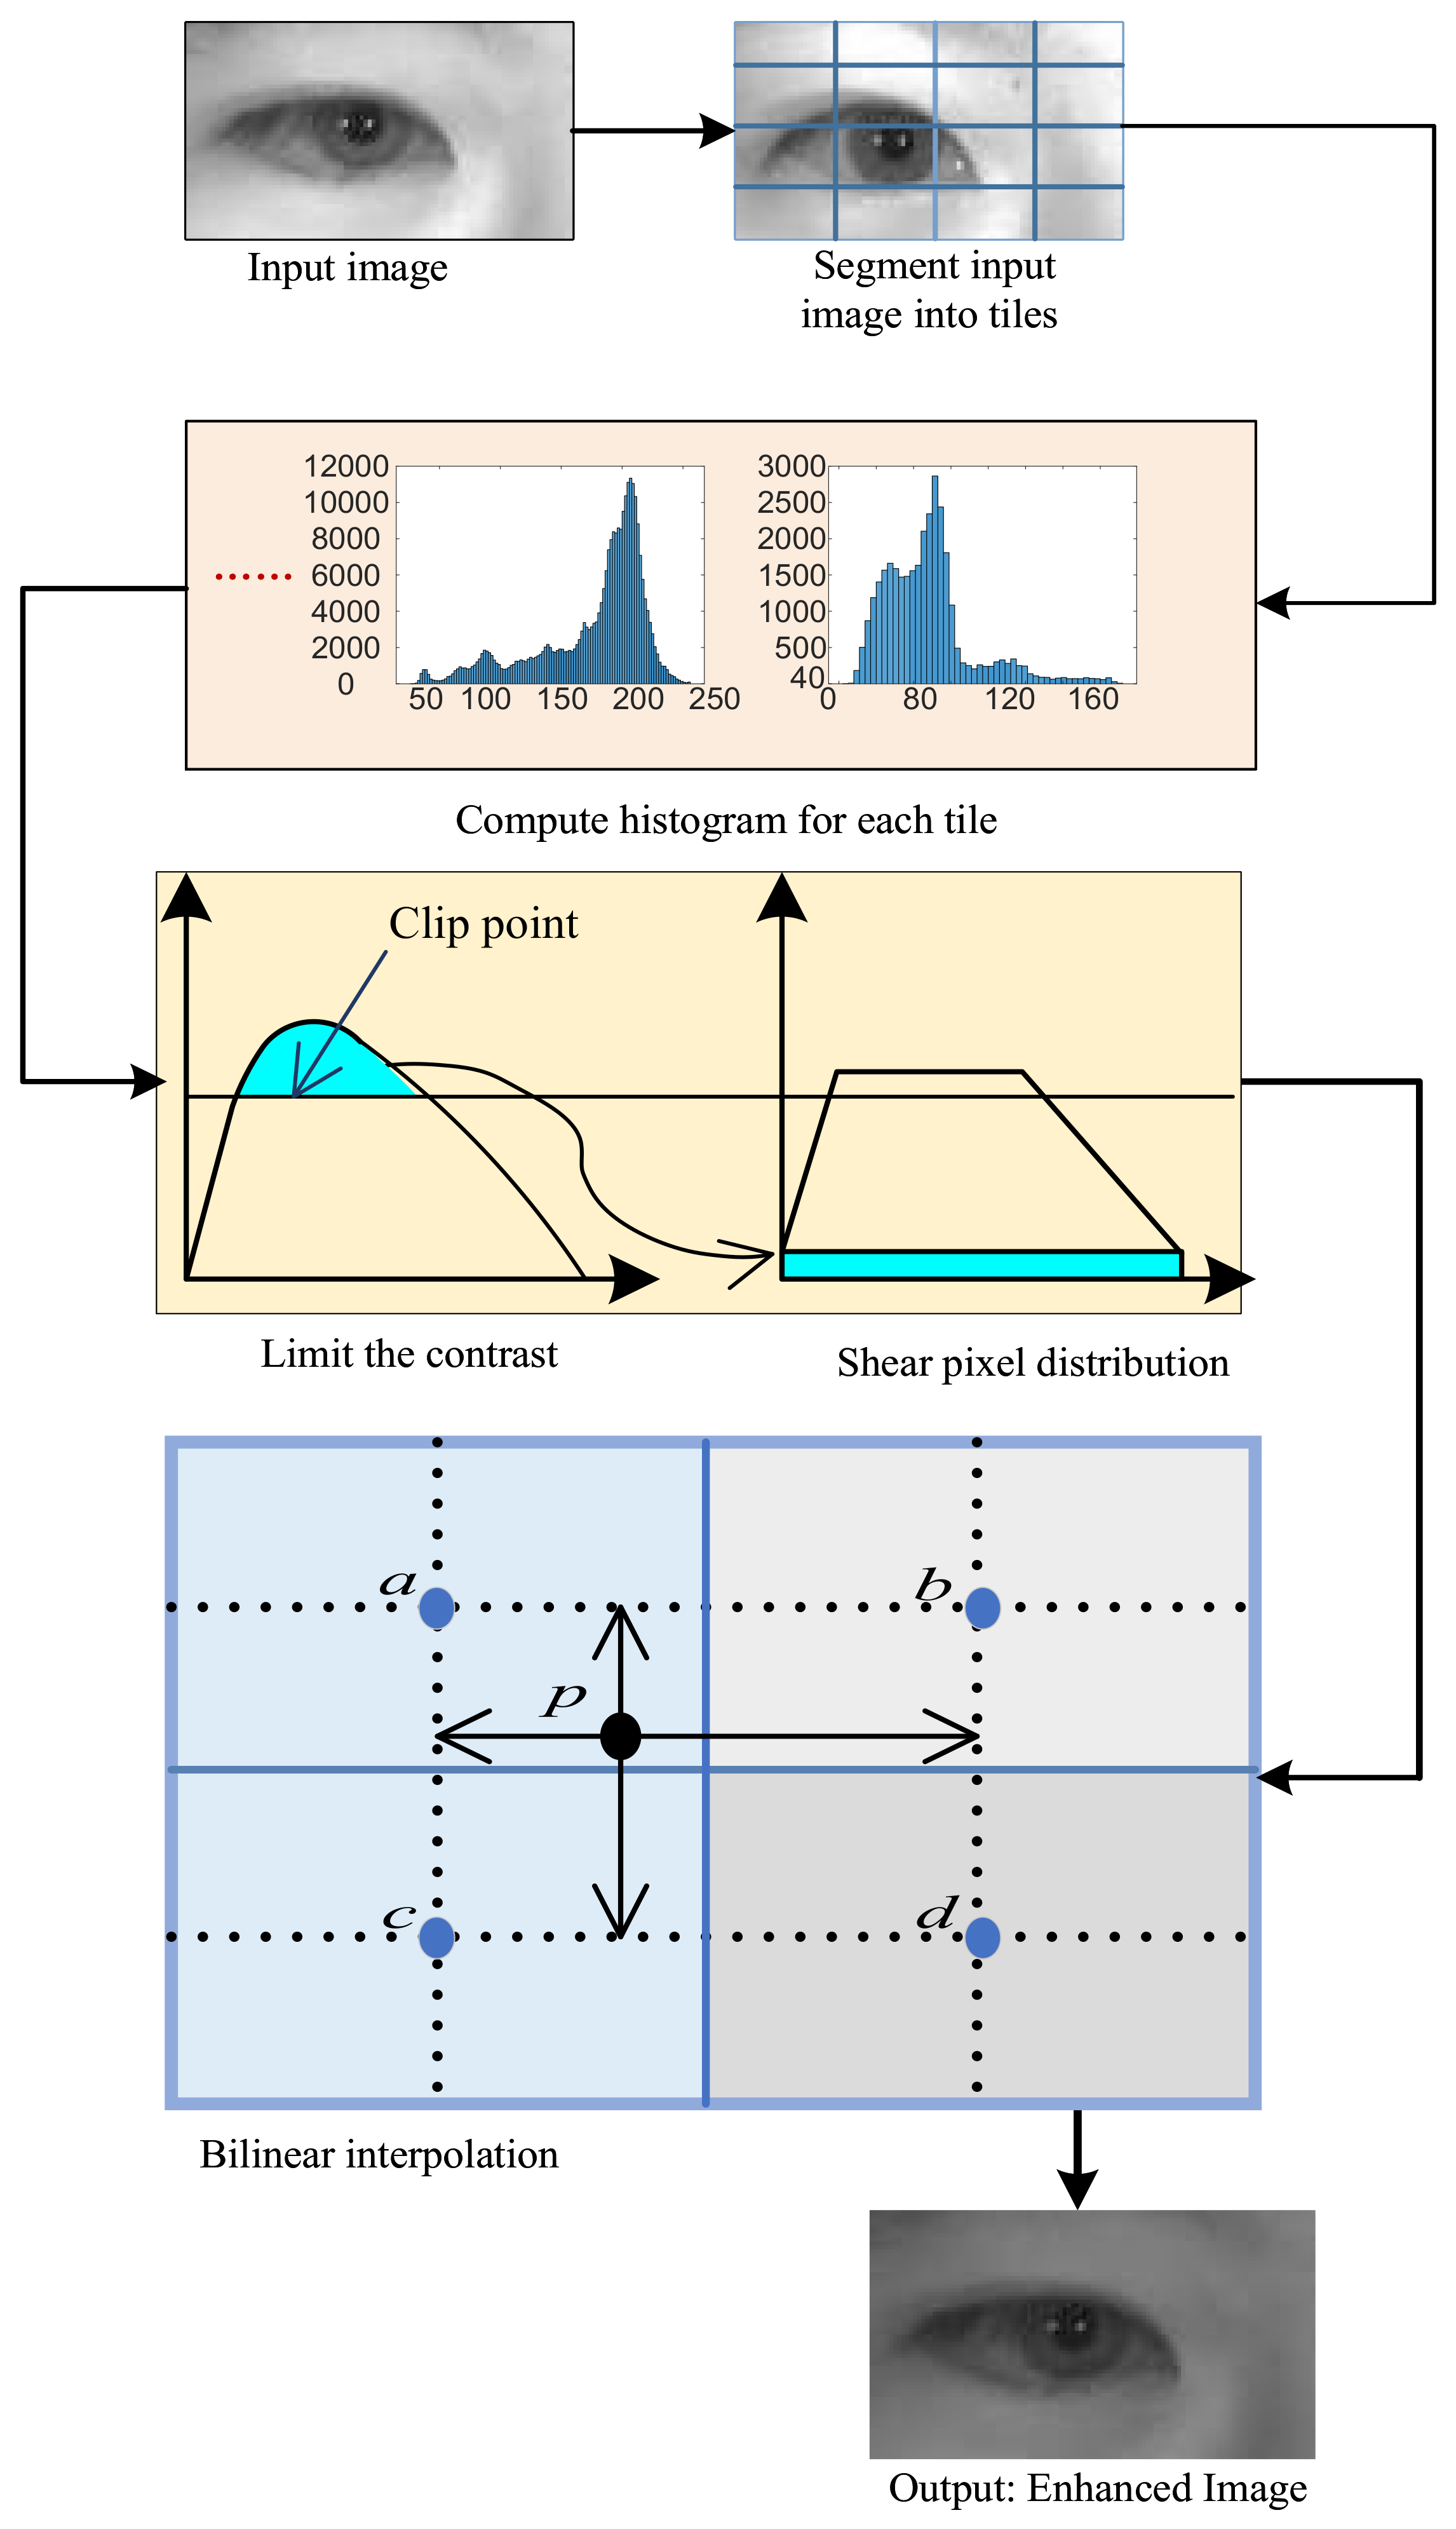
2.3. Overview of CLAHE
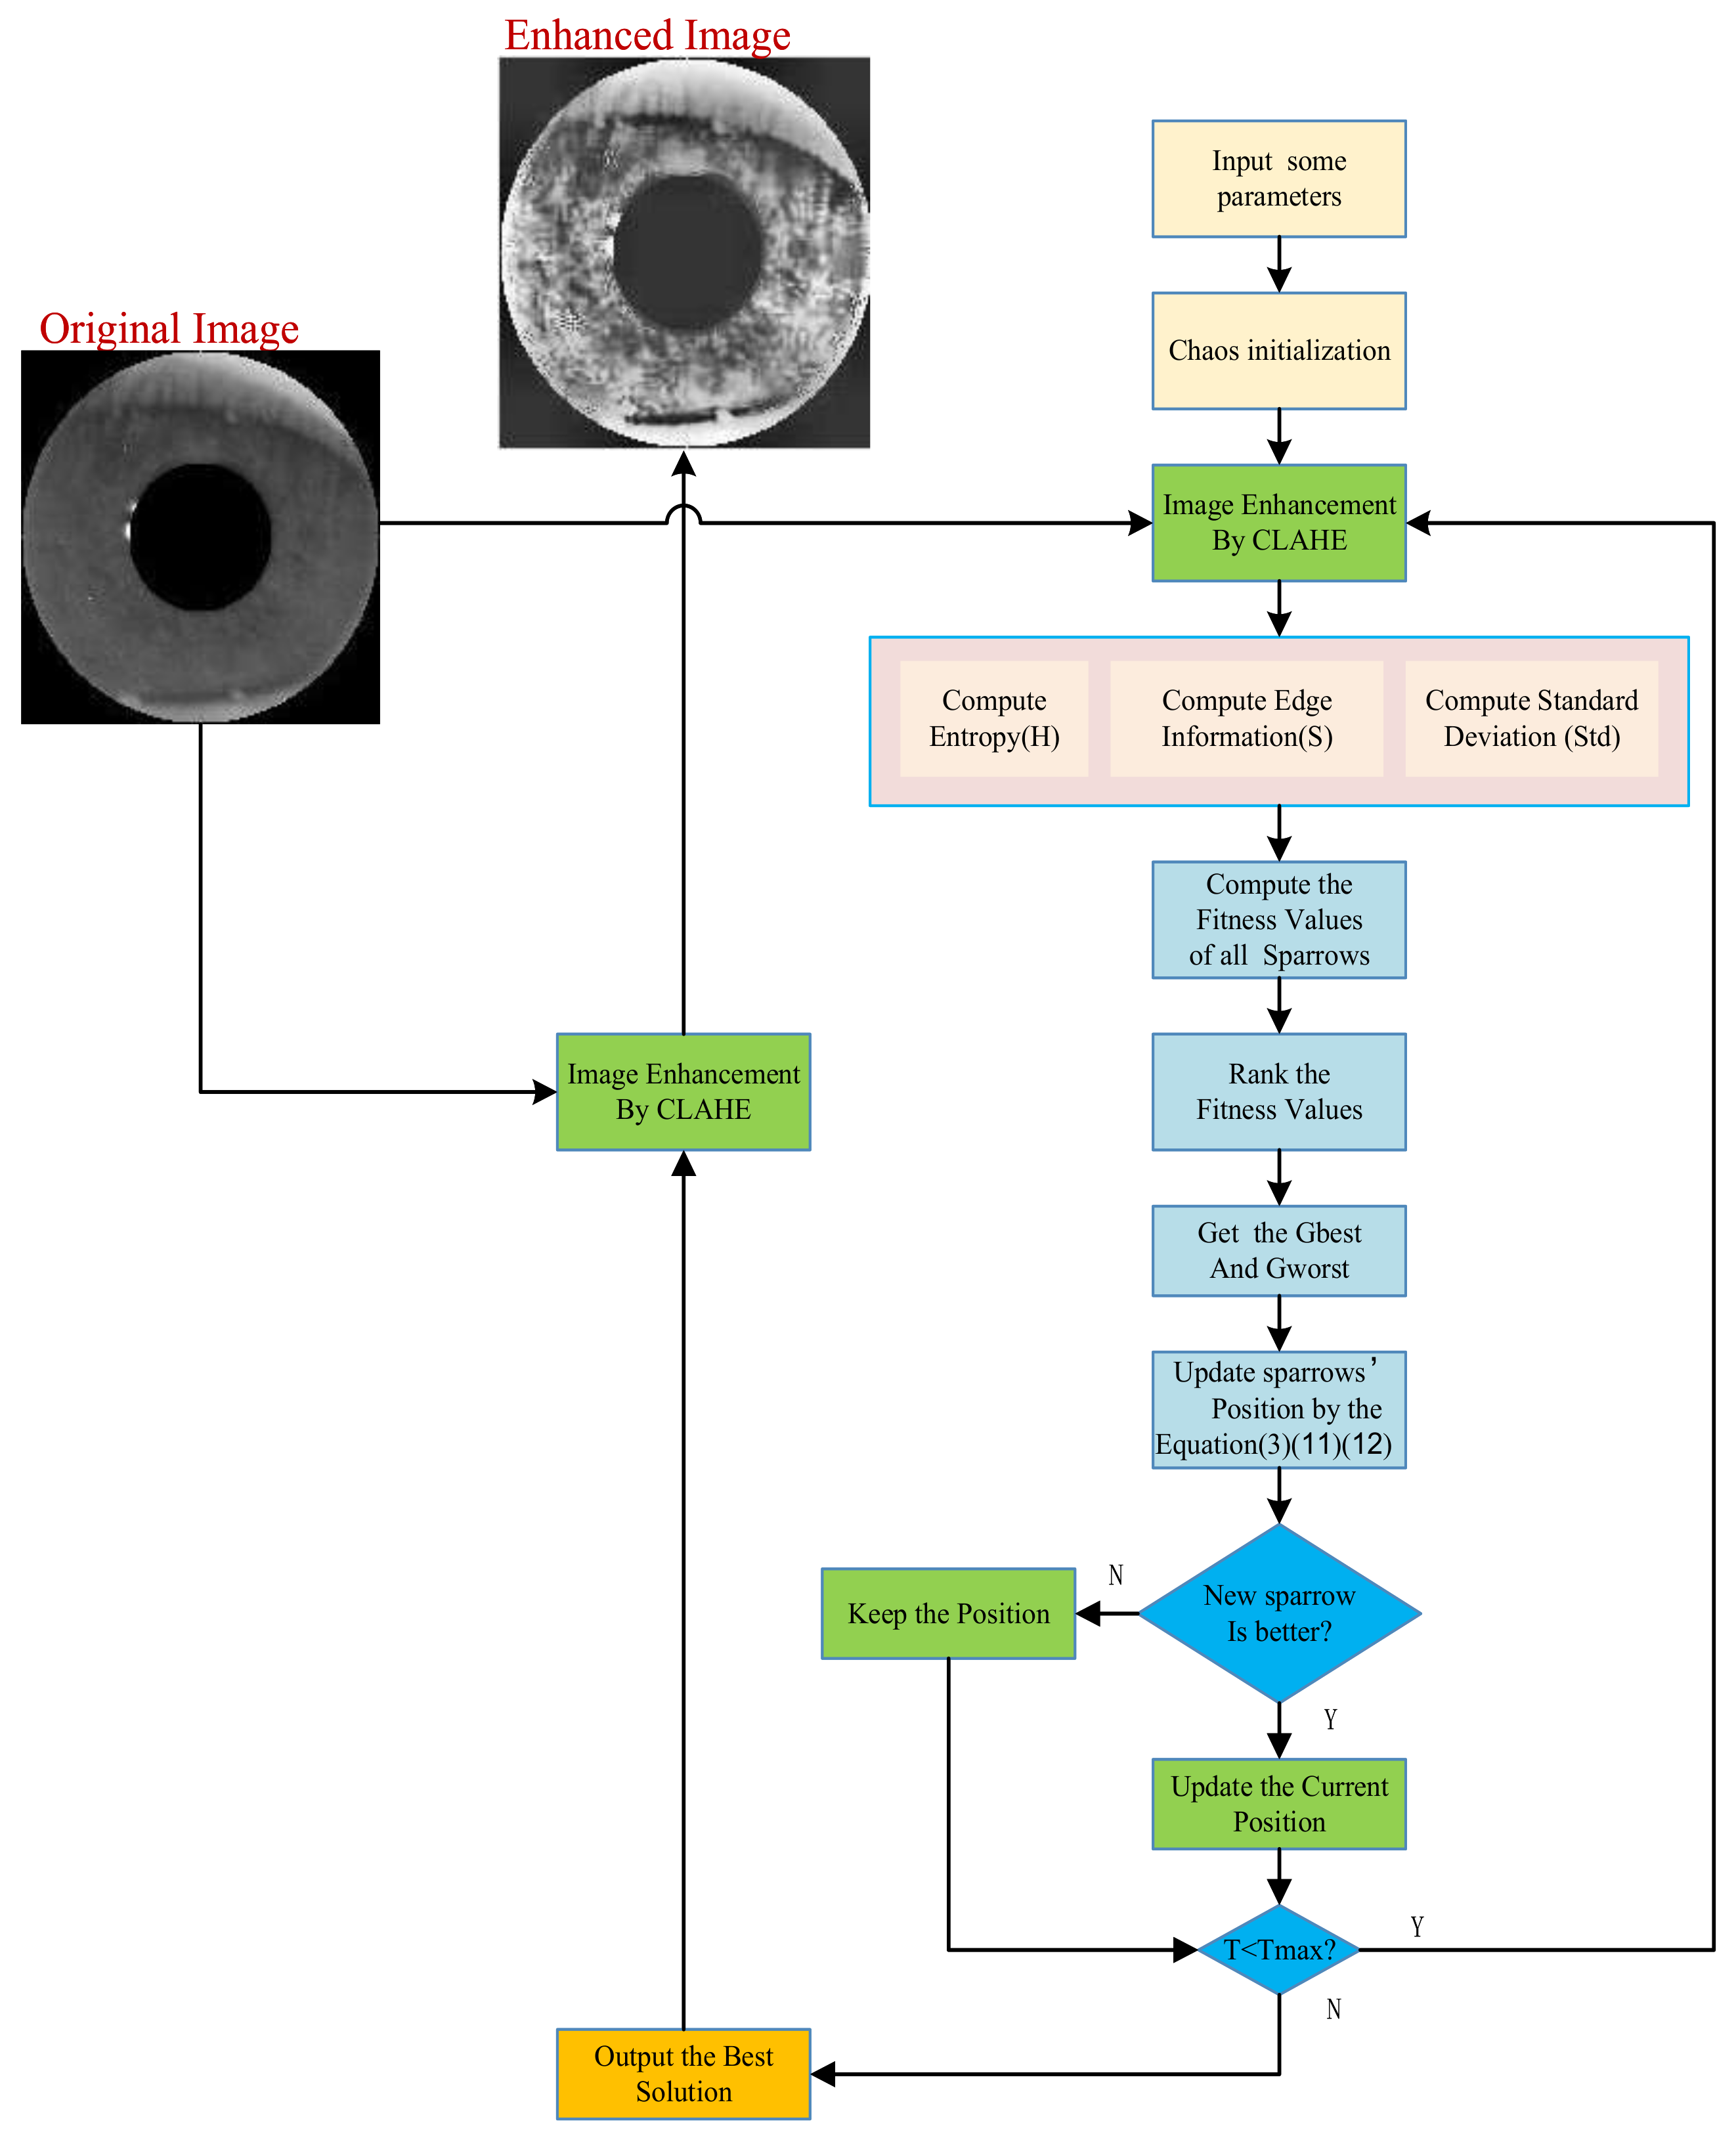
The contrast constrained adaptive histogram equalization (CLAHE) is an algorithm based on limited contrast enhancement range technology and local histogram equalization. Compared with the HE, CLAHE can restraint picture distortion and reduce the noise. CLAHE clips the pixels higher than a certain threshold L in the local histogram. As a result, the clipped parts are evenly distributed into the histogram to limit the amplitude of the histogram [34]. The first step of the local histogram equalization indicates that the image is divided into subimages. Then, histogram equalization is performed for each subimage. There are three ways to divide the image into subimages: non-overlapping, overlapping, and partial overlapping. Considering the computation speed and the difficulty of implementation, this paper selects the non-overlapping method. Because the non-overlapping subimages will produce a block effect in image reconstruction, bilinear interpolation technology can be used to solve the block effect problem in CLAHE. The flow chart of CLAHE is simply represented in Figure 2.
In this paper, we use the modified sparrow search algorithm to search for the best clip limit value. Then, we cut the histogram and limited the contrast to realize the detail enhancement of the iris image. The clipping limit values vary with the images, which can produce a better enhancement effect.

2.4. CPSSA-CLAHE

The main novelty of our algorithm is to use the CPSSA to adaptively select the optimal clipping limit value of the CLAHE algorithm so that we can improve and enhance the details of the iris image.

2.4.1. The Pseudocode

The pseudocode for enhancing long-distance iris images by using the CPSSA-CLAHE technique is presented in Algorithm 1.
The flowchart of the Algorithm 1 is shown in Figure 3.
Algorithm 1 CPSSA-CLAHE
Input: Biometric images, number of subimages, range of clip limit, the alarm value S T , the maximum iterations T m a x , the number of sparrows n, the number of finders F d , number of threatened sparrows S d
Output: A CPSSA-CLAHE enhanced biometric image
 1: Initializing population with fractional chaotic sequence
 2: while t < T m a x do
 3:        According to the location of each sparrow, that is, the clip limit, enhance the image using CLAHE
 4:        Compute Entropy(H), Edge Content(S), and Standard Deviation (Std) of the enhanced image
 5:        Get the fitness values of all sparrows.
 6:        Sort the fitness values.
 7:        Get the current best location (Gbest) and the current worst location (Gworst).
 8:        Update the location of sparrow by using Equations (3), (11) and (12)
 9:        Get the current new location;
 10:       If the new location is better than before, update it;
 11:        t = t + 1
 12: Get the best clip limit.
 13: Output the enhanced image using CLAHE

2.4.2. The Fitness Function

In Algorithm 1, the fitness function value of each sparrow is used to assess the enhancement effect of the image. Long-distance iris images have some features about obscure texture details and low contrast. Therefore, after enhancement by the CPSSA, the enhanced iris image should contain a large amount of information, clear texture, and high contrast. Therefore, we use a multi-objective maximization Equation (10) in the fitness function of CPSSA:
O b j = W 1 H + W 2 S + W 3 S t d ,
where W 1 , W 2 , and W 3 are constants representing the relative importance weightings of the objective function. Herein, to obtain a more balanced enhancement result, these three performance indexes have equal weights, that is, W 1 = W 2 = W 3 = 1 / 3 .
In Equation (13), H is the entropy value. The greater the entropy H of the image is, the greater the amount of information contained in the image will be. It is defined as
H = i = 0 255 p ( i ) log 2 [ p ( i ) ] ,
where p ( i ) represents the proportion of pixels with the gray value i.
S is edge content. It represents the amount of edge detail information. A Sobel operator is used to extract the edge pixels from the image [22]. The evaluation function of the amount of edge detail information can be expressed as
S = log log E I s × n e r × c ,
where I s represents the edge graph extracted by Sobel operator, E ( I s ) represents the sum of the intensities of all edge pixels, n e represents the total number of image edge pixels, and r × c represents the image size. S t d is the gray standard variance of the test image. Usually, the bigger Std value is, the better the contrast of the enhanced picture holds and the more suitable for people would be to examine.

3. Experiments and Discussion

In order to verify the performance of CPSSA, we have carried out the benchmark function comparison experiments, long-distance iris image enhancement experiments, and the respective comparison experiments. The benchmark function comparison experiment aims to verify the general performance improvement of CPSSA. The iris image enhancement experiment aims to test the feasibility of applying CPSSA to long-distance iris image enhancement. The comparative experiment aims to verify the superiority of the CPSSA compared with the traditional image enhancement schemes, such as histogram equalization (HE), AHE, CLAHE, etc. The experiments are run on a desktop PC with 3.20 GHz CPU and 16GB memory.The software used include Windows 10 and MATLAB 2021a.

3.1. Benchmark Function Comparison Experiment

In order to verify the performance of the CPSSA algorithm, we conducted the independent experiments 30 times based on 12 different types of benchmark test functions [36]. There are 4 high-dimensional unimodal functions F1–F4, 3 high-dimensional multimodal functions F5–F7, and 5 low-dimensional multimodal functions F8–F12. They are presented in Table 2, where ‘Type 1’ means unimodal benchmark functions, ‘Type 2’ means Multimodal benchmark functions, and ‘Type 3’ means fixed dimension multimodal functions.
The optimization ability of CPSSA can be fully investigated through a variety of category benchmark functions. In the experiment, we set the population size N = 30 , the maximum number of iterations T m a x = 500, the dimension D of the objective function, and the upper and lower bounds ub and lb are selected according to the benchmark functions in Table 2. The number of finders FD and threatened sparrows SD are taken as 20% of the population size. We run the independent experiments thirty times on each benchmark test function. The best and average value, standard deviation, and the computation time of each algorithm are recorded in Table 3. Under the identical benchmark test function, the best value denotes the exploration ability, the average value represents the convergence accuracy, and the standard variance represents the stability of the CPSSA [29].
As can be seen from Table 3, for unimodal benchmark functions, the optimal value and the average value of CPSSA are identical. They can accurately converge to the minimum value of the function. This shows that CPSSA has the highest convergence accuracy. In addition, the standard deviation of CPSSA is 0, indicating that CPSSA has the best stability. Although PSO is the fastest, its accuracy and stability are the worst. For multimodal benchmark function F5, only CPSSA converges to the minimum value of the function. For the other two multimodal functions, CPSSA is much better than the other three functions in terms of minimum or average value. It shows its good accuracy. In the meantime, its variance is also the smallest of the four functions. Therefore, it also shows the algorithm’s good stability. For fixed dimension multimodal benchmark functions, the best values obtained by the four functions are nearly identical to the average value. However, the CPSSA has the fastest speed. Except for the case using F9, its variance is the smallest of all four algorithms, showing the best stability.
In order to verify the dynamic convergence features of CPSSA, Figure 4 shows the convergence curves of 12 benchmark functions under four optimization algorithms.
It can be seen from Figure 4 that for high-dimensional functions F1–F7, CPSSA is much better than the other three algorithms in convergence speed and optimization accuracy. The search performance at the early stage of iterations and the exploration ability at the end of iterations are also better than the other three algorithms. This indicates that the CPSSA can fully achieve the search and exploration without losing population diversity and optimization stability. For low-dimensional functions F9–F12, all four algorithms can converge to the optimal value, but the CPSSA is the fastest. To sum up, the CPSSA significantly improves the optimization performance of the 12 benchmark functions. It has excellent stability and strong robustness, especially for F1–F4. Although the speed of the program is slower than SSA, it can effectively avoid the local optimums. This further demonstrates its high optimization accuracy, strong search ability, and obvious advantages. For fixed dimension multimodal benchmark functions, the running speed of CPSSA is significantly better than the other three algorithms, and the real-time performance is the best. It also verifies the feasibility and superiority of CPSSA.

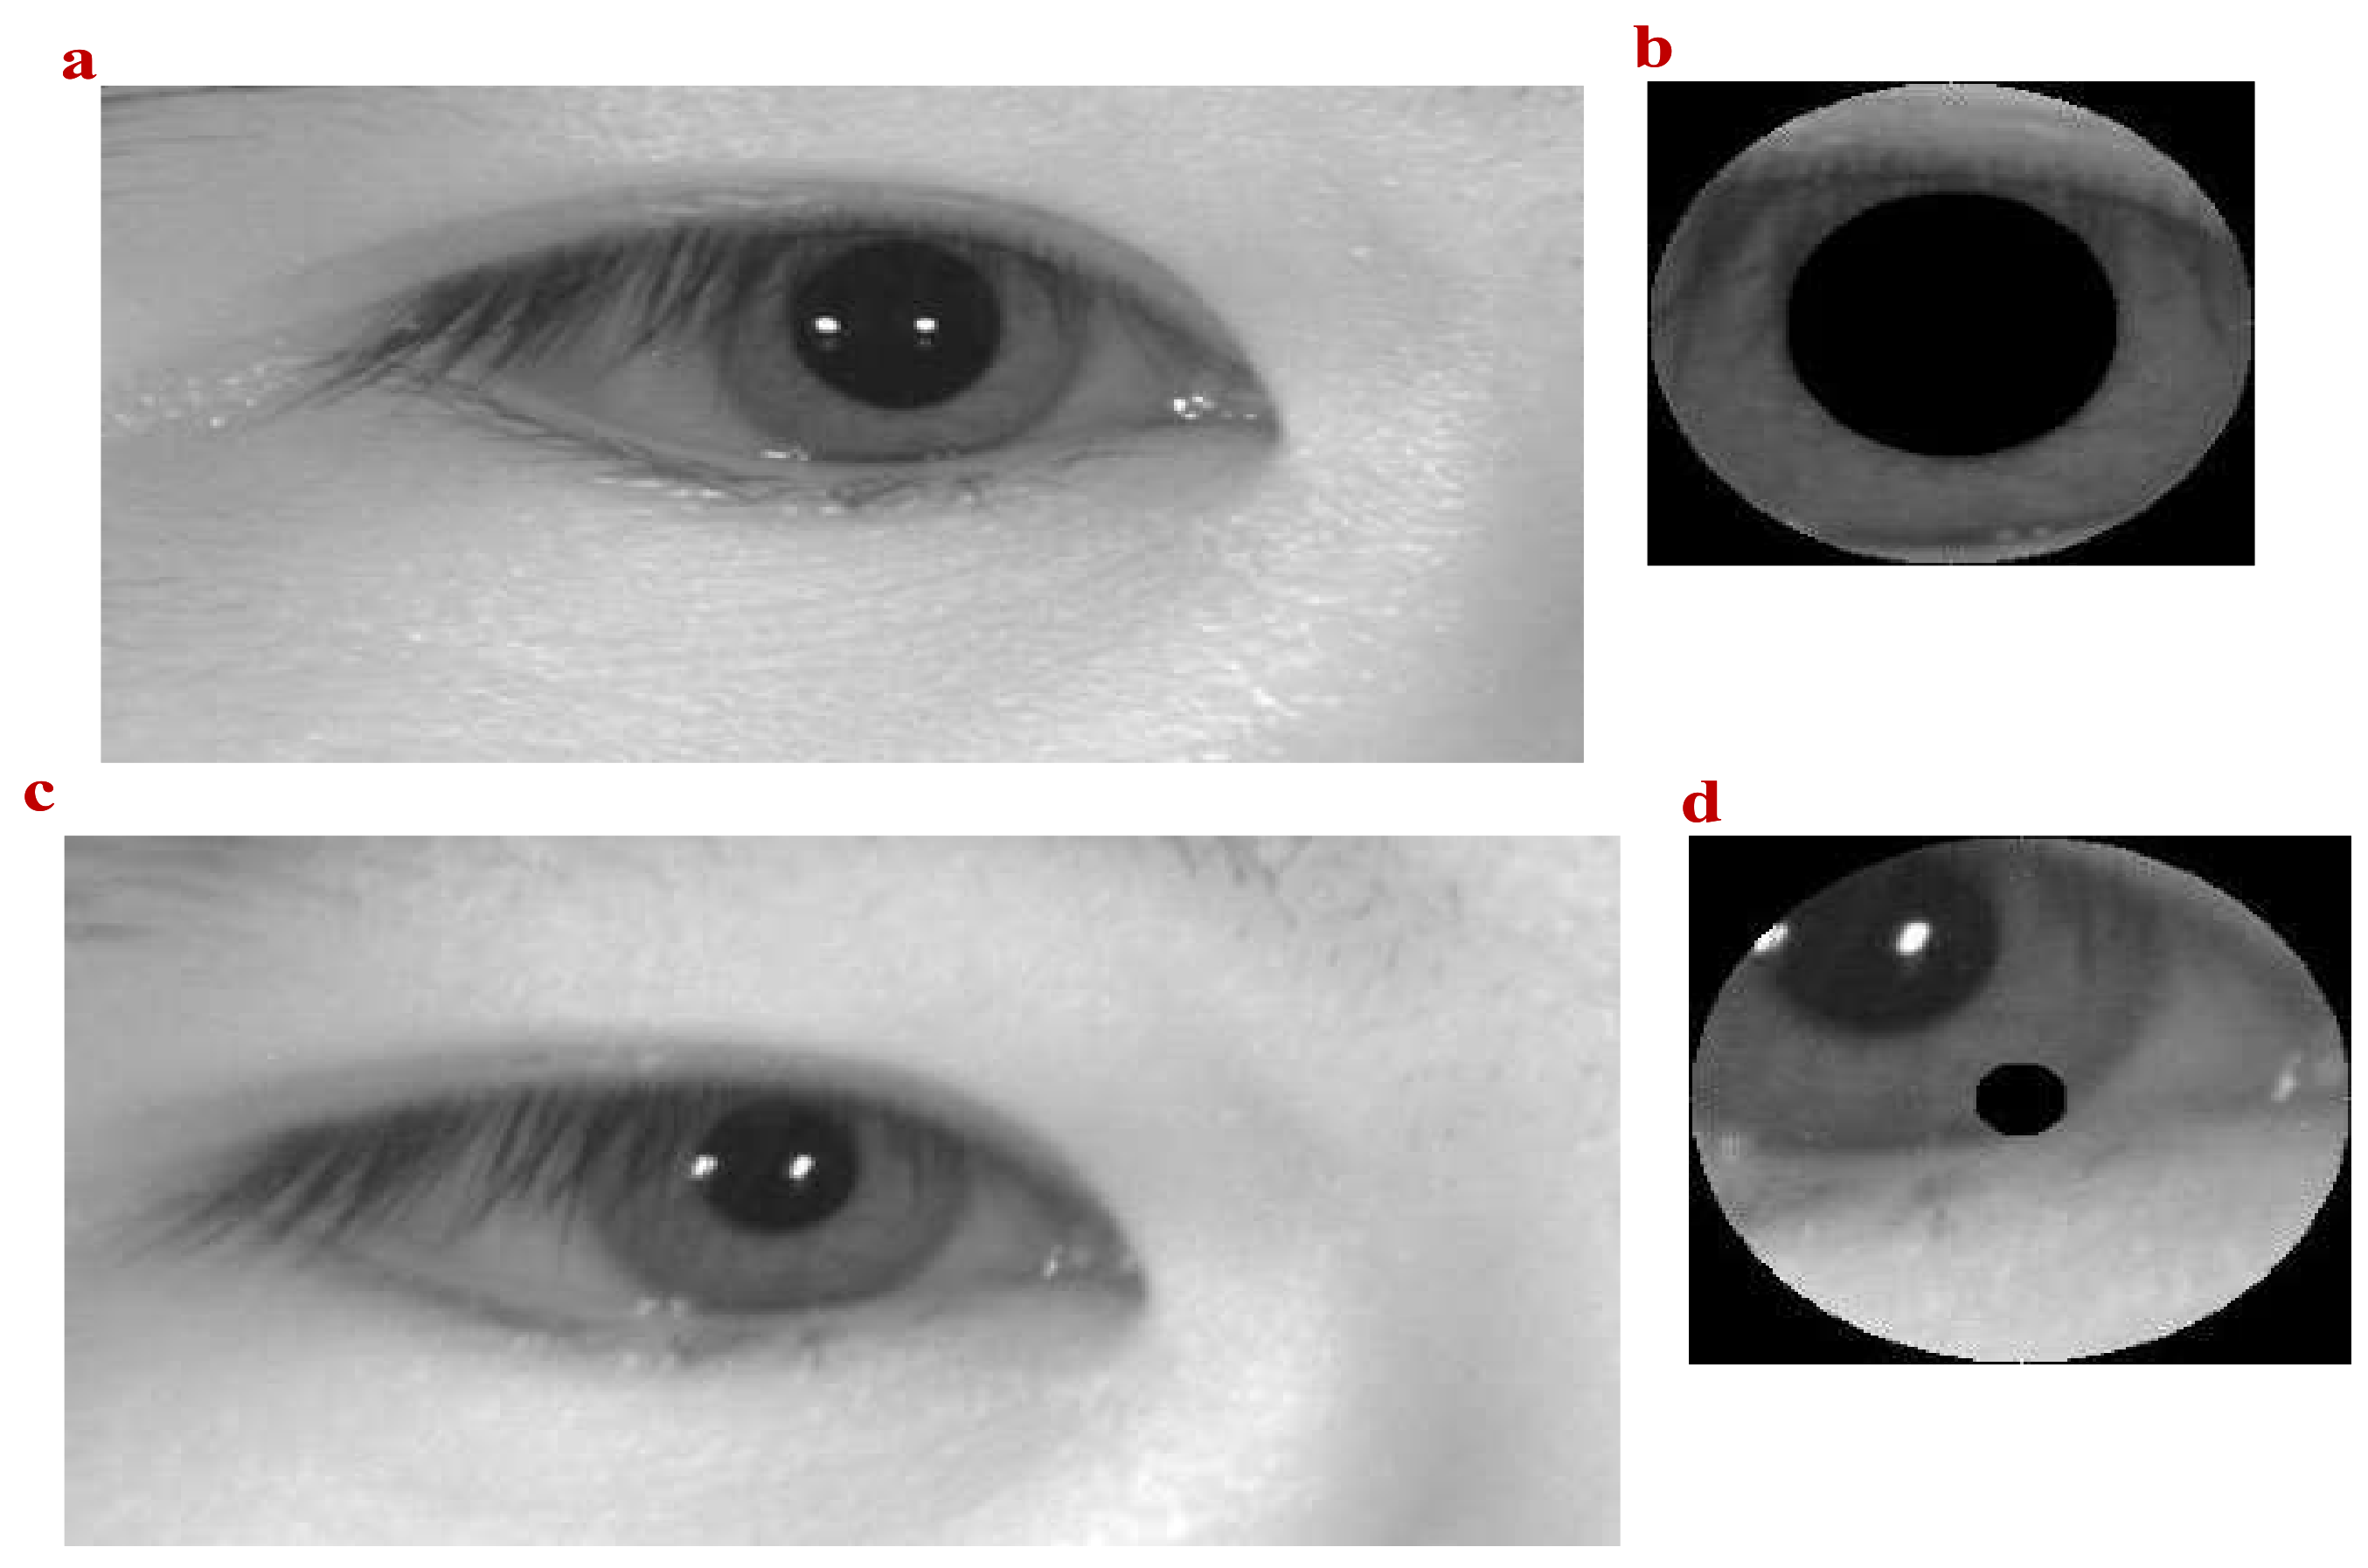
3.2. Long Distance Iris Image Enhancement

In this experiment, we select the iris distance dataset of the Chinese Academy of Sciences (CASIA-Iris-Distance) [31]. It used an advanced biometric sensor, which can actively search iris and facial patterns in the field of vision 3 meters away.
The dataset images were captured by a high resolution camera, so both dual-eye iris and face patterns are included in the image region of interest [31]. This dataset contains 142 subjects and a total number of 2567 images. Each image has 2352 × 1728 pixels. Figure 5 shows three example images from CASIA-Iris-Distance database.
For the above data sets, the process of iris image recognition is generally divided into four steps: locate and segment human eye region, iris location and segmentation, iris feature extraction, and feature matching [37]. The enhancement of iris image can be used before iris location because the blurred image may affect iris location, as shown in Figure 6.
Figure 6a,c shows eye regions segmented from different face photos of the same person. As shown from Figure 6, Figure 6a is clearer than Figure 6c. Because the eye region in Figure 6c is unclear, the iris region cannot be correctly segmented by the iris location algorithm, as shown in Figure 6d.
In order to solve this problem, we chose the CLAHE to enhance the image of the eye area in Figure 6c. The CPSSA algorithm is used to select the optimal clipping limit. The experimental parameters of the CPSSA are set as follows: population size N P = 30 , the maximum number of iterations M a x C y c l e = 30 , individual upper and lower bounds [0, 100], dimension dim is set to 1, and the number of sub images is 10 × 10 . The number of finders F D and number of threatened sparrows S D are taken as 20% of the population size. After the experiment, the enhanced pattern of the eye area is shown in Figure 7a. After iris positioning, the correct iris segmentation pattern is obtained, which is shown in Figure 7b. The fitness curves of CPSSA-CLAHE and SSA for image enhancement of blurred eye areas are shown in Figure 8. Obviously, the convergence speed of the CPSSA algorithm is better than that of the traditional SSA algorithm. The CPSSA can complete the convergence around the 7th iteration. The SSA needs 15th iterations to complete the convergence.
We can also enhance the segmented iris image. Figure 9 shows the gray image and its corresponding histogram after iris image enhancement by different methods.
From the results of comparative experiments, we can see that HE, AHE, CLAHE, and CPSSA-CLAHE can enhance iris images. However, the purpose of biometric image enhancement is to improve the recognition rate, so we need to check recognition rate of different image enhancement methods.
In order to verify whether the proposed method can improve the recognition rate, we selected 400 iris images with correct segmentation from the data set. These 400 pictures belong to 40 people, 10 for each person. The curvlet transform [38] is used to extract the iris features, and the kernel extreme learning machine (KELM) [39] is used as the classifier. The number of training sets is 5. A comparison between the CPSSA-CLAHE with the traditional methods is carried out, and the experimental results are shown in Figure 10.
According to Figure 10, we can see that the recognition rate is about 86% without image enhancement. HE, AHE, and CLAHE can improve the recognition rate, but the improvement rate is limited, whereas the image enhancement algorithm using CPSSA-CLAHE improves the recognition rate to nearly 98%.

4. Conclusions

In this paper, a modified sparrow search algorithm CPSSA is proposed and successfully applied to the problem of the low recognition rate of long-distance iris images. The algorithm uses fractional-order chaos to initialize the population and Pareto distribution to update the location of finders and scroungers to speed up its global convergence. This paper improves the traditional CLAHE, uses the CPSSA to find the optimal clipping value, and realizes the detail enhancement of the iris image. The clip limit value parameter changes according to different images, which can produce a better enhancement effect. Experimental results show that this method has obvious advantages over the traditional algorithms of HE, AHE, and CLAHE. It can not only improve the appearance of the image, but also effectively improve the recognition rate.
However, because of the hidden position of the iris, except for the image blur, there are many factors that affecting the location and recognition of the iris, for example, the reflection of glasses. These remain as challenges for the future research work.

Author Contributions

Conceptualization, S.H. and Q.X.; methodology, X.Z.; software, Q.X.; validation, Q.X. and S.H.; formal analysis, X.Z. and S.H.; investigation, Q.X.; resources, Q.X.; data curation, J.S.; writing—original draft preparation, Q.X.; writing—review and editing, Q.X. and S.H.; visualization, J.S.; supervision, X.Z. and S.H.; project administration, J.S.; funding acquisition, Q.X. All authors have read and agreed to the published version of the manuscript.

Funding

This research was funded by the National Natural Science Foundation of China (Grant Nos. 61673316, 62177042, 61901530), the Natural Science Foundation of Hunan Province (Nos. 2021JJ50137, 2020JJ5767), Guiding plan for scientific and technological innovation of Changde Bureau of science and technology(No. 2020ZD25),and the Project of Changde Social Science Achievement Appraisal Committee (No. CSP21YC93).

Institutional Review Board Statement

Ethical review and approval were waived for this study, due to all the subjects involved in the study are included in the publicly available datasets.

Informed Consent Statement

Informed consent was obtained from all subjects involved in the study.

Data Availability Statement

Publicly available datasets were analyzed in this study. This data can be found here: http://www.cbsr.ia.ac.cn/china/Iris%20Databases%20CH.asp, accessed on 1 October 2021.

Acknowledgments

The authors would like to thank the anonymous reviewers for their constructive comments and insightful suggestions.

Conflicts of Interest

The authors declare no conflict of interest.

References

  1. Chowhan, S.S.; Shinde, G. Iris biometrics recognition application in security management. In Proceedings of the 2008 IEEE Congress on Image and Signal Processing, Sanya, China, 27–30 May 2008; Volume 1, pp. 661–665. [Google Scholar]
  2. Lee, M.B.; Kim, Y.H.; Park, K.R. Conditional generative adversarial network-based data augmentation for enhancement of iris recognition accuracy. IEEE Access 2019, 7, 122134–122152. [Google Scholar] [CrossRef]
  3. Raffei, A.F.M.; Asmuni, H.; Hassan, R.; Othman, R.M. A low lighting or contrast ratio visible iris recognition using iso-contrast limited adaptive histogram equalization. Knowl. Based Syst. 2015, 74, 40–48. [Google Scholar] [CrossRef]
  4. Roy, K.; Bhattacharya, P.; Suen, C.Y. Iris segmentation using variational level set method. Opt. Lasers Eng. 2011, 49, 578–588. [Google Scholar] [CrossRef]
  5. Nguyen, K.; Fookes, C.; Sridharan, S.; Tistarelli, M.; Nixon, M. Super-resolution for biometrics: A comprehensive survey. Pattern Recognit. 2018, 78, 23–42. [Google Scholar] [CrossRef] [Green Version]
  6. Veluchamy, M.; Subramani, B. Image contrast and color enhancement using adaptive gamma correction and histogram equalization. Optik 2019, 183, 329–337. [Google Scholar] [CrossRef]
  7. Nguyen, K.; Fookes, C.; Jillela, R.; Sridharan, S.; Ross, A. Long range iris recognition: A survey. Pattern Recognit. 2017, 72, 123–143. [Google Scholar] [CrossRef]
  8. Santos, G.; Hoyle, E. A fusion approach to unconstrained iris recognition. Pattern Recognit. Lett. 2012, 33, 984–990. [Google Scholar] [CrossRef]
  9. Woodard, D.L.; Pundlik, S.J.; Miller, P.E.; Lyle, J.R. Appearance-based periocular features in the context of face and non-ideal iris recognition. Signal Image Video Process. 2011, 5, 443. [Google Scholar] [CrossRef]
  10. Srivastava, G.; Rawat, T.K. Histogram equalization: A comparative analysis & a segmented approach to process digital images. In Proceedings of the 2013 IEEE Sixth International Conference on Contemporary Computing (IC3), Noida, India, 8–10 August 2013; pp. 81–85. [Google Scholar]
  11. Pizer, S.M.; Amburn, E.P.; Austin, J.D.; Cromartie, R.; Geselowitz, A.; Greer, T.; ter Haar Romeny, B.; Zimmerman, J.B.; Zuiderveld, K. Adaptive histogram equalization and its variations. Comput. Vision Graph. Image Process. 1987, 39, 355–368. [Google Scholar] [CrossRef]
  12. Magudeeswaran, V.; Singh, J.F. Contrast limited fuzzy adaptive histogram equalization for enhancement of brain images. Int. J. Imaging Syst. Technol. 2017, 27, 98–103. [Google Scholar] [CrossRef] [Green Version]
  13. Vidya, B.S.; Chandra, E. Triangular fuzzy membership-contrast limited adaptive histogram equalization (TFM-CLAHE) for enhancement of multimodal biometric images. Wirel. Pers. Commun. 2019, 106, 651–680. [Google Scholar] [CrossRef]
  14. Kanmani, M.; Narasimhan, V. Swarm intelligent based contrast enhancement algorithm with improved visual perception for color images. Multimed. Tools Appl. 2018, 77, 12701–12724. [Google Scholar] [CrossRef]
  15. Zeng, X.; Chen, S. Research on Ultrasonic Image Recognition Based on Optimization Immune Algorithm. Comput. Math. Methods Med. 2021, 2021, 5868949. [Google Scholar] [CrossRef]
  16. Maurya, L.; Lohchab, V.; Mahapatra, P.K.; Abonyi, J. Contrast and brightness balance in image enhancement using Cuckoo Search-optimized image fusion. J. King Saud-Univ.-Comput. Inf. Sci. 2021. [Google Scholar] [CrossRef]
  17. Nickfarjam, A.M.; Ebrahimpour-Komleh, H. Multi-resolution gray-level image enhancement using particle swarm optimization. Appl. Intell. 2017, 47, 1132–1143. [Google Scholar] [CrossRef]
  18. Sathiyabhama, B.; Kumar, S.U.; Jayanthi, J.; Sathiya, T.; Ilavarasi, A.; Yuvarajan, V.; Gopikrishna, K. A novel feature selection framework based on grey wolf optimizer for mammogram image analysis. Neural Comput. Appl. 2021, 33, 14583–14602. [Google Scholar] [CrossRef]
  19. Qin, C.; Gu, X. Improved PSO algorithm based on exponential center symmetric inertia weight function and its application in infrared image enhancement. Symmetry 2020, 12, 248. [Google Scholar] [CrossRef] [Green Version]
  20. Acharya, U.K.; Kumar, S. Genetic algorithm based adaptive histogram equalization (GAAHE) technique for medical image enhancement. Optik 2021, 230, 166273. [Google Scholar] [CrossRef]
  21. Muniyappan, S.; Rajendran, P. Contrast enhancement of medical images through adaptive genetic algorithm (AGA) over genetic algorithm (GA) and particle swarm optimization (PSO). Multimed. Tools Appl. 2019, 78, 6487–6511. [Google Scholar] [CrossRef]
  22. Bhandari, A.K.; Maurya, S. Cuckoo search algorithm-based brightness preserving histogram scheme for low-contrast image enhancement. Soft Comput. 2020, 24, 1619–1645. [Google Scholar] [CrossRef]
  23. Kamoona, A.M.; Patra, J.C. A novel enhanced cuckoo search algorithm for contrast enhancement of gray scale images. Appl. Soft Comput. 2019, 85, 105749. [Google Scholar] [CrossRef]
  24. Prasath, R.; Kumanan, T. Distance-Oriented Cuckoo Search enabled optimal histogram for underwater image enhancement: A novel quality metric analysis. Imaging Sci. J. 2019, 67, 76–89. [Google Scholar] [CrossRef]
  25. Sridevi, G.; Kumar, S.S. Image enhancement based on fractional calculus and genetic algorithm. In Proceedings of the International Conference on Computational Intelligence and Data Engineering, Odisha, India, 20–21 December 2014; Springer: Berlin, Germany, 2019; Volume 3, pp. 197–206. [Google Scholar]
  26. Chen, J.; Yu, W.; Tian, J.; Chen, L.; Zhou, Z. Image contrast enhancement using an artificial bee colony algorithm. Swarm Evol. Comput. 2018, 38, 287–294. [Google Scholar] [CrossRef]
  27. Banharnsakun, A. Artificial bee colony algorithm for enhancing image edge detection. Evol. Syst. 2019, 10, 679–687. [Google Scholar] [CrossRef]
  28. Xue, J.; Shen, B. A novel swarm intelligence optimization approach: Sparrow search algorithm. Syst. Sci. Control Eng. 2020, 8, 22–34. [Google Scholar] [CrossRef]
  29. Liu, G.; Shu, C.; Liang, Z.; Peng, B.; Cheng, L. A modified sparrow search algorithm with application in 3d route planning for UAV. Sensors 2021, 21, 1224. [Google Scholar]
  30. Zhou, S.; Xie, H.; Zhang, C.; Hua, Y.; Zhang, W.; Chen, Q.; Gu, G.; Sui, X. Wavefront-shaping focusing based on a modified sparrow search algorithm. Optik 2021, 244, 167516. [Google Scholar] [CrossRef]
  31. Xiong, Q.; Zhang, X.; Xu, X.; He, S. A modified chaotic binary particle swarm optimization scheme and its application in face-iris multimodal biometric identification. Electronics 2021, 10, 217. [Google Scholar] [CrossRef]
  32. He, S.; Sun, K.; Wu, X. Fractional symbolic network entropy analysis for the fractional-order chaotic systems. Phys. Scr. 2020, 95, 035220. [Google Scholar] [CrossRef]
  33. Atici, F.M.; Eloe, P.W. A transform method in discrete fractional calculus. Int. J. Differ. Equ. 2007, 2, 165–176. [Google Scholar]
  34. Wei, J.; Chen, Y.; Yu, Y.; Chen, Y. Optimal randomness in swarm-based search. Mathematics 2019, 7, 828. [Google Scholar] [CrossRef] [Green Version]
  35. Chang, Y.; Jung, C.; Ke, P.; Song, H.; Hwang, J. Automatic contrast-limited adaptive histogram equalization with dual gamma correction. IEEE Access 2018, 6, 11782–11792. [Google Scholar] [CrossRef]
  36. Mirjalili, S.; Mirjalili, S.M.; Lewis, A. Grey wolf optimizer. Adv. Eng. Softw. 2014, 69, 46–61. [Google Scholar] [CrossRef] [Green Version]
  37. Zhang, X.; Xiong, Q.; Xu, X. Iris Identification App Based on Andriod System. In Proceedings of the 2018 IEEE Chinese Automation Congress (CAC), Xi’an, China, 30 November–2 December 2018; pp. 2229–2234. [Google Scholar]
  38. Guesmi, H.; Trichili, H.; Alimi, A.M.; Solaiman, B. Iris verification system based on curvelet transform. In Proceedings of the 2012 IEEE 11th International Conference on Cognitive Informatics and Cognitive Computing, Kyoto, Japan, 22–24 August 2012; pp. 226–229. [Google Scholar]
  39. Huang, G.B. An insight into extreme learning machines: Random neurons, random features and kernels. Cogn. Comput. 2014, 6, 376–390. [Google Scholar] [CrossRef]
Figure 1. Phase diagrams of the fractional 2D-SIMM with different derivative orders. (a) q = 0.98 . (b) q = 0.95 . (c) q = 0.9 .
Mathematics 09 02790 g001
Figure 2. Flow chart of CLAHE.
Mathematics 09 02790 g002
Figure 3. The flowchart of CPSSA-CLAHE.
Mathematics 09 02790 g003
Figure 4. Convergence curves of four algorithms on twelve test functions. (a) F1; (b) F2; (c) F3; (d) F4; (e) F5; (f) F6; (g) F7; (h) F8; (i) F9; (j) F10; (k) F11; (l) F12.
Mathematics 09 02790 g004
Figure 5. Example images from CASIA-Iris-Distance database.
Mathematics 09 02790 g005
Figure 6. Influence of blurred eye image on iris segmentation (a) Clear eye area with 701 × 401 ; (b) Correct iris segmentation; (c) Blurred eye area; (d) Wrong iris segmentation.
Mathematics 09 02790 g006
Figure 7. Eye area enhanced with CPSSA-CLAHE. (a) Eye region after image enhancement. (b) Correct iris segmentation.
Mathematics 09 02790 g007
Figure 8. The best results of CPSSA and SSA.
Mathematics 09 02790 g008
Figure 9. Comparison of iris image and histograms. (a) Original iris image; (b) iris enhanced by HE; (c) iris enhanced by AHE; (d) iris enhanced by CLAHE; (e) iris enhanced by proposed CPSSA-CLAHE.
Mathematics 09 02790 g009
Figure 10. Recognition rate of different image enhancement methods.
Mathematics 09 02790 g010
Table 1. Swarm intelligence optimization algorithms for image enhancement.
AuthorsAlgorithmsStrategy
Maurya et al. [16]Cuckoo search (CS) algorithmCSA is used to balance the contrast and brightness
Nickfarjam et al. [17]Modified PSO algorithmConsists of the standard deviation and edge content
Sathiyabhama, B et al. [18]Gray wolf optimizer algorithmImprove with rough set theory
Qin et al. X [19]Modified PSO algorithmA modified inertia weight function used in the PSO
Acharya et al. [20]Modified genetic (GA) algorithmAdaptive histogram equalization technique used in the GA
Muniyappan et al. [21]Adaptive genetic algorithmIntroduce adaptive crossover and mutation operations in GA
Bhandari et al. [22]CS algorithmImprove the contrast of low-contrast image using CSA
Kamoona et al. [23]Modified CS algorithmImage transform enhancement functions and objective function
Prasath et al. [24]Modified CS algorithmDistance-Oriented Cuckoo Search (DOCS) algorithm
Sridevi et al. [25]Modified genetic algorithmFractional Genetic Algorithm
Chen et al. [26]Artificial bee colony algorithmA new fitness function and new image transformation function
Banharnsakun et al. [27]Artificial bee colony algorithmImage edge detection enhancement using ABC algorithm
Table 2. Benchmark test functions.
TypeBenchmark FunctionsDimRange F min
Type 1 F 1 ( x ) = i = 1 n x i 2 30[−100, 100]0
Type 1 F 2 ( x ) = i = 1 n x i + i = 1 n x i 30[−10, 10]0
Type 1 F 3 ( x ) = i = 1 n j 1 i x j 2 30[−100, 100]0
Type 1 F 4 ( x ) = i = 1 n x i + 0.5 2 30[−100, 100]0
Type 2 F 5 ( x ) = i = 1 n x i sin x i 30[−500, 500] 418.9829 × n
Type 2 F 6 ( x ) = π n 10 sin π y 1 + y n 1 2 + i = 1 n 1 y i 1 2 1 + 10 sin 2 π y i + 1 + i = 1 n u x i , 10 , 100 , 4 y i = 1 + x i + 1 4 u x i , a , k , m = k x i a m x i > a 0 a < x i < a k x i a m x i < a 30[−50, 50]0
Type 2 F 7 ( x ) = 0.1 sin 2 3 π x 1 + x n 1 2 1 + sin 2 2 π x n + i = 1 n x i 1 2 1 + sin 2 3 π x i + 1 + i = 1 n u x i , 5 , 100 , 4 30[−50, 50]0
Type 3 F 8 ( x ) = 1 500 + j = 1 25 1 j + i = 1 2 x i a i j 6 1 2[−65, 65]1
Type 3 F 9 ( x ) = 4 x 1 2 2.1 x 1 4 + 1 3 x 1 6 + x 1 x 2 4 x 2 2 + 4 x 2 4 2[−5, 5]−1.0316
Type 3 F 10 ( x ) = i = 1 5 X a i X a i T + c i 1 4[0, 10]−10.1532
Type 3 F 11 ( x ) = i = 1 7 X a i X a i T + c i 1 4[0, 10]−10.4028
Type 3 F 12 ( x ) = i = 1 10 X a i X a i T + c i 1 4[0, 10]−10.5363
Table 3. Experiment results of test functions.
FSIBestAveStdComputation Time (s)
F1PSO7.134288 ×   10 1 1.959255 ×   10 2 60.00221.157395
F1ABC4.5744268.2745772.396615.104270
F1SSA01.874825 ×   10 140 1.02688 ×   10 139 4.107282
F1CPSSA00012.062264
F2PSO8.1601503.057447 ×   10 1 20.09951.23973
F2ABC2.4837483.248522 ×   10 1 23.352215.511821
F2SSA9.537863 ×   10 299 7.955561 ×   10 68 4.34102 ×   10 67 4.154662
F2CPSSA00011.906737
F3PSO2.908686 ×   10 3 8.612808 ×   10 3 5414.96.260316
F3ABC3.853256 ×   10 4 6.251440 ×   10 4 10,947.126.059873
F3SSA1.063104 ×   10 8 4.102431 ×   10 78 2.24699 ×   10 77 11.141056
F3CPSSA00017.316412
F4PSO5.852877 ×   10 1 1.591048 ×   10 2 75.6271.182
F4ABC3.4485491.015906 ×   10 1 4.0023615.4631
F4SSA2.680141 ×   10 15 5.880191 ×   10 11 2.10753 ×   10 10 4.12826
F4CPSSA00011.9581
F5PSO−9.476918 ×   10 3 −7.601357 ×   10 3 1069.61.9245
F5ABC−1.453578 ×   10 63 −8.408056 ×   10 61 2.94628 ×   10 62 21.44868
F5SSA−9.937985 ×   10 3 −8.648037 ×   10 3 656.4085.2218
F5CPSSA−1.256949 ×   10 4 −1.252106 ×   10 4 159.0512.4857
F6PSO1.1014314.6806292.562278.91828
F6ABC1.108390 ×   10 4 4.299645 ×   10 5 42389232.38175
F6SSA6.197603 ×   10 18 2.995160 ×   10 12 9.32387 ×   10 12 15.1853
F6CPSSA1.570545 ×   10 32 1.570545 ×   10 32 5.5674 ×   10 48 19.40687
F7PSO4.33355415.261709.077869.031767
F7ABC1.039235 ×   10 5 1.084383 ×   10 6 1.07069 ×   10 6 32.5297
F7SSA6.609665 ×   10 15 1.112171 ×   10 11 1.86574 ×   10 11 15.10169
F7CPSSA1.349784 ×   10 32 1.349784 ×   10 32 5.5674 ×   10 48 19.5371
F8PSO9.980038 ×   10 1 9.980038 ×   10 1 2.4774 ×   10 10 14.990997
F8ABC9.980038 ×   10 1 9.980069 ×   10 1 5.79252 ×   10 6 47.77464
F8SSA9.980038 ×   10 1 4.1844854.8368223.997373
F8CPSSA9.980038 ×   10 1 1.3870872.131115.59964
F9PSO−1.031628−1.0316083.10204 ×   10 5 1.094425
F9ABC−1.031628−1.0316283.47478 ×   10 10 15.420527
F9SSA−1.031628−1.0316286.25324 ×   10 16 3.8147
F9CPSSA−1.031628−1.0316286.14542 ×   10 12 1.82324
F10PSO−10.1532−9.3991452.060471.598298
F10ABC−10.1532−10.15321.20822 ×   10 9 16.5355
F10SSA−10.1532−9.3035331.932394.5498
F10CPSSA−10.1532−10.152284.10674 ×   10 15 2.72803
F11PSO−10.40248−10.209670.9677611.85183
F11ABC−10.40294−10.402946.41315 ×   10 13 17.505625
F11SSA−10.40294−10.048591.348534.859621
F11CPSSA−10.40282−10.402827.49301 ×   10 15 3.028603
F12PSO−10.53628−10.513720.03709122.2475
F12ABC−10.53641−10.536411.75039 ×   10 12 18.31669
F12SSA−10.53641−10.175881.372045.470448
F12CPSSA−10.53629−10.536295.21556 ×   10 15 3.381584
Publisher’s Note: MDPI stays neutral with regard to jurisdictional claims in published maps and institutional affiliations.

