Article

Integrating Cluster Analysis into Multi-Criteria Decision Making for Maintenance Management of Aging Culverts

Section of Infrastructure Management, Federal Waterways Engineering and Research Institute, 76152 Karlsruhe, Germany
*
Author to whom correspondence should be addressed.
Mathematics 2021, 9(20), 2549; https://doi.org/10.3390/math9202549
Submission received: 28 June 2021 / Revised: 16 August 2021 / Accepted: 20 August 2021 / Published: 12 October 2021
(This article belongs to the Special Issue Multi-Criteria Decision Making and Data Mining)

Abstract

:
Negligence in relation to aging infrastructure systems could have unintended consequences and is therefore associated with a risk. The assessment of the risk of neglecting maintenance provides valuable information for decision making in maintenance management. However, infrastructure systems are interdependent and interconnected systems of systems characterized by hierarchical levels and a multiplicity of failure scenarios. Assessment methodologies are needed that can capture the multidimensional aspect of risk and simplify the risk assessment, while also improving the understanding and interpretation of the results. This paper proposes to integrate the multi-criteria decision analysis with data mining techniques to perform the risk assessment of aging infrastructures. The analysis is characterized by two phases. First, an intra failure scenario risk assessment is performed. Then, the results are aggregated to carry out an inter failure scenario risk assessment. A cluster analysis based on the k-medoids algorithm is applied to reduce the number of alternatives and identify those which dominate the decision problem. The proposed approach is applied to a system of aging culverts of the German waterways network. Results show that the procedure allows to simplify the analysis and improve communication with infrastructure stakeholders.

1. Introduction

1.1. Challenges in Infrastructure Management

Infrastructure management is a complex discipline which plays an essential role in the functioning and the well-being of modern societies. Among the activities that infrastructure management involves, maintenance management is becoming increasingly prevalent. In spite of the acknowledged fact that age affects the performance of civil infrastructures and their robustness against environmental and natural threats [1], investments in maintenance are still insufficient [2]. As a result, the maintenance backlog [3], which represents the number of unfulfilled maintenance demands concerning predefined security standards, is growing.
The German waterways system also has to deal with a backlog accumulation of maintenance actions. The asset of waterways infrastructures, managed by the Federal Waterways and Shipping Administration of Germany (Wasserstraßen- und Schifffahrtsverwaltung des Bundes (WSV)) with the support of the Federal Waterways Engineering and Research Institute (Bundesanstalt für Wasserbau (BAW)), includes different types of infrastructures, such as locks, weirs, culverts, canal bridges, and lighthouses, for an estimated asset value of forty billion Euros. Inspections have pointed out that many infrastructures are or will soon be in bad condition. However, urgent maintenance interventions are systematically disregarded due to logistic and economic constraints. There are currently concerns about the culvert system, as it has often been neglected and the failure of one culvert could lead to flooding.
As in the case of extreme natural events or terrorism, disregarded maintenance might lead to the occurrence of unwanted consequences, and it is thus linked to a risk [4]. Risk-based maintenance strategies have been developed to identify those system elements linked to higher probabilities of failure and the magnitude of failure consequences [5]. However, the evaluation of risk is not trivial for infrastructure systems.
The status of risk as a mental construction, and the fact that the concept of risk spans different disciplines, from medicine to economics and engineering, has major implications that should be considered before starting any risk assessment. One such implication is the fact that, although the concept of risk has been the object of several studies and investigation, there is still not a single agreement about the definition of risk, as it clearly emerges from [6,7], where ten definitions of risk and five different examples of metrics are proposed, respectively. Nonetheless, most of those definitions and interpretations stem from the one given by [8], who stated clearly that risk is a measure of the probability and severity of adverse effects. This definition also represents the basis of the one provided by [9] and largely used nowadays, according to which risk can be quantified through a set of triplets: scenario, probability of failure, and consequence. This definition is as simple as it is ambiguous, since it can be interpreted in two different ways, which are both valid but imply different types of analysis [10]: (1) in terms of the probability of occurrence of adverse effects; (2) in terms of the probability of the severity of adverse effects, given their occurrence. Regardless of the definition, risk assessment represents a true challenge in the case of complex systems. The real world is in effect constituted by interdependent and interconnected (I-I) complex systems of systems (SoS) [11]. Each SoS is composed of many subsystems, each of which is characterized by a hierarchy of shared or interacting components having multiple states, functions, operations, databases, costs, and stakeholders. All SoS are subject to multiple adverse initiating events that could originate outside or inside the SoS. In contrast to a single system, no single model can capture the essence of SoS. Furthermore, the I-I subsystems share most of the previously mentioned building blocks and especially their states. In addition to these challenges, it should be considered that a clear separation between the probability and consequences of failure is difficult to achieve in practice. This is due to the fact that, despite the attempt to describe the world through simple, linear models, the causal chain describing failure scenarios is often non-linear, with chain links playing both the role of causes and effects at the same time and activating reinforcement loops.
As the assessment of the risk of neglecting maintenance supports decision making in infrastructure management and the planning of maintenance actions, strategies are needed that tackle these challenges and clarify the ambiguities inherent in the risk analysis of infrastructure systems.

1.2. The Multi-Criteria Decision Analysis for the Maintenance Management of Physical Infrastructures

Maintenance activities involve different types of decision problems which span from single choice to portfolio problematics and are often deeply combined and connected to each other. These decision problems are characterized by different decision criteria and involve short and long-term consequences, about which a certain degree of information is available. Considering that human beings can simultaneously process a limited amount of information, methods are needed which support decision making in maintenance management, which also capture the multidimensional nature of risk and increase the rationality of the decision process. A tool which can provide valuable help in many phases of the decision process concerning maintenance activities is the multi-criteria decision analysis (MCDA).
The MCDA represents a collection of formal approaches which seek to take explicit account of multiple criteria in helping individuals or groups explore decisions that matter. The MCDA provides an aid to decision making by pursuing the following objectives: (1) to integrate objective measurement with value judgment; (2) to make explicit and to manage the subjectivity inherent in decision making, especially in the choice of the criteria and their relative importance; (3) to illuminate controversy and overcome difficult trade-offs, e.g., by promoting the generation of new alternatives; (4) to increase decision makers’ learning and understanding of the decision problem and thus to promote the exploration of new capabilities; (5) to provide a structure for the decision problem which serves as a focus and a language for discussion.
The MCDA has been already applied to the maintenance of infrastructure systems [12,13]. MCDA methods differ in many aspects, such as the input information, the modelling effort required, as well as the outcome and its granularity. Depending on the outcome, they can be more suited for making choices, sorting and classification, ranking, elimination, design, or the description of problems. In general, all the MCDA approaches incorporate subjective information in the form of preferences. However, they follow different models, which can be grouped into three main categories: the value measurement models; the goal, aspiration or reference level models; the outranking models [14]. In the context of maintenance management, the following applications have been recently developed: value measurement models are implemented in the maintenance management of railways, bridges, and roads [13,15,16,17]; goal, aspiration, or reference level models such as multi-objective programming methods are implemented in the maintenance management of bridges and highways [18,19]; outranking models are implemented in the maintenance management of bridges and roads [20,21]. The review of the literature shows a trend towards using value measurement models to prioritize maintenance actions on single objects, also considering the relevance of the object at network level.
However, the MCDA is suited to deal with small sets of simple and static qualitative and/or quantitative data. It is thus inadequate to process large amounts of complex data which nowadays are collected during the several stages of maintenance and infrastructure management [22]. In addition, MCDA approaches have found limited implementation by government agencies, organizations, and institutions [23]. Currently, decisions are taken quickly, instinctively, and emotionally, considering only a few of all the possible alternatives, and without collecting information or using the information available for properly describing the decision consequences. As decision problems are inherently complex and multidimensional, strong arguments have been made in favor of a methodological pluralism in which the MCDA is used in conjunction with other methods in order to expand their influence and their acceptance among practitioners [24].

1.3. Artificial Intelligence and Data Mining Techniques in Maintenance Management

Contrary to MCDA, a group of techniques that are especially suited for dealing with big sets of complex data is artificial intelligence and data mining algorithms. Because maintenance management involves complex problems involving many variables and large data sets, the application of these algorithms for maintenance management has already been developed. A good example is represented by [25,26], in which unsupervised learning algorithms such as cluster algorithms are used in order to identify groups of similar maintenance activities. The potential of such techniques is evident and indisputable since they allow for the automation of the maintenance management process, taking full advantage of the available data. However, artificial intelligence and data mining techniques are ill-equipped to tackle novel problems in uncertain environments for which an abstract view is required, which are frequently encountered in the work of government institutions and organizations like the WSV and the BAW. Therefore, such algorithms prove helpful to organizational decisions when integrated with complementary techniques which support a holistic approach.

1.4. Integration of Data Mining Techniques in the Multi-Criteria Decision Analysis

Currently, there is a need to integrate the MCDA with other methods in order to enhance its practical value in operational research. Hybrid approaches in which MCDA is combined with artificial intelligence and data mining techniques have already been developed [22,27,28]. A comprehensive collection of recent contributions in which the MCDA is supported by artificial and computational intelligence is especially given by [28], in which several references to older approaches have also been provided. A review of the literature reveals that the integration has the practical purposes of improving the structure of the decision problem, performing data pre-processing, modeling the preferences. However, to date, hybrid MCDA has found almost no application in infrastructure management. Exceptions are represented by [29], in which artificial neural networks support the MCDA to evaluate municipal water mains performance, and [30], in which the MCDA and genetic algorithms are implemented together with other techniques in order to develop a multi-year maintenance planning for bridges. Nonetheless, the proposed methodologies lack integration and generality. The development of hybrid approaches in which the MCDA is integrated with artificial intelligence and data mining techniques could increase the objectivity of the decision process and thus enhance the practical value of the MCDA in the maintenance management of waterway infrastructures and in many other disciplines.
It should be mentioned that the social relevance of such integrated approaches has increased since the onset of the crisis due to the COVID-19 pandemic, as governments have been forced to make difficult choices that profoundly affect the health, wealth, and freedom of their populations. These high-stakes decisions have often been made quickly, without using sound information, and with little involvement of stakeholders in the deliberation about which policies to pursue. A more inclusive, objective, and data-driven decision-making process could contribute to more trustworthy and legitimate decisions on difficult ethical questions and political trade-offs during the pandemic and beyond [31].
The aim of this paper is to increase the rationality of decision making in infrastructure management by developing a hybrid approach for risk-based maintenance planning in which the MCDA is integrated with data mining techniques. The integration of the two methodologies is aimed at reducing their weaknesses and exploiting their full potential. The great advantages of a combined approach are to make explicit the subjective component of decision making and to combine it with advanced data analysis.
The rest of this paper is organized as follows. Section 2 presents the basic methodologies which have been integrated and combined to develop the hybrid approach for the risk assessment of aging infrastructures. Section 3 describes the main features of the hybrid approach and its application to the maintenance prioritization of a system of aging culverts. Section 4 summarizes the main findings of this work as well as its limitations and defines future research directions.
2. Materials and Methods

2.1. A Systematic Framework for the Integration of Data Mining Techniques in the Multi-Criteria Decision Analysis

The integration of data mining techniques in the MCDA should follow a systematic process in which the main dimensions of the design of the integrated method are clarified. In general, the objectives pursued by integrating the two methodologies and applying them to infrastructure and maintenance management are the following:
  • Increase the objectivity of the decision process by integrating analytic and intuitive thinking and thus reducing the cognitive bias.
  • Increase the transparency and understanding of the decision process, and by doing so, promote inclusive, accountable, and trustworthy decisions.
  • Increase the practical value of these approaches by overcoming the weaknesses of individual methods and gaining particular benefits from their integration.
  • Promote data-driven decisions by exploiting primary and secondary databases. Tackle complex decision problems characterized by several phases requiring different approaches.
Relevant dimensions of the design of the integrated method are as follows:
  • Rationales of the integration, such as:
    • Expansion/development/enhancement: when the scope is to extend the range of application of the MCDA, increase their credibility, foster a multiplicity of perspectives within their application, and improve the precision of the results.
    • Simplification: when the aim is to reduce the complexity of the MCDA application and speed up the application process.
    • Elaboration/illustration/clarification: when improved understanding and communication of the results of the MCDA are needed.
    • Utility: when the scope is to improve the usefulness of the results of the MCDA.
  • Timing of the integration: the integration could be concurrent or sequential. In the first case, the integration includes components which are integrated in parallel, while in the second case the components are linked in series. Sequential and concurrent designs are determined by the dependency between the components. Two components are dependent when the implementation of one depends on the results of the other.
  • Typological approach: according to the timing of the components, several typologies or taxonomies are identified, which are determined by the peculiar juxtaposition of the data mining with MCDA components. Examples of such typologies are:
    • Convergent parallel design: the MCDA and data mining techniques are applied independently. The results are then brought together in an overall interpretation.
    • Exploratory or explanatory sequential design: data mining techniques are used for data pre- or post-processing.
    • Embedded design: a strand of data mining techniques is added to enhance the MCDA.
    • Multiphase design: the above-mentioned designs are combined in a unique approach.
The complexity of the integrated approach, which is driven by the multiplicity of integration points and data sources, should also be considered. In general, a multiphase design is more complex than the other types of design.
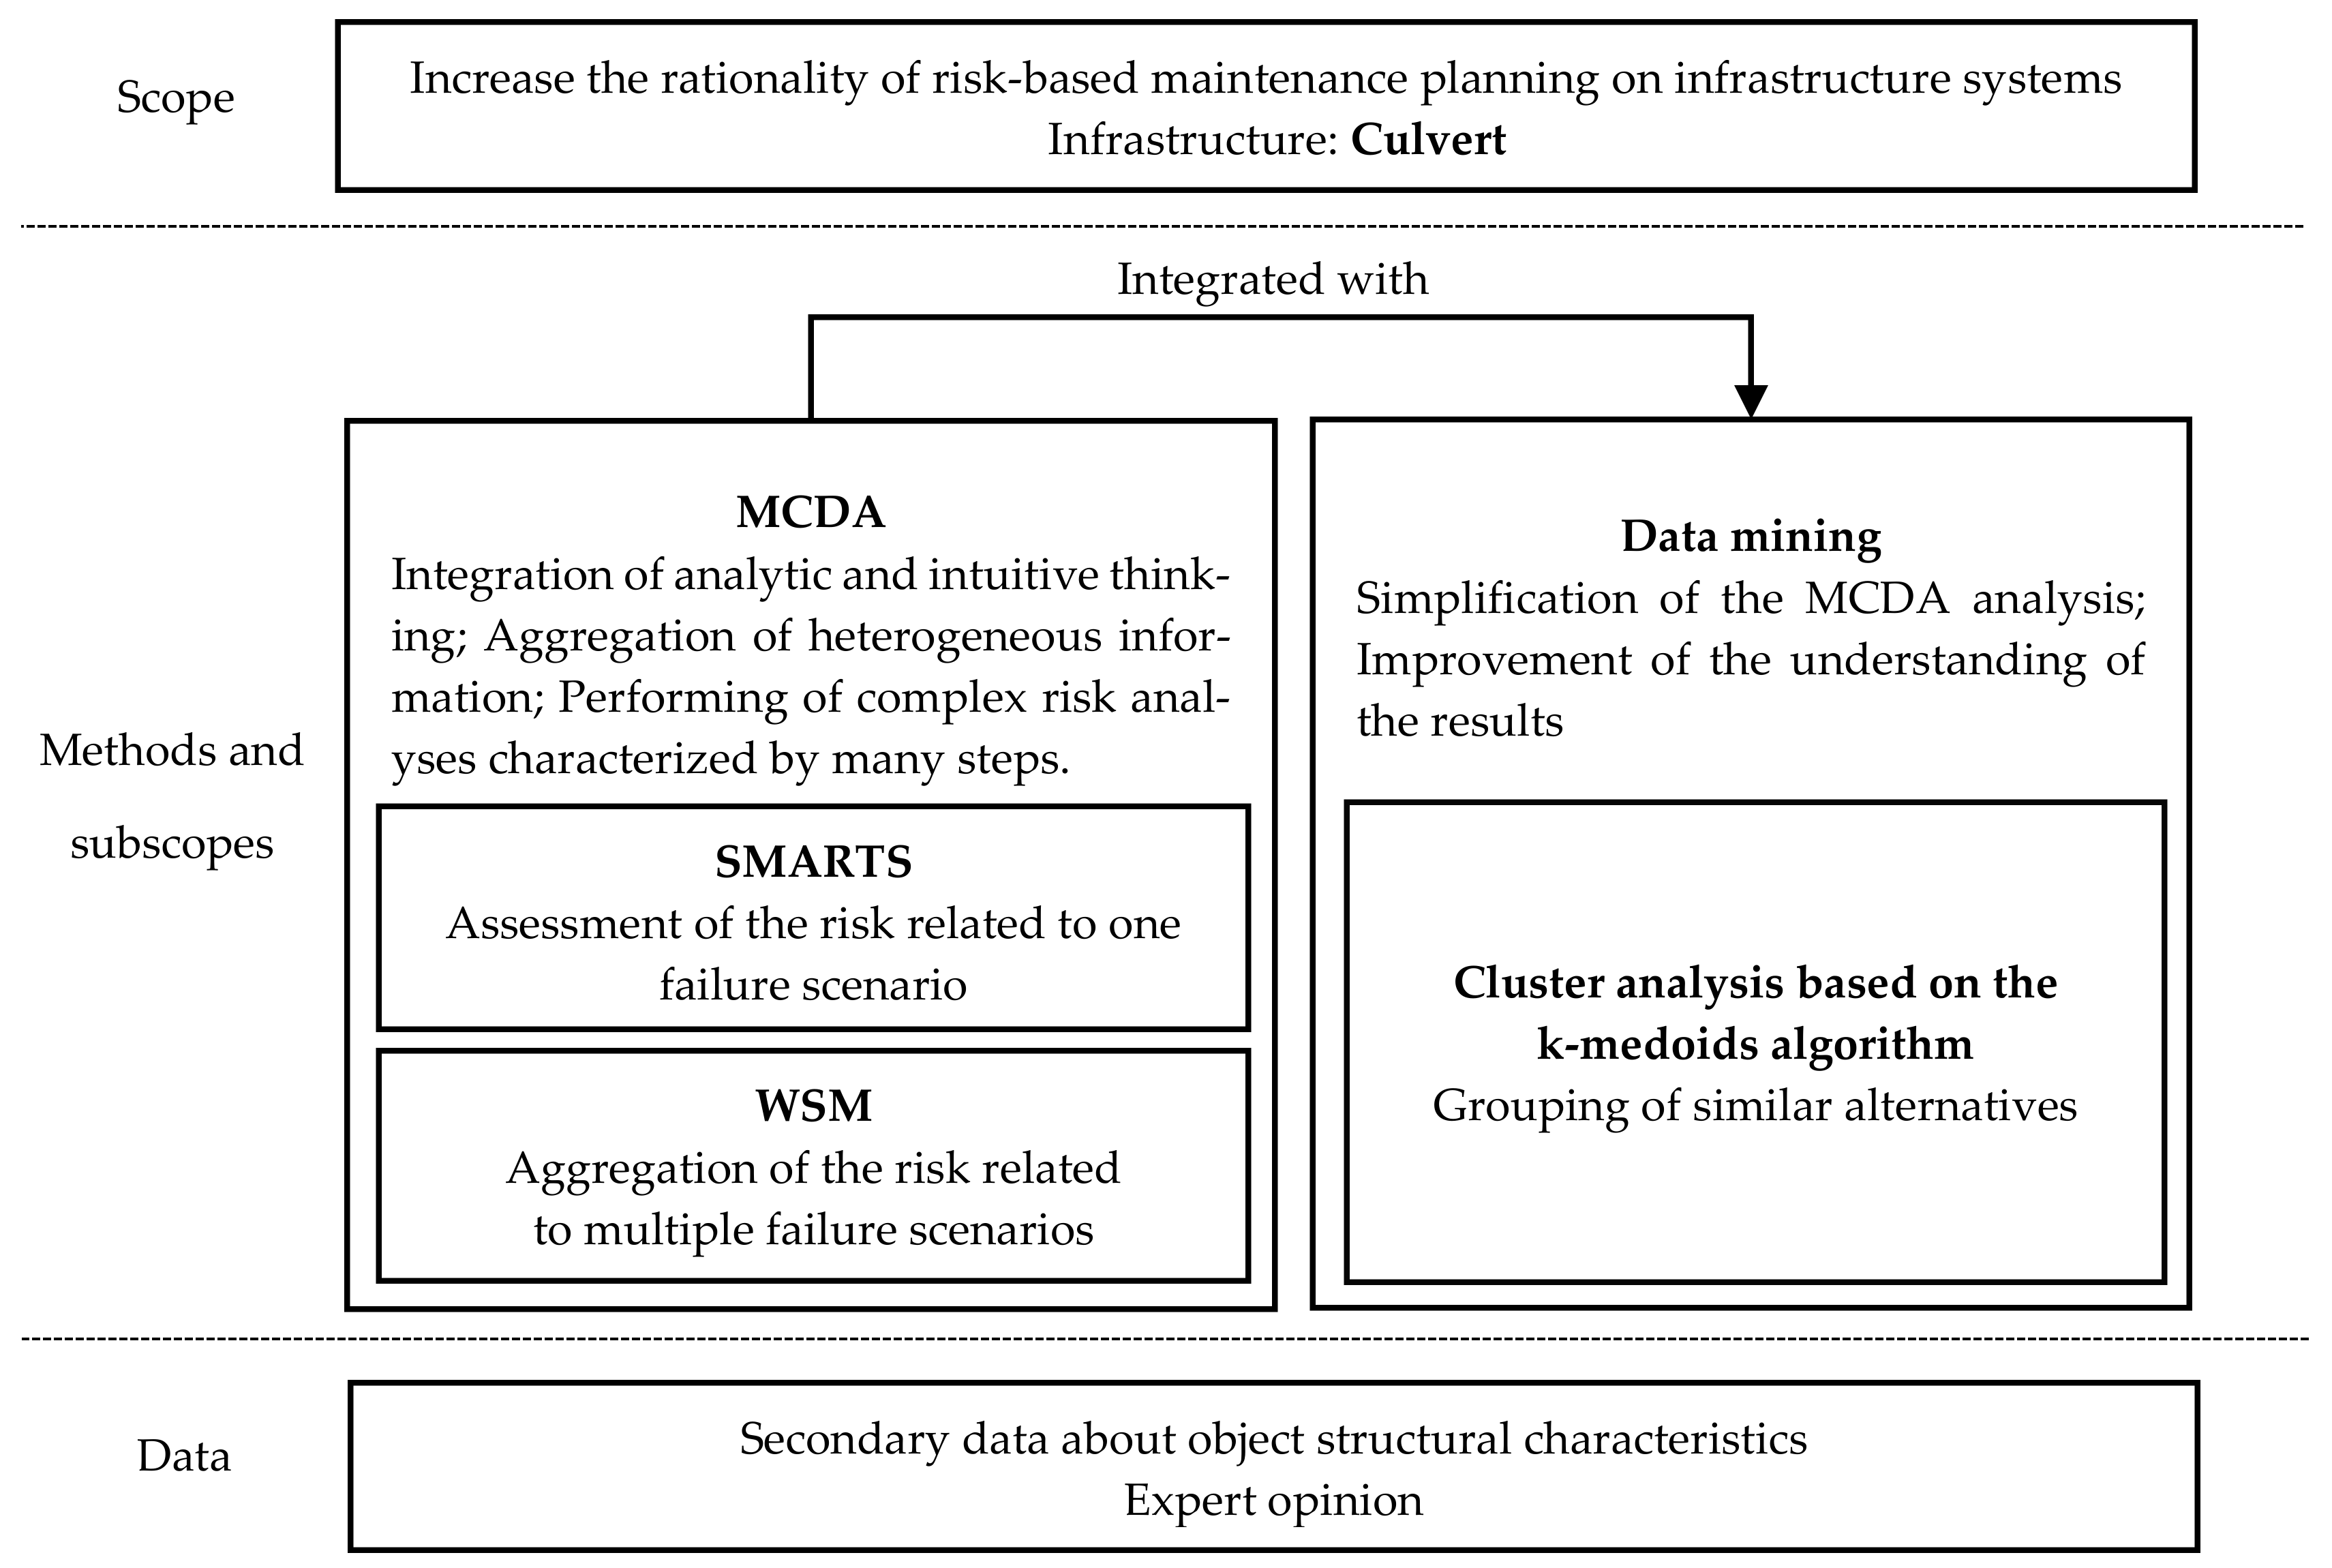
Figure 1 shows the overall research framework and identifies the main scopes, methods, and data used in this research. In the following subsections, attention is placed on the methods and their intended use in this research.

2.2. The Simple Multi-Attribute Rating Technique Swing

A MCDA method that is of particular interest due to its simplicity is the simple multi-attribute rating technique (SMART) [32]. SMART belongs to the group known as value measurement models, which are characterized by the following relevant steps:
  • Definition of the context of the decision problem: in this phase, the problematic characterizing the decision problem is identified, such as sorting, classification, ranking, description, learning, and design. This step allows the definition of the desired results and the identification of the model which can provide such outputs. Then, a first formulation for the alternatives, criteria, and goal of the decision problem can be developed.
  • Construction of the model: in this step, the value tree, which links alternatives, attributes, criteria, and goals of the decision problem, is built. Approaches to the elicitation and description of the preferences are also identified.
  • Validation of the model: this step is an interactive process during which the analyst cooperates with the decision maker in order to assess the validity of the results. In this step, sensitivity analyses could be carried out.
The SMART method represents a simplified version of the multi-attribute utility theory (MAUT) approach, and it uses the strategy of heroic approximation to justify the simplification of single-attribute utility function and use of an additive aggregation model. In MAUT, elicitation of the details of the utility functions could be tedious and demanding, and the contribution of those details to wiser and more valuable choices is often negligible. In SMART, simple linear single-attribute utility functions are considered. At the same time, whether this simplification might lead to possible suboptimal choices in the problem at hand is assessed. If not, time has been saved and an elicitation error has been avoided. A further improvement of SMART is represented by the SMARTS method, which has been obtained by including an invention called swing weighting (the additional S denotes exactly Swing). Swing weighting is related to the techniques used in order to define the weights of the attributes. The word “swing” especially refers to the operation of changing the score of some objects of evaluation from the worst to the best. By assessing the attractiveness of each swing, it is possible to define the weights which consider not only the importance of the attribute, but also the associated range of values.
Suppose that a function u relates the utility or value or desirability of some physical or judged quantity, u x , to its magnitude, x . The function u is thus a utility function. Suppose that u x is known for each relevant attribute. The easiest to use and most familiar model to aggregate the vector of u x values into a scalar is the additive model. If h ( h = 1 ,   2 ,   ,   H ) is an index identifying the alternatives (objects of the evaluation) and k ( k = 1 ,   2 ,   ,   K ) is an index identifying the attributes, then this model is expressed by Equation (1):
U h = k = 1 K w k u k x hk
where the values u k X hk are the single-attribute utilities and W k are the weights, one for each attribute; by convention, they sum to 1.

2.3. Assessment of the Risk Linked with One Failure Scenario

The MCDA could support the decision process in infrastructure management in many ways. It is especially possible to see prioritization tasks as decision problems characterized by the ranking problematic. Given a backlog of objects which are in a critical condition and for which maintenance should be executed, value measurement models could be effectively used in order to evaluate the risk linked to each object with respect to an identified failure scenario, and prioritize maintenance actions.
This approach requires first to identify and describe the failure scenarios, which consists in understanding how failure propagates through system levels and in describing the process with effective tools. Several tools and methods could be used in order to describe failure scenarios, such as failure trees, event trees, and causal chains, such as those implemented in the failure modes and effects analysis, the anticipatory failure determination, influence diagrams, cognitive maps, and directed acyclic graphs [33]. Once the dynamics of failure are investigated, recognized, understood, and described, a relationship has to be established between the failure scenario and the required information for assessing the related risk, according to which the value tree is built (Figure 2). This information could be already available. It could be collected through further investigation, or it could be difficult or even impossible to obtain. The intention is to perform a risk assessment based on the information already available, the results of which can also drive the collection of further information. In addition to primary databases, which are databases explicitly devoted to maintenance planning, the information extracted from secondary databases, which are data collected by someone else for other purposes, also plays a significant role. The information available shapes the structure of the value tree, especially the definition of the attributes characterizing the alternatives, which will be linked to the two main criteria defining risk, namely the probability of failure and the magnitude of the consequences.
Once failure scenarios are identified and the value tree is developed, the performance of each alternative could be assessed with the SMARTS method, which in this case corresponds to the risk linked to the object with respect to the considered failure scenario.

2.4. Aggregation of Many Failure Scenarios with the Weighted Sum Model

However, many failure scenarios exist, so as many value trees should be built as there are failure scenarios, and the risk linked to each one should be aggregated in a total risk. It is desirable that the aggregation could be obtained applying a simple additive model such as the weighted sum model (WSM). Suppose that j ( j = 1 ,   2 ,   ,   J ) is an index identifying the failure scenarios, the total performance of the alternative h can be calculated applying Equation (2) [34]:
R h = j = 1 J w j r hj
where R hj are the scenarios’ performances and W j are the weights, one for each failure scenario, which sum to 1. Depending on how risk is approached and modelled, the weights can have different meanings and could represent different aspects of risk. Therefore, the use of the MCDA goes in parallel with specification about the mental construction of risk.

2.5. The k-Medoids Algorithm

Unsupervised learning is the field of practice that supports finding patterns in cluttered data and it is based on techniques such as clustering and dimensionality reduction.
Clustering especially refers to the overarching process that involves finding groups of similar data in a dataset. A popular clustering approach is the k-medoids or partitioning around medoids algorithm [35], which partitions a data set into k groups or clusters. Each cluster is represented by one of the data points in the cluster which is named a medoid. The medoid is especially that point for which the average dissimilarity between it and all the other cluster members is minimal, and thus it corresponds to the most centrally located point in the cluster. Compared to the k-means algorithm, the k-medoids algorithm is more robust since it is less sensitive to noise and outliers.
A requirement of this algorithm is to specify the number of clusters to be generated, which is often unknown a priori. However, the silhouette method could be used for identifying the optimal number of clusters [36]. The idea is to implement the k-medoids algorithm using different values of the clusters k . Next, the average cluster silhouette is drawn according to the number of clusters, which measures the quality of a clustering. The higher the value of the silhouette width, the better the clustering. The optimal number of clusters k is the one that maximizes the average silhouette over a range of possible value of k.

3. Results

3.1. Description of the Hybrid Multi-Criteria Decision Analysis

An infrastructure which is often neglected despite the magnitude of the possible failure consequences is the culvert. A culvert allows water or other fluids to flow under an obstruction from one side to the other. The obstruction is often represented by a transportation system, such as roads, railways, and waterways. In the case of waterways, the culvert may encroach on a levee. Culverts are usually parts of a broader infrastructure systems which can be decomposed in hierarchical levels. As historical failures have shown, neglecting inspections and maintenance of culverts could initiate failure events which usually start at component levels and propagate to higher levels, showing a cascade behavior and leading to disastrous effects [37,38,39].
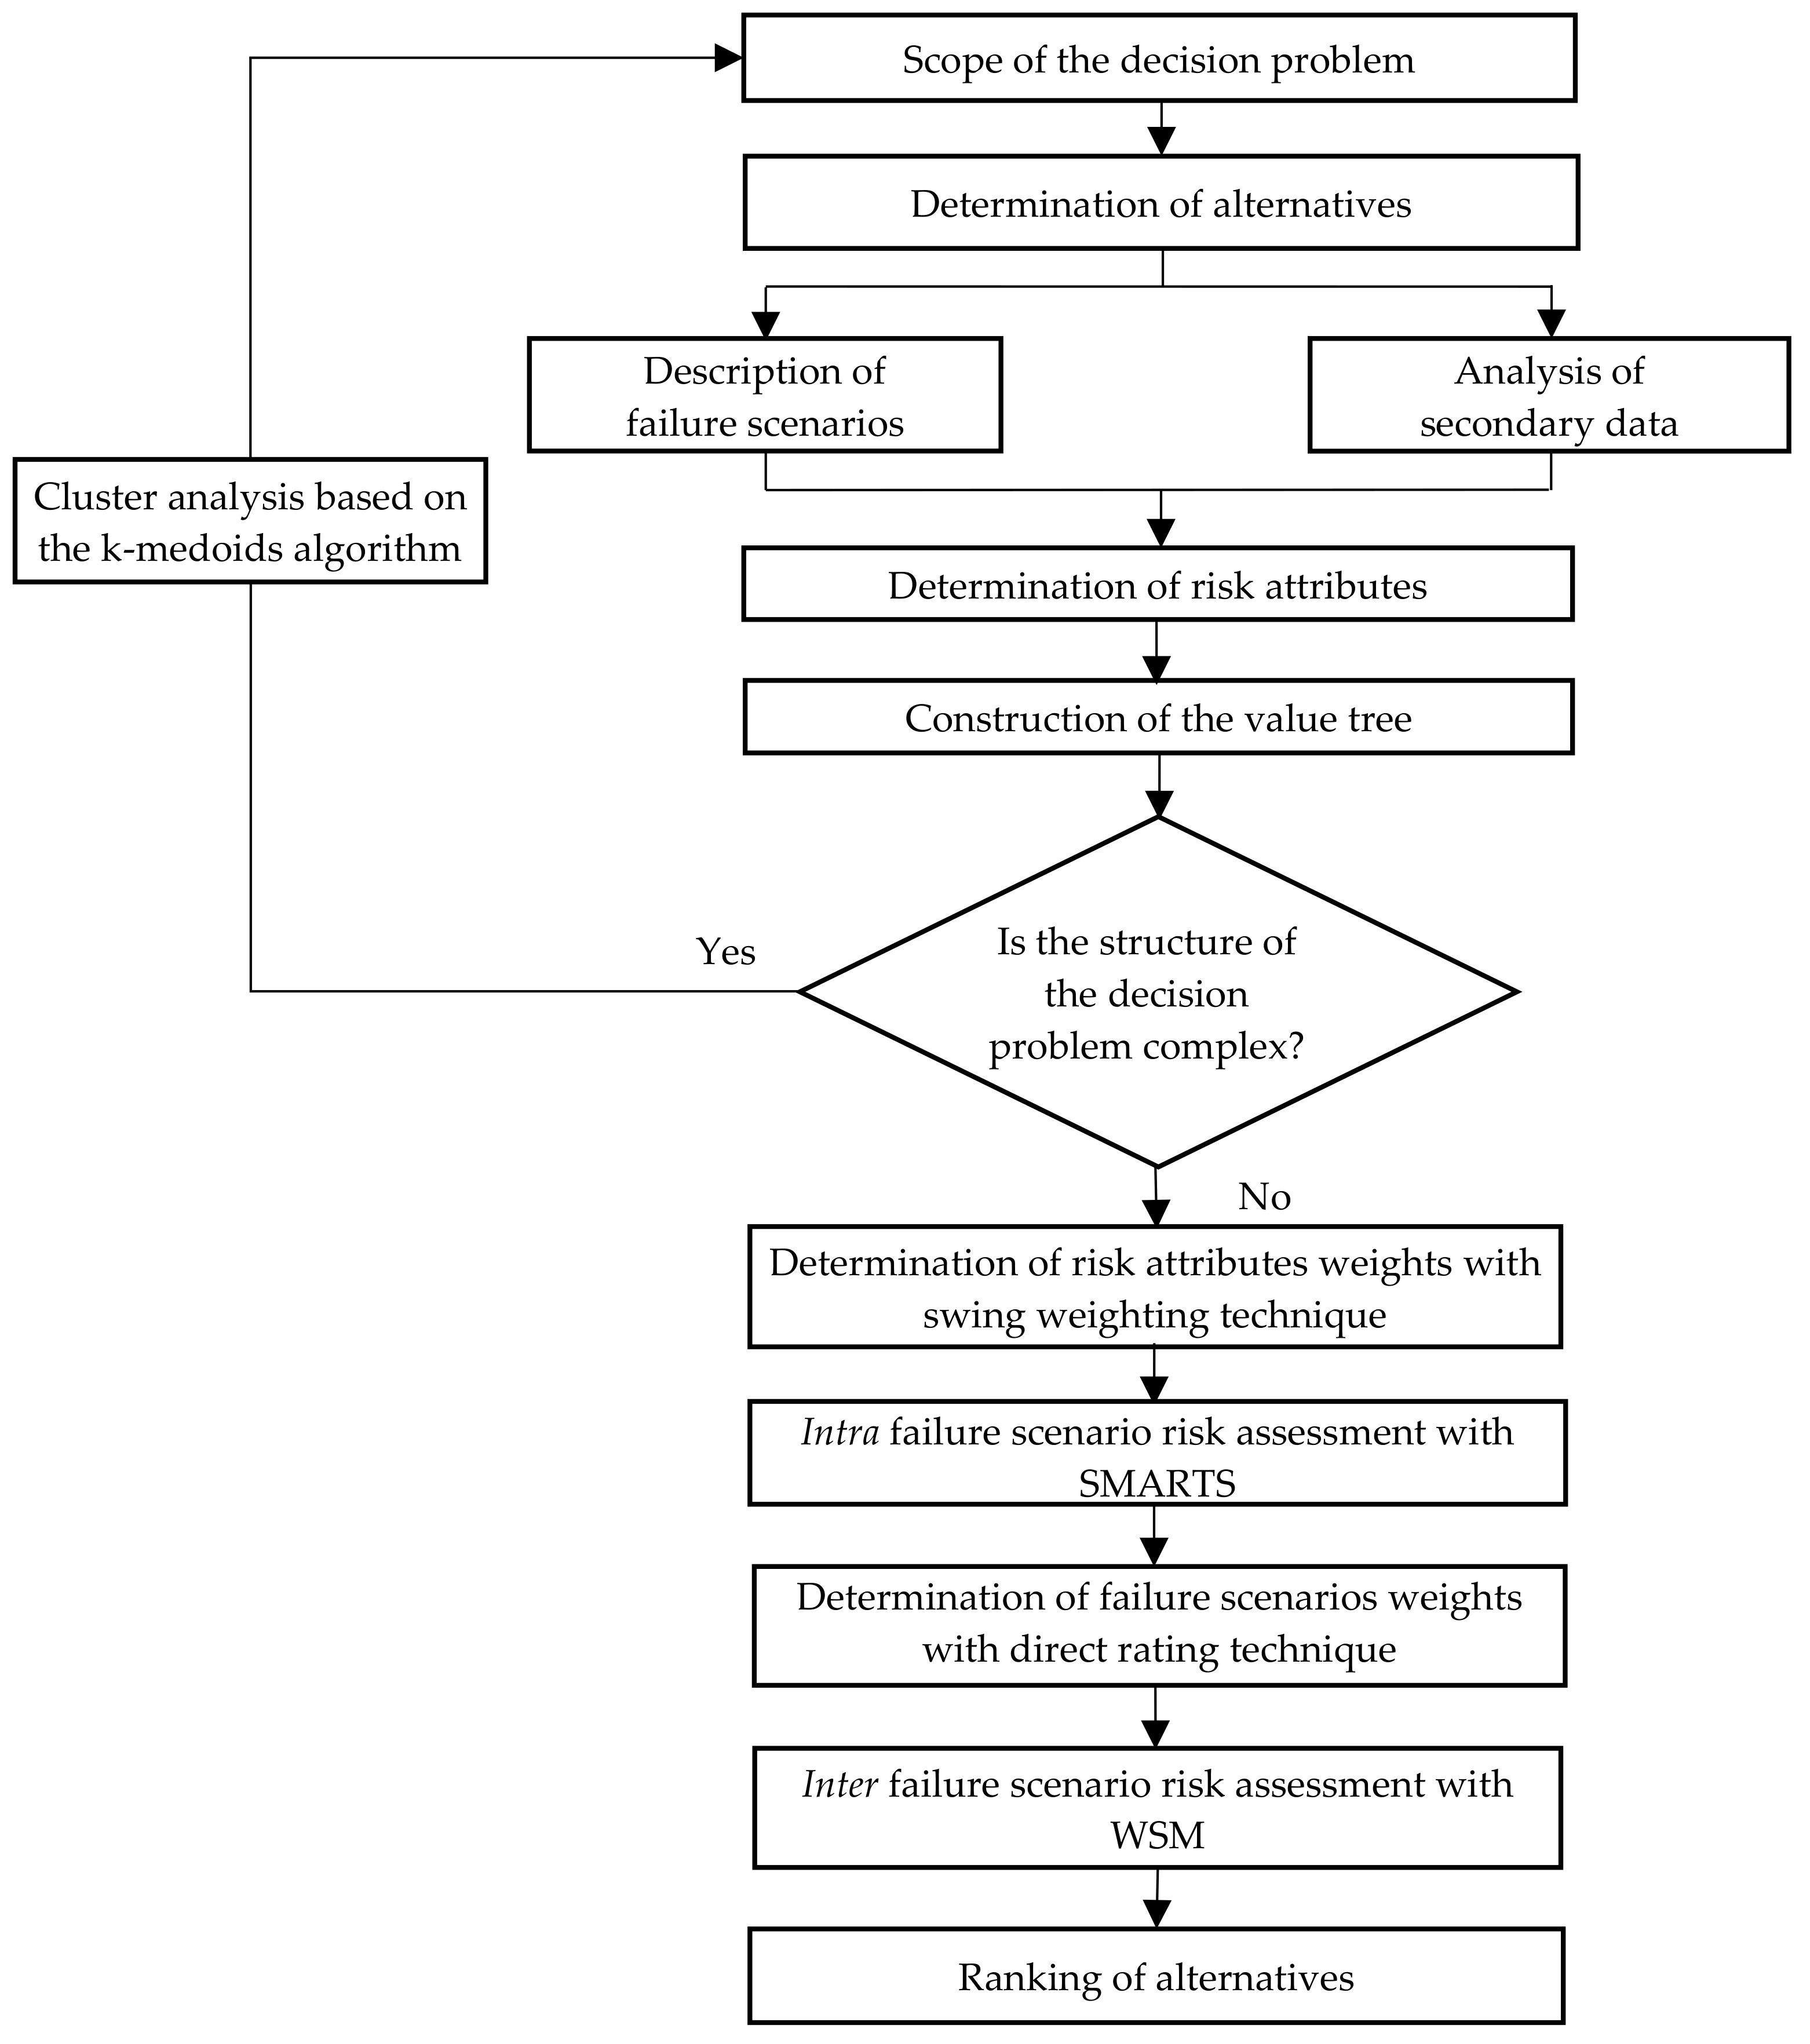
The flowchart in Figure 3 describes the integrated MCDA which has been applied in order to perform the risk assessment of a system of culverts. The first step is the clarification of the scope of the decision problem, which is the prioritization of maintenance activities on a system of culverts, and the identification of the alternatives, which are the aging culverts requiring maintenance interventions. After that, relevant failure scenarios of the objects are identified. At the same time, the available information about the object which could be relevant for the risk assessment is considered. Then, the risk attributes are identified. These are the main criteria according to which risk is assessed, for which information is already collected in the database. The identification of alternatives, attributes, criteria, and goals of the decision problem allows the definition of the value trees, one for each considered failure scenario. At this point, a decision has to be met. If the structure characterizing the value trees is simple, it is possible to directly proceed with the risk assessment. Otherwise, attempts are made in order to simplify the decision problem. A cluster analysis applying the k-medoids algorithm is especially executed, whose scope is to group alternatives showing similar values of the risk attributes.
If patterns in the data are found, a restructuring of the decision problem could be considered, which is finalized at reducing the number of alternatives or the number of attributes. Finally, the risk of each alternative with respect to the identified failure scenario is assessed applying the SMARTS method and the total risk is obtained by aggregating the risk linked to each failure scenario with the WSM. In this way, the objects could be ranked according to their total risk. In the next stages of the research, the ranking will support further decisions about the planning of maintenance activities.
The integration of the cluster analysis based on the k-medoids algorithm in the SMARTS model has especially the following purposes:
  • To simplify the decision problem.
  • To improve the understanding of the results and their communication with the project stakeholders.
The cluster analysis based on the k-medoids algorithm is executed after the definition of the value tree and before the risk linked to each failure scenario is assessed. Thus, the timing and the taxonomy of the integration of the data mining technique in the SMARTS method is respectively sequential and embedded.

3.2. Structuring of the Decision Problem

Table 1 shows the hierarchical decomposition which characterizes the culverts of the German waterways system. The culvert itself shows a hierarchical structure since it can be decomposed into components and subcomponents. The WSV has collected in a database called WADABA information about the structural and typological characteristics of 48 culverts intersecting the West German network of canals, a system of artificial navigable canals built at the turn of the 20th century in the Ruhr region in order to transport bulk goods to the industries located in the area. Although the data have not been explicitly collected in order to plan maintenance activities on the objects, the WADABA database could be exploited with this aim, and therefore it represents a source of secondary data for maintenance management.
In order to understand the data relevant for the risk assessment, failure scenarios for culverts are first identified (Table 2). The four main failure scenarios are: collapse of the barrel and collapse of the headwalls (which, both involving the structural collapse of the culvert, have been considered as a unique failure scenario), leakage out of the culvert, piping inside the culvert, and afflux. The failure scenarios are formulated with respect to the object level by identifying possible causes, and short and long terms consequences linked to main events characterizing the failure scenario.
Given the identified failure scenarios, the metadata of WADABA which could be relevant for the risk assessment are identified, together with the values which they could assume, determining the type of variable (Table 3). The metadata represent risk attributes since they are linked with the probability and the consequences of the failure scenarios listed in Table 2.
The study presents the following challenges:
  • In addition to the identified risk attributes, other factors play a role in the assessment of risk, and especially affect the probability of unwanted consequences, such as the length of the chain of cause–effect according to which the failure scenario can be described and the detectability of the failure scenario before long term consequences are obtained.
  • The decision problem is characterized by many alternatives, to which multiple risk attributes are associated. In addition to that, the decision problem is characterized by a complex structure that implies a complex process of preference elicitation. In this circumstance, it is difficult to anticipate, explain, and understand the results of the risk assessment. Recalling that one alternative dominates another when it is at least as good with respect to all criteria and it is strictly preferred on at least one criterium, it is especially difficult to define the dominating or dominated alternatives, whose identification could not only improve the understanding and the communication of the results of the analysis, but also simplify the structure of the decision problem.
The integrated approach that has been developed in this study aims at properly addressing the above-mentioned challenges.

3.3. Construction of the Value Tree

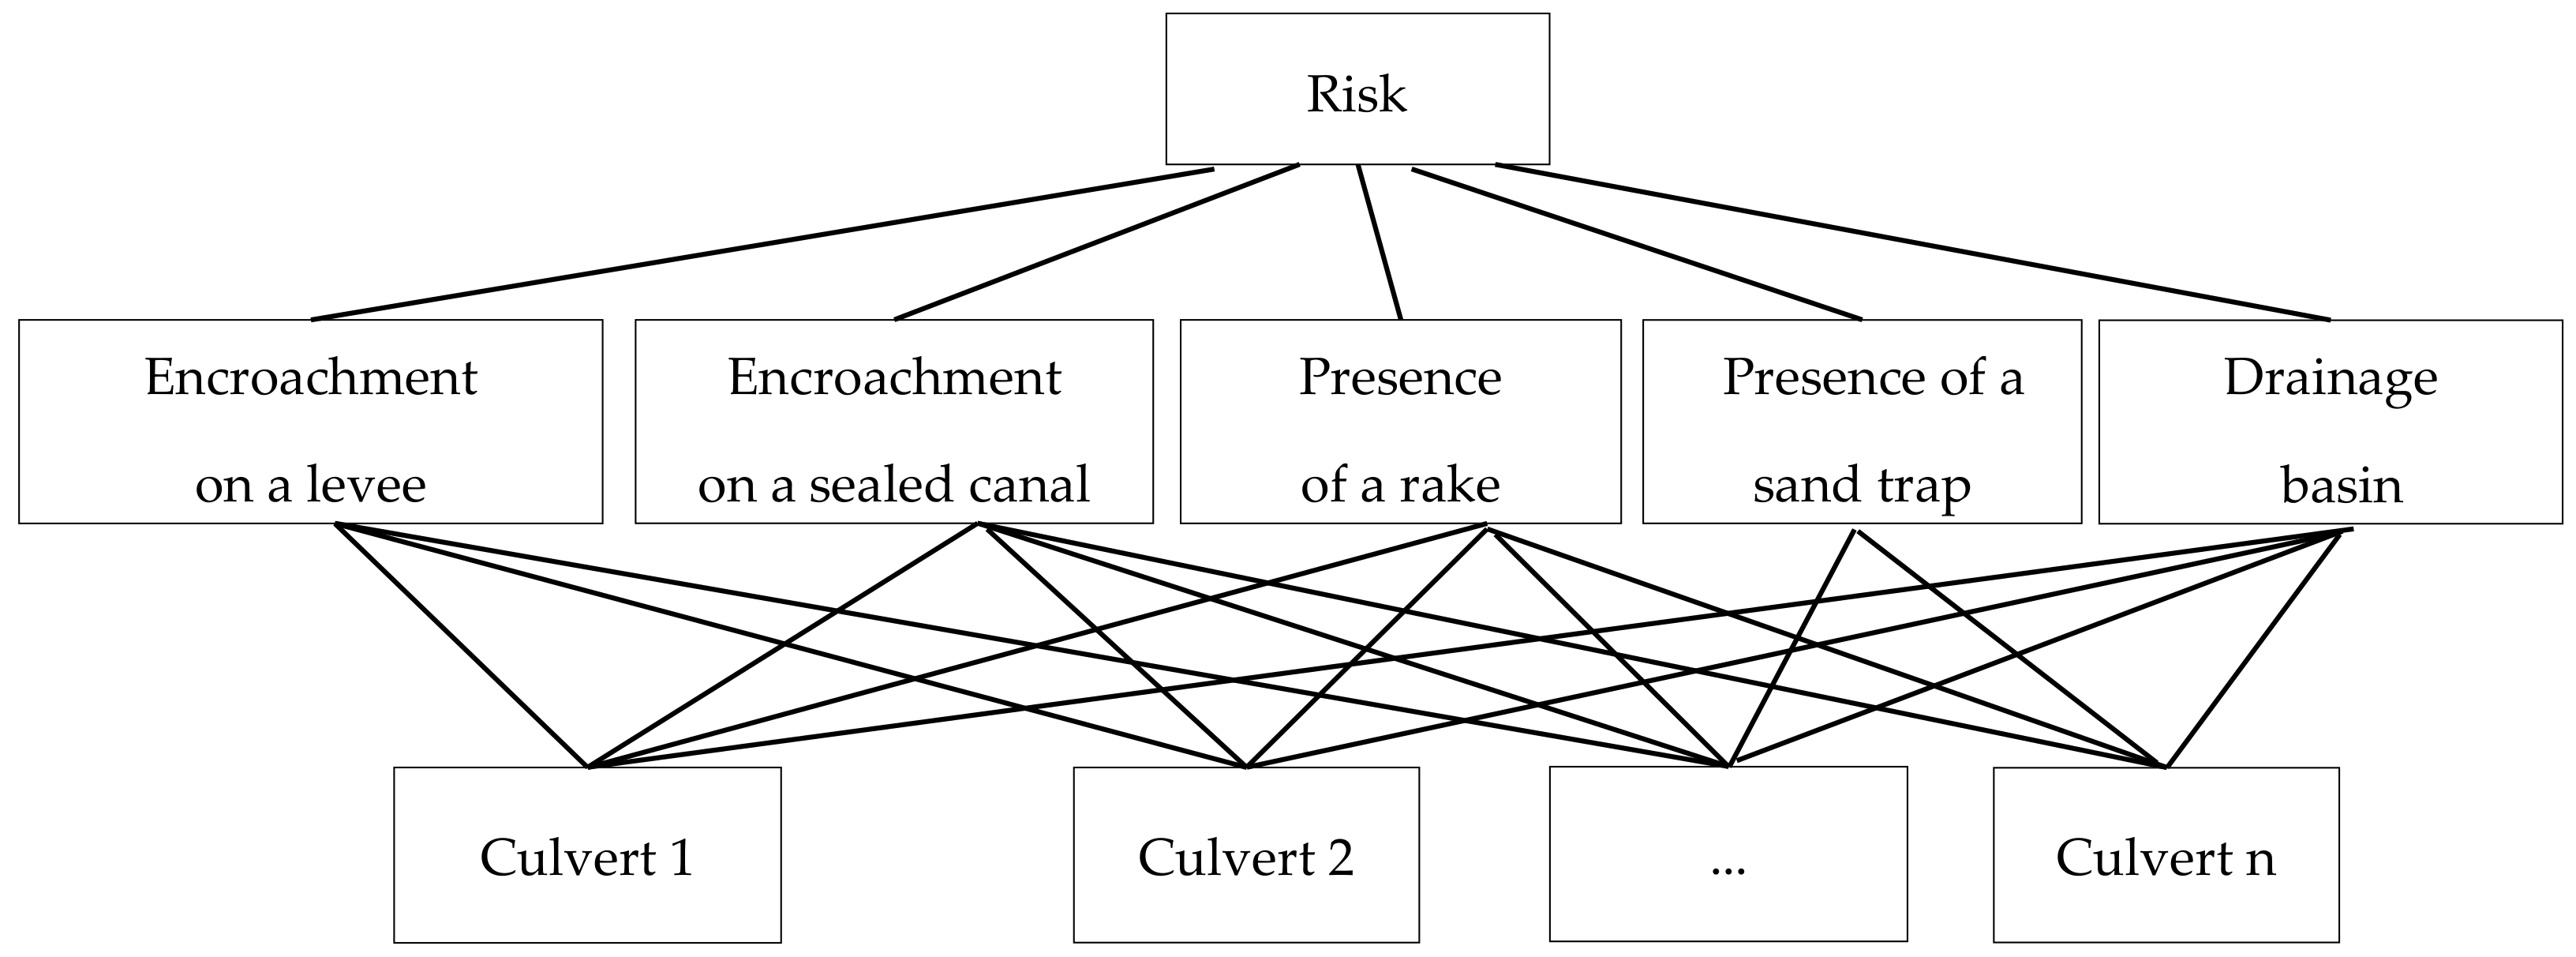
The value tree explicates the links between the alternatives, the risk attributes, the criteria, and the scope of the decision problem. In Figure 4, it is possible to see the general structure of the value tree characterizing the decision problem under assessment. It should be noted that the contribution of the attributes to the risk linked with a certain failure scenario changes with the considered failure scenario. The relationship between the risk attribute and the risk linked to a certain failure scenario is in some cases direct, while in other cases inverse. An example is represented by the risk attributes “Presence of a rake” and “Presence of a sand trap”. Rakes and sand traps are culvert components which protect the barrel from damage by debris and particles, or avoid obstructions within the conduit. However, if they are not properly cleaned, or in the case of flash flooding or ponding water, they could provoke the obstruction of the inlet structure, triggering the failure scenario “Afflux”.
An additional complication is represented by the fact that some risk attributes could affect both the probability and the consequence of failure. This is the case of the drainage basin in the failure scenario “Afflux”: the larger a drainage basin is, the higher the probability that debris and particles will be transported and eventually obstruct the culvert, but also the greater the resulting cross catchment flooding.

3.4. Cluster Analysis Applying the k-Medoids Algorithm

The k-medoids algorithm is applied in order to identify clusters in the set of considered culverts characterized by the attributes listed in Table 3.
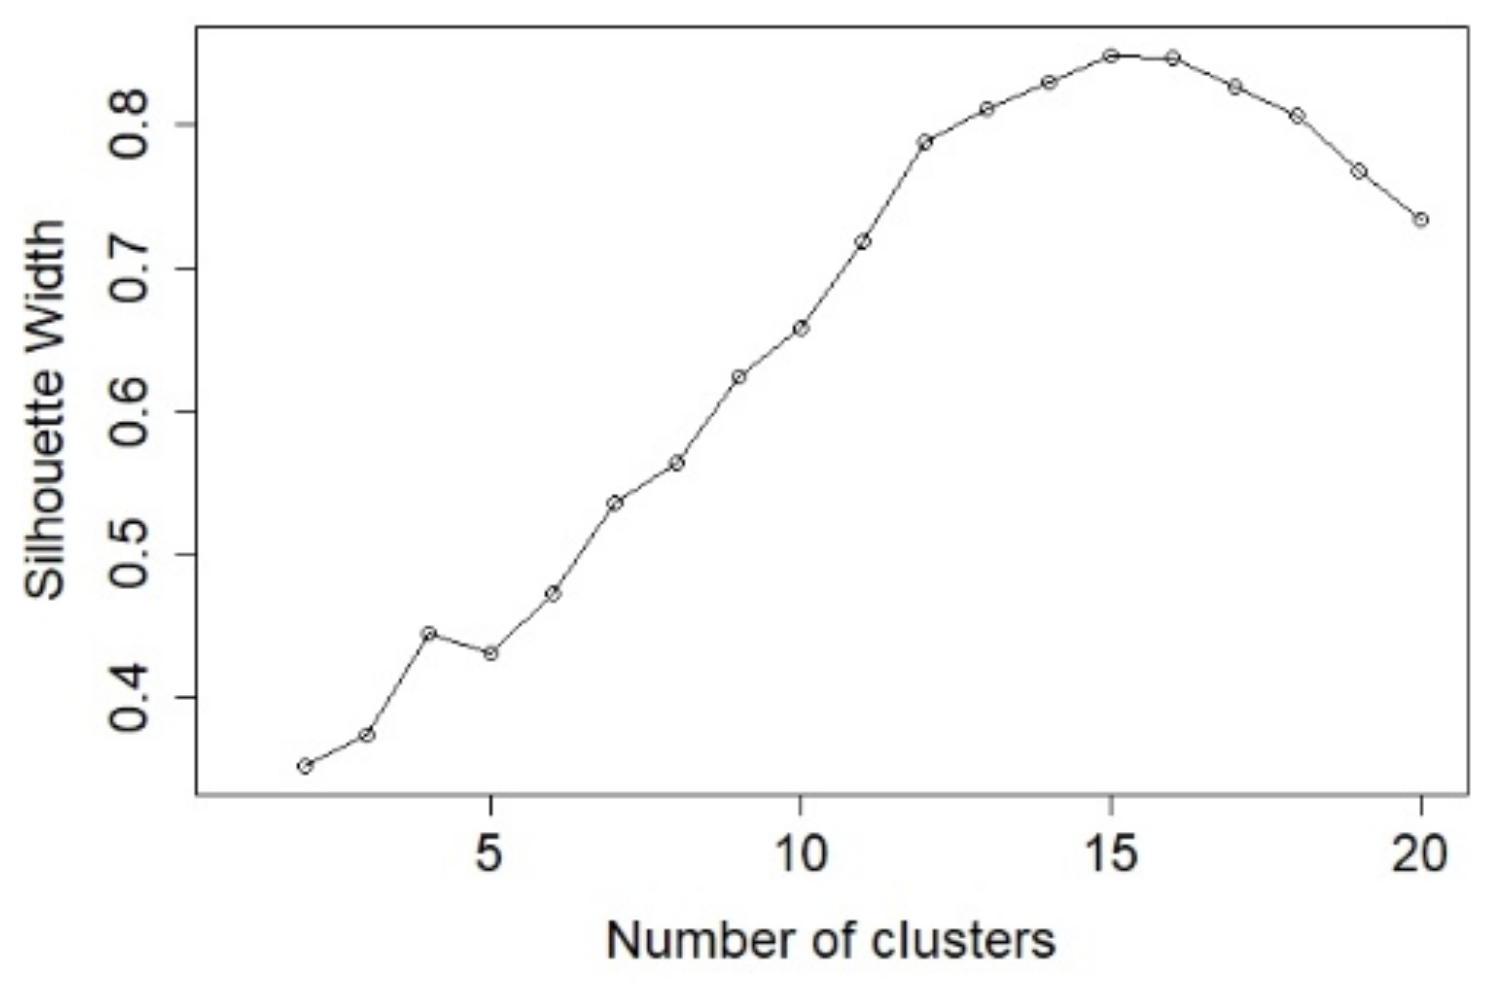
First of all, the silhouette width for several clusters is computed, according to which the optimal number of clusters can be identified. As Figure 5 shows, the value of the silhouette width increases with increasing values of the number of clusters. The maximum value is obtained when 15 clusters are considered. Then, it decreases progressively for an increasing number of clusters. The maximum value of the silhouette width is above 0.8, which indicates that the data are characterized by a strong structure. This result is not surprising, since most of the attributes are discrete.
The number of clusters which corresponds to the maximum value of the silhouette width is considered (Table 4). The number of objects in each cluster varies between 1 and 7. Three clusters are composed by only one object, and therefore they do not actually represent a group of objects. The median value of the attribute “Drainage basin” within each cluster has been considered since the variation of the values of the attribute within the cluster is limited. Although the identification of dominating/dominated alternatives is hampered by the complex elicitation process of the preferences required by this decision problem, which is executed on two different levels (intra and inter failure scenarios), the results suggest that clearly dominating alternatives cannot be identified. In effect, there are no culverts which encroach on a levee and also have significant values of the drainage basin. On the other side, some culverts do not encroach on a levee and have negligible values of the drainage basin (Cluster 3, 5, 8, and 12). These clusters, which altogether form a group of 14 objects, can be identified as dominated alternatives.

3.5. Intra Failure Scenario Risk Assessment

The crucial steps of the SMARTS model are applied, which are the definition of single-attribute utility functions and the swing weighting. The definition of the single-attribute utility functions is trivial for discrete attributes, since they can assume only two values, which correspond to the maximum and minimum utility. For the only numerical attribute “Drainage basin”, a linear function can be assumed, because it does not matter if small improvements in the value of the attributes fell near the minimum, in the middle, or near the maximum. The single-attribute linear utility function u can be obtained by creating a function which normalizes the values x of the attribute:
u = x min x max x min x
where min x ,   max x are the minimum and maximum values of the attribute, respectively. The single-attribute utility function for the attribute “Drainage basin” is defined according to Equation (3), and the swing weighting method is applied. The elicitation of the swing weights proceeds in two steps. The first step yields the rank order of the weights, which can be obtained by determining the sequence of attributes which contribute the most to risk by swinging their values. The second step yields the weights themselves. Several methods exist to execute this approach and one of these is via direct magnitude estimates. Assuming that the swing of the attribute ranked as first is worth a full 100 points, the swing on the other attributes is assessed with respect to it. Then, the weights are determined by dividing the assigned points with their total sum. Table 5, Table 6, Table 7 and Table 8 summarize the results of the swing weighting for the failure scenarios identified in Table 2.
Now that single attribute functions and the attribute weights have been defined, the preference for each alternative can be expressed through a scalar number by applying the Equation (1). This model assumes conditional monotonicity. This assumption can be verified by considering when, at one level of the value of a certain attribute, more of another attribute is better than less, while at another level of the same attribute, less of another attribute is better than more. Since conditional monotonicity is verified, the additive model can be a good approximation in order to express the preference for each alternative.

3.6. Inter Failure Scenario Risk Assessment

In order to compute the total risk of each alternative, the WSM expressed by Equation (2) is applied, previous standardization of the utilities related to each failure scenario. The crucial part of the application of this method is the definition of the weights, which represent the importance of the scenario. It is assumed here that the importance depends on three factors: (1) the length of the cause-effect chain according to which the failure scenario could be described; (2) the detectability of ongoing failure scenarios; (3) the magnitude of the long-term failure consequences.
In Table 9, the failure scenarios are evaluated according to the above-mentioned dimensions. The weights are than developed applying the direct rating method.
The highest rate is assigned to the failure scenario “Collapse of the barrel/headwalls”. Although this scenario is characterized by a long causal chain, and a medium detectability, it could lead to disastrous consequences. In effect, this failure scenario could not only initiate instability and erosion in levees, but could also trigger other failure scenarios. Therefore, it is considered that this failure scenario is associated to critical cascade effects, and for this reason it earns 100 points. The lowest rate of 50 is given to the scenario “Afflux”. Although this scenario is usually characterized by a short cause–effect chain, it could be easily detected since the accumulation of water is in general visible and it grows seamless. The resulting flooding, although of considerable size, is not comparable to those resulting from the breach of a levee. The remaining failure scenarios have obtained an equal rate of 75. These scenarios are characterized by long cause–effect chains but a low detectability, as signs of their development are visible only when significant consequences have already developed. They are both associated with soil instability and erosion, which could eventually result in the breach of a levee.
The results shown in Table 10 reveal that the groups of culverts encroaching on a levee obtain the highest scores of aggregated utilities. This result is not surprising since the breach of a levee is the most undesired consequence. The procedure which has been applied in this paper allows to consider the contribution to the total risk given by the other risk attributes, and by doing so to prioritize within these groups. The groups of culverts encroaching on a levee are followed by two groups of culverts characterized by very high values of the drainage basin. The clusters 3, 5, 8, and 12, which have been previously recognized as dominated alternatives, earn the ranking positions 10, 13, 11, and 12 respectively, confirming the prediction. The last ranking positions are obtained by clusters 11 and 13, which also do not encroach on a levee and present small values of the drainage basin. These clusters are also characterized by the presence of a rake and the presence of a sand trap. It is possible to conclude that the presence of these culvert components is linked with lower aggregated risk.
These results represent valuable information for maintenance management at operational, tactical, and strategic levels. This approach provides a concise view of the items that need urgent maintenance, and consequently supports discussion at the strategic level, the identification of long-term goals, and the definition of tactics to achieve them. In addition to that, risk quantification combined with optimization algorithms allows for the optimal allocation of maintenance resources and detailed scheduling of repair interventions.

4. Conclusions

Civil infrastructure systems are aging but the investment in maintenance is insufficient. New strategies are needed in order to deal with the increasing backlog of maintenance activities. A possible approach is to prioritize the object requiring maintenance on the basis of the risk of neglecting them. However, infrastructure systems are interdependent and interconnected complex systems of systems. The application of the classical definition of risk based on the triplet failure scenario, failure probability, and consequence of failure is hindered by several obstacles:
  • Risk has many dimensions, since both the probability and the consequence of failure depend on many factors which could be qualitative or quantitative. A quantitative definition of risk could be not only difficult and time consuming, but also unnecessary when the analysis is driven by prioritization tasks.
  • Same risk factors could play different roles depending on the considered scenario. In order to compute the total risk of neglecting maintenance of a certain object, the risk linked to single failure scenarios should be properly aggregated.
  • Aspects such as the length of the causal chain characterizing the failure scenario and the detectability of the failure scenario significantly affect risk, and therefore they should also be considered in the analysis.
In order to overcome these obstacles, this paper proposes to approach the assessment of risk by applying multi-criteria decision analysis and integrating it with data mining techniques. Multi-criteria decision analysis supports decision making, providing a rigorous structure for the decision problem whereby the subjectivity inherent in the decision process can be better managed and assessed. The models predominantly considered are the simple multi-attribute rating technique improved with swing weighting and the weighted sum model. The scopes of their application are, respectively:
  • To perform an intra-failure scenario risk assessment, and especially to evaluate the contribution of each risk factor to the risk linked with a certain failure scenario.
  • To perform an inter-failure scenario risk assessment, and especially to aggregate the risk linked with single failure scenario.
The integration of the multi-criteria decision analysis with data mining techniques is aimed at promoting data-driven decisions, simplifying the structure of the decision problem, and improving the interpretation of the results. The cluster analysis based on the k-medoids algorithm is applied in order to group alternatives presenting similar risk attributes. In this way, the alternatives of the decision problem are reduced to the prototypes representing each group. The application of the k-medoids algorithm allows to reach the following objectives in succession:
  • Evaluate the profiles which characterize the alternatives.
  • Facilitate the identification of dominating/dominated alternatives.
  • Catalyze the learning and understanding of the problem situation, as well as the explanation of the results to infrastructure stakeholders.
Results show that 15 clusters are clearly identified within the set of 48 culverts. Each cluster is characterized by a prototype representing the prevalent profile of the alternatives within that cluster. The protypes can be considered as the alternatives of the decision problem. The visual assessment of the profiles characterizing each cluster allows us to recognize that four clusters containing 14 culverts are dominated alternatives.
However, a limitation of this study is that information regarding only one level of the infrastructure system, namely the object level, has been considered. In order to obtain more refined results, information regarding other system levels should be included, such as the typology of degradation processes affecting the object components, state of degradation, and potential of the failure consequences to damage social, economic, and infrastructural systems. In the next steps of this research, this approach will be further improved and extended in order to process information from different system levels. The final scope is to carry out a multilevel and multi-scenario risk assessment of aging infrastructure systems.

Author Contributions

Conceptualization, F.M.; methodology, F.M.; software, F.M.; validation, F.M.; formal analysis, F.M.; investigation, F.M.; resources, J.B.; data curation, F.M.; writing—original draft preparation, F.M.; writing—review and editing, J.B.; visualization, F.M.; supervision, J.B.; project administration, J.B.; funding acquisition, J.B. All authors have read and agreed to the published version of the manuscript.

Funding

This study has been developed within the research project PREVIEW, funded by the German Ministry of Education and Research (13N14698), whose scope is to increase the resilience of German waterways infrastructures (https://preview-projekt.baw.de/de).

Institutional Review Board Statement

Not applicable.

Informed Consent Statement

Not applicable.

Data Availability Statement

Not applicable.

Conflicts of Interest

The authors have no conflict of interest to declare.

References

  1. Croce, P.; Holický, M. Operational Methods for The Assessment and Management of Aging Infrastructure; Tipografía Editrice Pisana: Pisa, Italia, 2015. [Google Scholar]
  2. Litzka, J.; Weninger-Vycudil, A. The Effect of Restricted Budgets for Road Maintenance. Procedia Soc. Behav. Sci. 2012, 48, 484–494. [Google Scholar] [CrossRef] [Green Version]
  3. Peters, R.W. Reliable Maintenance Planning, Estimating, and Scheduling; Elsevier Science: Amsterdam, The Netherlands, 2014. [Google Scholar]
  4. Adey, B.T.; Martani, C.; Papathanasiou, N.; Burkhalter, M. Estimating and communicating the risk of neglecting maintenance. Infrastruct. Asset Manag. 2019, 6, 109–128. [Google Scholar] [CrossRef] [Green Version]
  5. Arunraj, N.S.; Maiti, J. Risk-based maintenance—Techniques and applications. J. Hazard. Mater. 2007, 142, 653–661. [Google Scholar] [CrossRef] [PubMed]
  6. Aven, T.; Renn, O. On risk defined as an event where the outcome is uncertain. J. Risk Res. 2009, 12, 1–11. [Google Scholar] [CrossRef]
  7. Aven, T. Risk assessment and risk management: Review of recent advances on their foundation. Eur. J. Oper. Res. 2016, 253, 1–13. [Google Scholar] [CrossRef] [Green Version]
  8. Lowrance, W.W. Of Acceptable Risk: Science and the Determination of Safety; W. Kaufmann: Los Altos, CA, USA, 1976. [Google Scholar]
  9. Kaplan, S.; Garrick, B.J. On The Quantitative Definition of Risk. Risk Anal. 1981, 1, 11–27. [Google Scholar] [CrossRef]
  10. Haimes, Y.Y. On the complex definition of risk: A systems-based approach. Risk Anal. Off. Publ. Soc. Risk Anal. 2009, 29, 1647–1654. [Google Scholar] [CrossRef]
  11. Haimes, Y.Y. Risk Modeling of Interdependent Complex Systems of Systems: Theory and Practice. Risk Anal. Off. Publ. Soc. Risk Anal. 2018, 38, 84–98. [Google Scholar] [CrossRef]
  12. Kabir, G.; Sadiq, R.; Tesfamariam, S. A review of multi-criteria decision-making methods for infrastructure management. Struct. Infrastruct. Eng. 2013, 10, 1176–1210. [Google Scholar] [CrossRef]
  13. Chemweno, P.; Pintelon, L.; van Horenbeek, A.; Muchiri, P. Development of a risk assessment selection methodology for asset maintenance decision making: An analytic network process (ANP) approach. Int. J. Prod. Econ. 2015, 170, 663–676. [Google Scholar] [CrossRef]
  14. Belton, V.; Stewart, T.J. Multiple Criteria Decision Analysis; Springer: Boston, MA, USA, 2002. [Google Scholar]
  15. Stipanovic, I.; Bukhsh, Z.A.; Reale, C.; Gavin, K. A Multiobjective Decision-Making Model for Risk-Based Maintenance Scheduling of Railway Earthworks. Appl. Sci. 2021, 11, 965. [Google Scholar] [CrossRef]
  16. Bukhsh, Z.A.; Oslaković, I.S.; Klanker, G.; Hoj, N.P.; Imam, B.; Xenidis, Y. Multi-criteria decision making: AHP method applied for network bridge prioritization. In Proceedings of the Joint COST TU1402-COST TU1406-IABSE WC1 Workshop: The Value of Structural Health Monitoring for the Reliable Bridge Management, University of Zagreb, Zagreb, Croatia, 2–3 March 2017. [Google Scholar] [CrossRef]
  17. Dabous, S.A.; Zeiada, W.; Zayed, T.; Al-Ruzouq, R. Sustainability-informed multi-criteria decision support framework for ranking and prioritization of pavement sections. J. Clean. Prod. 2020, 244, 118755. [Google Scholar] [CrossRef]
  18. Wu, Z.; Flintsch, G.; Ferreira, A.; Picado-Santos, L.d. Framework for Multiobjective Optimization of Physical Highway Assets Investments. J. Transp. Eng. 2012, 138, 1411–1421. [Google Scholar] [CrossRef]
  19. Kim, S.; Ge, B.; Frangopol, D.M. Effective optimum maintenance planning with updating based on inspection information for fatigue-sensitive structures. Probabilistic Eng. Mech. 2019, 58, 103003. [Google Scholar] [CrossRef]
  20. Gao, Z.; Liang, R.Y.; Xuan, T. VIKOR method for ranking concrete bridge repair projects with target-based criteria. Results Eng. 2019, 3, 100018. [Google Scholar] [CrossRef]
  21. Marcelino, P.; Antunes, M.D.L.; Fortunato, E.; Gomes, M.C. Development of a Multi Criteria Decision Analysis Model for Pavement Maintenance at the Network Level: Application of the MACBETH Approach. Front. Built Environ. 2019, 5, 323. [Google Scholar] [CrossRef] [Green Version]
  22. Doumpos, M.; Zopounidis, C. Preference disaggregation and statistical learning for multicriteria decision support: A review. Eur. J. Oper. Res. 2011, 209, 203–214. [Google Scholar] [CrossRef]
  23. Kurth, M.H.; Larkin, S.; Keisler, J.M.; Linkov, I. Trends and applications of multi-criteria decision analysis: Use in government agencies. Environ. Syst. Decis. 2017, 37, 134–143. [Google Scholar] [CrossRef]
  24. Tzeng, G.-H.; Shen, K.-Y. New Concepts and Trends of Hybrid. Multiple Criteria Decision Making; CRC Press: New York, NY, USA, 2017. [Google Scholar]
  25. Đorić, D.; El Cadi, A.A.; Hanafi, S.; Mladenović, N.; Artiba, A. Clustering approach in maintenance of capillary railway network. Electron. Notes Discret. Math. 2017, 58, 239–246. [Google Scholar] [CrossRef]
  26. Di Maio, F.; Hu, J.; Tse, P.; Pecht, M.; Tsui, K.; Zio, E. Ensemble-approaches for clustering health status of oil sand pumps. Expert Syst. Appl. 2012, 39, 4847–4859. [Google Scholar] [CrossRef] [Green Version]
  27. Zavadskas, E.K.; Govindan, K.; Antucheviciene, J.; Turskis, Z. Hybrid multiple criteria decision-making methods: A review of applications for sustainability issues. Econ. Res.-Ekon. Istraživanja 2015, 29, 857–887. [Google Scholar] [CrossRef] [Green Version]
  28. Doumpos, M.; Grigoroudis, E. Multicriteria Decision Aid and Artificial Intelligence: Links, Theory and Applications; Wiley-Blackwell: Hoboken, NJ, USA, 2013. [Google Scholar]
  29. Al-Barqawi, H.; Zayed, T. Infrastructure Management: Integrated AHP/ANN Model to Evaluate Municipal Water Mains’ Performance. J. Infrastruct. Syst. 2008, 14, 305–318. [Google Scholar] [CrossRef]
  30. Lerique, S.; Abitbol, J.L.; Karsai, M. Joint embedding of structure and features via graph convolutional networks. Appl. Netw. Sci. 2020, 5, 21544. [Google Scholar] [CrossRef] [Green Version]
  31. Norheim, O.F.; Abi-Rached, J.M.; Bright, L.K.; Bærøe, K.; Ferraz, O.L.; Gloppen, S.; Voorhoeve, A. Difficult trade-offs in response to COVID-19: The case for open and inclusive decision making. Nat. Med. 2021, 27, 10–13. [Google Scholar] [CrossRef]
  32. Edwards, W.; Barron, F.H. SMARTS and SMARTER: Improved Simple Methods for Multiattribute Utility Measurement. Organ. Behav. Hum. Decis. Process. 1994, 60, 306–325. [Google Scholar] [CrossRef]
  33. Kaplan, S.; Haimes, Y.Y.; Garrick, B.J. Fitting hierarchical holographic modeling into the theory of scenario structuring and a resulting refinement to the quantitative definition of risk. Risk Anal. Off. Publ. Soc. Risk Anal. 2001, 21, 807–819. [Google Scholar] [CrossRef]
  34. Comes, T.; Wijngaards, N.; Schultmann, F. Designing Distributed Multi-Criteria Decision Support Systems for Complex and Uncertain Situations. Multicriteria Decis. Aid Artif. Intell. Links Theory Appl. 2013, 47–76. [Google Scholar] [CrossRef]
  35. Kaufman, L.; Rousseeuw, P.J. Finding Groups in Data: An Introduction to Cluster Analysis; John Wiley & Sons, Inc.: Hoboken, NJ, USA, 1990. [Google Scholar]
  36. Rousseeuw, P.J. Silhouettes: A graphical aid to the interpretation and validation of cluster analysis. J. Comput. Appl. Math. 1987, 20, 53–65. [Google Scholar] [CrossRef] [Green Version]
  37. Piratla, K.R.; Jin, H.; Yazdekhasti, S. A Failure Risk-Based Culvert Renewal Prioritization Framework. Infrastructures 2019, 4, 43. [Google Scholar] [CrossRef] [Green Version]
  38. Negussey, D.; Andrews, L.; Singh, S.; Liu, C. Forensic Investigation of a Wide Culvert Reconstruction Failure. J. Pipeline Syst. Eng. Pract. 2019, 10, 5019001. [Google Scholar] [CrossRef]
  39. Polemio, M.; Lollino, P. Failure of infrastructure embankments induced by flooding and seepage: A neglected source of hazard. Nat. Hazards Earth Syst. Sci. 2011, 11, 3383–3396. [Google Scholar] [CrossRef] [Green Version]
Figure 1. Overall research framework in which the main components of the research (scope of the research, methods and sub-scopes of the research, used data) are presented. The scope of the research is to increase the rationality of risk-based maintenance planning. The infrastructure which is especially considered is a system of aging culverts. To reach this scope, two multi-criteria decision analysis (MCDA) methods are applied: the Simple Multi-Attribute Rating Technique Swing (SMARTS) and the Weighted Sum Model (WSM). Their application is integrated with a data mining technique, the cluster analysis based on the k-medoids algorithm, and it requires secondary data about culverts structural characteristics and expert opinion.
Mathematics 09 02549 g001
Figure 2. Steps required in order to develop the value tree characterizing the decision problem.
Mathematics 09 02549 g002
Figure 3. Flow chart which represents the relevant steps of the risk assessment of the culvert system. The risk assessment is based on the MCDA integrated with the cluster analysis based on the k-medoids algorithm.
Mathematics 09 02549 g003
Figure 4. Value tree characterizing the decision problem.
Mathematics 09 02549 g004
Figure 5. Value of the silhouette width for increasing number of clusters.
Mathematics 09 02549 g005
Table 1. Decomposition of the culvert system in hierarchical levels.
LevelExample
SubcomponentJoint, rake, sand trap
ComponentPipes, inlet structure, outlet structure
ObjectCulvert
WaterwaysNavigable rivers or canals
NetworkSettlements, industries, infrastructures, ecosystem
Table 2. Main failure scenarios of culverts.
Failure ScenarioCausesShort Term ConsequencesLong Term Consequences
Collapse of the barrel/headwallsOverload, damage to the conduit or to the inlet/outlet structureInstability of the surrounded soilDamage to the canal, flooding due to levee breach
Leakage out of the culvertOverload, differential settlements, damage to joints, conduit affected by cracksInstability of the surrounded soil, internal erosionDamage to the canal, flooding due to levee breach
Piping inside the culvertOverload, differential settlements, damage to joints, conduit affected by cracksInstability of the surrounded soil, internal erosionDamage to the canal, flooding due to levee breach
AffluxHydraulic capacity of the culvert, potential for blockageCross catchment flooding, instability of the surrounded soil, internal and external erosionFlooding due to afflux, flooding due to levee breach
Table 3. Main attributes defining the alternatives of the decision problem.
Risk AttributesTypesValues
Encroachment on a leveeDiscrete (Binary)Yes/no
Encroachment on a sealed canalDiscrete (Binary)Yes/no
Presence of a rakeDiscrete (Binary)Yes/no
Presence of a sand trapDiscrete (Binary)Yes/no
Drainage basinNumerical m 2
Table 4. Results of the cluster analysis based on the k-medoids algorithm.
ClusterNumber of ObjectsEncroachment on a LeveeEncroachment on a Sealed CanalPresence of a RakePresence of a Sand TrapDrainage Basin (Median— m 2 )
11yesnonoyes2.04
23yesyesnoyes0.98
37nononono4.70
44noyesnono39.03
52nonoyesno0.67
63nononono72.70
75yesyesnono4.58
82noyesnoyes3.00
96yesyesyesyes2.16
102yesyesyesno5.09
113noyesyesyes8.10
123nononoyes2.58
135nonoyesyes7.36
141yesnoyesno0.04
151yesnonono9.00
Table 5. Swing weighting of the failure scenario “Collapse of the barrel/headwalls”.
Attribute Swing LeveeSealed CanalRakeSand TrapDrainage BasinRankScoreWeight
Benchmarknonoyesyes0.040
Leveeyesnoyesyes0.0411000.385
Sealed canalno yesyes yes 0.045100.269
Rakenononoyes 0.042700.192
Sand trapnonoyes no 0.043500.115
Drainage basinnonoyes yes 72.704300.038
Total2601
Table 6. Swing weighting of the failure scenario “Leakage out of the culvert”.
Attribute Swing LeveeSealed CanalRakeSand TrapDrainage BasinRankScoreWeight
Benchmarknonoyesyes0.040
Leveeyesnoyesyes0.0411000.377
Sealed canalno yesyes yes 0.04550.264
Rakenononoyes 0.043500.189
Sand trapnonoyes no 0.044400.151
Drainage basinnonoyes yes 72.702700.019
Total2651
Table 7. Swing weighting of the failure scenario “Piping inside the culvert”.
Attribute Swing LeveeSealed CanalRakeSand TrapDrainage BasinRankScoreWeight
Benchmarknonoyesyes0.040
Leveeyesnoyesyes0.0411000.328
Sealed canalno yesyes yes 0.042900.295
Rakenononoyes 0.043600.197
Sand trapnonoyes no 0.044500.164
Drainage basinnonoyes yes 72.70550.016
Total3051
Table 8. Swing weighting of the failure scenario “Afflux”.
Attribute Swing LeveeSealed CanalRakeSand TrapDrainage BasinRankScoreWeight
Benchmarknononono0.040
Leveeyesnonono0.043800.308
Sealed canalno yesnono0.04550.019
Rakenonoyesno0.042900.346
Sand trapnononoyes0.044500.192
Drainage basinnononono72.7011000.385
Total3251
Table 9. Direct rating of the failure scenarios.
Length of the Causal ChainDetectabilityMagnitude of the ConsequencesDirect RatingWeight
FS1 Collapse of the barrel/headwallsLongMediumVery high1000.33
FS2 Leakage out of the culvertLongLowHigh750.25
FS3 Piping inside the culvertLongLowHigh750.25
FS4 AffluxShortHighMedium500.17
Table 10. Utilities obtained by applying the SMARTS method and their aggregation with the WSM.
ClusterFS1FS2FS3FS4Aggregation
Utility Rank Utility Rank Utility Rank Utility Rank Utility Rank
10.65740.57350.52570.40870.6605
20.69430.58840.82020.41960.7573
30.46990.357100.362110.020150.37710
40.56280.50080.66550.180130.5788
50.193130.153130.164140.280110.21813
60.57770.60430.377100.30880.5789
70.89210.75210.98510.281100.8951
80.312110.218110.49280.182120.34411
90.426100.40490.62360.70110.6147
100.62350.56660.78830.56020.7504
110.051140.048140.297120.48040.21214
120.273120.198120.197130.165140.24312
130.012150.027150.002150.46250.11015
140.57760.52870.49290.52330.6356
150.86020.75020.69140.28490.8082
Weight0.330.250.250.17
Publisher’s Note: MDPI stays neutral with regard to jurisdictional claims in published maps and institutional affiliations.