Abstract
The present study comprises a comparison of the Mel Frequency Cepstral Coefficients (MFCC), Principal Component Analysis (PCA) and Independent Component Analysis (ICA) as feature extraction methods using ten different regression algorithms (AdaBoost, Bayesian Ridge, Decision Tree, Elastic Net, k-NN, Linear Regression, MLP, Random Forest, Ridge Regression and Support Vector Regression) to quantify the blood glucose concentration. A total of 122 participants—healthy and diagnosed with type 2 diabetes—were invited to be part of this study. The entire set of participants was divided into two partitions: a training subset of 72 participants, which was intended for model selection, and a validation subset comprising the remaining 50 participants, to test the selected model. A 3D-printed chamber for providing a light-controlled environment and a low-cost microcontroller unit were used to acquire optical measurements. The MFCC, PCA and ICA were calculated by an open-hardware computing platform. The glucose levels estimated by the system were compared to actual glucose concentrations measured by venipuncture in a laboratory test, using the mean absolute error, the mean absolute percentage error and the Clarke error grid for this purpose. The best results were obtained for MCCF with AdaBoost and Random Forest (MAE = 11.6 for both).
  1. Introduction
Diabetes is the most probable cause of one in ten deaths in people 20–59 years, and it is catalogued as a national emergency in Mexico, according to the World Health Organization (WHO) [,]. Diabetes is a metabolic disorder in which the body is not capable of regulating blood glucose levels. Insulin is a hormone that is essential in the regulation of glucose concentration in the blood and how the body uses it for converting glucose into energy. This disease can be identified as two main types: type 1 diabetes (T1D) takes place when the pancreas barely produces a limited amount of insulin, and even sometimes it is incapable of producing any insulin. On the other hand, type 2 diabetes (T2D) comes about when the body cannot effectively use the insulin it produces [,,].
The adverse effects of diabetes in health have been demonstrated, and to mention only a few it could lead to cardiovascular diseases, since people with T2D are at high mortality risk of cardiovascular illnesses such as coronary heart disease or heart failure [,]; diabetes-associated cognitive decline and dementia []; kidney alterations []; vision impairment in the form of diabetic retinopathy []; among others [,,]. Recently, diabetes has been significantly associated with mortality from COVID-19 and also with duplicating the risk of developing more severe COVID-19, as compared to non-diabetics [,,].
Blood glucose measurements can be performed by methods such as the glycated haemoglobin A1c (HbA1c) test or commercial glucometers for self-monitoring; however, the HbA1c laboratory test is considered the gold standard []. Both methods, the HbA1c test and glucometers, are invasive, i.e., they need to collect a blood sample by venipuncture or a pinprick, respectively, to carry out the process []. This precondition produces distress and discomfort in patients, thus hindering the proper accomplishment of monitoring for disease control and treatment. Although there are rapid tests as alternative methods other than venipuncture for monitoring, they also require a pinprick to collect a blood sample from the finger of patients—a situation that urges the experimental development of non-invasive sensors and systems for blood glucose estimation. To alleviate this predicament, minimally invasive glucometers (MIGs) have emerged as an alternative. Nowadays, some MIGs are commercially available, such as the Gluco Track (Integrity Applications Ltd., Ashdod, Israel), which uses the earlobe as the medium for measuring glucose by applying thermal and ultrasonic technology, with the inconvenience that it needs individual calibration [], and the FreeStyle Libre (Abbott Diabetes Care, Inc. Alameda, USA) designed to estimate glycemia in adults []. Some other MIGs remain in progress, e.g., the SugarBEAT (Nemaura Medical Inc., Loughborough, UK) that employs its own transmitter device synchronized to a disposable patch attached to the user’s skin, the GlucoWise (MedWise Ltd., London, UK), which makes use of power radio waves transmitted through the earlobe [], or smart contact lenses (Google, LLC., Mountain View, USA) using tear fluid for measuring the glucose concentration [].
Previously reported studies are commonly based on optical and spectroscopy technologies due to their ease and ability to analyze samples without the need of any prior manipulation [,]. Some of the preferred techniques for developing new MIGs investigated in the state-of-the-art employ near and mid-infrared spectroscopy [,,,,,], Raman spectroscopy [,], and infra-red spectroscopy based on Fourier transform []. Additionally, photoplethysmography (PPG) in the mid-infrared and first overtone regions of glucose absorbance [,,] has been widely used for non-invasive glucose measurements, but suffers from drawbacks such as the high cost of the light sources, scattering due to fatty tissue, strong absorption due to water, and the high cost of the experimental setup. Most of the aforementioned studies use high-priced laboratory equipment or software that needs specialized personnel, hindering the development of reliable devices at an affordable price.
Besides signal acquisition techniques, feature extraction methods play an important role. Principal component analysis (PCA) and independent component analysis (ICA) are among the most widely used methods. In the speech recognition area, the Mel frequency cepstral coefficients (MFCC) method is one of the most important. These techniques are typically used to reduce the dimensionality of data before processing them by a pattern recognition algorithm. Numerous studies have reported good performances when using these algorithms, e.g., for EEG, ECG and biomedical applications [,,,]; nevertheless, only a few have addressed the MFCC [,] for glucose monitoring purposes, but PCA and ICA have not been investigated yet.
The aim of this work is to compare the performance of PCA, ICA and MFCC as feature extraction methods in a range of different regression algorithms (AdaBoost, Bayesian Ridge, Decision Tree, KNN, MLP, SVR, Random Forest, Ridge, Elastic Net, Linear Regression) included in the scikit-learn library for the Python programming language. The dataset intended for this purpose was acquired using a cost-effective setup. After the regression comparison, all algorithms were trained and applied to the external validation test with the aim to explore their performance for the further development of a daily-use device.
2. Materials and Methods
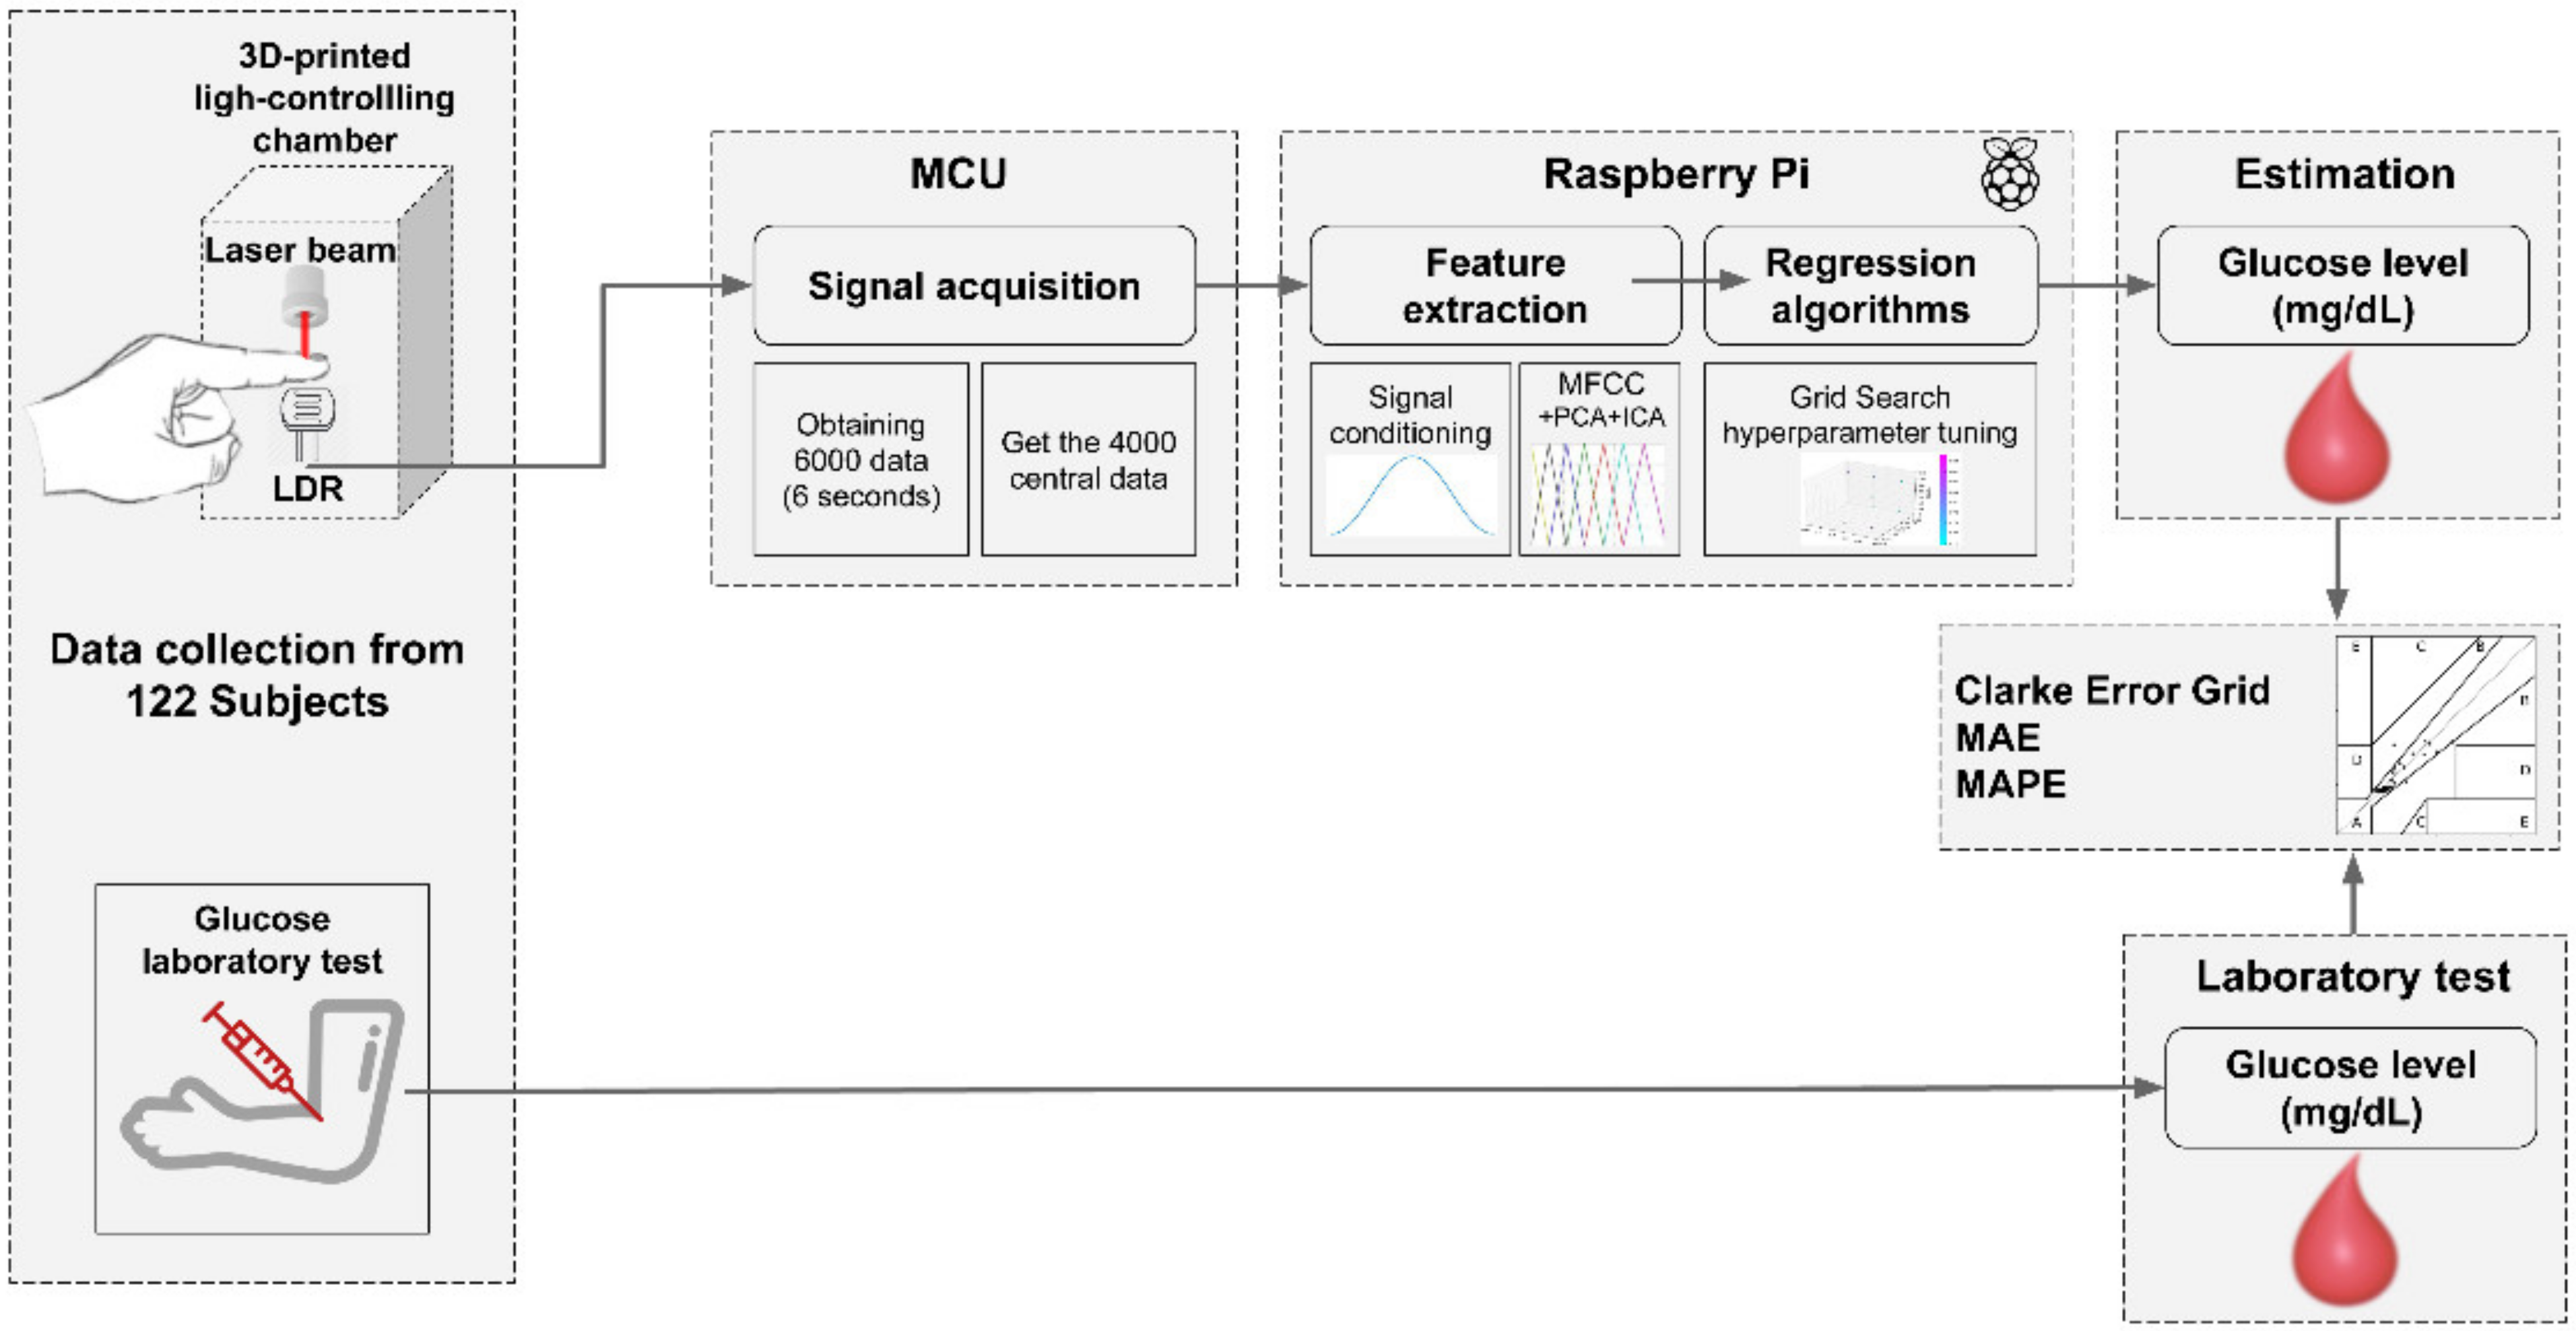
The present work encompasses a non-invasive methodology for estimating the blood glucose concentration by analyzing the light absorption response of a finger when a beam of light is pointed on it. To this end, a laser beam is directed to the fingertip of the user while an LDR (light dependent resistor) sensor captures the transmitted light across the finger. The working principle of the proposal is the Beer–Lambert law, which provides a formulation for calculating how much of a material is present in a sample by obtaining the response of its light absorbance. In other words, the quantity of a material present in a sample is proportional to its light absorption and, consequently, the intensity of transmitted light will decrease while the concentration of the material in a medium increases []. Although related past works utilize a variety of body tissues—such as forearm, earlobe or cheek—for measuring light absorbance, we selected the fingertip to take advantage of its high capillary concentration []. Furthermore, similar to some of the related works [,,,,,,], we hypothesized that variations in transmitted light may correspond to variations in glucose concentration in the blood. The glucose levels estimated by the system were compared to actual glucose concentrations measured by venipuncture in a laboratory test, using the mean absolute error, the mean absolute percentage error and the Clarke error grid for this purpose. A block diagram of the proposal is depicted in Figure 1.
      
    
    Figure 1.
      Overview of the proposed system.
  
2.1. Participants
A total of 122 participants—healthy and diagnosed with type 2 diabetes (T2D)—averaging 36.7 ± 14.2 years, within a range of 21–76 years, were invited to be part of this study. All procedures in this study were performed in accordance with the provisions of the Declaration of Helsinki. All participants signed an informed consent form and are aware of the research objectives. Participants with a range of different skin tones were preferentially selected for capturing the common variations in the sample, thus making the dataset representative of our region.
The entire set of participants was divided into two partitions. The first, a training subset of 72 participants (~60%), was intended for model selection, whereas the second validation subset comprised the remaining 50 participants (~40%) and was intended to test the selected model with unknown data. Further details of the participants are described in Table 1. There, the average ± the standard deviation and the (min, max) range regarding the age and glucose concentration of participants are described. The percentages of female and male participants and for those diagnosed with T2D are also reported.
       
    
    Table 1.
    Details of the participants per subset.
  
2.2. Data Collection
The system implementation considers a primary stage for data collection. In order to collect the data, a 650 nm wavelength laser beam was pointed to the user’s fingertip. An LDR sensor, placed below the finger, was in charge of measuring the light that can be transmitted through the finger. Because LDR is highly sensitive to light changes, both components, the laser and the LDR, were enclosed in a 3D-printed chamber to provide a light-controlled environment. A low-cost microcontroller unit (MCU) was in charge of measuring the LDR signal. Data acquisition was performed with an MCU using a 1 kHz sampling frequency for a lapse of 6 s, thus obtaining 6000 different values arranged in a vector. Nevertheless, some variations in data collection can be induced by the effect of placing the finger in and out of the sensor; for this reason, we only considered the 4000 values in the middle and discarded the 1000 initial and final positions of the vector. This signal was transmitted to a Raspberry Pi (RPi) board, responsible for the feature extraction and regression procedure for glucose estimation.
2.3. Feature Extraction
Feature extraction techniques are intended for transforming a complex signal to representative variables to be used by prediction algorithms. In this manuscript, three methods for performing feature extraction were addressed: Mel frequency cepstral coefficients (MFCC) [], principal components analysis (PCA) [] and independent component analysis (ICA) []. Prior to applying the feature extraction algorithms, signal data were filtered using a Hamming window of size 40.
The MFCC method is one of the most used feature extraction techniques, commonly applied in acoustics and speech recognition []. In this method, the signal is divided into overlapped frames of n data. A fast Fourier transform (FFT) is applied to each of those frames, resulting in a signal representation in the frequency domain. The resulting signal spectrum is filtered by the Mel filter banks. Finally, the cepstral coefficients are calculated by computing the inverse discrete cosine transform (DCT) on logarithmic values of Mel filters. The MFCC function included in the python_speech_features library’s outcomes are the thirteen first coefficients of the inverse DCT, which stands for the MFCC.
PCA is commonly used as an exploratory tool for data analysis; it is a decomposition technique that employs singular value decomposition (SVD) with the aim to project data into a lower dimensional space. The principal components represent the orthogonal projections for which the variance of data is maximum, that is, the directions in the feature space along which the original data are highly variable [].
The ICA algorithm is typically applied in signal processing for separating superimposed signals rather than for dimensionality reduction. It is supposed to find the projections that decompose a multivariate signal into sources that are statistically independent [].
For both PCA and ICA, the first three components were selected.
2.4. Regression Models
For this study, ten regression models were fit and tested. In order to obtain an enhanced result, a grid search for hyperparameter tuning was performed on the training subset using a 5-fold cross-validation scheme for each algorithm; parameters yielding the least MAE were taken into consideration. All regression algorithms were implemented with the Python programming language using the scikit-learn library. Below, a description of the regression models is presented.
2.4.1. AdaBoost
AdaBoost regressor is one of the most used boosting algorithms. It is a method that combines a number of weak algorithms, fitting them on the training data by adjusting the weights of corresponding instances according to the measured output errors. This process is repeatedly performed until a predefined error condition is met [].
2.4.2. Bayesian Ridge
This estimates a probabilistic regression model in which the priors for the parameters are given by a spherical Gaussian. This model may include regularization parameters in the estimation procedure and is performed iteratively by trying to maximize the log-likelihood of the instances [].
2.4.3. Decision Tree
A decision tree is boosted by fitting n + 1 decision trees on a dataset with a small amount of Gaussian noise. The results obtained by the n boosts, i.e., the decision trees, are each compared with a single decision tree regressor. As the number of boosts increases, the regressor is capable of including more details in the model [].
2.4.4. Elastic Net
This model consists of a linear regression that intuitively includes an L1 and L2 regularization while fitting the coefficients to training data. Due to parameter regularization, the elastic net stands as a sparse model, which in turn is truly convenient when correlated features are present in the data [,].
2.4.5. k-Nearest Neighbors Regressor (k-NNr)
This is an instance-based and well-known model in the state-of-the-art. It works by performing two main procedures: first, obtaining a similarity function (commonly Euclidean distance) between the training dataset and the instance we want to predict; then, averaging the output of the k closest observations to give the prediction value. The parameter k is of great importance since its election may yield high error rates if it is a very large value, and overfitting when a lower k value is selected [].
2.4.6. Linear Regression
This constitutes the simplest regression model, and it is also one of the preferred regression techniques due to its capability for capturing data behavior and its ease of implementation. In the present study, an Ordinary Least Squares (OLS) linear regression was implemented using the gradient descent method for error minimization and a mean squared error as a cost function [].
2.4.7. Multilayer Perceptron Regressor (MLPr)
This type of neural network employs the backpropagation learning algorithm for training a multi-layer perceptron (MLP). Different from the traditional classification MLP, this implementation uses a linear activation function for giving a set of continuous values as an output [].
2.4.8. Random Forest
This model fits a variety of decision trees considering random subsamples with replacement from the dataset in such a way that subsamples are always the same size as the original input. After that, it averages the results for overfitting control and helping to reduce the predictive error [].
2.4.9. Ridge Regression
This model is similar to LASSO due to the fact that both are based on OLS linear regression and support multivariate regression. However, this very model overcomes some problems by using a coefficient regularization penalty given by the L2-norm. As a result, ridge coefficients are prone to minimizing the residual sum of squares for model construction [,].
2.4.10. Support Vector Regression (SVR)
This algorithm comes from the statistical learning theory. In its simplest way, it employs a linear kernel for delivering the regression values and a loss parameter denoting the maximum permitted error of predictions in contrast to reference output values. It also can be extended for non-linear predictions by using a kernel trick in which data are mapped to a higher-dimensional space [,].
2.5. Algorithm Performance
Regression analysis was performed for model selection. With the aim to measure the performance of the algorithms, the experiments were run considering the following aspects:
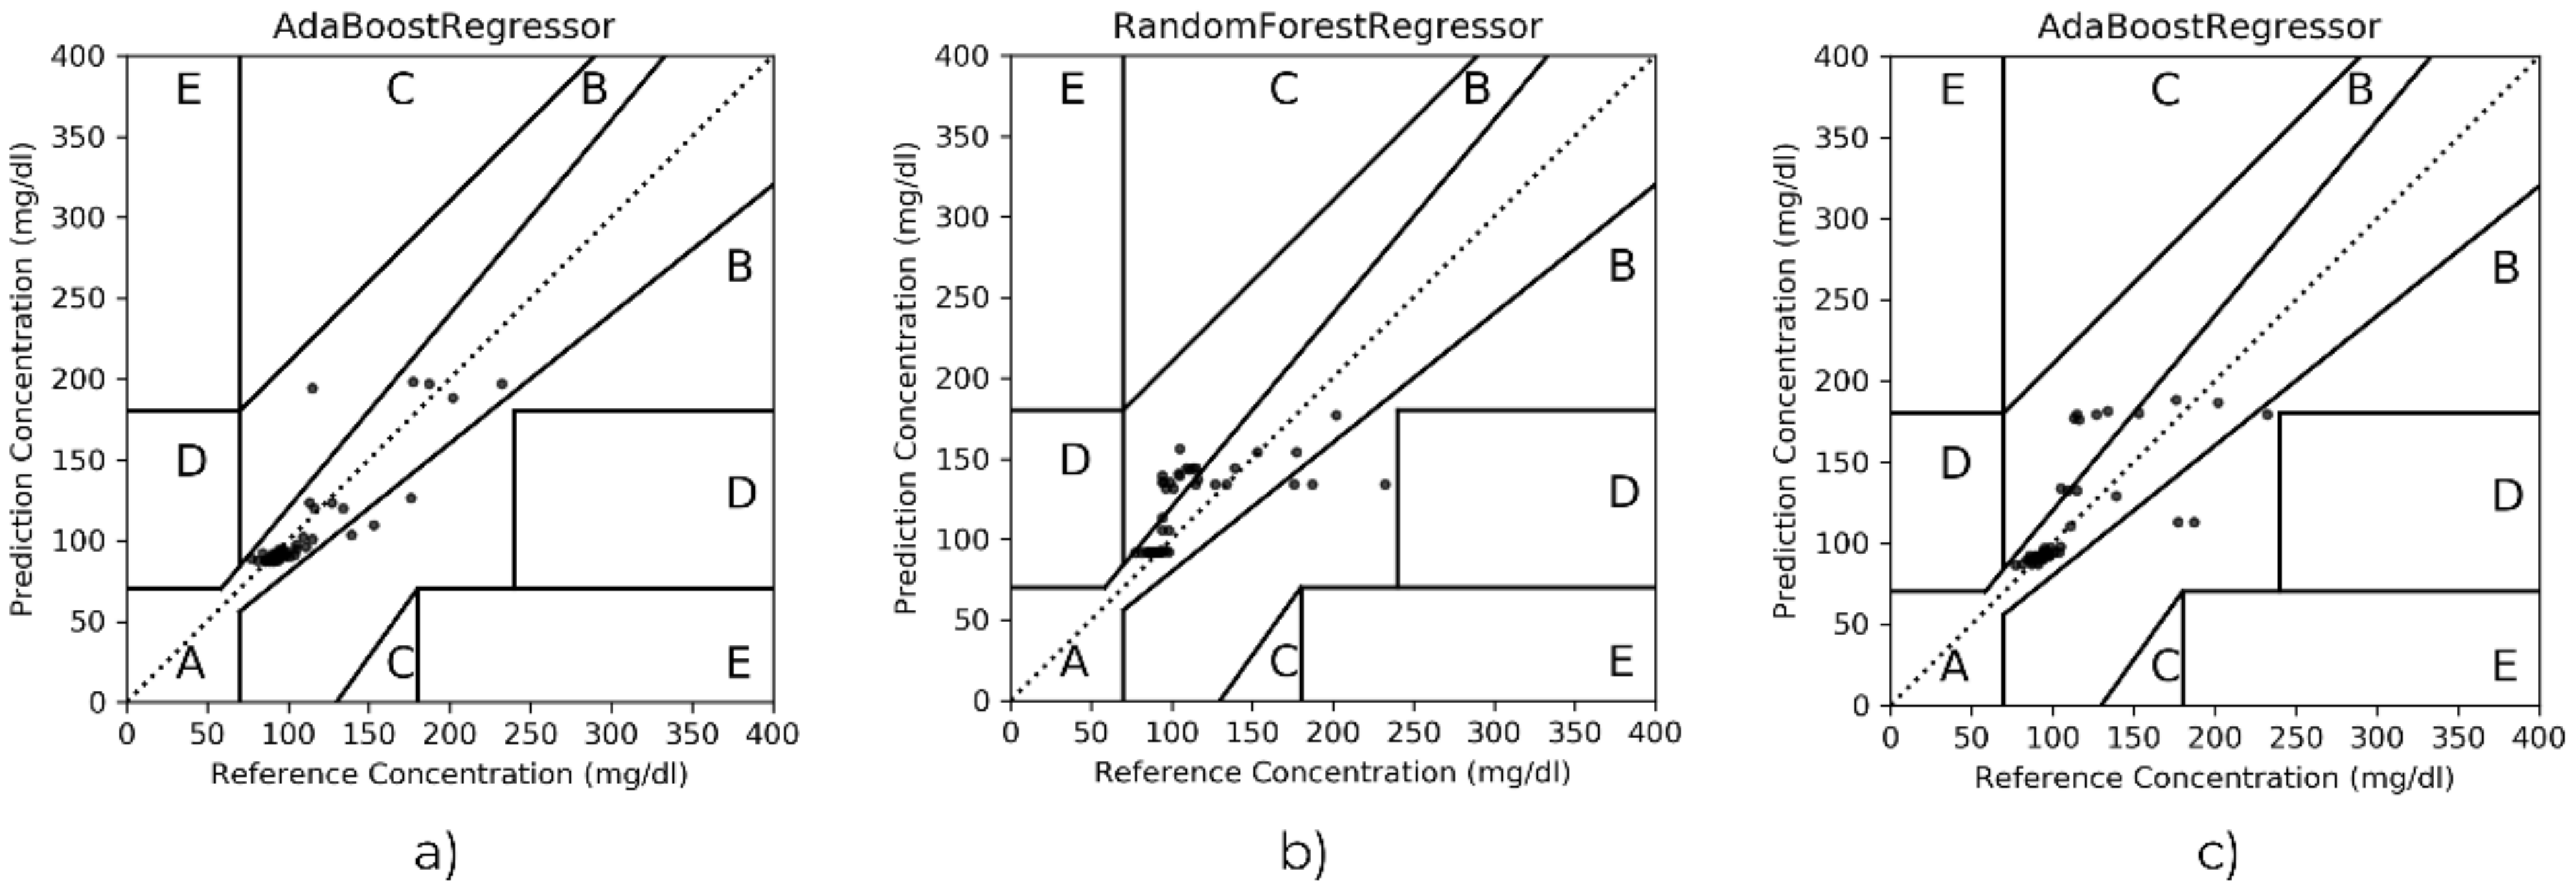
- Evaluation metrics. The mean absolute error (MAE), mean absolute percentage error (MAPE) and the Clarke error grid were considered. MAE, computed as in Equation (1), constitutes the average difference between the estimated values vs. the lab test; in addition, MAPE represents the same difference but expressed in percentage (see Equation (2)). The Clarke error grid is a graph divided into five zones, for which the success of the results depends on where the reference glucose values versus the algorithm outcomes are plotted. That is, zones A and B stand for accurate or acceptable estimation, zone C is commonly associated with unnecessary treatments, but zones D and E are representative of potentially dangerous mistreatment caused by confusing hyperglycemia and hypoglycemia.
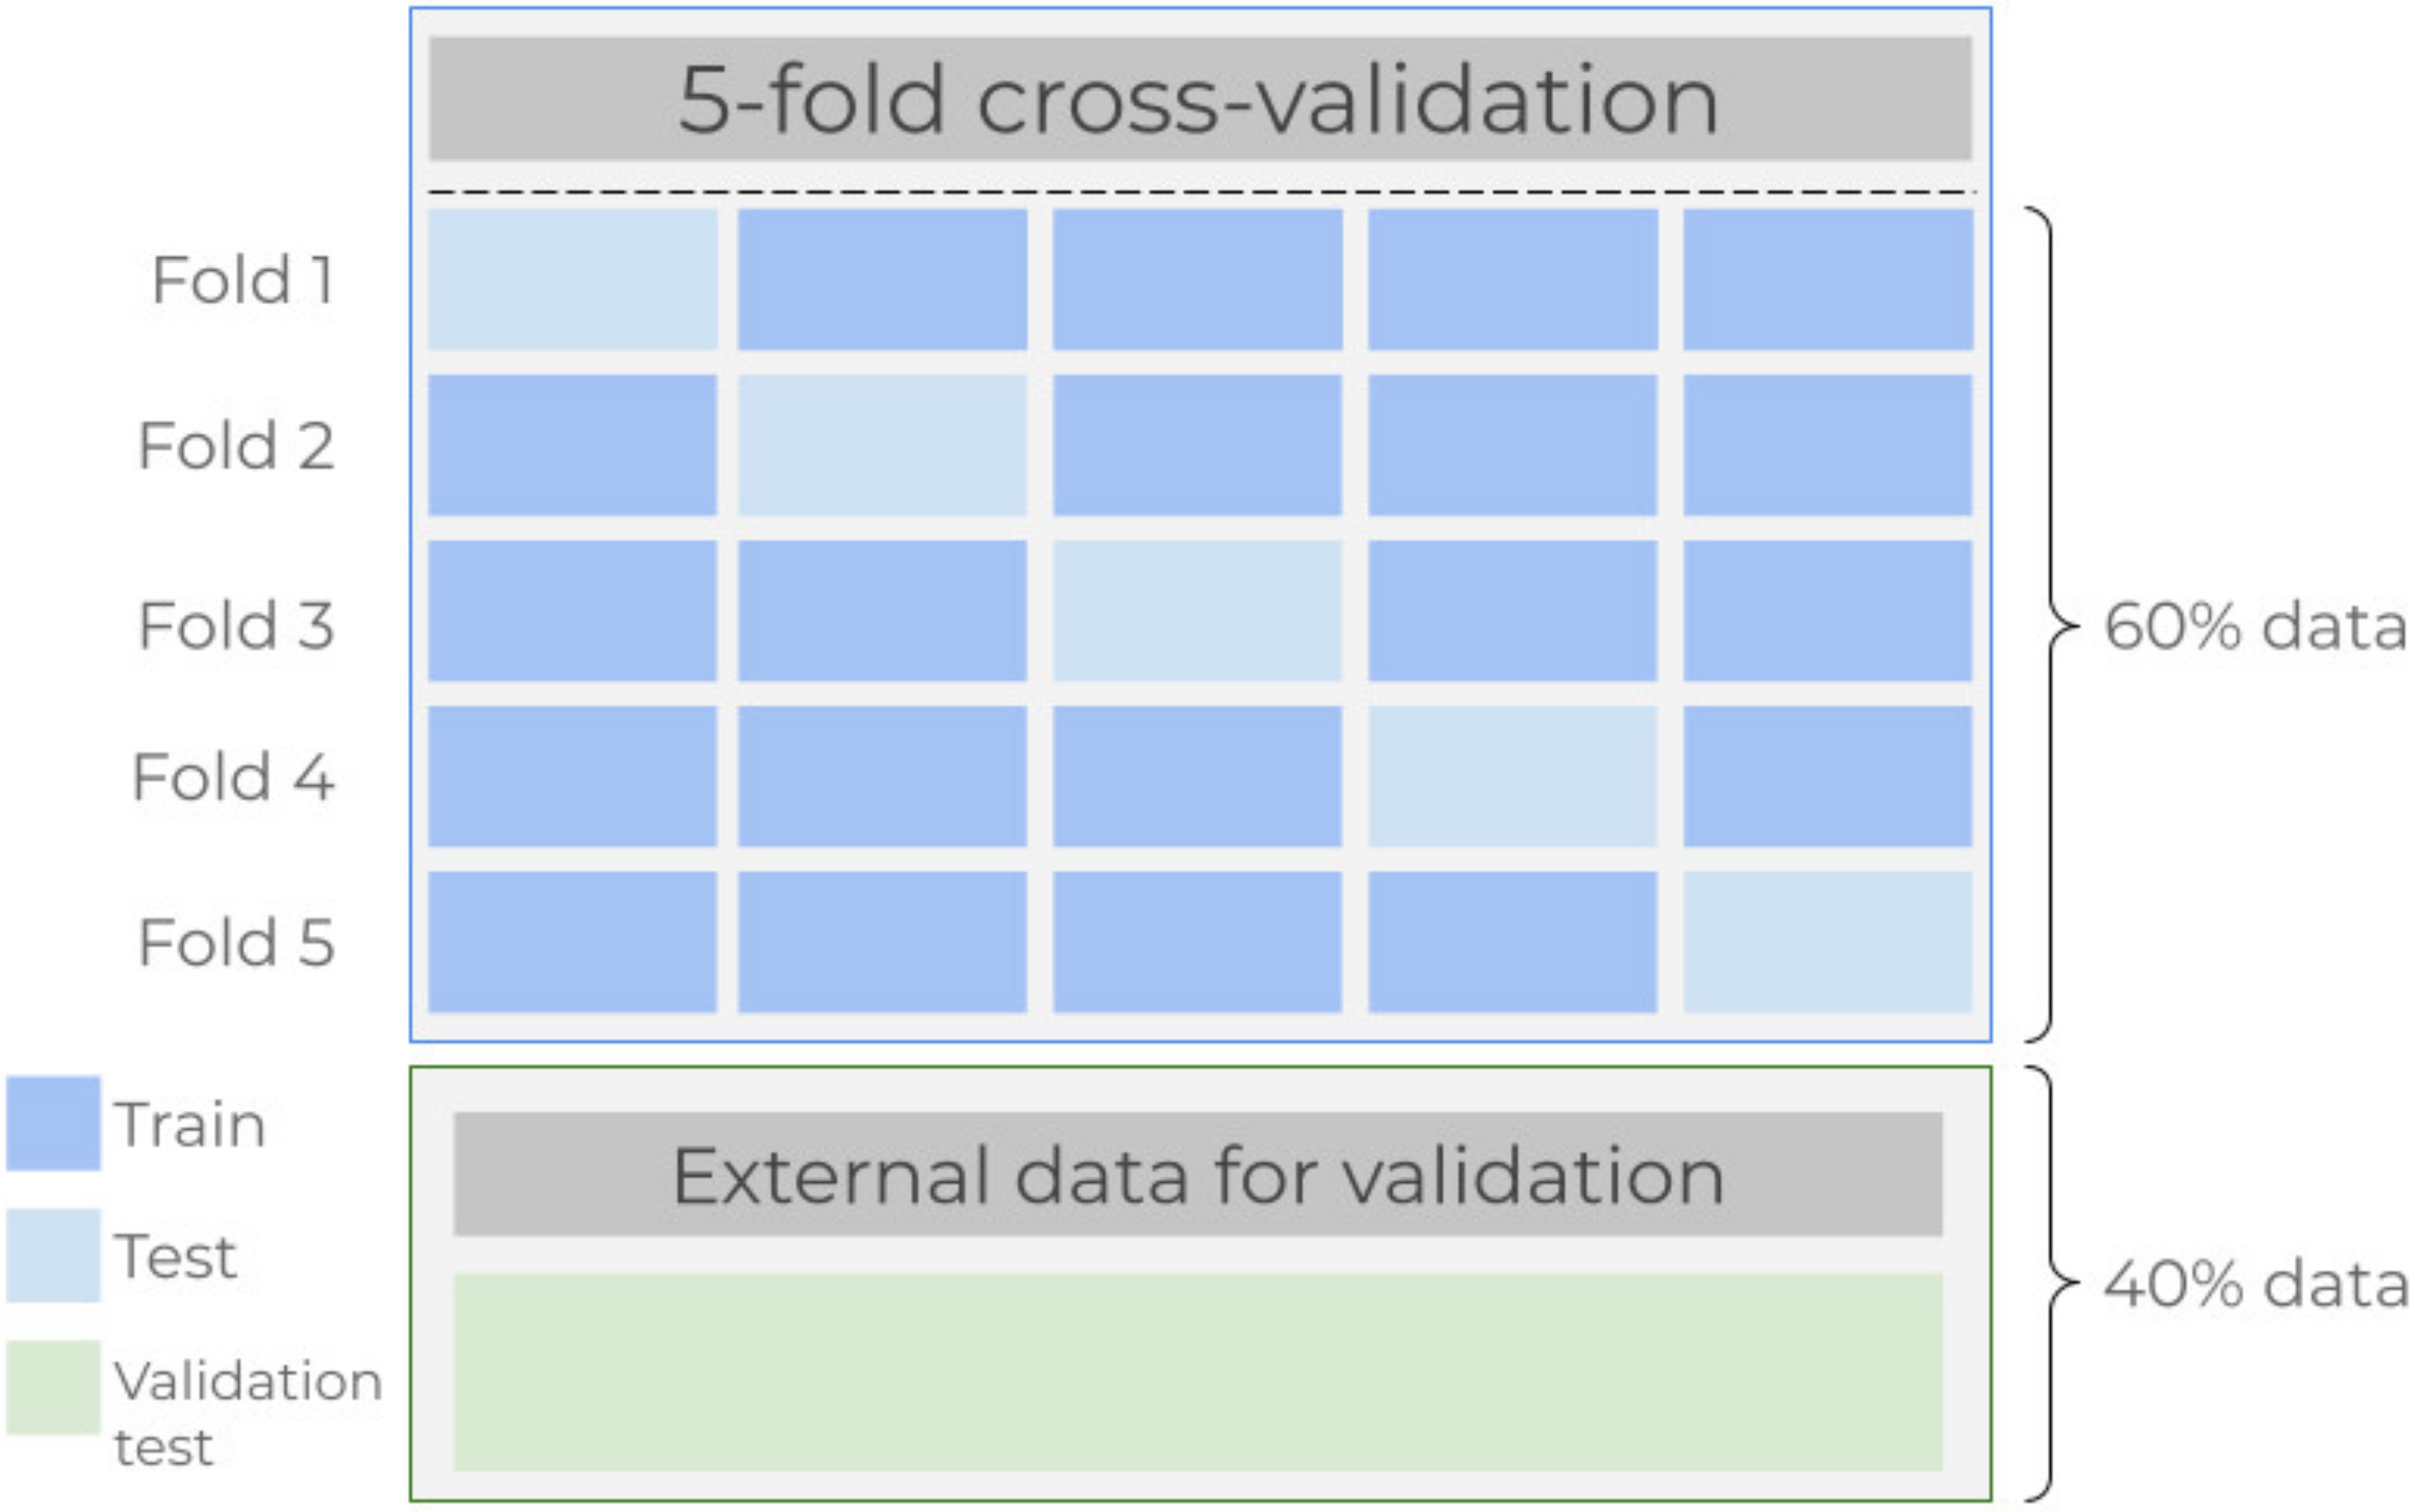
 - Cross-validation. Data from all participants were divided into two mutually exclusive partitions. Here, the k-fold cross-validation model was applied onto 60% of the data, and the remaining 40% were intended for testing the model once the algorithms were fitted. In this study, the five-fold cross-validation scheme was preferred. First, data are divided into five subsets, commonly referred to as folds, and repeatedly perform a procedure for which at the i-th step the corresponding i-th fold is taken as a test subset while the remaining four folds are used to train the regressor []. This paragraph is graphically outlined in Figure 2.


    Figure 2.
      Data partitioning for cross-validation and external validation set.
  
3. Results
As mentioned before, all the regression algorithms used 5-fold cross-validation for hyperparameter grid searching for model selection, and its outcomes are presented in Table 2.
       
    
    Table 2.
    Selected parameters by grid search.
  
The results of the grid search process are depicted in Figure 3. The selected parameters were taken into consideration for fitting the regression algorithms on the training subset. Intuitively, the behavior of the algorithms was measured on the validation subset. As explained above, the performance metrics used in this study were the mean absolute error (MAE), the mean absolute percentage error (MAPE) and the Clarke error grid.
      
    
    Figure 3.
      Results obtained after grid search for model selection. Values of mean absolute error (a) and mean absolute percentage error (b) are reported.
  
As previously mentioned, three feature extraction procedures were tested. The first experiment consisted of fitting the models using the dataset built by computing the MFCC from the acquired signal; the total 13 MFCC were taken. The second and third experiments comprised the calculation of the PCA and ICA from the Hamming-filtered signals. For both PCA and ICA, the first three components were considered for feature construction. The performance results of MAE, MAPE and the Clarke error grid regions over the MFCC, PCA and ICA can be consulted on Table 3, Table 4 and Table 5, respectively. Figure 4 graphically shows the relationship of the glucose concentration obtained with the algorithm, in comparison with the glucose values obtained by the gold standard laboratory test, by means of the Clarke error grid. The results shown there correspond to the best performance obtained for each feature extraction technique: (a) MFCC, (b) PCA and (c) ICA. The results of the Clarke error grid graphics for all regression algorithms, using the referred feature extractors, are included in the Supplementary Materials, respectively.
       
    
    Table 3.
    Results on the test subset using the MFCC features.


    Table 4.
    Results on the test subset using the first three components of PCA feature extraction.


    Table 5.
    Results on the test subset using the first three components of ICA feature extraction.


    Figure 4.
      Clarke error grid results using (a) MFCC, (b) PCA and (c) ICA feature extraction methods.
  
Overall, the best scores reflected a MAE of 11.62, 13.98 and 16.73, obtained by the AdaBoost for the MFCC, the Random Forest for PCA and k-Nearest Neighbors when using ICA, respectively. Similarly, the best achieved MAPE was 10.21 and 10.42 for Random Forest with MFCC and PCA; with ICA, 12.87 was the best MAPE, found by k-Nearest Neighbors.
It is worth mentioning that PCA and ICA seem to privilege those regressors built upon a linear regression, such as Bayesian Ridge, Elastic Net, Ridge Regression and Linear Regression itself. However, the MFCC extractor seems to perform on the contrary, and the linear regressors seem to be penalized. This behavior is reflected on the regions of the Clarke error grid in which AdaBoost and Random Forest achieved more than 90% of points in region A. Regarding PCA, AdaBoost, Random Forest and SVR have the best results, obtaining more than the 80% in region A. The best regressors using ICA, similar to what happens with PCA, were only AdaBoost and SVR, both with 82% of the points in the same region A.
Despite the fact that the family of linear regressors obtained reasonable MAE and MAPE results in PCA, note that their results regarding the Clarke error grid are not the best. They obtained 59–41% in regions A and B for Bayesian Ridge, Elastic Net and Linear Regression in PCA.
4. Discussion
The results presented in this study showed clinically acceptable prediction errors as established by Clarke grid analysis and regarding MAE and MAPE metrics, but also, they are competitive in comparison to previous related works. The authors in [] acquired a long photoplethysmography signal and divided it to generate a larger number of samples. They extracted the MFCC and used them as input vectors for classification algorithms obtaining up to 90% of qualitative analysis, i.e., they identified subjects for hypoglycemia and normal or high glucose concentrations rather than obtaining the glucose concentration value; they also reported a correlation value of 0.88 in the Clarke error grid. With respect to [], the authors took a picture of the subject’s fingertip, and after processing the image they calculated descriptors that were the input values for fitting an ordinary least squares linear regression. The predicted values were then compared with two reference tests: a commercial glucometer and a standard laboratory test, reporting root mean squared errors of 15.94 and 9.81, respectively. Similarly, the authors from [] presented a sophisticated device that incorporates different sensors for data acquisition such as an image sensor as well as diverse monochromatic light sources in the range from blue to infrared, and even a conventional invasive glucometer module. They reported results of MAPE values of 11.2%, 11.6% and 12.7% after conducting experiments in comparison to three commercial glucometers of different brands.
One of the main goals of our proposal is to provide a simple and effective way to monitor blood glucose concentration non-invasively. The main differences in relation to state-of-the-art works are that some involve the use of complex hardware systems, whereas in some others, the reported results do not provide an estimated glucose concentration value, offering a qualitative evaluation instead.
5. Conclusions
The potential use and comparison of the MFCC, ICA and PCA algorithms as feature extractors have been explored in this work. Here, each of them was applied along with ten well-known regression models in order to estimate the glucose concentration in blood in a non-invasive way. The obtained results and the experimental low-cost setup for data acquisition raise the idea of continuing the development of more affordable devices for glycemia monitoring.
Although the MFCC method has been applied in a range of diverse healthcare applications before, its use as a feature extractor in the estimation of blood glucose concentration had not been reported until now.
The present study constitutes a baseline for the exploration of different sensors with regard to the MFCC features towards the non-invasive estimation of blood glucose concentration. After analyzing the obtained results with the light-dependent resistor used here, we can hypothesize that the use of different kinds of sensors, such as photoplethysmography, could be one of the future directions for exploring the MFCC method as a feature extractor due to its inherent way of obtaining a variety of frequencies. Despite the existence of diversity in the skin color of participants, this topic was not considered for this study; nevertheless, it would be of paramount interest to be included in future research with a larger sample of subjects.
Supplementary Materials
The following are available online at https://www.mdpi.com/article/10.3390/math9202529/s1, Figures S1–S3: The results of the Clarke error grid graphics for all regression algorithms, using the feature extraction technique: (a) MFCC, (b) PCA and (c) ICA.
Author Contributions
Conceptualization, G.A.A.-S., I.P.G.-G. and A.A.-P.; Data curation, V.F.-G. and I.P.G.-G.; Formal analysis, E.V.-M. and G.A.A.-S.; Investigation, V.F.-G., I.P.G.-G. and A.A.-P.; Methodology, E.V.-M., A.A.-P. and G.A.A.-S.; Software, E.V.-M. and V.F.-G.; Validation, G.A.A.-S., I.P.G.-G. and A.A.-P.; Writing—original draft, G.A.A.-S. and A.A.-P.; Writing—review and editing, V.F.-G., I.P.G.-G. and E.V.-M. All authors have read and agreed to the published version of the manuscript.
Funding
This research received no external funding.
Institutional Review Board Statement
The study was conducted according to the guidelines of the Declaration of Helsinki, and approved by the Ethics Committee of Universidad Autónoma de Guerrero.
Informed Consent Statement
Informed consent was obtained from all subjects involved in the study.
Data Availability Statement
The data presented in this study can be available on request from the authors.
Acknowledgments
The authors want to acknowledge the participation of all subjects in this project. We also are grateful for all the laboratory personnel and technicians for their outstanding support during this study.
Conflicts of Interest
The authors declare no conflict of interest.
References
- Guariguata, L.; Whiting, D.; Weil, C.; Unwin, N. The International Diabetes Federation diabetes atlas methodology for estimating global and national prevalence of diabetes in adults. Diabetes Res. Clin. Pract. 2011, 94, 322–332. [Google Scholar] [CrossRef] [PubMed]
 - Atlas, D. Five questions on the IDF Diabetes Atlas. Diabetes Res. Clin. Pract. 2013, 102, 147–148. [Google Scholar] [CrossRef]
 - World Health Organization. Diabetes Factsheets; World Health Organization: Geneva, Switzerland, 2018. [Google Scholar]
 - Ramasahayam, S.; Koppuravuri, S.H.; Arora, L.; Chowdhury, S.R. Noninvasive blood glucose sensing using near infra-red spectroscopy and artificial neural networks based on inverse delayed function model of neuron. J. Med. Syst. 2015, 39, 166. [Google Scholar] [CrossRef] [PubMed]
 - Glovaci, D.; Fan, W.; Wong, N.D. Epidemiology of diabetes mellitus and cardiovascular disease. Curr. Cardiol. Rep. 2019, 21, 1–8. [Google Scholar] [CrossRef]
 - Henning, R.J. Type-2 diabetes mellitus and cardiovascular disease. Future Cardiol. 2018, 14, 491–509. [Google Scholar] [CrossRef]
 - Biessels, G.J.; Despa, F. Cognitive decline and dementia in diabetes mellitus: Mechanisms and clinical implications. Nat. Rev. Endocrinol. 2018, 14, 591–604. [Google Scholar] [CrossRef]
 - Zhang, X.-X.; Kong, J.; Yun, K. Prevalence of diabetic nephropathy among patients with type 2 diabetes mellitus in China: A meta-analysis of observational studies. J. Diabetes Res. 2020, 2020, 2315607. [Google Scholar] [CrossRef] [Green Version]
 - Lawrenson, J.G.; Bourmpaki, E.; Bunce, C.; Stratton, I.M.; Gardner, P.; Anderson, J.; EROS Study Group. Trends in diabetic retinopathy screening attendance and associations with vision impairment attributable to diabetes in a large nationwide cohort. Diabet. Med. 2021, 38, e14425. [Google Scholar] [CrossRef]
 - Goyal, A.; Gupta, Y.; Singla, R.; Kalra, S.; Tandon, N. American Diabetes Association Standards of Medical Care—2020 for Gestational Diabetes Mellitus: A Critical Appraisal. Diabetes Ther. 2020, 11, 1639–1644. [Google Scholar] [CrossRef] [PubMed]
 - Vibha, S.P.; Kulkarni, M.M.; Ballala, A.B.K.; Kamath, A.; Maiya, G.A. Community based study to assess the prevalence of diabetic foot syndrome and associated risk factors among people with diabetes mellitus. BMC Endocr. Disord. 2018, 18, 43. [Google Scholar] [CrossRef]
 - De Freitas, G.R.; Ferraz, G.A.M.; Gehlen, M.; Skare, T.L. Dry eyes in patients with diabetes mellitus. Prim. Care Diabetes 2021, 15, 184–186. [Google Scholar] [CrossRef]
 - John, T.M.; Jacob, C.N.; Kontoyiannis, D.P. When uncontrolled diabetes mellitus and severe COVID-19 converge: The perfect storm for mucormycosis. J. Fungi 2021, 7, 298. [Google Scholar] [CrossRef]
 - Kumar, A.; Arora, A.; Sharma, P.; Anikhindi, S.A.; Bansal, N.; Singla, V.; Khare, S.; Srivastava, A. Is diabetes mellitus associated with mortality and severity of COVID-19? A meta-analysis. Diabetes Metab. Syndr. Clin. Res. Rev. 2020, 14, 535–545. [Google Scholar] [CrossRef] [PubMed]
 - Pal, R.; Bhadada, S.K. COVID-19 and diabetes mellitus: An unholy interaction of two pandemics. Diabetes Metab. Syndr. Clin. Res. Rev. 2020, 14, 513–517. [Google Scholar] [CrossRef] [PubMed]
 - Gribovschi, M. The methodology of glucose monitoring in type 2 diabetes mellitus. Clujul Med. 2013, 86, 93. [Google Scholar] [PubMed]
 - Clark, V.L.; Kruse, J.A. Clinical methods: The history, physical, and laboratory examinations. Jama 1990, 264, 2808–2809. [Google Scholar]
 - Lin, T.; Gal, A.; Mayzel, Y.; Horman, K.; Bahartan, K. Non-invasive glucose monitoring: A review of challenges and recent advances. Curr. Trends Biomed. Eng. Biosci. 2017, 6, 1–8. [Google Scholar] [CrossRef]
 - Talib, A.J.; Alkahtani, M.; Jiang, L.; Alghannam, F.; Brick, R.; Gomes, C.L.; Scully, M.O.; Sokolov, A.V.; Hemmer, P.R. Lanthanide ions doped in vanadium oxide for sensitive optical glucose detection. Opt. Mater. Express 2018, 8, 3277–3287. [Google Scholar] [CrossRef] [Green Version]
 - Blum, Z.; Pankratov, D.; Shleev, S. Powering electronic contact lenses: Current achievements, challenges, and perspectives. Expert Rev. Ophthalmol. 2014, 9, 269–273. [Google Scholar] [CrossRef] [Green Version]
 - So, C.-F.; Choi, K.-S.; Wong, T.K.S.; Chung, J.W.Y. Recent advances in noninvasive glucose monitoring. Med. Devices 2012, 5, 45. [Google Scholar] [CrossRef] [Green Version]
 - Shao, J.; Lin, M.; Li, Y.; Li, X.; Liu, J.; Liang, J.; Yao, H. In vivo blood glucose quantification using Raman spectroscopy. PLoS ONE 2012, 7, e48127. [Google Scholar] [CrossRef] [Green Version]
 - Tura, A.; Sbrignadello, S.; Cianciavicchia, D.; Pacini, G.; Ravazzani, P. A low frequency electromagnetic sensor for indirect measurement of glucose concentration: In vitro experiments in different conductive solutions. Sensors 2010, 10, 5346–5358. [Google Scholar] [CrossRef] [PubMed]
 - Chen, T.-L.; Lo, Y.-L.; Liao, C.-C.; Phan, Q.-H. Noninvasive measurement of glucose concentration on human fingertip by optical coherence tomography. J. Biomed. Opt. 2018, 23, 47001. [Google Scholar] [CrossRef] [PubMed] [Green Version]
 - Bakker, A.; Smith, B.; Ainslie, P.; Smith, K. Near-Infrared Spectroscopy, Applied Aspects of Ultrasonography in Humans; IntechOpen: London, UK, 2012; ISBN 978-953-51-0522-0. [Google Scholar] [CrossRef] [Green Version]
 - Yatim, N.N.M.; Zain, Z.M.; Jaafar, M.Z.; Yusof, Z.M.; Laili, A.R.; Laili, M.H.; Hisham, M.H. Noninvasive glucose level determination using diffuse reflectance near infrared spectroscopy and chemometrics analysis based on in vitro sample and human skin. In Proceedings of the IEEE Conference on Systems, Process and Control (ICSPC), Kuala Lumpur, Malaysia, 12–14 December 2014; IEEE: Piscataway, NJ, USA, 2014; pp. 30–35. [Google Scholar]
 - Malin, S.F.; Ruchti, T.L.; Blank, T.B.; Thennadil, S.N.; Monfre, S.L. Noninvasive prediction of glucose by near-infrared diffuse reflectance spectroscopy. Clin. Chem. 1999, 45, 1651–1658. [Google Scholar] [CrossRef] [Green Version]
 - Jeon, K.J.; Hwang, I.D.; Hahn, S.J.; Yoon, G. Comparison between transmittance and reflectance measurements in glucose determination using near infrared spectroscopy. J. Biomed. Opt. 2006, 11, 14022. [Google Scholar] [CrossRef] [Green Version]
 - Amerov, A.K.; Chen, J.; Small, G.W.; Arnold, M.A. Scattering and absorption effects in the determination of glucose in whole blood by near-infrared spectroscopy. Anal. Chem. 2005, 77, 4587–4594. [Google Scholar] [CrossRef]
 - Elhaj, F.A.; Salim, N.; Harris, A.R.; Swee, T.T.; Ahmed, T. Arrhythmia recognition and classification using combined linear and nonlinear features of ECG signals. Comput. Methods Programs Biomed. 2016, 127, 52–63. [Google Scholar] [CrossRef]
 - Martis, R.J.; Acharya, U.R.; Lim, C.M.; Suri, J.S. Characterization of ECG beats from cardiac arrhythmia using discrete cosine transform in PCA framework. Knowledge-Based Syst. 2013, 45, 76–82. [Google Scholar] [CrossRef]
 - Lakshmi, M.R.; Prasad, T.V.; Prakash, D.V.C. Survey on EEG signal processing methods. Int. J. Adv. Res. Comput. Sci. Softw. Eng. 2014, 4, 84–91. [Google Scholar]
 - Subasi, A.; Gursoy, M.I. EEG signal classification using PCA, ICA, LDA and support vector machines. Expert Syst. Appl. 2010, 37, 8659–8666. [Google Scholar] [CrossRef]
 - Salamea, C.; Narvaez, E.; Montalvo, M. Database Proposal for Correlation of Glucose and Photoplethysmography Signals. In Proceedings of the International Conference on Advances in Emerging Trends and Technologies, Quito, Ecuador, 27–29 October 2019; Springer: Berlin, Germany, 2019; pp. 44–53. [Google Scholar]
 - Francisco-García, V.; Guzmán-Guzmán, I.P.; Salgado-Rivera, R.; Alonso-Silverio, G.A.; Alarcón-Paredes, A. Non-invasive Glucose Level Estimation: A Comparison of Regression Models Using the MFCC as Feature Extractor. In Proceedings of the Mexican Conference on Pattern Recognition, Querétaro, Mexico, 26–29 June 2019; Springer: Berlin, Germany, 2019; pp. 206–215. [Google Scholar]
 - Kocsis, L.; Herman, P.; Eke, A. The modified Beer—Lambert law revisited. Phys. Med. Biol. 2006, 51, N91. [Google Scholar] [CrossRef] [PubMed]
 - Yadav, J.; Rani, A.; Singh, V.; Murari, B.M. Prospects and limitations of non-invasive blood glucose monitoring using near-infrared spectroscopy. Biomed. Signal Process. Control. 2015, 18, 214–227. [Google Scholar] [CrossRef]
 - Davis, S.; Mermelstein, P. Comparison of parametric representations for monosyllabic word recognition in continuously spoken sentences. IEEE Trans. Acoust. 1980, 28, 357–366. [Google Scholar] [CrossRef] [Green Version]
 - Jolliffe, I.T.; Cadima, J. Principal component analysis: A review and recent developments. Philos. Trans. R. Soc. A Math. Phys. Eng. Sci. 2016, 374, 2065. [Google Scholar] [CrossRef]
 - Hyvärinen, A. Independent component analysis: Recent advances. Philos. Trans. R. Soc. A Math. Phys. Eng. Sci. 2013, 371, 1984. [Google Scholar] [CrossRef] [Green Version]
 - Gaikwad, S.; Gawali, B.; Yannawar, P.; Mehrotra, S. Feature extraction using fusion MFCC for continuous marathi speech recognition. In Proceedings of the India Conference (INDICON), 2011 Annual IEEE, Hyderabad, India, 16–18 December 2011; IEEE: Piscataway, NJ, USA, 2011; pp. 1–5. [Google Scholar]
 - James, G.; Witten, D.; Hastie, T.; Tibshirani, R. An Introduction to Statistical Learning; Springer: Berlin, Germany, 2013; Volume 6. [Google Scholar]
 - Friedman, J.; Hastie, T.; Tibshirani, R. The Elements of Statistical Learning; Springer: New York, NY, USA, 2001; Volume 1. [Google Scholar]
 - Freund, Y.; Schapire, R.E. A decision-theoretic generalization of on-line learning and an application to boosting. J. Comput. Syst. Sci. 1997, 55, 119–139. [Google Scholar] [CrossRef] [Green Version]
 - Bishop, C.M. Pattern Recognition and Machine Learning; Springer: New York, NY, USA, 2006; ISBN 978-0-387-31073-2. [Google Scholar]
 - Breiman, L.; Friedman, J.H.; Olshen, R.A.; Stone, C.J. Classification and Regression Trees; Routledge: Boca Raton, FL, USA, 2017; ISBN 1315139472. [Google Scholar]
 - Friedman, J.; Hastie, T.; Tibshirani, R. Regularization paths for generalized linear models via coordinate descent. J. Stat. Softw. 2010, 33, 1–22. [Google Scholar] [CrossRef] [Green Version]
 - Zou, H.; Hastie, T. Regularization and variable selection via the elastic net. J. R. Stat. Soc. Ser. B 2005, 67, 301–320. [Google Scholar] [CrossRef] [Green Version]
 - Mack, Y.-P. Local properties of k-NN regression estimates. SIAM J. Algebr. Discret. Methods 1981, 2, 311–323. [Google Scholar] [CrossRef]
 - Murtagh, F. Multilayer perceptrons for classification and regression. Neurocomputing 1991, 2, 183–197. [Google Scholar] [CrossRef]
 - Breiman, L. Random forests. Mach. Learn. 2001, 45, 5–32. [Google Scholar] [CrossRef] [Green Version]
 - Platt, J. Probabilistic outputs for SVMs and comparisons to regularized likelihood methods. Adv. Large Margin Classif. 1999, 10, 61–74. [Google Scholar]
 - Smola, A.J.; Schölkopf, B. A tutorial on support vector regression. Stat. Comput. 2004, 14, 199–222. [Google Scholar] [CrossRef] [Green Version]
 - Alarcon-Paredes, A.; Rebolledo-Nandi, Z.; Guzmán-Guzmán, I.P.; Yanez-Marquez, C.; Alonso, G.A. A non-invasive glucose level estimation in a multi-sensing health care monitoring system. Technol. Health Care 2018, 26, 1–6. [Google Scholar] [CrossRef]
 - Segman, Y. Device and Method for Noninvasive Glucose Assessment. J. Diabetes Sci. Technol. 2018, 12, 1159–1168. [Google Scholar] [CrossRef] [PubMed] [Green Version]
 
Publisher’s Note: MDPI stays neutral with regard to jurisdictional claims in published maps and institutional affiliations.  | 
© 2021 by the authors. Licensee MDPI, Basel, Switzerland. This article is an open access article distributed under the terms and conditions of the Creative Commons Attribution (CC BY) license (https://creativecommons.org/licenses/by/4.0/).