Article

Incorporating a New Summary Statistic into the Min–Max Approach: A Min–Max–Median, Min–Max–IQR Combination of Biomarkers for Maximising the Youden Index

by
Rocío Aznar-Gimeno
1,*,
Luis M. Esteban
2,*,
Gerardo Sanz
3,
Rafael del-Hoyo-Alonso
1 and
Ricardo Savirón-Cornudella
4
1
Department of Big Data and Cognitive Systems, Instituto Tecnológico de Aragón (ITAINNOVA), 50018 Zaragoza, Spain
2
Department of Applied Mathematics, Escuela Universitaria Politécnica de La Almunia, Universidad de Zaragoza, La Almunia de Doña Godina, 50100 Zaragoza, Spain
3
Department of Statistical Methods and Institute for Biocomputation and Physics of Complex Systems-BIFI, University of Zaragoza, 50009 Zaragoza, Spain
4
Department of Obstetrics and Gynecology, Hospital Clínico San Carlos and Instituto de Investigación Sanitaria San Carlos (IdISSC), Universidad Complutense de Madrid, 28040 Madrid, Spain
*
Authors to whom correspondence should be addressed.
Mathematics 2021, 9(19), 2497; https://doi.org/10.3390/math9192497
Submission received: 30 August 2021 / Revised: 29 September 2021 / Accepted: 30 September 2021 / Published: 5 October 2021
(This article belongs to the Special Issue Applied Medical Statistics: Theory, Computation, Applicability)

Abstract

:
Linearly combining multiple biomarkers is a common practice that can provide a better diagnostic performance. When the number of biomarkers is sufficiently high, a computational burden problem arises. Liu et al. proposed a distribution-free approach (min–max approach) that linearly combines the minimum and maximum values of the biomarkers, involving only a single coefficient search. However, the combination of minimum and maximum biomarkers alone may not be sufficient in terms of discrimination. In this paper, we propose a new approach that extends that of Liu et al. by incorporating a new summary statistic, specifically, the median or interquartile range (min–max–median and min–max–IQR approaches) in order to find the optimal combination that maximises the Youden index. Although this approach is more computationally intensive than the one proposed by Liu et al, it includes more information and the number of parameters to be estimated remains reasonable. We compare the performance of the proposed approaches (min–max–median and min–max–IQR) with the min–max approach and logistic regression. For this purpose, a wide range of different simulated data scenarios were explored. We also apply the approaches to two real datasets (Duchenne Muscular Dystrophy and Small for Gestational Age).

1. Introduction

In clinical practice, it is common to have information on multiple biomarkers for disease diagnosis. Combining them all into a single marker is common practice and usually offers better diagnostic accuracy than considering each biomarker separately [1,2]. How to increment the performance of a standard marker by adding new markers has also received attention in the literature [3].
The combination of continuous biomarkers provides a continuous value and the dichotomisation of this value is important as it provides the clinician with a classification rule related to a disease and their clinical decisions are usually based on such categorisation of patients into groups [4].
Although different algorithms have been considered to provide predictive models, linear models (linear combination of biomarkers) have been widely proposed for binary classification problems due to their simplicity of interpretation and good performance [5]. The accuracy of the diagnostic marker is usually assessed on the basis of its discriminatory ability as analysed by the Receiver Operating Characteristic (ROC) curve through derived statistics such as sensitivity and specificity pairs, the area or partial area under the ROC curve (AUC/pAUC), or the Youden index [6]. Specifically, the formulation of algorithms for the estimation of binary classification models that maximise the AUC has been widely explored and has been the background and basis for many subsequent algorithms recently published [7,8,9].
Su and Liu [10] provided the estimation of linear models that maximises AUC under multivariate normality. However, this normality assumption is a high-demand hypothesis on real data and is often not easy to meet in clinical reality. This real limitation leads to the need for more flexible statistical approaches that are not subject to distributional assumptions [11,12]. Several statistical methods have been presented in the literature that do not depend on a specific distribution. One example is the statistics of the fractional moments, whose effectiveness and advantages have been demonstrated in real scenarios [13,14]. Pepe et al. [15,16] proposed a distribution-free approach to estimate the linear model that maximise AUC based on the Mann–Whitney U statistic [17], in order to address the Su and Liu limitation. The process that Pepe et al. proposed is a discrete optimisation which is based on an extensive search over the parameter vector. However, this process is not computationally accessible (NP-hard problem) for a number of biomarkers p ≥ 3. In order to make it computationally tractable, Pepe et al. also suggested the use of stepwise algorithms that are an alternative which have shown to perform well in various scenarios. The idea of these algorithms is to include a new biomarker at each step by selecting the best combination of two biomarkers. The approach and suggestions proposed by Pepe et al. have been the source of development of non-parametric and semiparametric approaches in the construction of classifiers under optimality criteria derived from the ROC curve.
Esteban et al. [18] implemented the approach of Pepe et al. providing strategies to handle ties that appear in the sequencing of partial optimisations under AUC optimisation criteria. Kang et al. [19,20] proposed a less computationally demanding stepwise combination approach based on a rated of AUC values that correspond to predictors variables. However, finding the optimal parameters in these stepwise approaches becomes a computational burden problem that is also difficult to tackle when the number of biomarkers is high ( p > 5 ).
Liu et al. [21] proposed an approach, called the min–max approach, which linearly combines the minimum and maximum values of biomarkers, involving a single coefficient search that maximises the Mann–Whitney U statistic of AUC. The advantage of this approach is that it is computationally tractable regardless of the number of biomarkers. However, it has been shown that there are scenarios where the min–max approach generally achieves less optimality compared to other methods that use information from all biomarkers, such as stepwise approaches [19,22]. This may indicate that the combination of minimum and maximum biomarkers alone may not be sufficient in terms of discrimination [5].
Algorithms focused on optimising other parameters derived from the ROC curve have also been developed. Liu et al. [23] analysed the optimal linear combination into diagnostic marker maximising sensitivity over a range of specificity. Yin and Tian [24] proposed approaches to estimate the joint confidence region of sensitivity and specificity at the cut-off point determined by the Youden index. Based on the stepwise combination approach of Kang et al., Yin and Tian [22] conducted a study with the aim of optimising the Youden index. Yin and Tian [25] also studied the optimisation of the AUC and the Youden index simultaneously and presented both parametric and non-parametric approaches that estimate the joint confidence region of the AUC and the Youden index. Based on the min–max approach, Ma et al. [26] adapted and extended the min–max method to the estimation of the pAUC for multiple continuous biomarkers. Yu and Park [27] and Yan et al. [28] also explored methods for the linear combination of multiple biomarkers that optimise the pAUC.
The Youden index is a statistical metric widely and successfully used in several clinical studies and, at the same time, serves as an appropriate summary for making the diagnosis and as a criterion for choosing the best cut-off points for dichotomising a biomarker [29], which is key for the diagnosis of the disease. There are different methods for providing the best cut-off point depending on the aim of the classification, but there is consensus that, without a clear reason to provide higher values for sensitivity or specificity, the Youden index provides an optimised balance of sensitivity/specificity.
In order to address the computational burden regardless of the number of biomarkers and to increase the predictive capacity, in this work we propose a new approach that extends that of Liu et al. by incorporating a new summary statistic, in particular, the median or interquartile range (min–max–median and min–max–IQR approaches). Although this approach is more computationally intensive than the one proposed by Liu et al., it includes more information and the number of parameters to estimate remains reasonable. For the choice of the best linear combination of these three variables, we use a stepwise method (two steps) following the empirical search approach of Pepe and Thompson. For the search of the optimal linear combination, we consider the Youden index as an objective function.
We compared the performance of the proposed algorithm (min–max–median and min–max–IQR approaches) with the min–max approach adapted to optimise the Youden index and logistic regression, which are computationally tractable linear approaches. For this purpose, a comprehensive study was carried out considering different simulated data scenarios. The performances of the approaches on real datasets (e.g., Duchenne muscular dystrophy and Small for Gestational Age prediction) were also analysed. The comparison of the performance of the algorithms was carried out by considering the results obtained on the entire dataset (resubstitution method) and using a validation procedure derived from K-fold cross-validation, which evaluates the generalisability of the predictive model and avoids possible overfitting [30].
Thus, the aim of this work is to propose a new approach (min–max–median/min–max–IQR approach) that has the advantage of being computable regardless of the number of biomarkers and that does not depend on any distributional assumptions, and analyse their performance in comparison with the min–max approach and the logistic regression which is a standard in prediction models with good performance, to find optimal scenarios.

2. Materials and Methods

Firstly, we introduce the formulation of the linear model and estimation suggestions of Pepe et al. [15,16]. This is the basis for the formulation and estimation of the linear model of summary statistic-based approaches. Then, the methods based on Youden index maximisation to be compared are presented: the min–max approach, the min–max–median and min–max–IQR approaches and logistic regression. Finally, the simulated scenarios as well as the real datasets considered are described. All methods were programmed and applied using the free software R [31].

2.1. Background: Pepe et al.’s Approach

Pepe and Thompson [15] proposed a non-parametric approach in order to estimate the linear model that maximises the AUC based on the Mann–Whitney U statistic [17]. Thus, this approach allows its use for all types of data without any distribution assumptions. The formulation of the linear model is as follows:
L ( X ) = X 1 + β 2 X 2 + + β p X p
where p denotes the number of biomarkers, X i the biomarker i [ 1 , , p ] and β i the parameter to be estimated. If, in addition, we assumed that we have n k individuals of the group k = 1 , 2 (diseased and non-diseased, respectively) and X ki is the vector of p biomarkers for the i t h individual of group k, then the empirical AUC based on the Mann–Whitney U statistic is given by the following expression:
A U C ^ = i = 1 n 1 j = 1 n 2 I ( L ( X 1 i ) > L ( X 2 j ) ) + 1 2 I ( L ( X 1 i ) = L ( X 2 j ) ) n 1 · n 2
For the estimation of the parameter β i , Pepe et al. suggested a discrete optimisation which is based on a grid search over 201 equally spaced values in the interval [ 1 , 1 ] . For simplicity, consider the linear combination of two biomarkers: X i + β X j . Due to the invariant property of the ROC curve for any monotonic transformation, dividing by the β value does not change the value of the sensitivity and specificity pair. Thus, estimating X i + β X j for β > 1 and β < 1 is equivalent to estimating 1 β X i + X j for β [ 1 , 1 ] and, therefore, all possible values of β R are covered.
However, this optimisation requires a large computational effort for dimensions p 3 . In order to make it computationally accessible, Pepe et al. suggested using stepwise algorithms in which a new biomarker is included at each stage, selecting the best combination of two biomarkers. This turns an unaddressable computational burden problem into an addressable one by applying p 1 times Pepe et al.’s suggested single-parameter estimate.
Although Pepe et al. originally introduced this approach to optimise the AUC, both the formulation of the linear model (1), the suggested empirical search and the suggested use of stepwise approaches are the basis in the development of the min–max approaches and our proposals: min–max–median and min–max–IQR approaches under Youden index maximisation.
Let X k i j be the j t h biomarker ( j = 1 , , p ) for the i t h individual of group k = 1,2 (disease and non-disease, respectively), X ki the vector of p biomarkers for the i t h individual of group k and X k = X k 1 , , X kn k where n k is the number of individuals in group k. The Youden Index (J) of the linear combination is defined as:
J = max c { S e n s i t i v i t y ( c ) + S p e c i f i c i t y ( c ) 1 } = max c { F Y 2 ( c ) F Y 1 ( c ) }
where c denotes the cut-off point and F Y k ( c ) = P ( Y k c ) the cumulative distribution function of random variable Y k = β T X k , k = 1 , 2 (linear combination), β = ( β 1 , , β p ) T being the parameter vector to be estimated. It is therefore immediate to deduce the following formula from the empirical estimation of the Youden index:
J ^ f i = F ^ Y 2 ( c ^ β ) F ^ Y 1 ( c ^ β ) = i = 1 n 2 I β T X 2 i c ^ β n 2 i = 1 n 1 I β T X 1 i c ^ β n 1
where c β = { c : max c F Y 2 ( c ) F Y 1 ( c ) } denotes the optimal cut-off point.

2.2. Min–Max Approach

Liu et al. [21] proposed the distribution-free min–max approach. The idea of this approach is based on reducing the order of the linear combination by considering only two markers from the measurements information of the original p biomarkers (maximum value and the minimum value of all the p biomarkers):
X max + β X min
Therefore, this approach is reduced to estimating a single β parameter of the linear combination that maximises the AUC, as it is based on the linear model proposed by Pepe et al. expressed in Equation (1).
This approach was adapted in our work with in order to maximise the Youden index with the following expression:
J ^ β = i = 1 n 2 I X 2 i , max + β X 2 i , min c ^ β n 2 i = 1 n 1 I X 1 i , max + β X 1 i , min c ^ β n 1
where X k i , max = max 1 j p X k i j and X k i , min = min 1 j p X k i j for each i = 1 , , n k . k = 1 , 2 .
The search for the optimal parameter follows the empirical search suggested by Pepe et al.: for each value β of the 201 equally spaced [ 1 , 1 ] , the optimal cut-off point ( c ^ β ) that maximises Youden index is calculated. The final value chosen ( β ^ ) is the one with the highest Youden ( J ^ β ) obtained.

2.3. Our Proposed Summary Statistics-Based Approaches: Min–Max–Median and Min–Max–IQR

We propose two new approaches based on summary statistics to maximise the Youden index. The underlying idea of the approaches is based on the same idea as the min–max approach (Section 2.2) of reducing the dimension of the problem by considering summary statistic information of the p biomarkers as variables. They could be seen as an extension of the min–max approach by incorporating a new summary statistic. The aim of this proposal was to incorporate more information from the original biomarkers while keeping the approach computationally tractable.
Specifically, we propose two approaches: including the median and IQR at the maximum and minimum of the p biomarkers measurements. Therefore, our approach is reduced to considering the linear combination of three variables (max, min, median–max, min, IQR).
For the estimation of the optimal linear combination of these three variables, a stepwise approach is used, as suggested by Pepe et al., in order to ensure an approachable computational time. Specifically, our proposals implement an adaptation of the stepwise approach proposed by Esteban et al. [18] for Youden Index maximisation, where at each step a new variable is introduced and the optimal linear combination of two variables is selected using the empirical search suggested by Pepe et al. In this way, we turn a time-consuming problem into a computationally tractable problem by considering two steps of optimising the linear combination of two variables.
The proposed approach is explained in detail in the following steps. Consider the min–max–median approach. The min–max–IQR approach is equivalent:
  • Firstly, the problem of estimating the optimal linear combination of p variables is transformed to the estimation of the optimal linear combination of three variables (min, max, median). For this purpose, the values of these new variables are calculated for each i individual from their values of the p original biomarkers:
    X k i , max = max 1 j p X k i j , X k i , min = min 1 j p X k i j , X k i , m e d i a n = m e d i a n 1 j p X k i j for each i = 1 , , n k . , k = 1 , 2 .
  • Once the information is transformed, a stepwise approach is used to estimate the optimal linear combination of the three new variables (min–max–median). For simplicity, denote by X k i j the values of the new transformed variables (min–max–median, j = 1 , 2 , 3 ) for the i t h individual of group k = 1, 2. The first step of the stepwise approach consists of choosing the combination of two variables that maximises the Youden index, using empirical search proposed by Pepe et al.:
    J ^ β 2 = i = 1 n 2 I X 2 i j + β 2 X 2 i l c ^ β 2 n 2 i = 1 n 1 I X 1 i j + β 2 X 1 i l c ^ β 2 n 1 β 2 [ 1 , 1 ] , j l = 1 , 2 , 3
    The maximum Youden index can be reached for more than one optimal linear combination. Our approach considers these ties and drags them forward in the next step. For simplicity, consider that it is reached for a single linear combination. The optimal combination chosen (two variables and one parameter β 2 ) that maximises the Youden index (8) is considered as a single variable in the next step (and final) of the stepwise approach. For simplicity, suppose the following optimal linear combination: X k i 1 + β 2 X k i 2 .
  • Finally, the last variable ( X k i 3 ) not chosen in the previous step is included and the optimal linear combination of the two variables is chosen as in point 2. Specifically, either combination (9) or (10) that maximises the Youden index J ^ β 3 is selected:
    J ^ β 3 = i = 1 n 2 I ( X 2 i 1 + β 2 X 2 i 2 ) + β 3 X 2 i 3 c ^ β 3 n 2 i = 1 n 1 I ( X 1 i 1 + β 2 X 1 i 2 ) + β 3 X 1 i 3 c ^ β 3 n 1 β 3 [ 1 , 1 ]
    J ^ β 3 = i = 1 n 2 I β 3 ( X 2 i 1 + β 2 X 2 i 2 ) + X 2 i 3 c ^ β 3 n 2 i = 1 n 1 I β 3 ( X 1 i 1 + β 2 X 1 i 2 ) + X 1 i 3 c ^ β 3 n 1 β 3 [ 1 , 1 ]
The code of all approaches is available upon request to Ms. Rocío Aznar-Gimeno ([email protected]).
The predictive ability of these approaches based on summary statistics (min–max approach and min–max–median/IQR approach) is also compared with the classical logistic regression approach [32], which is a subtype of generalised linear model to predict the probability of an event (disease or non-disease) given a set of variables through the logistic function. We used for comparisons the logistic regression method in the multivariate binormal setting, for the diseased and non-diseased populations, which showed similar performances in the linear discriminant analysis, which is standard in predictive models, exhibiting a good performance in all scenarios [15]. The objective was to compare computationally tractable linear combination methods, regardless of the number of original biomarkers, dealing with biomarkers’ real values.

2.4. Performance Comparison

The comparison was carried out by considering both the resubstitution method and a method from 5-fold cross-validation. For this purpose, a range of simulated data were explored. Their application to two real dataset examples was also explored in order to evaluate their performances in real cases.

2.4.1. Simulations

The simulated data analysed cover a wide range of scenarios in terms of the distribution of biomarkers, the ability to discriminate between biomarkers and the correlation between them, considering smaller to larger sample sizes.
In order to observe behaviours with smaller and larger numbers of biomarkers, four biomarkers ( p = 4 ) and ten biomarkers ( p = 10 ) were considered in the simulated scenarios. The peculiarity of statistics-based approaches (in particular our proposed approaches) is that they translate biomarker information into only 3 variables, regardless of the number of initial biomarkers. This has the advantage that they are always computationally feasible. Furthermore, in scenarios where the number of biomarkers to be considered exceeds the sample size, these approaches can avoid overfitting to the data, due to their inherent dimensionality reduction characteristics. In order to analyse the performance of the algorithms in these specific cases, simulated scenarios of p = 100 biomarkers and a smaller sample size ( n 1 = n 2 = 30 were also explored.
Different joint distributions were considered following multivariate normal ( X k M V N ( m k , Σ k ) ) and also non-normal distributions (in particular, log-normal: e X k ) in both diseased and non-diseased populations ( k = 1 , 2 ). In this way, both normal distributions, which is one of the common distributions in statistics, and distributions that allow assessment beyond normality and symmetry, were analysed.
When the multivariate normal distribution for diseased and non-diseased population are assumed X N ( m 1 , Σ 1 ) , Y N ( m 2 , Σ 2 ) the coefficients for the optimal linear combination (which coincides with the Linear Discrimination Function (LDF)) and its area under the ROC curve are known and given by β m a x ( Σ 1 + Σ 2 ) 1 m , where m = m 1 m 2 and AUC max = Φ ( m T ( Σ 1 + Σ 2 ) 1 m ) (see Su and Liu [10]).
Using this formula, we simulated markers by choosing mean vectors and variance–covariance matrices, whose AUC shown a good discrimination ability, with an AUC above 0.8 or at least near 0.8. The reason behind this is that these models are those whose dichotomisation by Youden index is interesting in real practice.
Regarding the vector of means, the null vector was considered for the non-diseased population ( m 2 = 0 ) in all simulated scenarios. For the diseased population, scenarios considering both the same and different abilities to discriminate between biomarkers were explored: (i) same mean for each biomarker: m 1 = ( 1.0 , 1.0 , , 1.0 ) T ; (ii) different means: m 1 = ( 0.2 , 0.5 , 1.0 , 0.7 ) T , m 1 = ( 0.2 , 0.4 , 0.6 , 0.8 , 1.0 , 1.2 , 1.4 , 1.6 , 1.8 , 2.0 ) T .
Regarding the variance–covariance matrix, for simplicity, the variance of each biomarker was set to 1, so that covariances equalled correlations. Scenarios were analysed with the same covariance matrix between populations ( Σ 1 = Σ 2 ) and different ( Σ 1 Σ 2 ). Specifically, for the cases with the same covariance matrix, the following scenarios were explored: (i) independence ( Σ 1 = Σ 2 = I ), (ii) medium correlation ( Σ 1 = Σ 2 = 0.5 · I + 0.5 · J ), where I is the identity matrix and J a matrix of all ones, and (iii) negative correlation ( ρ = 0.1 ) for all pairs of biomarkers. As for the scenarios with different covariance matrices between populations, the following scenarios were analysed: (i) Σ 1 = 0.3 · I + 0.7 · J (high correlation) and Σ 2 = 0.7 · I + 0.3 · J (low correlation) (ii) Σ 1 = 0.5 · I + 0.5 · J (medium correlation) and Σ 2 = I (independents).
For each scenario, 1000 random samples from underlying distribution were considered with the following different samples sizes: (i) n 1 = n 2 = 30 ; (ii) n 1 = n 2 = 100 ; (iii) n 1 = n 2 = 500 . Each method was applied to each of the simulated scenarios and the maximum Youden index was obtained.

2.4.2. Application to Real Data

The analysed methods were applied to two real data examples with the aim of diagnosing and predicting of Duchenne Muscular Dystrophy and Small for Gestational Age.
Duchenne muscular dystrophy (DMD) is a progressive recessive muscular disorder that is transmitted from mother to child. It is the most common muscular dystrophy diagnosed during childhood and early diagnosis is essential to limit its negative consequences [33]. Percy et al. [34] analysed the effectiveness of screening for female DMD carriers from four biomarkers of blood samples: serum creatine kinase (CK), haemopexin (H), pyruvate kinase (PK), and lactate dehydrogenase (LD). The available data that were analysed contain complete information on these four biomarkers of 67 women who are carriers of the progressive recessive disorder DMD and 127 women who are not carriers.
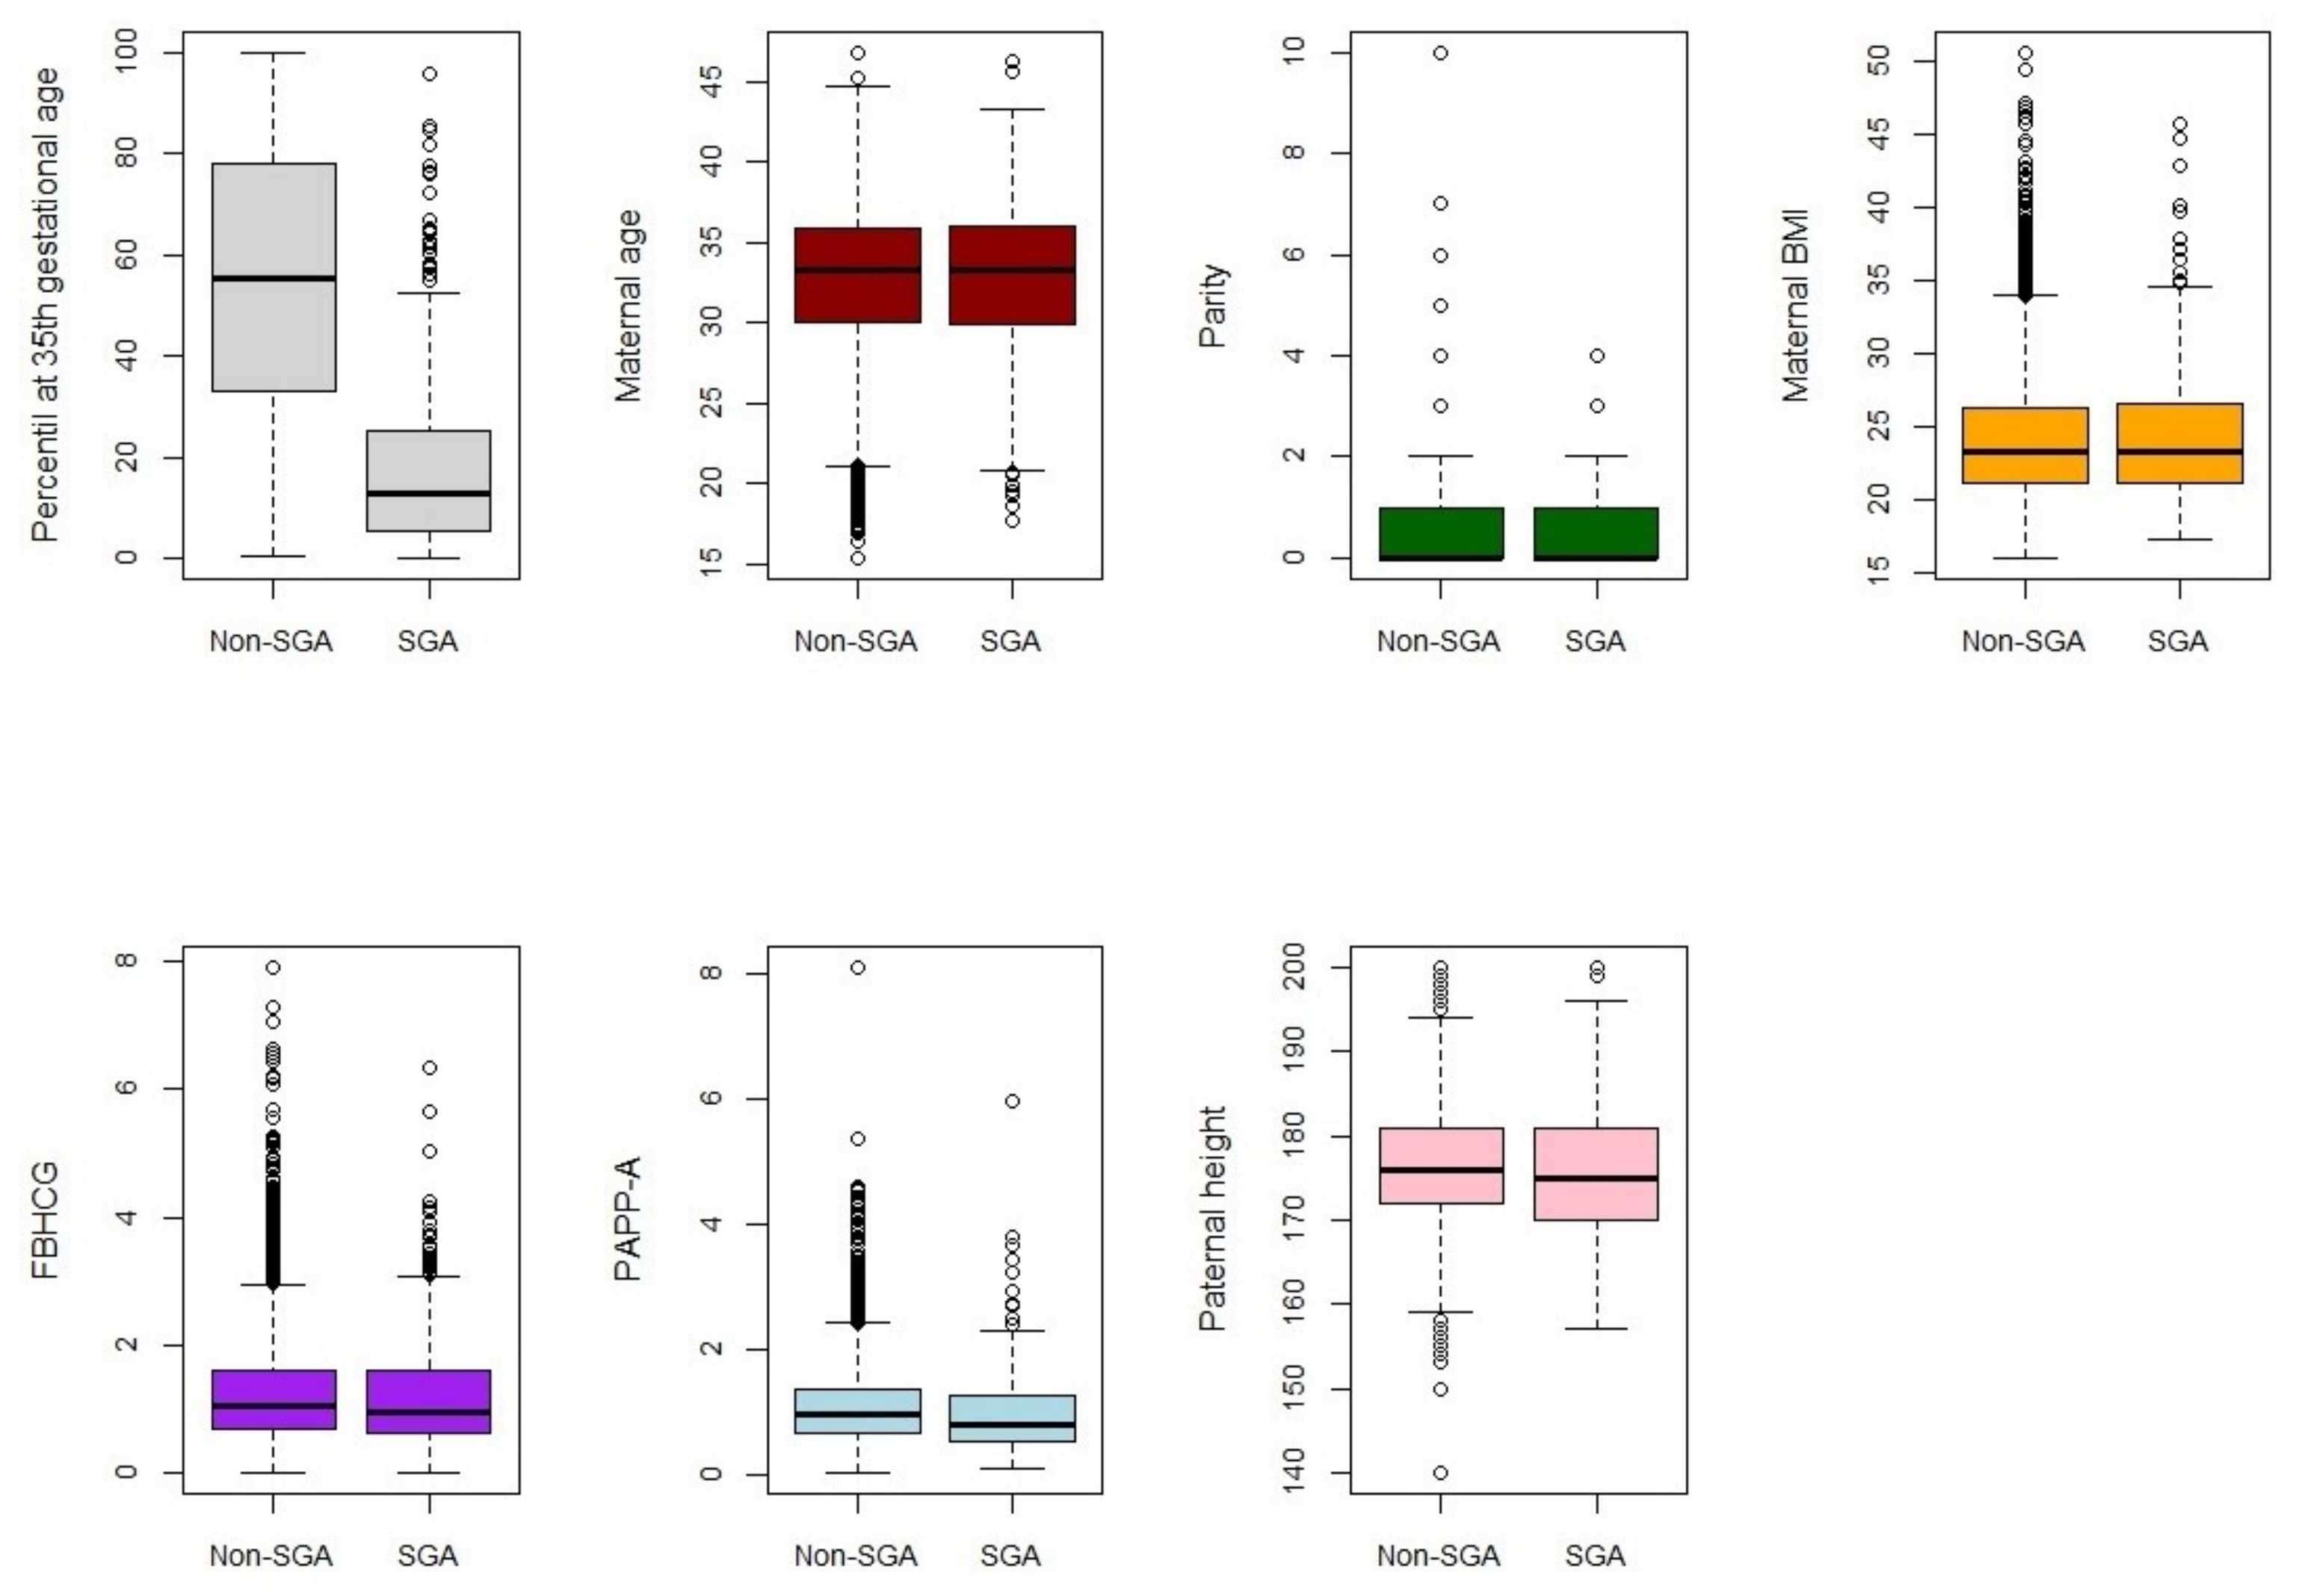
Small-for-gestational-age (SGA) infants—those with a birth weight below the 10th percentile—have been associated with increased risk of adverse perinatal outcomes [35,36]. Predicting them from the ultrasound percentile at the 35th gestational week as well as other fetal and parental variables may help to avoid these outcomes. The dataset analysed contains information of 4474 pregnancies whose births were assisted at the Miguel Servet University Hospital, between March 2012 and December 2016. The ability of the methods to predict SGA at birth was analysed from information of 7 biomarkers: ultrasound percentile at 35th gestational week, maternal age, parity, maternal body mass index (BMI), Free Beta Human Chorionic Gonatrodopin (FBHCG), Pregnacy-Associated Plasma Protein-A (PAPP-A) and paternal height.

3. Results

3.1. Simulations

The results of each method for each simulated scenario are presented as the mean of the maximum Youden indices obtained in the 1000 random samples as well as the standard deviation. For simplicity, we denote logistic regression, min–max approach, min–max–median approach and min–max–IQR approach by LR, MM, MMM and MMIQR, respectively.

3.1.1. Normal Distributions

Table 1 and Table 2 present the results obtained for the simulated scenarios following multivariate normal distribution with different means and same means between biomarkers (in particular, p = 4 and p = 10 ), respectively.
Specifically, Table 1 analyses, for each sample size, biomarker dataset ( p = 4 and p = 10 ) and for each validation method (with and without CV), the following simulated scenarios: (i) independence ( Σ 1 = Σ 2 = I ), (ii) medium correlation ( Σ 1 = Σ 2 = 0.5 · I + 0.5 · J ), (iii) different covariance matrices: Σ 1 = 0.3 · I + 0.7 · J (high correlation) and Σ 2 = 0.7 · I + 0.3 · J (low correlation) and (iv) negative correlation ( ρ = 0.1 ).
Table 1 shows that in the normal scenarios of independent biomarkers of different means, the MMM and MMIQR approaches show comparable performance, slightly outperforming the former, and outperforming the MM approach especially in larger samples. This behaviour is more pronounced when the number of biomarkers is larger ( p = 10 ). However, they fall short of LR, which is the best performer. This behaviour is also observed in the scenario of negative correlations, although in this case the difference in performance between the summary statistics-based approaches and LR is somewhat smaller. The results show that the resubstitution method is indeed more optimistic than the one derived from cross-validation, although the conclusions on the performance comparison are broadly similar.
As for the simulated scenarios considering four biomarkers with different covariance matrices between populations, the new approaches incorporating a new summary statistic do not reach the performance of the MM approach and could be considered as approaches with similar performances. However, they outperform the MM approach, albeit only slightly when the number of biomarkers is larger ( p = 10 ) and sample sizes are larger. The results show that in the scenarios of biomarkers with medium positive correlations, the new approaches do not outperform the MM approach in any of the cases based on the cross-validation method. In all cases, the LR outperforms all other methods.
Table 2 analyses the following simulated scenarios of biomarkers with the same means: (i) independence ( Σ 1 = Σ 2 = I ), (ii) medium correlation ( Σ 1 = Σ 2 = 0.5 · I + 0.5 · J ), (iii) different covariance matrices: Σ 1 = 0.3 · I + 0.7 · J (high correlation) and Σ 2 = 0.7 · I + 0.3 · J (low correlation) and (iv) different covariance matrices: Σ 1 = 0.5 · I + 0.5 · J (medium correlation) and Σ 2 = I (independents).
Table 2 shows, as Table 1, that in simulated normal independent biomarker scenarios the MMM and MMIQR approaches outperform the MM approach, although the LR is the best performer based on CV. However, in this case of scenarios of biomarkers with same means, the difference in performance between the MMM and MMIQR approaches and the LR is significantly lower.
The results in Table 2 show that in the simulated scenarios of biomarkers with positive medium correlation, summary statistics-based methods (MM, MMM, MMIQ) could be considered to perform comparably in larger sample sizes considering the cross-validation method. Although LR still dominates over the other methods, the difference is considerably smaller than considering biomarkers with different means (Table 1).
However, the results show that in the simulated scenarios with different covariance matrices between groups, the MM approach outperforms the LR approach. Furthermore, in the scenario where biomarkers within a group are independent, the proposed MMM and MMIQR approaches slightly exceed the MM approach for larger sample sizes.

3.1.2. Non-Normal Distributions

Table 3 shows the results obtained from the following simulated scenarios following a log-normal distribution: (i) biomarkers with different means and medium correlation ( Σ 1 = Σ 2 = 0.5 · I + 0.5 · J ), (ii) biomarkers with different means and different covariance matrices: Σ 1 = 0.3 · I + 0.7 · J (high correlation) and Σ 2 = 0.7 · I + 0.3 · J (low correlation), (iii) biomarkers with same means and medium correlation ( Σ 1 = Σ 2 = 0.5 · I + 0.5 · J ), (iv) biomarkers with same means and different covariance matrices: Σ 1 = 0.3 · I + 0.7 · J (high correlation) and Σ 2 = 0.7 · I + 0.3 · J (low correlation), and (v) biomarkers with same means and different covariance matrices: Σ 1 = 0.5 · I + 0.5 · J (medium correlation) and Σ 2 = I (independents).
The results in Table 3 show that, under cross-validation, in the simulated scenarios of biomarkers with different means and medium correlation, the MMM and MMIQR approaches do not outperform the MM approach and the LR significantly dominates over the rest. In scenarios with different covariance matrices between groups with a higher number of biomarkers ( p = 10 ), although LR remains the best performer, the MMM and MMIQR approaches outperform the MM approach, with the MMIQR approach being slightly superior.
However, in the biomarker scenarios with the same means, considering medium correlation between biomarkers, the results show that for larger sample sizes the MMM and MMIQR approaches outperform the MM approach in this case, with the MMIQR approach being very slightly superior.
For the simulated scenarios of biomarkers with the same means and different covariance matrices between groups, the summary statistics-based approaches outperform logistic regression. For the scenario with independent biomarkers in one group, the MMIQR approach outperforms the others by applying the cross-validation method.

3.1.3. High-Dimensional Scenarios: Normal Distributions

Table 4 analyses the following simulated scenarios of p = 100 normal biomarkers with the same means for a smaller sample size ( n 1 = n 2 = 30 ): (i) independence ( Σ 1 = Σ 2 = I ) and (ii) different covariance matrices: Σ 1 = 0.5 · I + 0.5 · J (medium correlation) and Σ 2 = I (independents).
Table 4 shows that in these scenarios where the size of the variables is larger than the sample size, the LR model is significantly overfitted. The results obtained based on CV show that statistics-based algorithms are superior to LR. This difference is most noticeable in the scenario with different covariance matrices. In this scenario, our approaches (MMM and MMIQR) fail to outperform the MM approach. However, in the scenario of independent biomarkers, our approaches outperform it. These results are in line with the conclusions drawn from the results in Section 3.1.1.

3.2. Computational Times

Our proposed approach uses the information provided by a set of predictive markers in three new markers derived from them. This is an automated calculus that it is not time-consuming. From them, we estimated the coefficients of the model by an extensive search using a step by step approach. We want to remark that computational times for this approach are reasonably independent of the sample size. In our simulations, the computational times of our proposed approaches ranged from 8 to 154 seconds using a sample size ranging from 60 to 20,000 individuals showing that our algorithm is computationally tractable in high dimensionality.

3.3. Real Datasets

3.3.1. Duchenne Muscular Dystrophy Dataset

Figure 1 represents the information of each biomarker for each group (carrier and non-carrier groups).
As the variances of the four biomarkers differ from each other, it was necessary to normalise the values of each biomarker before applying the methods based on summary statistics. This normalisation is important to avoid different units of measurement and to ensure the consistent use of these approaches.
The analysed methods were applied to this dataset with the aim of finding the optimal combination of the four biomarkers that achieves the maximum Youden index. The estimates of the Youden index of each biomarker (CK, H, PK, LD) in a univariate way were 0.6124, 0.4172, 0.5079, and 0.5776.
Table 5 shows the maximum Youden index achieved as well as their respective sensitivity and specificity values, using both the resubstitution and the cross-validation-based methods. The MMM approach outperforms the MM approach, although it does not reach the performance of the LR, which is the best performer, achieving a Youden index of 0.7948 after cross-validation.

3.3.2. Small for Gestational Age Dataset

Figure 2 represents the information of each biomarker for each group (SGA and non-SGA group). Before applying the summary statistics-based methods, a normalisation was applied.
Table 6 shows the maximum Youden index achieved for all methods studied as well as their respective sensitivity and specificity values, using both the resubstitution and the cross-validation-based methods. The MMM and MMIQR approaches outperform the MM approach, although they do not match the performance of the LR, which is the best performer, achieving a Youden index of 0.5901 after cross-validation. In this example, the MMM and MMIQR approaches outperform the MM approach more markedly than the previous example, which includes a smaller number of biomarkers ( p = 4 ). These results therefore show that for a larger number of biomarkers, the benefit of using the approaches, incorporating a new summary statistic (MMM, MMIQR vs. MM approach), was greater. These conclusions were also drawn from the simulated data. Specifically, this is a scenario with a predictor, the estimated percentile weight at the 35th week, with a greater discrimination ability than the rest of predictor variables. It seems that in this case, the MM approach cannot capture the added discrimination ability of the set of biomarkers; in this case, the improvement of MMM and MMIQ approaches is more clear.
Although for none of the real examples analysed did the summary statistics-based approaches outperform LR, it is clear from this analysis that the proposed approaches outperform the MM approach, which has been shown in the simulation to have superior discrimination ability than the LR for specific scenarios of different covariance matrices between groups and the same univariate predictive ability of biomarkers.

4. Discussion and Conclusions

In this study, we propose new summary statistics-based approaches and compare their performances with the min–max approach and logistic regression under Youden index optimisation, which are computationally tractable approaches regardless of the problem dimension. The methods were applied to both simulated data and two real datasets.
The results of the comparison using cross-validation (Table 1, Table 2 and Table 3) suggest that a logistic regression should be used over the other summary statistics-based approaches when the number of biomarkers is smaller than the sample size, except in scenarios of biomarkers with the same predictive ability and different covariance matrices between groups (Table 2), where summary statistics-based approaches are recommended, which outperformed logistic regression. In fact, generally, differences in performance were smaller when considering scenarios with biomarkers with the same means (Table 2). The study by Kang et al. [20], but under AUC optimisation, led to a similar conclusion regarding optimal scenarios for the min–max approach.
The results showed that the proposed new approaches outperform the min–max approach in general when independent biomarkers are included. This difference increases when the number of biomarkers is larger. These results may be expected as independent information as well as a larger number of biomarkers may contribute to the fact that it is insufficient to consider only the minimum and maximum values of biomarkers. Although no significant differences were found between the MMM and MMIQR approaches, the MMIQR approach slightly outperformed the MMM approach in non-normal distributions and the MMM approach overall slightly outperformed the others in all other scenarios. This could indicate that in asymmetric distributions, the incorporation of a dispersion measure could be a good option.
In scenarios where the number of biomarkers is higher than the sample size (Table 4), the results showed that the logistic regression overfitted the data. Our approaches outperformed the min–max approach when biomarkers were independent. These results are in line with previous results and demonstrate the advantage of our approaches which, in addition to always being computationally feasible, do not overfit the data due to their inherent feature of dimensionality reduction involving all biomarkers across the summary information.
The performance of the analysed methods achieved on the real datasets showed similar conclusions to those deduced from the simulation. Although in none of the real examples analysed did the summary statistics-based approaches outperform the logistic approach, in both cases the proposed methods outperformed the MM approach.
The application of dimensionality reduction techniques before applying a method could be an alternative to avoid overfitting. The selection of biomarkers with high predictive power might seem to be a solution for dimensionality reduction. However, it has been shown that the predictive power alone of each biomarker may not be the best approach for selection. Pinsky and Zhou [37] demonstrated that in fact statistical correlation patterns had a greater implication on the combination of higher performing biomarkers. Therefore, a high number of biomarkers with low predictive ability could be available, yet their combination achieves higher performance. Therefore, methods that use information from a large number of biomarkers, while being computationally tractable, are necessary.
Our proposed distribution-free approach incorporates information from all the original biomarkers through their summary statistics, while the problem remains computationally tractable ( p = 3 ). Pepe and Thomson [15] proposed non-parametric approaches to optimise linear models under AUC optimisation but with reduced dimensionality. Ma and Huang [38] and Wang et al. [39] introduced semiparametric approaches that approximated the empirical AUC by a sigmoid function. Komori et al. [40] proposed a method based on a boosting algorithm for maximisation of the AUC. They used cross-validation techniques to select the best model. None of those methods is fully non-parametric, and their performance relies on a good selection of some parameters.
Liu et al. [21] proposed a non-parametric approach that linearly combines the minimum and maximum values of the biomarkers, involving only a single coefficient search. Therefore, the problem is computable as it is reduced to estimating a single parameter regardless of the number of biomarkers. In addition to being able to take advantage of the information from multiple biomarkers that are measured with the same unit, another advantage of this min–max procedure is that repeated measurements of a single biomarker can be combined as two new markers and can therefore also be an option for longitudinal studies. However, using the information from the minimum and maximum biomarker values may not be sufficient in terms of discrimination, especially when the number of biomarkers is high. The proposed algorithm incorporates more information from the original variables than the min–max approach (three variables). A stepwise algorithm is performed to estimate the linear combination. All this implies that our proposal always remains computationally tractable ( p = 3 ) and has inherent dimensionality reduction properties.
With regard to the strengths of our study, we can list the following. These algorithms are fully non-parametric approaches and do not require distribution assumption for their application. They use information from all biomarkers, incorporate more information than the min–max approach and are also computationally tractable regardless of the number of biomarkers. In addition, we verified their superiority in some simulated scenarios, highlighting that they are good alternatives in predictive models.
However, our study has some limitations. In the comparison analysis we used a unique standard method, the logistic regression. We did not perform a comparison with other methodologies as kernel approaches or machine learning algorithms; therefore, we cannot propose our algorithm as the best method in any scenario.
For future work, a more extensive study comparing more methods could be carried out. Applying dimensionality reduction techniques (such as principal component analysis) before applying the methods could also be explored. Extending the comparison study for a more extensive simulation, e.g., taking into account scenarios with larger sample sizes, is also proposed as a line of future work. It is also proposed to analyse the new methods proposed in other real datasets. An example could be the one analysed by Liu et al. (autism disease), where conditions were optimal for the MM approach, and it could thus be explored as to whether in this case the proposed approaches outperform the MM approach. Readers are also encouraged to adapt our proposed approaches using a different linear combination estimation (a different stepwise algorithm) as well as to explore their performances considering other target metrics.
In summary, in this article, we present to the scientific community a new approach combining summary statistics of biomarkers (min–max–median, min–max–IQR approaches) that has the advantage of being always computable and not being subject to any distributional assumptions. This approach aims to discriminate between two groups (disease and non-disease) and can therefore be a key to and helpful in clinical decision making. The Youden index, which is a widely used metric in the absence of consensus, was considered as an objective function. Comparisons in various scenarios allowed us to discover the scenarios in which the approaches are most optimal. Specifically:
  • Our proposed approaches outperform classical logistic regression using original biomarkers when the number of biomarkers is larger than the sample size.
  • Additionally, they performed well in scenarios of biomarkers with the same predictive ability and different covariance matrices between groups.
  • Our approaches performed better than the min–max approach when biomarkers are independent and in the real scenarios.

Author Contributions

Conceptualisation, R.A.-G. and L.M.E.; methodology, R.A.-G., L.M.E. and G.S.; software, R.A.-G. and L.M.E. and R.d.-H.-A.; validation, R.A.-G. and L.M.E.; formal analysis, R.A.-G. and L.M.E.; investigation, R.A.-G., L.M.E. and G.S.; resources, R.A.-G., L.M.E. and R.S.-C.; data curation, R.A.-G., L.M.E. and R.S.-C.; writing—original draft preparation, R.A.-G. and L.M.E.; writing—review and editing, R.A.-G., L.M.E., G.S., R.d.-H.-A. and R.S.-C.; visualisation, R.A.-G. and L.M.E.; supervision, R.A.-G., L.M.E., G.S. and R.d.-H.-A.; funding acquisition, G.S. All authors have read and agreed to the published version of the manuscript.

Funding

The APC was funded by project MTM2017-83812-P of MINECO.

Institutional Review Board Statement

Not applicable.

Informed Consent Statement

Actual data are from published studies.

Data Availability Statement

Data from the SGA dataset were retrieved from the Miguel Servet University Hospital database and are not shared. The Duchenne Muscular Dystrophy dataset can be found at https://hbiostat.org/data/, accessed on 30 August 2021.

Acknowledgments

The research of Luis M. Esteban and Gerardo Sanz was supported by the Stochastic Models Research group of the Goverment of Aragon. The research of Rocío Aznar-Gimeno and Rafael del-Hoyo-Alonso was supported by the Integration and Development of Big Data and Electrical Systems (IODIDE) group.

Conflicts of Interest

The authors declare no conflict of interest.

Abbreviations

The following abbreviations are used in this manuscript:
AUCArea Under the ROC curve
BMIBody Mass Index
CKSerum Creatine Kinase
CVCross-Validation
FBHCGFree Beta Human Chorionic Gonatrodopin
HHaemopexin
IQRInterquartile Range
LDLactate Dehydrogenase
LRLogistic Regression
MMMin–Max approach
MMIQRMin–Max–IQR approach
MMMMin–Max–Median approach
PAPP-APregnacy-Associated Plasma Protein-A
pAUCPartial Area Under the ROC curve
PKPyruvate Kinase
ROCReceiver Operating Characteristic
SGASmall-for-Gestational-Age

References

  1. Amini, M.; Kazemnejad, A.; Zayeri, F.; Amirian, A.; Kariman, N. Application of adjusted-receiver operating characteristic curve analysis in combination of biomarkers for early detection of gestational diabetes mellitus. Koomesh 2019, 21, 751–758. [Google Scholar]
  2. Yu, S. A Covariate-Adjusted Classification Model for Multiple Biomarkers in Disease Screening and Diagnosis. Ph.D. Thesis, Kansas State University, Manhattan, AR, USA, 2019. [Google Scholar]
  3. Bansal, A.; Pepe, M.S. When does combining markers improve classification performance and what are implications for practice? Stat. Med. 2013, 32, 1877–1892. [Google Scholar] [CrossRef] [PubMed] [Green Version]
  4. Mi, G.; Li, W.; Nguyen, T.S. Characterize and Dichotomize a Continuous Biomarker. In Statistical Methods in Biomarker and Early Clinical Development; Fang, L., Su, C., Eds.; Springer: Cham, Switzerland, 2019; pp. 23–38. [Google Scholar] [CrossRef]
  5. Esteban, L.M.; Sanz, G.; Borque, A. Linear combination of biomarkers to improve diagnostic accuracy in prostate cancer. Monografías Matemáticas García de Galdeano 2013, 38, 35–84. [Google Scholar]
  6. Youden, W.J. Index for rating diagnostic tests. Cancer J. 1950, 3, 32–35. [Google Scholar] [CrossRef]
  7. Lyu, T.; Ying, Z.; Zhang, H. A new semiparametric transformation approach to disease diagnosis with multiple biomarkers. Stat. Med. 2019, 38, 1386–1398. [Google Scholar] [CrossRef] [PubMed]
  8. Ma, H.; Yang, J.; Xu, S.; Liu, C.; Zhang, Q. Combination of multiple functional markers to improve diagnostic accuracy. J. Appl. Stat. 2020, 1–20. [Google Scholar] [CrossRef]
  9. Ahmadian, R.; Ercan, I.; Sigirli, D.; Yildiz, A. Combining binary and continuous biomarkers by maximizing the area under the receiver operating characteristic curve. Commun. Stat. Simul. Comput. 2020, 1–14. [Google Scholar] [CrossRef]
  10. Su, J.Q.; Liu, J.S. Linear combinations of multiple diagnostic markers. J. Am. Stat. Assoc. 1993, 88, 1350–1355. [Google Scholar] [CrossRef]
  11. Yan, L.; Tian, L.; Liu, S. Combining large number of weak biomarkers based on AUC. Stat. Med. 2015, 34, 3811–3830. [Google Scholar] [CrossRef] [Green Version]
  12. Xu, T.; Fang, Y.; Rong, A.; Wang, J. Flexible combination of multiple diagnostic biomarkers to improve diagnostic accuracy. BMC Med. Res. Methodol. 2015, 15, 1–7. [Google Scholar] [CrossRef] [Green Version]
  13. Nigmatullin, R.R. The statistics of the fractional moments: Is there any chance to “read quantitatively” any randomness? Signal Process. 2006, 86, 2529–2547. [Google Scholar] [CrossRef]
  14. Nigmatullin, R.R.; Lino, P.; Maione, G. New Digital Signal Processing Methods; Springer Publishing: New York, NY, USA, 2020. [Google Scholar]
  15. Pepe, M.S.; Thompson, M.L. Combining diagnostic test results to increase accuracy. Biostatistics 2000, 1, 123–140. [Google Scholar] [CrossRef] [PubMed]
  16. Pepe, M.S.; Cai, T.; Longton, G. Combining predictors for classification using the area under the receiver operating characteristic curve. Biometrics 2006, 62, 221–229. [Google Scholar] [CrossRef] [PubMed]
  17. Hanley, J.A.; McNeil, B.J. The meaning and use of the area under a receiver operating characteristic (ROC) curve. Radiology 1982, 143, 29–36. [Google Scholar] [CrossRef] [Green Version]
  18. Esteban, L.M.; Sanz, G.; Borque, A. A step-by-step algorithm for combining diagnostic tests. J. Appl. Stat. 2011, 38, 899–911. [Google Scholar] [CrossRef]
  19. Kang, L.; Xiong, C.; Crane, P.; Tian, L. Linear combinations of biomarkers to improve diagnostic accuracy with three ordinal diagnostic categories. Stat. Med. 2013, 32, 631–643. [Google Scholar] [CrossRef] [Green Version]
  20. Kang, L.; Liu, A.; Tian, L. Linear combination methods to improve diagnostic/prognostic accuracy on future observations. Stat. Methods Med. Res. 2016, 25, 1359–1380. [Google Scholar] [CrossRef] [Green Version]
  21. Liu, C.; Liu, A.; Halabi, S. A min–max combination of biomarkers to improve diagnostic accuracy. Stat. Med. 2011, 30, 2005–2014. [Google Scholar] [CrossRef] [Green Version]
  22. Yin, J.; Tian, L. Optimal linear combinations of multiple diagnostic biomarkers based on Youden index. Stat. Med. 2014, 33, 1426–1440. [Google Scholar] [CrossRef]
  23. Liu, A.; Schisterman, E.F.; Zhu, Y. On linear combinations of biomarkers to improve diagnostic accuracy. Stat. Med. 2005, 24, 37–47. [Google Scholar] [CrossRef]
  24. Yin, J.; Tian, L. Joint inference about sensitivity and specificity at the optimal cut-off point associated with Youden index. Comput. Stat. Data Anal. 2014, 77, 1–13. [Google Scholar] [CrossRef]
  25. Yin, J.; Tian, L. Joint confidence region estimation for area under ROC curve and Youden index. Stat. Med. 2014, 33, 985–1000. [Google Scholar] [CrossRef]
  26. Ma, H.; Halabi, S.; Liu, A. On the use of min-max combination of biomarkers to maximize the partial area under the ROC curve. J. Probab. Stat. 2019, 8953530. [Google Scholar] [CrossRef] [Green Version]
  27. Yu, W.; Park, T. Two simple algorithms on linear combination of multiple biomarkers to maximize partial area under the ROC curve. Comput. Stat. Data Anal. 2015, 88, 15–27. [Google Scholar] [CrossRef]
  28. Yan, Q.; Bantis, L.E.; Stanford, J.L.; Feng, Z. Combining multiple biomarkers linearly to maximize the partial area under the ROC curve. Stat. Med. 2018, 37, 627–642. [Google Scholar] [CrossRef]
  29. Perkins, N.J.; Schisterman, E.F. The inconsistency of “optimal” cutpoints obtained using two criteria based on the receiver operating characteristic curve. Am. J. Epidemiol. 2006, 163, 670–675. [Google Scholar] [CrossRef] [Green Version]
  30. Friedman, J.; Hastie, T.; Tibshirani, R. The Elements of Statistical Learning; Springer Series in Statistics; Springer: New York, NY, USA, 2009; pp. 219–259. [Google Scholar]
  31. R Core Team. R: A Language and Environment for Statistical Computing; R Foundation for Statistical Computing: Vienna, Austria, 2020; Available online: http://www.r-project.org/index.html (accessed on 20 September 2021).
  32. Walker, S.H.; Duncan, D.B. Estimation of the probability of an event as a function of several independent variables. Biometrika 1967, 54, 167–179. [Google Scholar] [CrossRef]
  33. Mohamed, K.; Appleton, R.; Nicolaides, P. Delayed diagnosis of Duchenne muscular dystrophy. Eur. J. Paediatr. Neurol. 2000, 4, 219–223. [Google Scholar] [CrossRef]
  34. Percy, M.E.; Andrews, D.F.; Thompson, M.W. Duchenne muscular dystrophy carrier detection using logistic discrimination: Serum creatine kinase, hemopexin, pyruvate kinase, and lactate dehydrogenase in combination. Am. J. Med. Genet. A 1982, 13, 27–38. [Google Scholar] [CrossRef]
  35. Savirón-Cornudella, R.; Esteban, L.M.; Aznar-Gimeno, R.; Dieste-Pérez, P.; Pérez-López, F.R.; Campillos, J.M.; Castán-Larraz, B.; Sanz, G.; Tajada-Duaso, M. Prediction of Late-Onset Small for Gestational Age and Fetal Growth Restriction by Fetal Biometry at 35 Weeks and Impact of Ultrasound–Delivery Interval: Comparison of Six Fetal Growth Standards. J. Clin. Med. 2021, 10, 2984. [Google Scholar] [CrossRef]
  36. Savirón-Cornudella, R.; Esteban, L.M.; Tajada-Duaso, M.; Castán-Mateo, S.; Dieste-Pérez, P.; Cotaina-Gracia, L.; Lerma-Puertas, D.; Sanz, G.; Pérez-López, F.R. Detection of Adverse Perinatal Outcomes at Term Delivery Using Ultrasound Estimated Percentile Weight at 35 Weeks of Gestation: Comparison of Five Fetal Growth Standards. Fetal Diagn. Ther. 2020, 47, 104–114. [Google Scholar] [CrossRef] [PubMed]
  37. Pinsky, P.F.; Zhu, C.S. Building multi-marker algorithms for disease prediction—The role of correlations among markers. Biomark. Insights 2011, 6, BMI-S7513. [Google Scholar] [CrossRef] [PubMed]
  38. Ma, S.; Huang, J. Combining multiple markers for classification using ROC. Biometrics 2007, 63, 751–757. [Google Scholar] [CrossRef] [PubMed]
  39. Wang, Z.; Chang, Y.; Ying, Z.; Zhu, L.; Yang, Y. A parsimonious threshold-independent protein feature selection method through the area under receiver operating characteristic curve. Bioinformatics 2007, 23, 2788–2794. [Google Scholar] [CrossRef] [Green Version]
  40. Komori, O.; Eguchi, S. A boosting method for maximizing the partial area under the ROC curve. BMC Bioinform. 2010, 11, 314. [Google Scholar] [CrossRef] [Green Version]
Figure 1. Information from DMD dataset.
Mathematics 09 02497 g001
Figure 2. Information from SGA dataset.
Mathematics 09 02497 g002
Table 1. Mean and standard deviation maximum Youden indices for 1000 random samples: normal distributions. Different means between biomarkers.
Size ( n 1 , n 2 )Four BiomarkersTen Biomarkers
LRMMMMMMMIQRLRMMMMMMMIQR
Independence ( Σ 1 = Σ 2 = I )
Resubstitution method
(30, 30)0.6057 (0.0957)0.5556 (0.0962)0.6177 (0.0884)0.6126 (0.0877)0.9995 (0.0055)0.8736 (0.0563)0.9621 (0.0338)0.9580 (0.0356)
(100, 100)0.5412 (0.0538)0.4837 (0.0526)0.5300 (0.0523)0.5244 (0.0529)0.9855 (0.0192)0.8390 (0.0363)0.9370 (0.0241)0.9318 (0.0264)
(500, 500)0.5120 (0.0262)0.4447 (0.0270)0.4808 (0.0254)0.4752 (0.0252)0.9589 (0.0088)0.8155 (0.0180)0.9173 (0.0125)0.9163 (0.0125)
Based on CV
(30, 30)0.5199 (0.1101)0.454 (0.1241)0.4508 (0.1257)0.4423 (0.1242)0.8814 (0.0779)0.7906 (0.097)0.7791 (0.1168)0.7574 (0.1315)
(100, 100)0.5156 (0.0565)0.4311 (0.0675)0.4425 (0.0725)0.4326 (0.0748)0.9176 (0.0315)0.7988 (0.0563)0.8484 (0.0692)0.8253 (0.0855)
(500, 500)0.507 (0.0266)0.4261 (0.0320)0.4484 (0.0333)0.4366 (0.0354)0.9496 (0.0092)0.8027 (0.0224)0.8897 (0.0262)0.8833 (0.0318)
Medium correlation ( Σ 1 = Σ 2 = 0.5 · I + 0.5 · J )
Resubstitution method
(30, 30)0.5480 (0.0972)0.4610 (0.0936)0.5062 (0.0915)0.5074 (0.0908)0.9796 (0.0465)0.7344 (0.081)0.7642 (0.0741)0.7689 (0.0759)
(100, 100)0.4771 (0.0577)0.3821 (0.0545)0.4041 (0.0537)0.4043 (0.0536)0.9046 (0.0327)0.6807 (0.0471)0.6956 (0.0454)0.7020 (0.0450)
(500, 500)0.4428 (0.0273)0.3320 (0.0271)0.3420 (0.0268)0.3410 (0.0267)0.8734 (0.0149)0.6491 (0.0223)0.6558 (0.0218)0.6634 (0.0223)
Based on CV
(30, 30)0.4526 (0.1134)0.3544 (0.1242)0.3347 (0.1284)0.3331 (0.1263)0.7620 (0.0982)0.6642 (0.1007)0.6184 (0.1230)0.6102 (0.1215)
(100, 100)0.4482 (0.0627)0.3294 (0.0689)0.3204 (0.0733)0.3177 (0.0737)0.8472 (0.0347)0.6481 (0.0544)0.6256 (0.0748)0.6251 (0.0704)
(500, 500)0.4374 (0.0272)0.3153 (0.0300)0.3108 (0.0329)0.3075 (0.0352)0.8636 (0.0151)0.6385 (0.0241)0.6374 (0.0263)0.6350 (0.0320)
Different correlation ( Σ 1 = 0.3 · I + 0.7 · J , Σ 2 = 0.7 · I + 0.3 · J )
Resubstitution method
(30, 30)0.5512 (0.0973)0.5106 (0.0919)0.5500 (0.0846)0.5506 (0.0863)0.9831 (0.0392)0.6493 (0.0832)0.6939 (0.0799)0.6925 (0.0802)
(100, 100)0.4809 (0.0559)0.4374 (0.0546)0.4524 (0.0529)0.4543 (0.0531)0.9064 (0.0336)0.5918 (0.0504)0.6244 (0.0494)0.6230 (0.0495)
(500, 500)0.4441 (0.0270)0.3912 (0.0267)0.3969 (0.0264)0.3981 (0.0267)0.8768 (0.0154)0.5574 (0.0240)0.5802 (0.0242)0.5796 (0.0241)
Based on CV
(30, 30)0.4579 (0.1080)0.4029 (0.1202)0.3832 (0.1246)0.3825 (0.1247)0.7696 (0.0976)0.5260 (0.1227)0.4965 (0.1265)0.4960 (0.1239)
(100, 100)0.4579 (0.0602)0.3848 (0.0691)0.3764 (0.0741)0.3773 (0.0723)0.8477 (0.0331)0.5188 (0.0805)0.5208 (0.0789)0.5208 (0.0809)
(500, 500)0.4391 (0.0270)0.3738 (0.0329)0.3737 (0.0320)0.3703 (0.0318)0.8669 (0.0163)0.5233 (0.0395)0.5375 (0.0400)0.5359 (0.0408)
Negative Correlation ( ρ = 0.1 )
Resubstitution method
(30, 30)0.6563 (0.0914)0.5997 (0.0893)0.6749 (0.0835)0.6683 (0.0830)
(100, 100)0.6030 (0.0527)0.5321 (0.0534)0.5966 (0.0501)0.5888 (0.0512)
(500, 500)0.5740 (0.0239)0.4947 (0.0251)0.5490 (0.0242)0.5429 (0.0259)
Based on CV
(30, 30)0.5799 (0.1040)0.4950 (0.1203)0.5025 (0.1206)0.4986 (0.1219)
(100, 100)0.5820 (0.0528)0.4861 (0.0686)0.5133 (0.0708)0.4999 (0.0711)
(500, 500)0.5688 (0.0245)0.4787 (0.0302)0.5213 (0.0311)0.5052 (0.0365)
Table 2. Mean and standard deviation maximum Youden indices for 1000 random samples: normal distributions. Same means between biomarkers.
Size ( n 1 , n 2 )Four BiomarkersTen Biomarkers
LRMMMMMMMIQRLRMMMMMMMIQR
Independence ( Σ 1 = Σ 2 = I )
Resubstitution method
(30, 30)0.7664 (0.082 )0.7396 (0.0803)0.7987 (0.0702)0.7951 (0.0709)0.9893 (0.0319)0.8391 (0.0642)0.9382 (0.0436)0.9359 (0.0439)
(100, 100)0.7182 (0.0456)0.6889 (0.0464)0.7377 (0.0435)0.7342 (0.0443)0.9257 (0.032 )0.8013 (0.0389)0.9051 (0.0300)0.9037 (0.0302)
(500, 500)0.6964 (0.0213)0.6606 (0.0222)0.7014 (0.0207)0.6991 (0.0216)0.8981 (0.0138)0.7742 (0.0192)0.8813 (0.0147)0.8810 (0.0147)
Based on CV
(30, 30)0.6907 (0.0908)0.6550 (0.1082)0.6402 (0.1125)0.6403 (0.1127)0.7932 (0.0973)0.7337 (0.1152)0.7473 (0.1187)0.7593 (0.1223)
(100, 100)0.6977 (0.0476)0.6432 (0.0623)0.6607 (0.0653)0.6526 (0.0667)0.8667 (0.0309)0.7377 (0.0716)0.8222 (0.0701)0.8127 (0.0762)
(500, 500)0.6921 (0.0216)0.6441 (0.0267)0.6749 (0.0282)0.6632 (0.0331)0.8886 (0.0141)0.7489 (0.0330)0.8514 (0.0300)0.8494 (0.0299)
Medium correlation ( Σ 1 = Σ 2 = 0.5 · I + 0.5 · J )
Resubstitution method
(30, 30)0.5884 (0.0990)0.5926 (0.0919)0.6344 (0.0876)0.6350 (0.0870)0.6769 (0.0949)0.6095 (0.0882)0.6545 (0.0842)0.6538 (0.0838)
(100, 100)0.5236 (0.0539)0.5309 (0.0526)0.5526 (0.0511)0.5514 (0.0510)0.5693 (0.0534)0.5476 (0.0507)0.5751 (0.0506)0.5735 (0.0505)
(500,500)0.4901 (0.0264)0.4884 (0.0258)0.5012 (0.0253)0.5001 (0.0252)0.5213 (0.0255)0.5069 (0.0250)0.5255 (0.0247)0.5243 (0.0246)
Based on CV
(30, 30)0.4972 (0.1124)0.4898 (0.1160)0.4681 (0.1240)0.4710 (0.1224)0.4466 (0.1144)0.4931 (0.1296)0.4648 (0.1263)0.4592 (0.1263)
(100, 100)0.4945 (0.0597)0.4777 (0.0667)0.4729 (0.0690)0.4714 (0.0694)0.4974 (0.0603)0.4798 (0.0779)0.4724 (0.0789)0.4668 (0.0813)
(500, 500)0.4853 (0.0261)0.4706 (0.0320)0.4693 (0.0316)0.4673 (0.0314)0.5063 (0.0262)0.4771 (0.0386)0.4801 (0.0388)0.4775 (0.0394)
Different correlation ( Σ 1 = 0.3 · I + 0.7 · J , Σ 2 = 0.7 · I + 0.3 · J )
Resubstitution method
(30, 30)0.5914 (0.0983)0.6782 (0.0846)0.7057 (0.0791)0.7074 (0.0807)0.6799 (0.0914)0.7900 (0.0726)0.8090 (0.0683)0.8149 (0.0683)
(100, 100)0.5304 (0.0546)0.6211 (0.0497)0.6325 (0.0482)0.6348 (0.0485)0.5769 (0.0535)0.7425 (0.0434)0.7502 (0.0425)0.7559 (0.0427)
(500, 500)0.4989 (0.0260)0.5863 (0.0236)0.5902 (0.0232)0.5924 (0.0232)0.5355 (0.0254)0.7138 (0.0207)0.7169 (0.0205)0.7205 (0.0206)
Based on CV
(30, 30)0.5044 (0.1116)0.5861 (0.1118)0.5683 (0.1198)0.5682 (0.1200)0.4477 (0.1112)0.7076 (0.1053)0.6776 (0.1210)0.6624 (0.1144)
(100, 100)0.5028 (0.0570)0.5771 (0.0630)0.5722 (0.0673)0.5711 (0.0650)0.5060 (0.0613)0.7007 (0.0585)0.6982 (0.0637)0.6770 (0.0664)
(500, 500)0.4948 (0.0263)0.5724 (0.0279)0.5734 (0.0265)0.5707 (0.0275)0.5355 (0.0260)0.7006 (0.0251)0.7025 (0.0237)0.6924 (0.0293)
Different correlation ( Σ 1 = 0.5 · I + 0.5 · J , Σ 2 = I )
Resubstitution method
(30, 30)0.6681 (0.0867)0.7046 (0.0796)0.7427 (0.0755)0.7421 (0.0753)0.7978 (0.0891)0.8035 (0.0703)0.8426 (0.0647)0.8442 (0.0649)
(100, 100)0.6181 (0.0506)0.6548 (0.0483)0.6796 (0.0473)0.6795 (0.0476)0.7308 (0.0469)0.7601 (0.0417)0.7919 (0.0397)0.7927 (0.0394)
(500, 500)0.5930 (0.0245)0.6222 (0.0228)0.6401 (0.0229)0.6399 (0.0228)0.7050 (0.0216)0.7322 (0.0200)0.7612 (0.0190)0.7608 (0.0190)
Based on CV
(30, 30)0.5851 (0.1049)0.6054 (0.1136)0.5939 (0.1178)0.5990 (0.1185)0.5714 (0.1025)0.6864 (0.1192)0.6797 (0.1288)0.6841 (0.1263)
(100, 100)0.5940 (0.0530)0.6076 (0.0624)0.6144 (0.0645)0.6167 (0.0630)0.6742 (0.0510)0.6996 (0.0712)0.7113 (0.0743)0.7081 (0.0764)
(500, 500)0.5894 (0.0248)0.6060 (0.0274)0.6194 (0.0275)0.6192 (0.0279)0.6954 (0.0222)0.7114 (0.0292)0.7286 (0.0334)0.7286 (0.0335)
Table 3. Mean and standard deviation maximum Youden indices for 1000 random samples: Non-normal distributions. Log-normal.
Size ( n 1 , n 2 )Four BiomarkersTen Biomarkers
LRMMMMMMMIQRLRMMMMMMMIQR
Different means. Medium correlation ( Σ 1 = Σ 2 = 0.5 · I + 0.5 · J )
Resubstitution method
(30, 30)0.5290 (0.1009)0.4506 (0.0988)0.5053 (0.0914)0.5076 (0.0915)0.9650 (0.0593)0.6969 (0.0853)0.7593 (0.0752)0.7624 (0.0755)
(100, 100)0.4594 (0.0588)0.3798 (0.0558)0.4036 (0.0537)0.4052 (0.0538)0.8765 (0.0378)0.6571 (0.0486)0.6905 (0.0459)0.6948 (0.0458)
(500, 500)0.4278 (0.0283)0.3323 (0.0270)0.3425 (0.0269)0.3428 (0.0269)0.8428 (0.0168)0.6319 (0.0231)0.6513 (0.0219)0.6552 (0.0221)
Based on CV
(30, 30)0.4272 (0.1230)0.3709 (0.1132)0.3344 (0.1241)0.3367 (0.1273)0.7254 (0.1006)0.6652 (0.1006)0.5902 (0.1203)0.5948 (0.1203)
(100, 100)0.4277 (0.0634)0.3348 (0.0660)0.3148 (0.0681)0.3172 (0.0675)0.8161 (0.0403)0.6420 (0.0556)0.5875 (0.0826)0.5947 (0.0776)
(500, 500)0.4220 (0.0282)0.3113 (0.0316)0.3054 (0.0342)0.3051 (0.0340)0.8320 (0.0176)0.6289 (0.0235)0.6029 (0.0452)0.6074 (0.0419)
Different means. Different Correlation ( Σ 1 = 0.3 · I + 0.7 · J , Σ 2 = 0.7 · I + 0.3 · J )
Resubstitution method
(30, 30)0.5139 (0.1018)0.5047 (0.0915)0.5423 (0.0853)0.5400 (0.0860)0.9614 (0.0577)0.6431 (0.0845)0.6901 (0.0803)0.6892 (0.0798)
(100, 100)0.4476 (0.0609)0.4318 (0.0544)0.4468 (0.0534)0.4470 (0.0534)0.8637 (0.0407)0.5847 (0.0506)0.6214 (0.0492)0.6206 (0.0493)
(500, 500)0.4157 (0.0286)0.3881 (0.0271)0.3934 (0.0269)0.3936 (0.0270)0.8304 (0.0176)0.5498 (0.0238)0.5770 (0.0242)0.5764 (0.0242)
Based on CV
(30, 30)0.4118 (0.1166)0.4063 (0.1183)0.3872 (0.1236)0.3925 (0.1243)0.7080 (0.1006)0.5195 (0.1189)0.5258 (0.1184)0.5329 (0.1180)
(100, 100)0.4161 (0.0628)0.3889 (0.0670)0.3760 (0.0712)0.3852 (0.0686)0.8001 (0.0409)0.5044 (0.0831)0.5308 (0.0747)0.5379 (0.0742)
(500, 500)0.4097 (0.0287)0.3761 (0.0294)0.3726 (0.0318)0.3751 (0.0303)0.8196 (0.0182)0.5195 (0.0402)0.5314 (0.0436)0.5412 (0.0385)
Same means. Medium correlation ( Σ 1 = Σ 2 = 0.5 · I + 0.5 · J )
Resubstitution method
(30, 30)0.5729 (0.1016)0.5911 (0.0924)0.6325 (0.0887)0.6331 (0.0881)0.6800 (0.1042)0.6058 (0.0900)0.6527 (0.0851)0.6523 (0.0843)
(100, 100)0.5103 (0.0549)0.5292 (0.0522)0.5520 (0.0514)0.5514 (0.0514)0.5538 (0.0549)0.5448 (0.0510)0.5736 (0.0505)0.5733 (0.0505)
(500, 500)0.4811 (0.0265)0.4873 (0.0258)0.5002 (0.0253)0.4995 (0.0253)0.5120 (0.0260)0.5056 (0.0252)0.5251 (0.0248)0.5242 (0.0247)
Based on CV
(30, 30)0.4867 (0.1111)0.4975 (0.1120)0.4767 (0.1181)0.4803 (0.1180)0.4316 (0.1182)0.4926 (0.1162)0.4866 (0.1182)0.4910 (0.1208)
(100, 100)0.4858 (0.0600)0.4693 (0.0667)0.4687 (0.0674)0.4717 (0.0684)0.4866 (0.0613)0.4669 (0.0766)0.4798 (0.0701)0.4827 (0.0714)
(500, 500)0.4779 (0.0266)0.4585 (0.0353)0.4626 (0.0334)0.4652 (0.0333)0.4997 (0.0263)0.4631 (0.0453)0.4800 (0.0421)0.4824 (0.0399)
Same means. Different Correlation ( Σ 1 = 0.3 · I + 0.7 · J , Σ 2 = 0.7 · I + 0.3 · J )
Resubstitution method
(30, 30)0.5445 (0.1042)0.6730 (0.0849)0.6990 (0.0802)0.6979 (0.0813)0.6437 (0.0957)0.7783 (0.0739)0.7988 (0.0708)0.7993 (0.0712)
(100, 100)0.4714 (0.0559)0.6172 (0.0499)0.6286 (0.0486)0.6291 (0.0486)0.5129 (0.0548)0.7292 (0.0446)0.7382 (0.0440)0.7393 (0.0442)
(500, 500)0.4365 (0.0265)0.5840 (0.0237)0.5880 (0.0235)0.5885 (0.0235)0.4590 (0.0259)0.7010 (0.0206)0.7050 (0.0205)0.7057 (0.0205)
Based on CV
(30, 30)0.4525 (0.1149)0.5914 (0.1127)0.5753 (0.1167)0.5866 (0.1154)0.4020 (0.1141)0.7084 (0.1008)0.6903 (0.1066)0.7007 (0.1006)
(100, 100)0.4472 (0.0576)0.5854 (0.0589)0.5744 (0.0630)0.5819 (0.0596)0.4386 (0.0621)0.6977 (0.0558)0.6904 (0.0592)0.6949 (0.0567)
(500, 500)0.4324 (0.0271)0.5744 (0.0257)0.5723 (0.0264)0.5743 (0.0254)0.4435 (0.0264)0.6917 (0.0229)0.6905 (0.0234)0.6916 (0.0234)
Same means. Different Correlation ( Σ 1 = 0.5 · I + 0.5 · J , Σ 2 = I )
Resubstitution method
(30, 30)0.5932 (0.0974)0.6942 (0.0825)0.7296 (0.0787)0.7287 (0.0789)0.7222 (0.0960)0.7924 (0.0738)0.8340 (0.0669)0.8334 (0.0669)
(100, 100)0.5248 (0.0543)0.6477 (0.0503)0.6712 (0.0484)0.6708 (0.0486)0.6206 (0.0524)0.7506 (0.0423)0.7850 (0.0408)0.7844 (0.0406)
(500, 500)0.4966 (0.0268)0.6188 (0.0238)0.6350 (0.0231)0.6347 (0.0231)0.5770 (0.0250)0.7276 (0.0206)0.7560 (0.0195)0.7556 (0.0195)
Based on CV
(30, 30)0.5074 (0.1089)0.6123 (0.1107)0.6031 (0.1127)0.6187 (0.1085)0.4840 (0.1158)0.7215 (0.1004)0.7031 (0.1135)0.7261 (0.1033)
(100, 100)0.5006 (0.0566)0.6182 (0.0557)0.6138 (0.0625)0.6256 (0.0577)0.5474 (0.0565)0.7286 (0.0508)0.7178 (0.0687)0.7365 (0.0565)
(500, 500)0.4918 (0.0270)0.6100 (0.0249)0.6141 (0.0293)0.6198 (0.0255)0.5619 (0.0258)0.7221 (0.0217)0.7310 (0.0304)0.7399 (0.0237)
Table 4. Mean and standard deviation maximum Youden indices for 1000 random samples. High-dimensional scenarios ( p = 100 ): Normal distributions. Same means between biomarkers.
Independence ( Σ 1 = Σ 2 = I )
Size ( n 1 , n 2 )LRMMMMMMMIQR
Resubstitution method
(30, 30)1 (0)0.4364 (0.094)0.7358 (0.077)0.7307 (0.0785)
Based on CV
(30, 30)0.1684 (0.0952)0.2602 (0.1084)0.4577 (0.1372)0.4527 (0.1391)
Different correlation ( Σ 1 = 0.5 · I + 0.5 · J , Σ 2 = I )
Size ( n 1 , n 2 )LRMMMMMMMIQR
Resubstitution method
(30, 30)1 (0)0.9121 (0.0518)0.9277 (0.047)0.9308 (0.0459)
Based on CV
(30, 30)0.1568 (0.0912)0.8433 (0.0718)0.807 (0.1226)0.7067 (0.1477)
Table 5. Maximum Youden index for each method. DMD dataset.
MethodsResubstitution MethodBased on CV
YoudenSensitivitySpecificityYoudenSensitivitySpecificity
LR0.81060.86570.94490.79480.86570.9291
MM0.73350.83580.89760.56020.83580.7244
MMM0.80190.88060.92130.64720.68660.9606
MMIQR0.79480.86570.92910.55350.67160.8819
The results rounded to four decimal places are displayed.
Table 6. Maximum Youden index for each method. SGA dataset.
MethodsResubstitution MethodBased on CV
YoudenSensitivitySpecificityYoudenSensitivitySpecificity
LR0.59710.76390.83320.59010.76870.8214
MM0.16310.91080.25230.14220.65540.4868
MMM0.36920.69880.67040.34000.73730.6026
MMIQR0.36440.73730.62700.23220.64100.5913
Publisher’s Note: MDPI stays neutral with regard to jurisdictional claims in published maps and institutional affiliations.

