
A Vine Copula-Based Global Sensitivity Analysis Method for Structures with Multidimensional Dependent Variables

Abstract
:1. Introduction
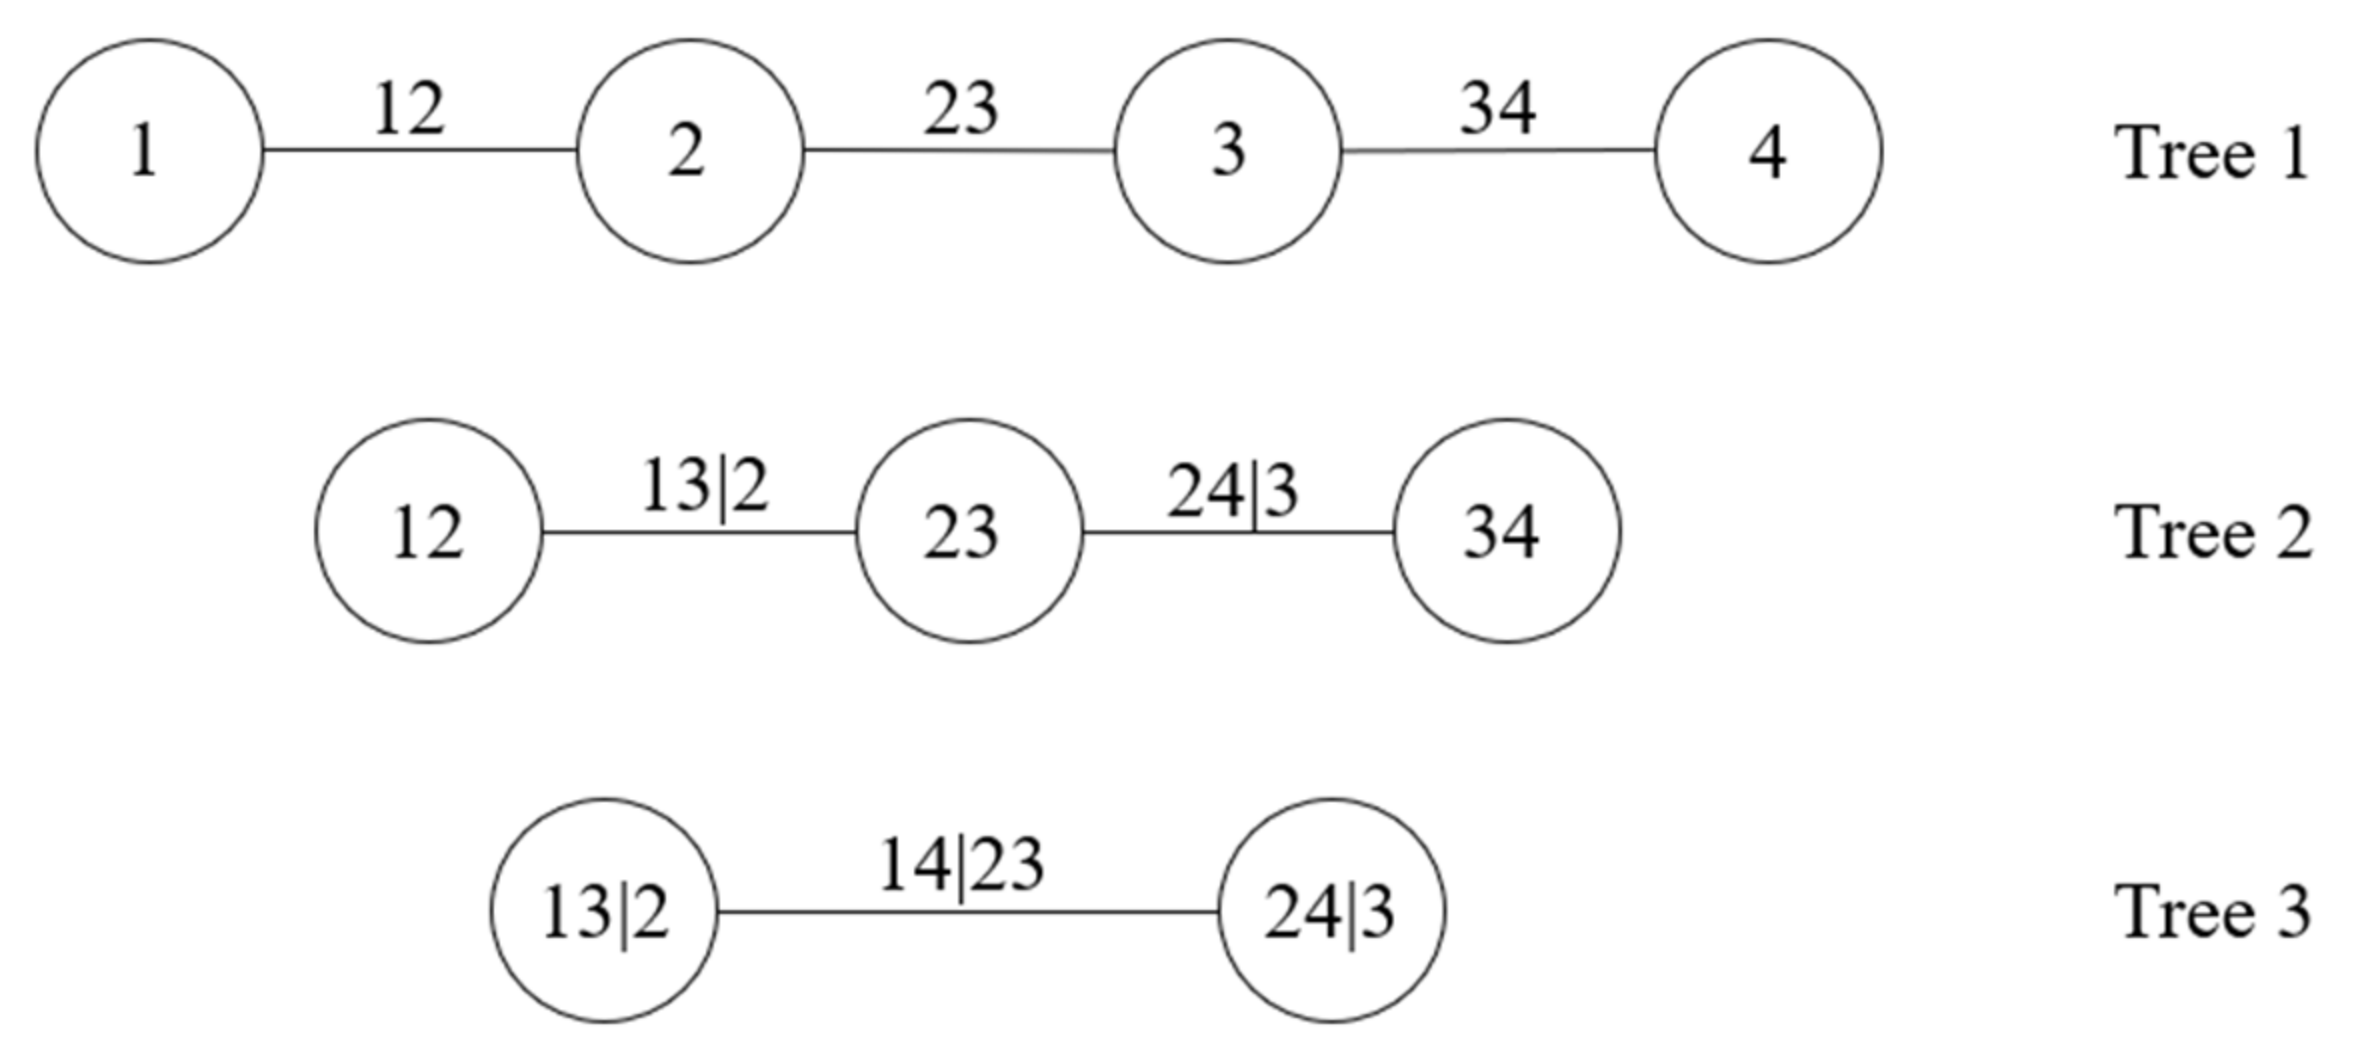
2. Vine Copula
3. Variance-Based GSA Based on Vine Copula
- Generate two independent vectors, and , uniformly distributed between 0 and 1;
- Let , and obtain ;
- Let , and obtain , ;
- Let , and obtain , ;
- Take the iteration repeatedly, and get a group of unconditional samples .
4. Test Cases
4.1. Test 1. Example with Complete Probability Information
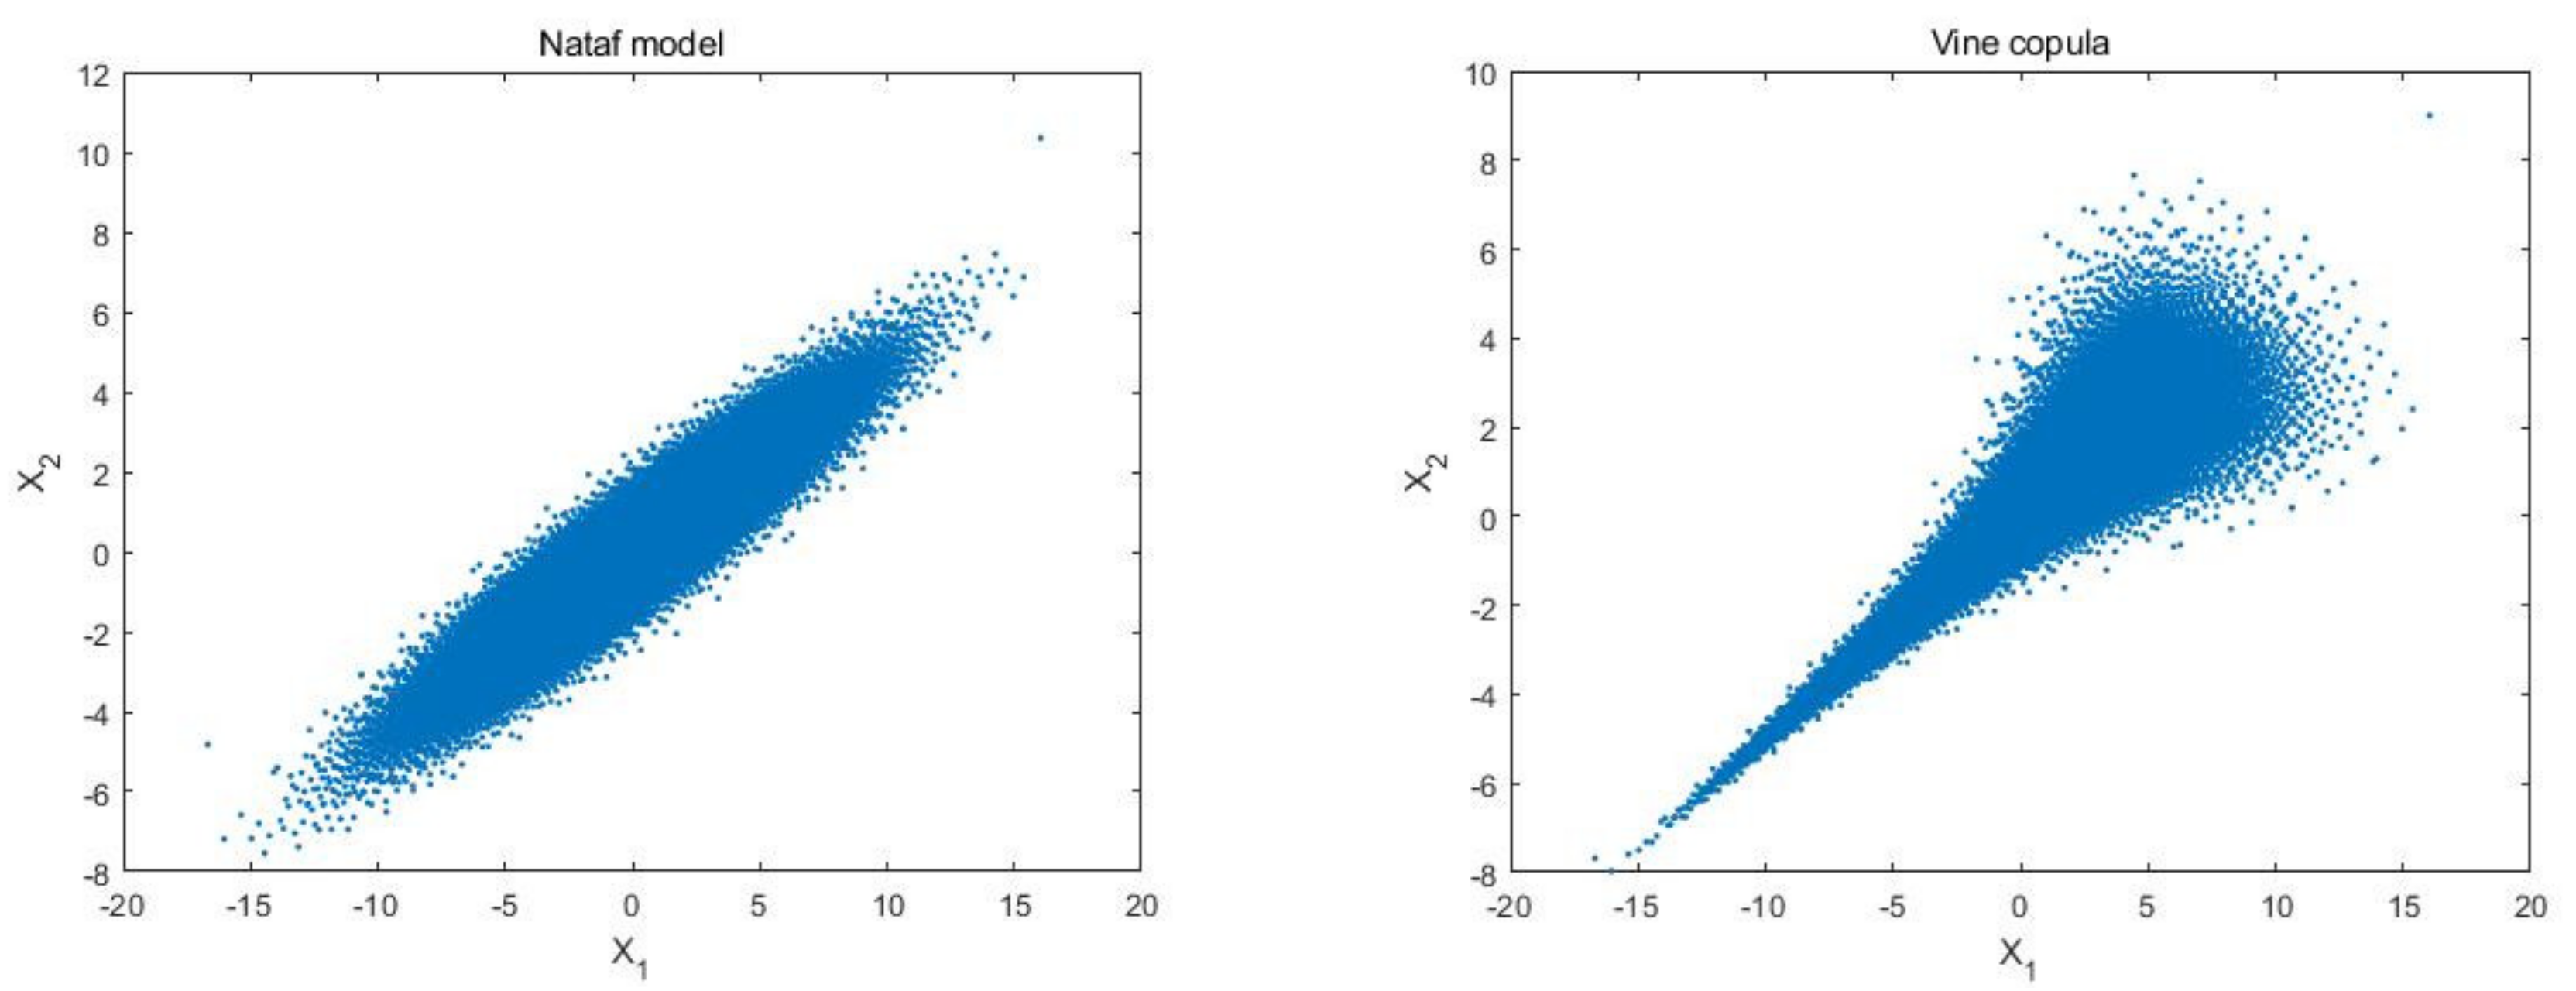
4.2. Test 2. Portfolio Model
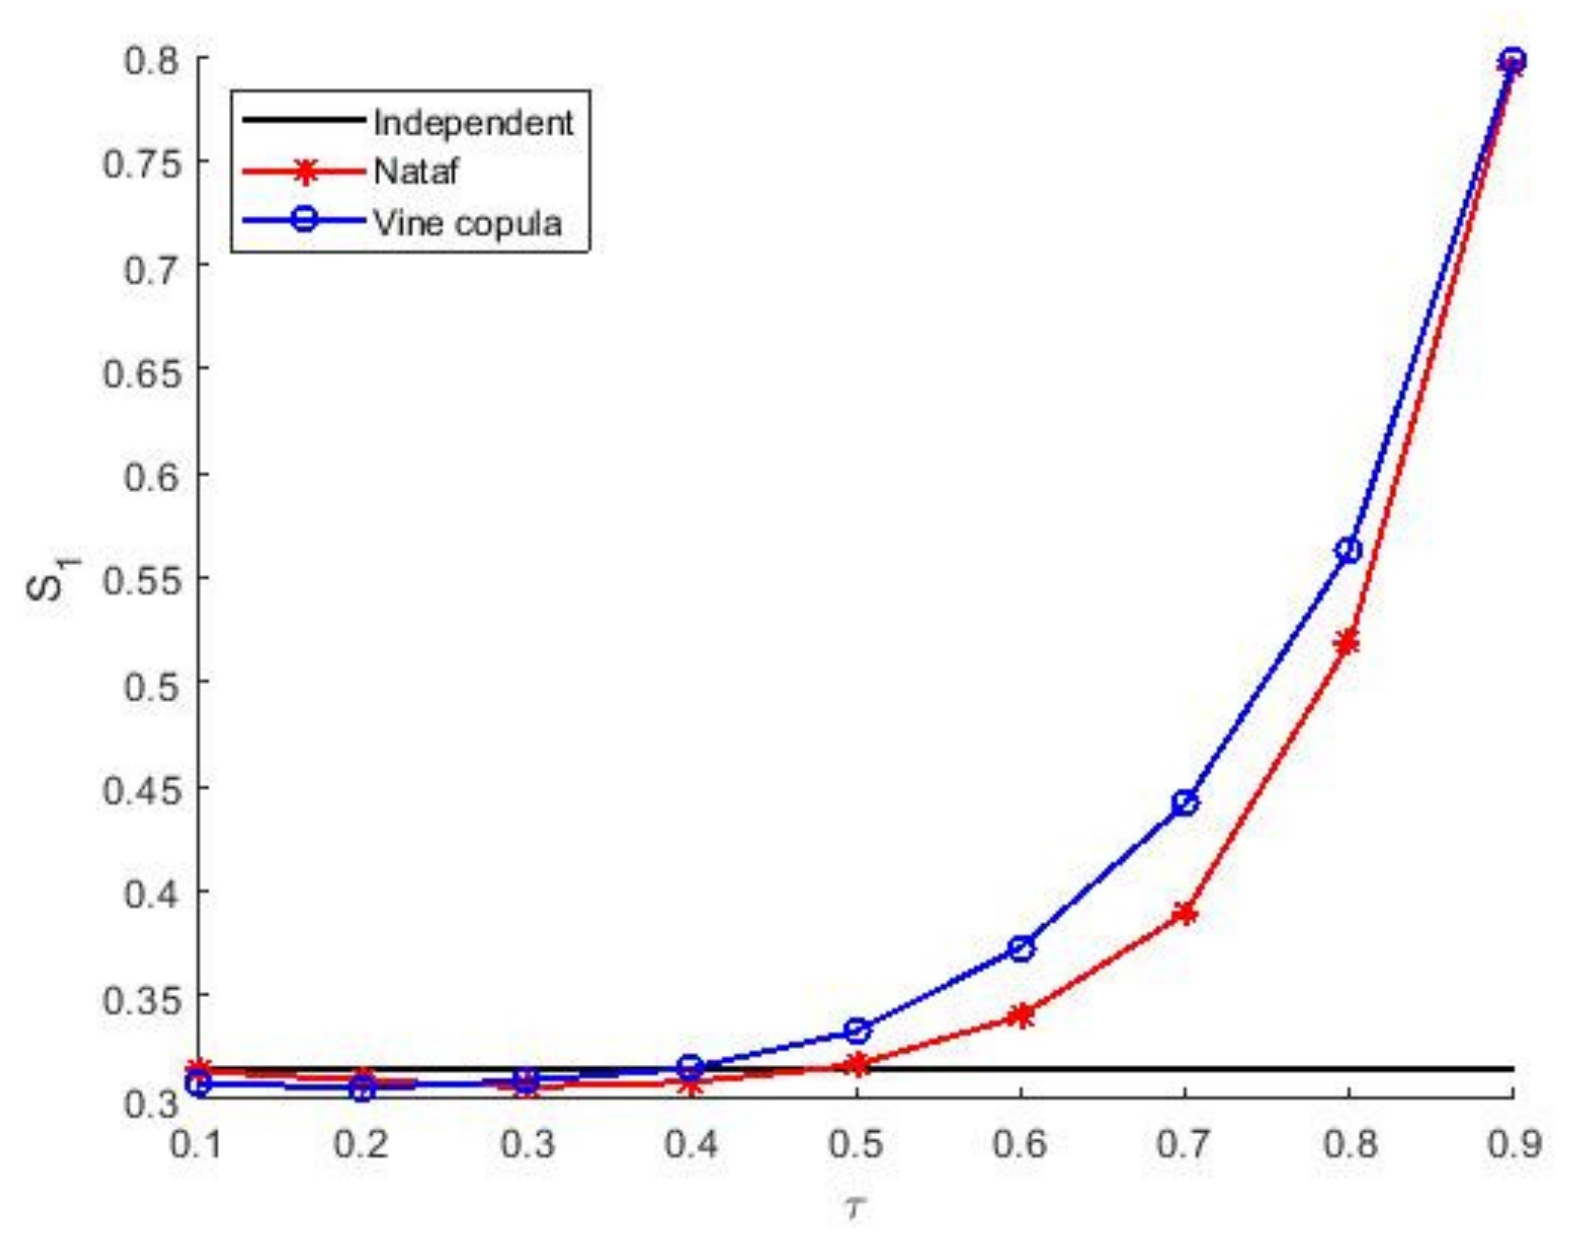
4.3. Test 3. Ishigami Function
4.4. Test 4. Fatigue and Creep of Materials
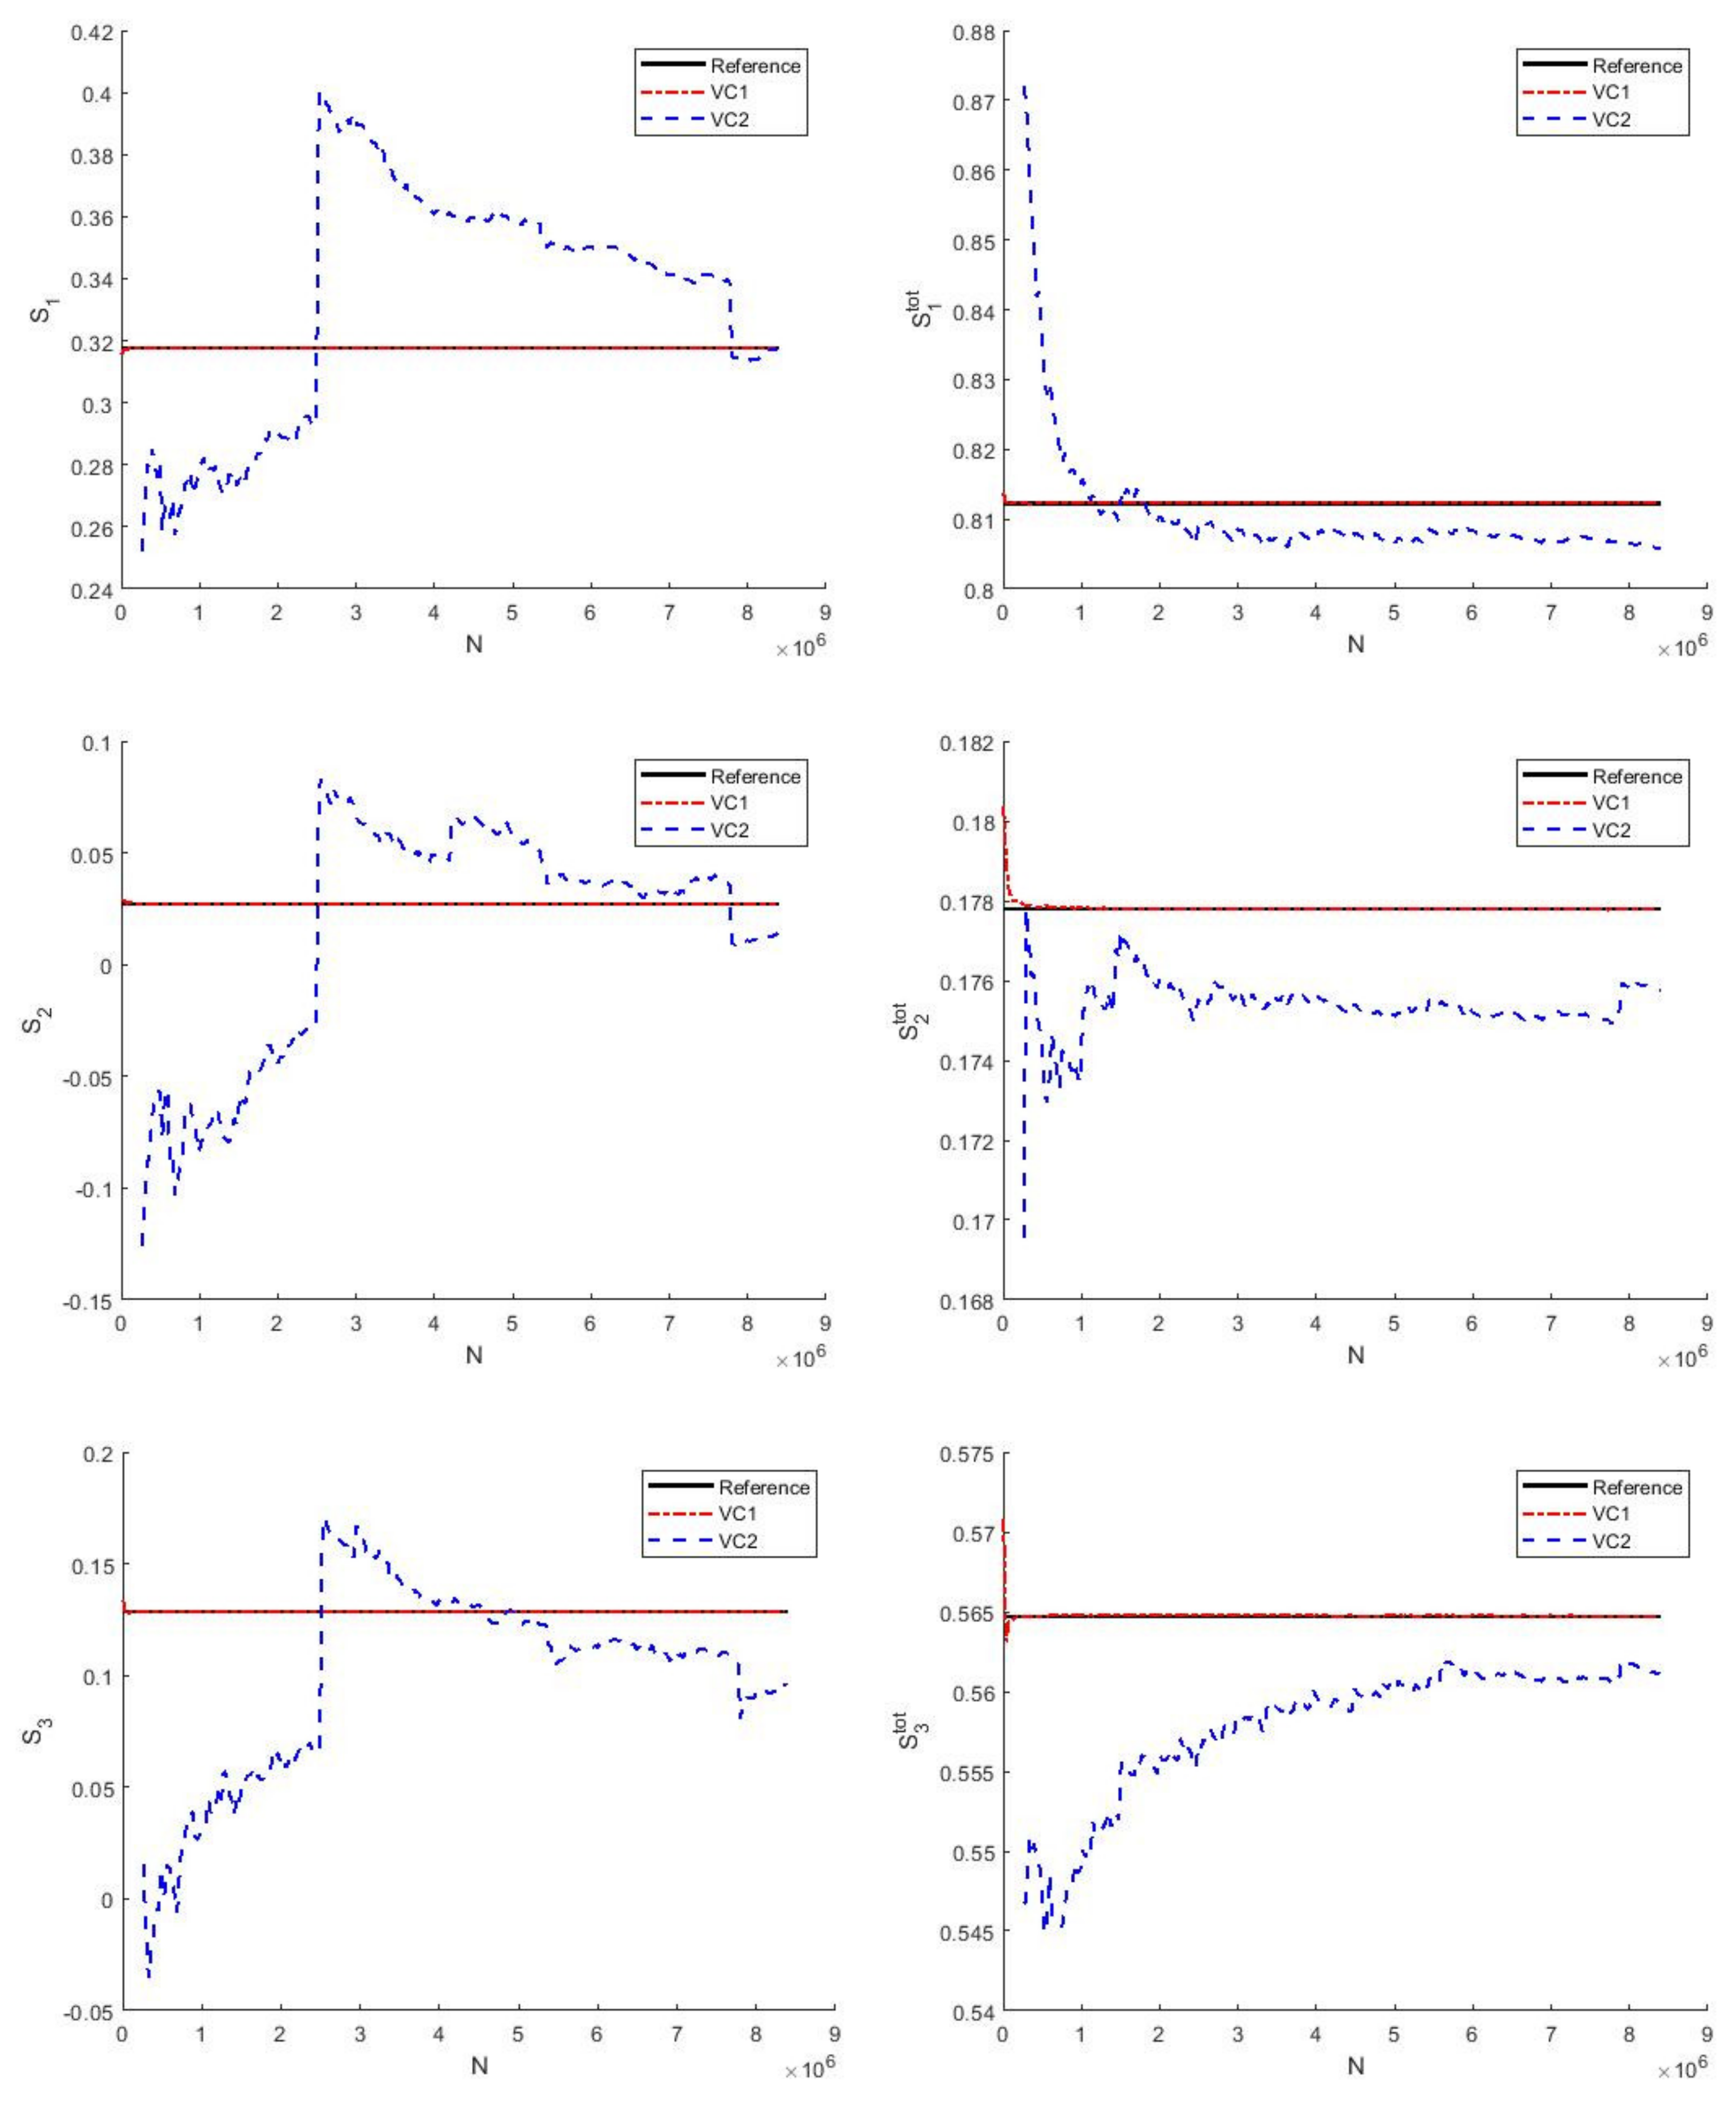
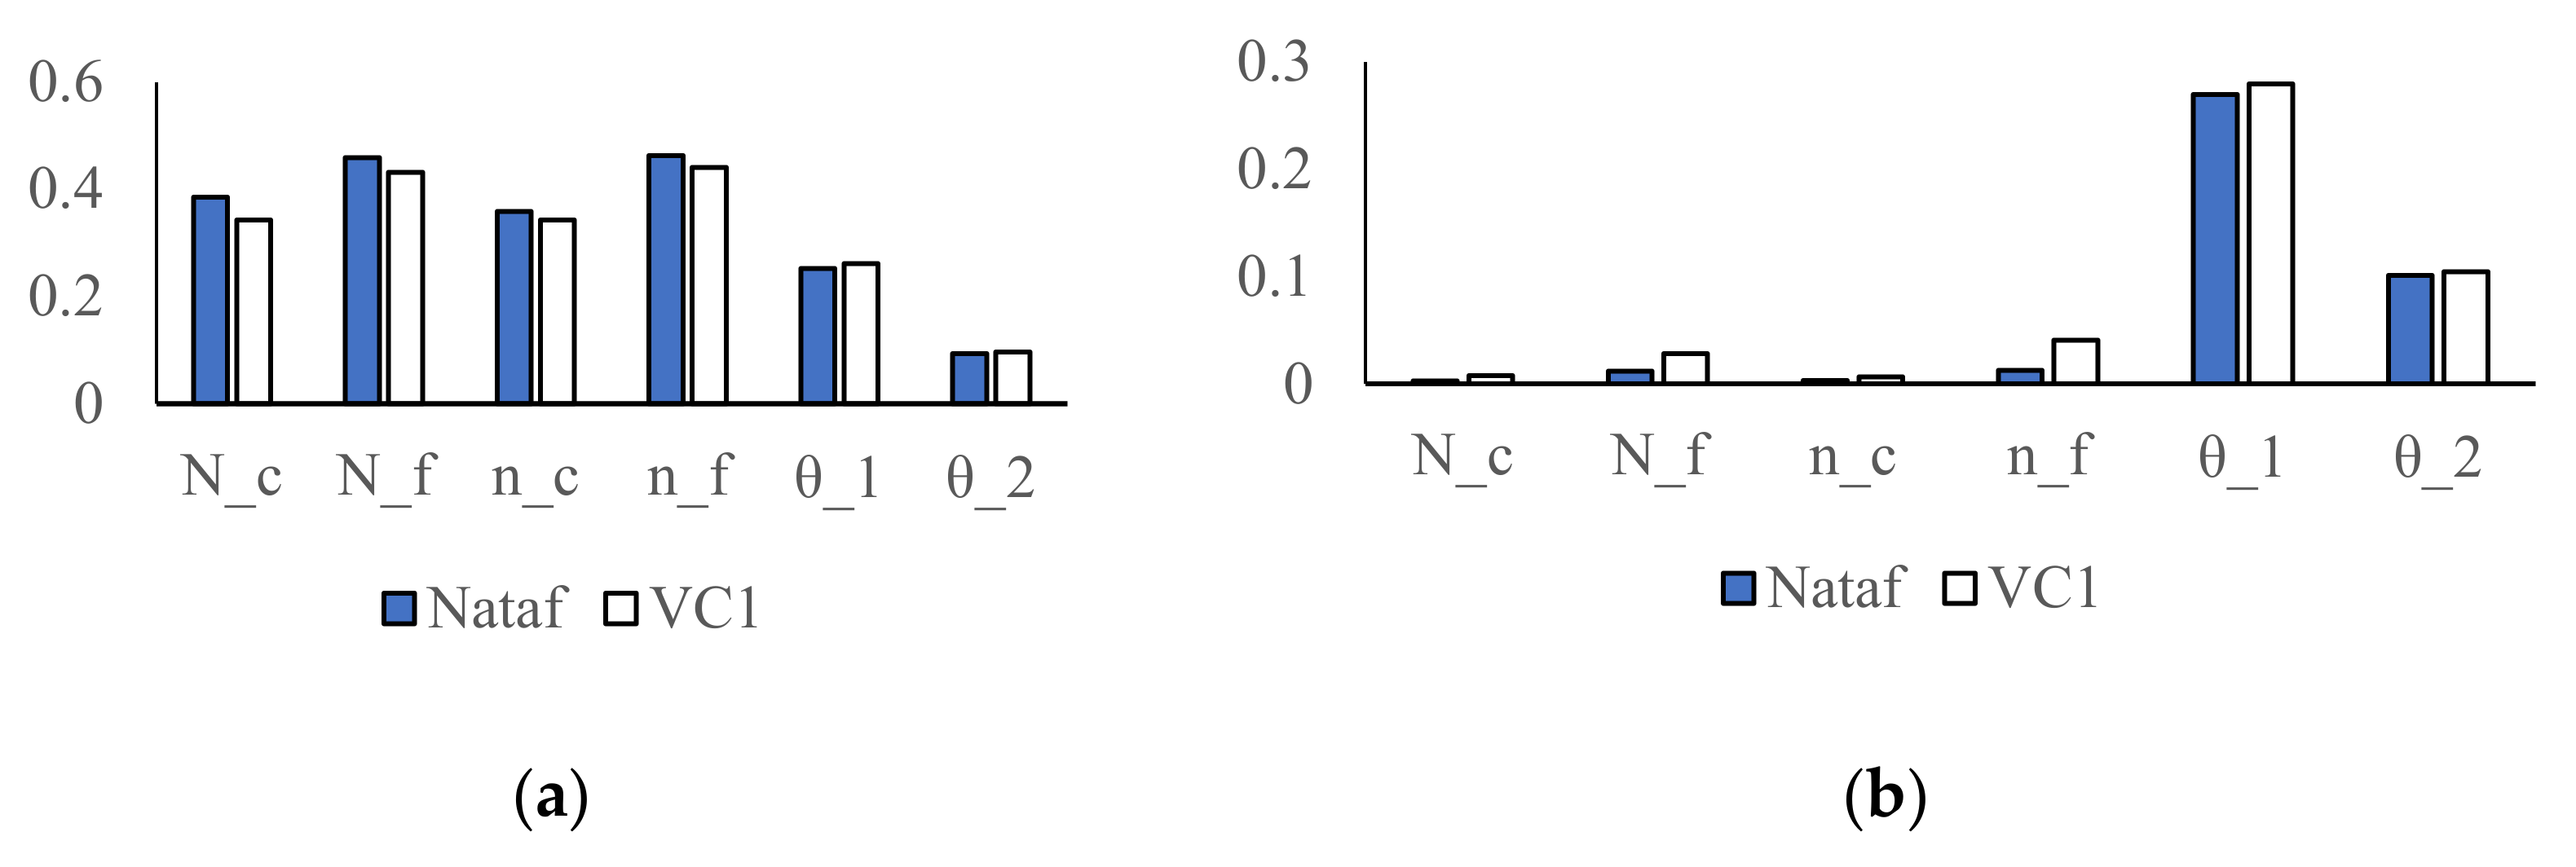
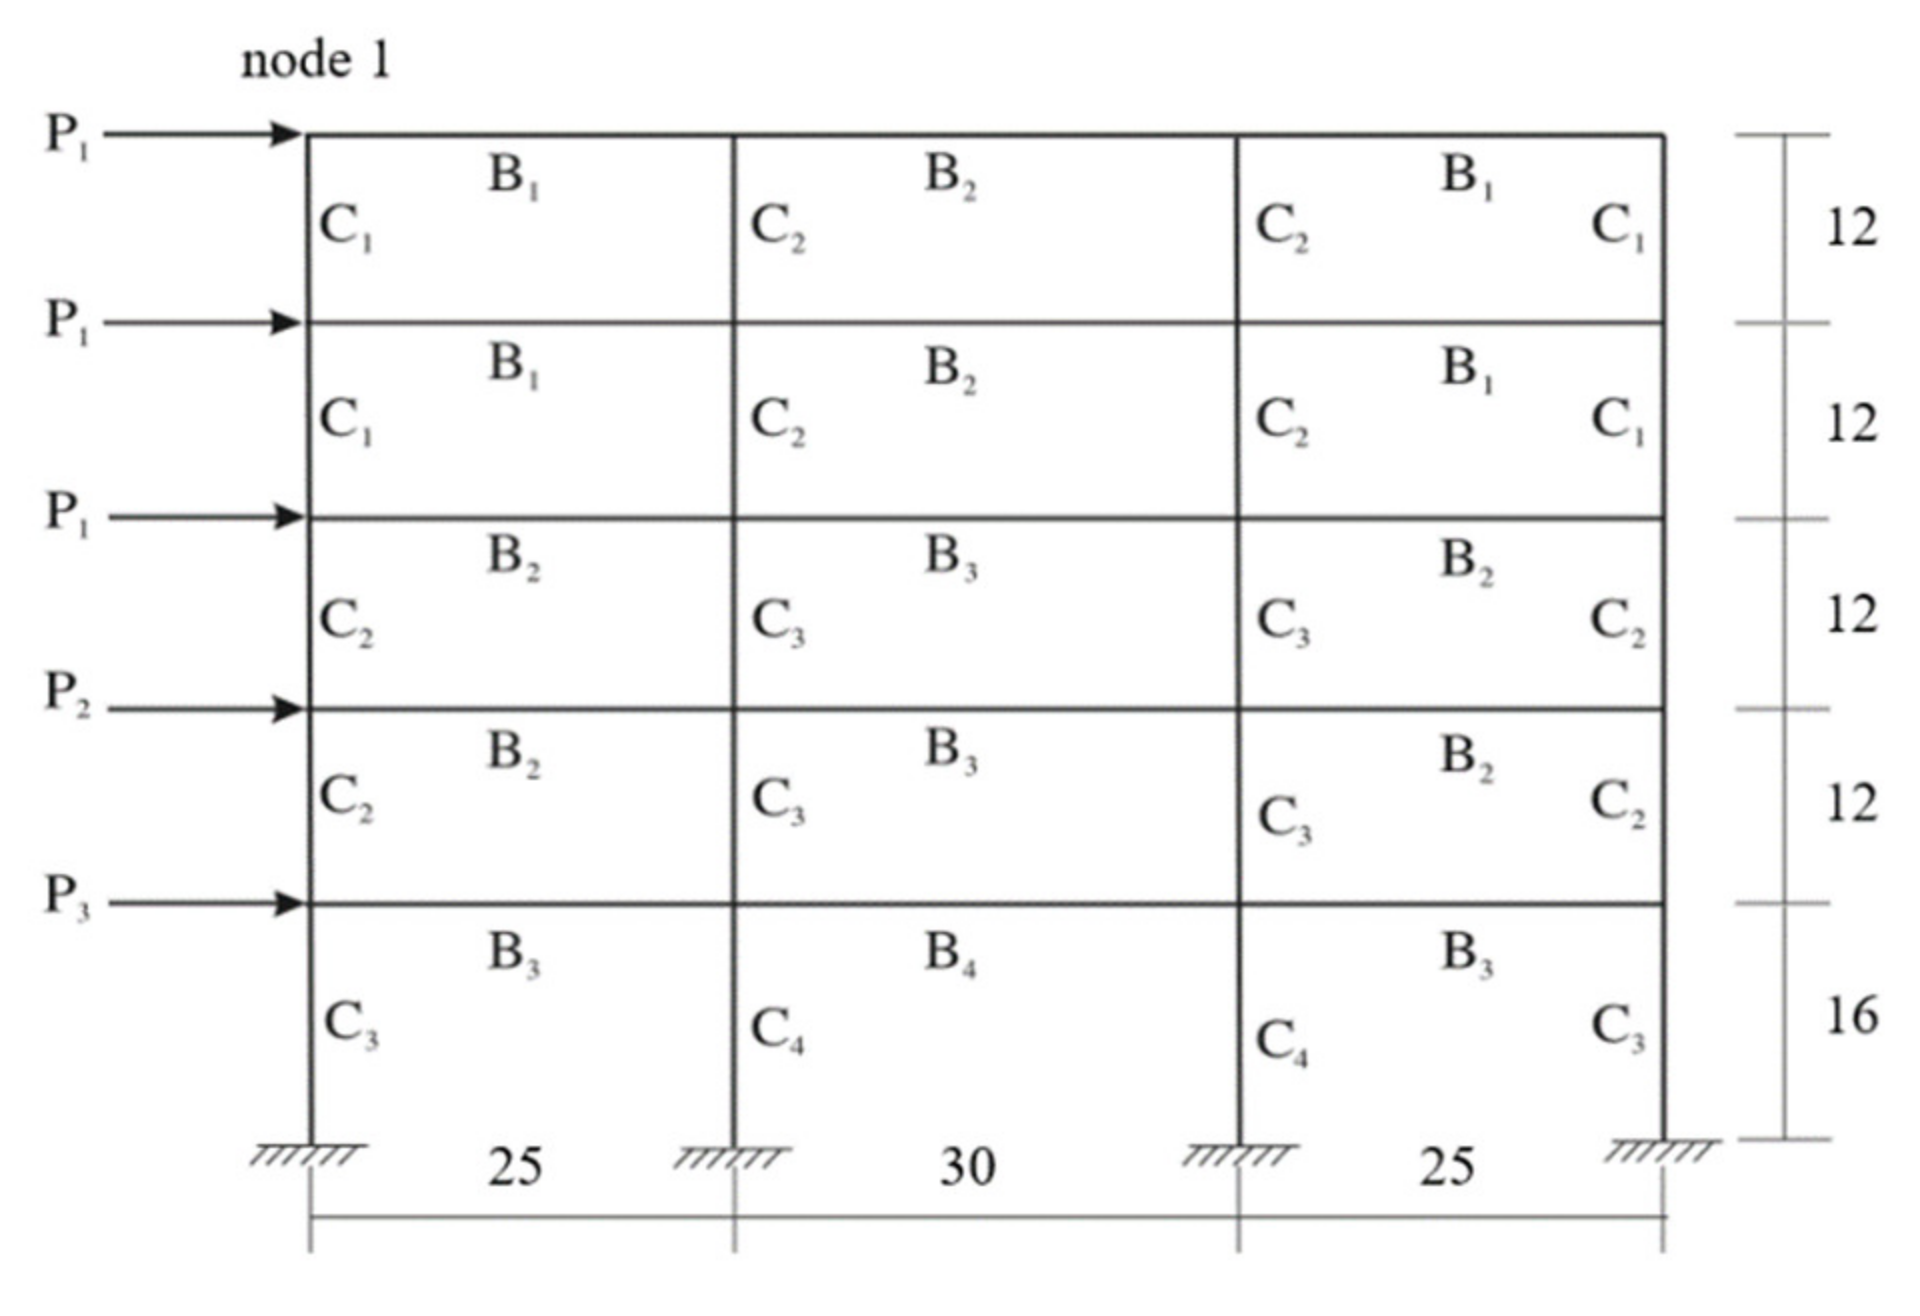
4.5. Test 5. Three-Bay Five-Story Linear Elastic Frame Structure
5. Conclusions
Author Contributions
Funding
Institutional Review Board Statement
Informed Consent Statement
Data Availability Statement
Acknowledgments
Conflicts of Interest
Appendix A
- generate independent samples and according to the marginal PDFs;
- construct conditional samples and ;
- compute the values of marginal CDF using the above samples and get , , and ;
- compute the values of output function and copula density function, and get and according to Equations (19) and (20).
Appendix B

| Variables | Copula |
|---|---|
| , | 0.5000 |
| 0.3332 | |
| 0.9000 | |
| , | 0.1300 |
| 0.9500 | |
| , | 0.1148 |
| 0.0207 | |
| 0.9491 | |
| , | 0.1030 |
| 0.0184 | |
| 0.9484 | |
| , | 0.0933 |
| 0.0166 | |
| 0.9478 | |
| , | 0.0853 |
| 0.0152 | |
| 0.9474 | |
| , | 0.0785 |
| 0.0139 | |
| 0.9470 | |
| , | 0.0728 |
| 0.0129 | |
| 0.9467 | |
| 0.0120 | |
| 0.9464 | |
| Other conditional variables | 0.0020 |
References
- Sobol, I.M.; Kucherenko, S. Global sensitivity indices for nonlinear mathematical models. Review. Wilmott 2005, 1, 56–61. [Google Scholar] [CrossRef]
- Saltelli, A.; Annoni, P.; Azzini, I.; Campolongo, F.; Ratto, M.; Tarantola, S. Variance based sensitivity analysis of model output: Design and estimator for the total sensitivity index. Comput. Phys. Commun. 2010, 181, 259–270. [Google Scholar] [CrossRef]
- Kala, Z. Sensitivity analysis in probabilistic structural design: A comparison of selected techniques. Sustainability 2020, 12, 4788. [Google Scholar] [CrossRef]
- Sobol, I.M. Global sensitivity indices for nonlinear mathematical models and their Monte Carlo estimates. Math. Comput. Simul. 2001, 55, 271–280. [Google Scholar] [CrossRef]
- Li, G.; Rosenthal, C.; Rabitz, H. High Dimensional Model Representations. J. Phys. Chem. A 2001, 105, 7765–7777. [Google Scholar] [CrossRef]
- Kala, Z. Global sensitivity analysis of reliability of structural bridge system. Eng. Struct. 2019, 194, 36–45. [Google Scholar] [CrossRef]
- Xu, C.; Gertner, G.Z. Uncertainty and sensitivity analysis for models with correlated parameters. Reliab. Eng. Syst. Saf. 2008, 93, 1563–1573. [Google Scholar] [CrossRef]
- Li, G.; Rabitz, H.; Yelvington, P.E.; Oluwole, O.O.; Bacon, F.; Kolb, C.E.; Schoendorf, J. Global Sensitivity Analysis for Systems with Independent and/or Correlated Inputs. J. Phys. Chem. A 2010, 114, 6022–6032. [Google Scholar] [CrossRef]
- Kala, Z. Global sensitivity analysis based on entropy: From differential entropy to alternative measures. Entropy 2021, 23, 778. [Google Scholar] [CrossRef]
- Kucherenko, S.; Tarantola, S.; Annoni, P. Estimation of global sensitivity indices for models with dependent variables. Comput. Phys. Commun. 2012, 183, 937–946. [Google Scholar] [CrossRef]
- Song, S.; Bai, Z.; Wei, H.; Xiao, Y.; Kucherenko, S. Variance-based importance measure analysis based on copula under incomplete probability information. Probabilistic Eng. Mech. 2021. submitted for publication. [Google Scholar]
- Der Kiureghian, A.; Liu, P. Structural Reliability under Incomplete Probability Information. J. Eng. Mech. 1986, 112, 85–104. [Google Scholar] [CrossRef]
- Lebrun, R.; Dutfoy, A. An innovating analysis of the Nataf transformation from the viewpoint of copula. Probabilistic Eng. Mech. 2009, 24, 312–320. [Google Scholar] [CrossRef]
- Eryilmaz, S. Multivariate copula based dynamic reliability modeling with application to weighted-k-out-of-n systems of dependent components. Struct. Saf. 2014, 51, 23–28. [Google Scholar] [CrossRef]
- Daul, S.; De Giorgi, E.G.; Lindskog, F.; McNeil, A. The Grouped t-Copula with an Application to Credit Risk. Soc. Sci. Electron. Publ. 2009, 16, 11. [Google Scholar] [CrossRef] [Green Version]
- Cossette, H.; Côté, M.P.; Marceau, E.; Moutanabbir, K. Multivariate distribution defined with Farlie-Gumbel-Morgenstern copula and mixed Erlang marginals: Aggregation and capital allocation. Insur. Math. Econ. 2013, 52, 560–572. [Google Scholar] [CrossRef]
- Gao, K.; Liu, G. Novel nonlinear time-varying fatigue reliability analysis based on the probability density evolution method. Int. J. Fatigue 2021, 149, 106257. [Google Scholar] [CrossRef]
- Fischer, S.; Schumann, A.H. Multivariate flood frequency analysis in large river basins considering tributary impacts and flood types. Water Resour. Res. 2021, 57, e2020WR029029. [Google Scholar] [CrossRef]
- Jiang, C.; Zhang, W.; Han, X.; Ni, B.Y.; Song, L.J. A Vine-Copula-Based Reliability Analysis Method for Structures with Multidimensional Correlation. J. Mech. Des. 2015, 137, 061405. [Google Scholar] [CrossRef]
- Bedford, T.; Cooke, R.M. Probability density decomposition for conditionally dependent random variables modeled by vines. Ann. Math. Artif. Intell. 2001, 32, 245–268. [Google Scholar] [CrossRef]
- Bedford, T.; Cooke, R.M. Vines: A new graphical model for dependent random variables. Ann. Stat. 2002, 30, 1031–1068. [Google Scholar] [CrossRef]
- Kurowicka, D.; Joe, H. Dependence Modelling: Vine Copula Handbook; World Scientific: Singapore, 2011. [Google Scholar]
- Akaike, H. A new look at the statistical model identification. IEEE Trans. Autom. Control 1974, 19, 716–723. [Google Scholar] [CrossRef]
- Genest, C.; Verret, F. Locally most powerful rank tests of independence for copulas model. J. Nonparametric Stat. 2005, 17, 521–535. [Google Scholar] [CrossRef]
- Huard, D.; Evin, G.; Favre, A. Bayesian copula selection. Comput. Stat. Data Anal. 2006, 51, 809–822. [Google Scholar] [CrossRef]
- Torre, E.; Marelli, S.; Embrechts, P.; Sudret, B. A general framework for data-driven uncertainty quantification under complex input dependencies using vine copulas. Probabilistic Eng. Mech. 2019, 55, 1–16. [Google Scholar] [CrossRef] [Green Version]
- Benoumechiara, N.; Bousquet, N.; Michel, B.; Saint-Pierre, P. Detecting and modeling critical dependence structures between random inputs of computer models. Depend. Modeling 2020, 8, 263–297. [Google Scholar] [CrossRef]
- Sarazin, G.; Morio, J.; Lagnoux, A.; Balesdent, M.; Brevault, L. Reliability-oriented sensitivity analysis in presence of data-driven epistemic uncertainty. Reliab. Eng. Syst. Saf. 2021, 215, 107733. [Google Scholar] [CrossRef]
- Nelsen, R.B. An Introduction to Copulas, 2nd ed.; Springer: New York, NY, USA, 2006. [Google Scholar]
- Tarantola, S.; Mara, T.A. Variance-based sensitivity indices of computer models with dependent inputs: The Fourier Amplitude Sensitivity Test. Int. J. Uncertain. Quantif. 2017, 7, 511–523. [Google Scholar] [CrossRef] [Green Version]
- Aas, K.; Czado, C.; Frigessi, A.; Bakken, H. Pair-copula constructions of multiple dependence. Insur. Math. Econ. 2009, 44, 182–198. [Google Scholar] [CrossRef] [Green Version]
- Rosenblatt, M. Remarks on a Multivariate Transformation. Ann. Math. Stat. 1952, 23, 470–472. [Google Scholar] [CrossRef]
- Mao, H.; Mahadevan, S. Reliability analysis of creep–fatigue failure. Int. J. Fatigue 2000, 22, 789–797. [Google Scholar] [CrossRef]
- Guan, X.L.; Melchers, R.E. Effect of response surface parameter variation on structural reliability estimates. Struct. Saf. 2001, 23, 429–444. [Google Scholar] [CrossRef]
- Kaymaz, I. Application of kriging method to structural reliability problems. Struct. Saf. 2005, 27, 133–151. [Google Scholar] [CrossRef]
- Au, S.K.; Beck, J.L. Importance sampling in high dimensions. Struct. Saf. 2002, 25, 139–163. [Google Scholar] [CrossRef]


| Copula | h | ||
|---|---|---|---|
| Gaussian | |||
| Clayton | |||
| Gumbel | - | ||
| Frank |
| Copula | ||||||
|---|---|---|---|---|---|---|
| Gaussian | 0.2999 | 0.5000 | 0.8000 | −0.1925 | 0.4543 | 0.7868 |
| Clayton | 0.3298 | 0.6592 | 1.7598 | 0.0001 | 0.5717 | 1.6681 |
| Gumbel | 1.1995 | 1.4269 | 2.2462 | 1.0001 | 1.3649 | 2.1767 |
| Frank | 1.7998 | 3.2955 | 7.5508 | 0.0025 | 2.9129 | 7.2215 |
| Copula | () | () | () | () | () | () |
| Gaussian | −2.4711 | −7.5399 | −2.6779 | −9.8929 | −6.0581 | −2.5297 |
| Clayton | −1.7792 | −5.5229 | −2.0079 | 0.0099 | −4.4245 | −1.8934 |
| Gumbel | −2.0010 | −6.5179 | −2.4497 | 0.0174 | −5.1750 | −2.3091 |
| Frank | −2.2542 | −6.8754 | −2.4359 | 0.0419 | −5.5241 | −2.3014 |
| D | ||||||||
|---|---|---|---|---|---|---|---|---|
| Reference | −13.0510 | 13.1197 | 0.3177 | 0.0271 | 0.1286 | 0.8123 | 0.1778 | 0.5647 |
| Nataf () | −13.0511 | 13.1298 | 0.3173 | 0.0277 | 0.1286 | 0.8114 | 0.1779 | 0.5640 |
| VC1 () | −13.0511 | 13.1304 | 0.3173 | 0.0279 | 0.1279 | 0.8122 | 0.1784 | 0.5641 |
| VC2 () | −13.0477 | 13.1498 | 0.3170 | 0.0134 | 0.0956 | 0.8058 | 0.1757 | 0.5612 |
| Key Variable | Vine Structure | D | |
|---|---|---|---|
| −13.0511 | 13.1304 | ||
| −13.0509 | 13.1611 | ||
| −13.0512 | 13.1345 |
| Gaussian | Clayton | Gumbel | Frank | ||
|---|---|---|---|---|---|
| −1033.3 | −1364.7 | −864.4 | −855.9 | 8.0377 | |
| −324.6 | −456.3 | −229.5 | −300.6 | 1.9490 | |
| −347.5 | −264.8 | −310.7 | −294.0 | 0.7100 | |
| −224.7 | −173.1 | −193.0 | −212.4 | 0.6038 | |
| −22.1 | −15.0 | −14.0 | −24.0 | 1.3584 | |
| −160.2 | −117.7 | −134.2 | −162.2 | 3.6438 |
| Nataf | 9.7296 | 0.8338 | 0.8687 | 0.5843 | 0.5188 |
| VC1 | 9.6056 | 0.7619 | 0.7702 | 0.3610 | 0.5877 |
| D | |||||
| Nataf | 581.1910 | 0.0294 | 0.0142 | 0.0285 | 0.0221 |
| VC1 | 452.2249 | 0.0584 | 0.0311 | 0.0280 | 0.0279 |
| Gaussian | Clayton | Gumbel | Frank | ||
|---|---|---|---|---|---|
| −307.42 | −194.53 | −318.29 | −294.48 | 1.9063 | |
| −255.70 | −367.33 | −185.25 | −273.38 | 1.8789 | |
| −91.34 | −95.63 | −61.17 | −90.73 | 0.6513 | |
| 2.00 | 1.77 | 2.00 | 1.99 | 0.0192 | |
| −154.66 | −204.43 | −104.82 | −155.01 | 1.1335 | |
| −169.16 | −88.75 | −189.89 | −162.15 | 1.5972 |
| D | ||||||||
|---|---|---|---|---|---|---|---|---|
| Nataf | 3.5000 | 12.4260 | 0.3125 | 0.5714 | 0.2289 | 0.2468 | 0.4760 | 0.2129 |
| VC1 | 3.5189 | 12.3998 | 0.3450 | 0.6018 | 0.2468 | 0.2400 | 0.4655 | 0.1887 |
| Input Variables | Coefficient of Variation (COV) | Distribution | |
|---|---|---|---|
| 5490 | 0.20 | Log-normal | |
| 17,100 | 0.20 | Log-normal | |
| 549 | 0.20 | Log-normal | |
| 6000 | 0.20 | Log-normal | |
| 0.42 | 0.20 | Normal | |
| 6.0 | 0.20 | Normal |
| Gaussian | Clayton | Gumbel | Frank | Copula | |
|---|---|---|---|---|---|
| −386.7 | 2.0 | 2.0 | −368.1 | −0.7364 | |
| −48.8 | 2.0 | 2.0 | −52.3 | −2.1534 | |
| −331.7 | −239.8 | −292.5 | −334.8 | 6.0953 | |
| −354.6 | −249.8 | −336.4 | −351.0 | 0.7132 | |
| −0.1 | 2.0 | 2.0 | −1.8 | −0.5304 | |
| −1376.1 | 2.0 | 2.0 | −1412.1 | −27.3777 |
| Element | Young’s Modulus | Moment of Inertia | Cross Section Area |
|---|---|---|---|
| Variables | Distribution | Mean | SD | Variables | Distribution | Mean | SD |
|---|---|---|---|---|---|---|---|
| Rayleigh | 30 | 9 | Normal | 2.69 | 0.52 | ||
| Rayleigh | 20 | 8 | Normal | 3.00 | 0.60 | ||
| Rayleigh | 16 | 6.40 | Normal | 3.36 | 0.48 | ||
| Normal | 454,000 | 40,000 | Normal | 4.00 | 0.64 | ||
| Normal | 497,000 | 40,000 | Normal | 5.44 | 0.80 | ||
| Normal | 0.94 | 0.10 | Normal | 6.00 | 0.96 | ||
| Normal | 1.33 | 0.12 | Normal | 2.72 | 0.80 | ||
| Normal | 2.47 | 0.24 | Normal | 3.13 | 0.88 | ||
| Normal | 3.00 | 0.28 | Normal | 4.01 | 1.04 | ||
| Normal | 1.25 | 0.24 | Normal | 4.50 | 1.16 | ||
| Normal | 1.63 | 0.32 |
| Nataf | 0.1149 | 0.4395 | 0.1473 | 0.1247 | 0.0112 | 0.0306 | 0.0751 | 0.2789 |
| VC1 | 0.1148 | 0.4344 | 0.1523 | 0.1322 | 0.0116 | 0.0416 | 0.0819 | 0.2796 |
| D | ||||||||
| Nataf | 0.0071 | 0.3132 | 0.0053 | 0.0005 | 0.0006 | 0.0005 | 0.0120 | 0.0617 |
| VC1 | 0.0071 | 0.3137 | 0.0052 | 0.0005 | 0.0015 | 0.0004 | 0.0115 | 0.0638 |
Publisher’s Note: MDPI stays neutral with regard to jurisdictional claims in published maps and institutional affiliations. |
© 2021 by the authors. Licensee MDPI, Basel, Switzerland. This article is an open access article distributed under the terms and conditions of the Creative Commons Attribution (CC BY) license (https://creativecommons.org/licenses/by/4.0/).
Share and Cite
Bai, Z.; Wei, H.; Xiao, Y.; Song, S.; Kucherenko, S. A Vine Copula-Based Global Sensitivity Analysis Method for Structures with Multidimensional Dependent Variables. Mathematics 2021, 9, 2489. https://doi.org/10.3390/math9192489
Bai Z, Wei H, Xiao Y, Song S, Kucherenko S. A Vine Copula-Based Global Sensitivity Analysis Method for Structures with Multidimensional Dependent Variables. Mathematics. 2021; 9(19):2489. https://doi.org/10.3390/math9192489
Chicago/Turabian StyleBai, Zhiwei, Hongkui Wei, Yingying Xiao, Shufang Song, and Sergei Kucherenko. 2021. "A Vine Copula-Based Global Sensitivity Analysis Method for Structures with Multidimensional Dependent Variables" Mathematics 9, no. 19: 2489. https://doi.org/10.3390/math9192489
APA StyleBai, Z., Wei, H., Xiao, Y., Song, S., & Kucherenko, S. (2021). A Vine Copula-Based Global Sensitivity Analysis Method for Structures with Multidimensional Dependent Variables. Mathematics, 9(19), 2489. https://doi.org/10.3390/math9192489