1. Introduction
In the 21st century, enterprise performance is not easy to evaluate because there are too many serious events that have occurred, such as the incident of 911, the subprime mortgage crisis and COVID-19. The event of COVID-19 will change the behavior of humans and can influence the business model. The traditional business model should change to fit with the variation in the behavior of humans in order to fight infectious diseases.
Because of COVID-19, the global business environment has been changed in three aspects. The first aspect is the economic shut down problem. The world factories (China) suffer due to COVID-19 and cannot manufacture their products in February 2020. The world market (the United States of America and countries in European) cannot buy products to consume in March and April 2020. So, the economy cannot be developed in the first half of the year in 2020 [
1]. Until now, the global economy did not revive completely. The second issue is the supply chain interruption problem. In the globalization area, the components of a product will be manufactured in each country. Many countries stop manufacturing products because of the quarantine policy, and this will influence the entire supply chain for manufacturing products [
2,
3]. The third topic is the business model adjustment problem. In order to confront COVID-19, some policies have been generated which will change the business model forever. For example, some restaurants may not be able to survive in the future because their dining space is too small and their business has been replaced by a Bento shop [
4].
The machine learning model can be used to classify and make predictions in each field, such as weather predictions [
5], flight predictions [
6], water quality predictions [
7] etc. In the enterprise field, the machine learning model has been developed to execute corporate bankruptcy predictions [
8], credit risk evaluations [
9], enterprise performance evaluations [
10] etc.
Because of the above phenomenon, it should re-predict enterprise performance by the machine learning model again. The machine learning model used the data before 2019 as the training data. After training, this machine learning model may not be able to effectively predict enterprise performance after 2020. This phenomenon exists in each kind of machine learning model, such as AdaBoost, support vector machine (SVM), back propagation neural network (BPNN), k-nearest neighbors (KNN) etc. The SVM handles the classification problem according to the line or the hyperplane which separates the data into classes. The BPNNs imitate the operation of the neural network in the brain to cope with the classification problem. The KNN classify the data based on the rule that the data belongs to the label if this label is the majority of the labels in the k-nearest neighbors.
AdaBoost is also one kind of popular machine learning model. AdaBoost can effectively predict the performance of enterprise in the past literature [
8,
9]. The goal of this research is to improve the AdaBoost classifier in order to allow this machine learning model to effectively predict enterprise performance after 2020.
The content of this research is as follows. At first, some literature about enterprise performance prediction will be collected in
Section 2. In addition, then AdaBoost and its modified model will be explained in
Section 3. To justify the usefulness of this model, some financial data will be collected from China, Japan, South Korea and Taiwan. The proposed model can be used to predict the enterprise performance after COVID-19. The test data correct rate of the proposed model will be compared with some traditional machine learning models in
Section 4. Finally, some conclusions and future research will be discussed at the end.
2. Literature Review
Xiao et al. (2006) used college student loans as a research object. The support vector machine analysis was employed to predict the possibility of default in the repayment from college students after graduation. The research results showed that the predictive ability of support vector machines was better than the hierarchical analysis method (analytic hierarchy process (AHP) and back propagation neural network (BPNN)). It proved that the support vector machine was useful in predicting the credit of college students [
11]. Lin et al. (2010) took the credit loan case of small and medium-sized enterprises as the research subject. The study established an evolutionary multiple portfolio logistics regression model. The model designed a logistics regression model for each credit rating model. The research results showed that its forecasting ability was better than a traditional differential analysis, decision tree, traditional logistics and other classification models. Among them, net value per share, net profit before tax, total asset turnover and directors’ and supervisors’ remuneration that accounted for pre-tax net profit were the most important key attributes for predicting the performance of enterprise [
12].
Wang and Ma (2012) used the bootstrap model to select a test record and applied a random model to decide the features and integrated a support vector machine (SVM) to classify the enterprise credit risk. In this research, 239 enterprises’ financial records were collected by an industrial and commercial bank in China. Based on the experiment’s result, this method possessed a high predictive ability to forecast the possibility of an enterprise to break a contract [
13]. Dhini et al. (2015) collected information about the past consumers’ demand of the enterprises’ products. The autoregressive integrated moving average (ARIMA) was integrated with a neural network method to evaluate the future demand of the enterprises’ products. Compared with other methods, this method could effectively forecast the demand of the enterprises’ products for the consumer [
14]. Zelenkov et al. (2017) used many small and medium-sized enterprises in Russia as their research targets. They used genetic algorithms for the attribute screening. AdaBoost also had been employed for bankruptcy prediction. The research results showed that the prediction accuracy of the model was as high as 93.4%. It was much higher than the other classification prediction model [
15]. Kliestik et al. (2018) thought that most of the machine learning tools have sufficient capability to warn of impending financial problems. However, some enterprises try to hide their financial information through globalization. It is hard to predict the bankruptcy risk using a achine learning tool as corporations have become more global and more complex [
16]. Kovacova et al. (2019) thought that the selected categories used in predicting bankruptcy of an enterprise for different countries is different. A cluster analysis and a correspondence analysis could be applied to explore the mutual relationships among the selected categories for each country [
17]. Duan et al. (2019) considered six criteria to evaluate and classify the risks of an enterprise. The risk criteria included financial risk, intermediary risk, integrated risk, systemic risk, legal risk and information risk. This research developed a multiple classifier fusion-based risk assessment algorithm which combined the six support vector machines. The mergers and acquisitions (M&A) data of 200 enterprises was collected. As a training dataset, 185 enterprises were applied and others were distributed as a testing dataset. The mean absolute error (MAE) and mean absolute percentage error (MAPE) receiver operating characteristics (ROC) were selected as the evaluation criteria for evaluating the prediction ability of this method. Compared with the traditional single SVM classifier, their method could deliver a very high predictive performance [
18]. Hu et al. (2019) had arranged some historical annual data from the Taiwanese tourism bureau. In addition, the Grey–Markov model had been applied by adjusting the parameter by the neural networks. The research experiment result justified that this model outperformed the other traditional machine learning model [
19]. Ouenniche et al. (2019) used a VIKOR-based classifier to predict bankruptcy of an enterprise. According to experiment result, this method could possess a relatively high predictive ability for predicting bankruptcy of an enterprise [
20].
Podhorska et al. (2020) collected the enterprise financial information in 17 countries. Classification and regression trees (CARTs) were used to build a decision tree to classify enterprises as prosperous enterprises (1,802,027) and non-prosperous enterprises (557,704). This created a prediction model that could be considered to classify enterprises in emerging markets [
21]. Li and Chen (2020) analyzed and compared the classification correct rate among different kinds of machine learning models, which includes a random forest, AdaBoost, XGBoost, LightGBM and Stacking. According to the experiment result, the random forest has the best classification performance in credit scoring [
22]. Ptak-Chmielewska (2021) collected some data which included the financial ratios and non-financial factors from small- and medium-sized enterprises (SMEs) in Poland. Compared with the linear discriminant analysis (LDA) and SVM, this method possessed a relatively high predictive ability [
23]. Valaskova et al. (2021) collected 425 consumers’ opinions to understand how consumer behavior has been influenced by COVID-19 in the aspect of expenses, investments and financial reserves. A correspondence analysis (simple and multivariate) and a categorical analysis (Pearson’s chi-square test) have been employed to reveal the novel pattern of consumers’ behavior. So, the enterprise business model and performance should be re-evaluated after COVID-19 has finished [
24]. Rowland et al. (2021) collected the financial information of 64 mining companies in the Czech Republic. The SPSS and Visual Gene Developer software were used to execute a feature selection. The neural network method was used to classify an enterprise as solvent, insolvent and in the grey zone [
25]. Jain et al. (2021) collected data from a B cells dataset by applying each kind of machine learning data to execute a prediction of severe acute respiratory syndrome coronavirus (SARS-CoV) and severe acute respiratory syndrome coronavirus 2 (SARS-CoV-2). In this study, naïve Bayes, K-nearest neighbors, SVM, random forest, XGBoost, neural networks and AdaBoost were applied in predicting the B cells dataset. In this work, ensemble learning strategies were implemented to make predictions. The validation accuracy for predicting the SARS-CoV and SARS-CoV-2 virus was 87.248% and 87.7934%, respectively [
26].
3. Proposed Method
3.1. Adaboost
AdaBoost means “Adaptive Boosting”. This method is one kind of machine learning method which is proposed by Yoav Freund and Robert Schapire [
27]. There are many classifiers in the AdaBoost method. The sample is divided by a previous classifier which will be used to train the next classifier. This model can build the adaptability of the AdaBoost method. Compared to other learning algorithms, the AdaBoost method is not easy to overfit in some classification problems. The classifier used in the AdaBoost method may be weak (weak classifier means that the classification error rate of a classifier is large, but the classification error rate of this classifier is lower than the random classification model). According to the voting model, the classification ability of Adaboost can be improved based on a group decision of the entire weak classifiers.
The AdaBoost method is an iterative algorithm; this method will modify a weak classifier in each round until it reaches a predetermined sufficiently small classification error rate. Each training sample will give the weight. If this sample has been accurately classified by the classifier, the weight of this sample should reduce and the probability of this sample which is selected by the classifier must also drop. On the contrary, if this sample is not accurately classified by this classifier, its weight should increase. In this way, the AdaBoost method can focus on handling the more difficult (more informative) samples.
Let
be the sample i in the initial sample set D.
means weight of sample i in k round. The pseudo code of AdaBoost is as follows:
Step 1. Initialize
Expert decides maximum round
. At first, the weight of each sample is equal.
i = 1, 2,…,
n.
is j-th classifier (
j = 1, 2, …, g).
Step 2. Execution process
For k = 1 to
For j = 1 to
Set = 0
For i = 1 to n
{
- (a)
Use the weak classifier to classify sample i.
- (b)
where
represents the classification incorrect index of
.
- (c)
Calculate
represents the training bias of classifier j. ln() means the natural logarithm function.
}
For i = 1 to n
{
means the weight of sample i in k + 1 rounds. exp() means exponential function.
}
3.2. Modified Model for AdaBoost
This research uses one model to modify AdaBoost. In traditional AdaBoost, the initial weight of each sample sets up equally. The function used to set up the weight of each sample can refer to Equation (2).
In the modified AdaBoost model, the initial weight of each sample sets up according to the time point that this sample generates. The formula is as follows:
where
means the year that the sample i has been generated.
So, the sample will acquire a relatively high weight if this sample is newer (for example, the weight of a sample generated in 2021 will be higher than that of a sample generated in 2020). Based on the above function, the newest sample can acquire a relatively high weight in Step 1. The advantage of this modified model is that the modified AdaBoost is good at classifying the newest sample.
4. Experiment Result
4.1. Experiment Process
In order to justify the usefulness of the modified AdaBoost, we collected enterprise financial information in China, Japan, South Korea and Taiwan to predict the enterprise performance by each kind of machine learning model. The feature column in the dataset includes the debt-to-asset ratio, long-term funds to fixed assets ratio, current ratio, quick ratio, interest coverage ratio, receivables turnover rate, inventory turnover rate, turnover rate of fixed assets, turnover of total assets, return on equity, cash flow ratio (%), cash flow allowance ratio (%) and cash reinvestment ratio (%) (Refer to
Table 1). All of the above information can be found in the financial report.
In the dataset, the data whose feature column is the return on equity (ROE) is taken as the predictive data. Otherwise, the data with another feature column is extracted as the input data. The value in the predictive data is predicted by a machine learning tool based on the information of the input data.
The range of the collection data is between the first quarter in 1990 and the first quarter in 2021. Fifty-six semiconductor enterprises and thirty-two tourism enterprises were gathered. For the enterprise distribution, refer to
Table 2. For the financial information attribute, refer to
Table 1.
The volume of the total sample is 11,000. Among them, the training data is used in the range between the first quarter in 1990 and the fourth quarter in 2012. The testing data is used in the range between the first quarter in 2013 and the first quarter in 2021.
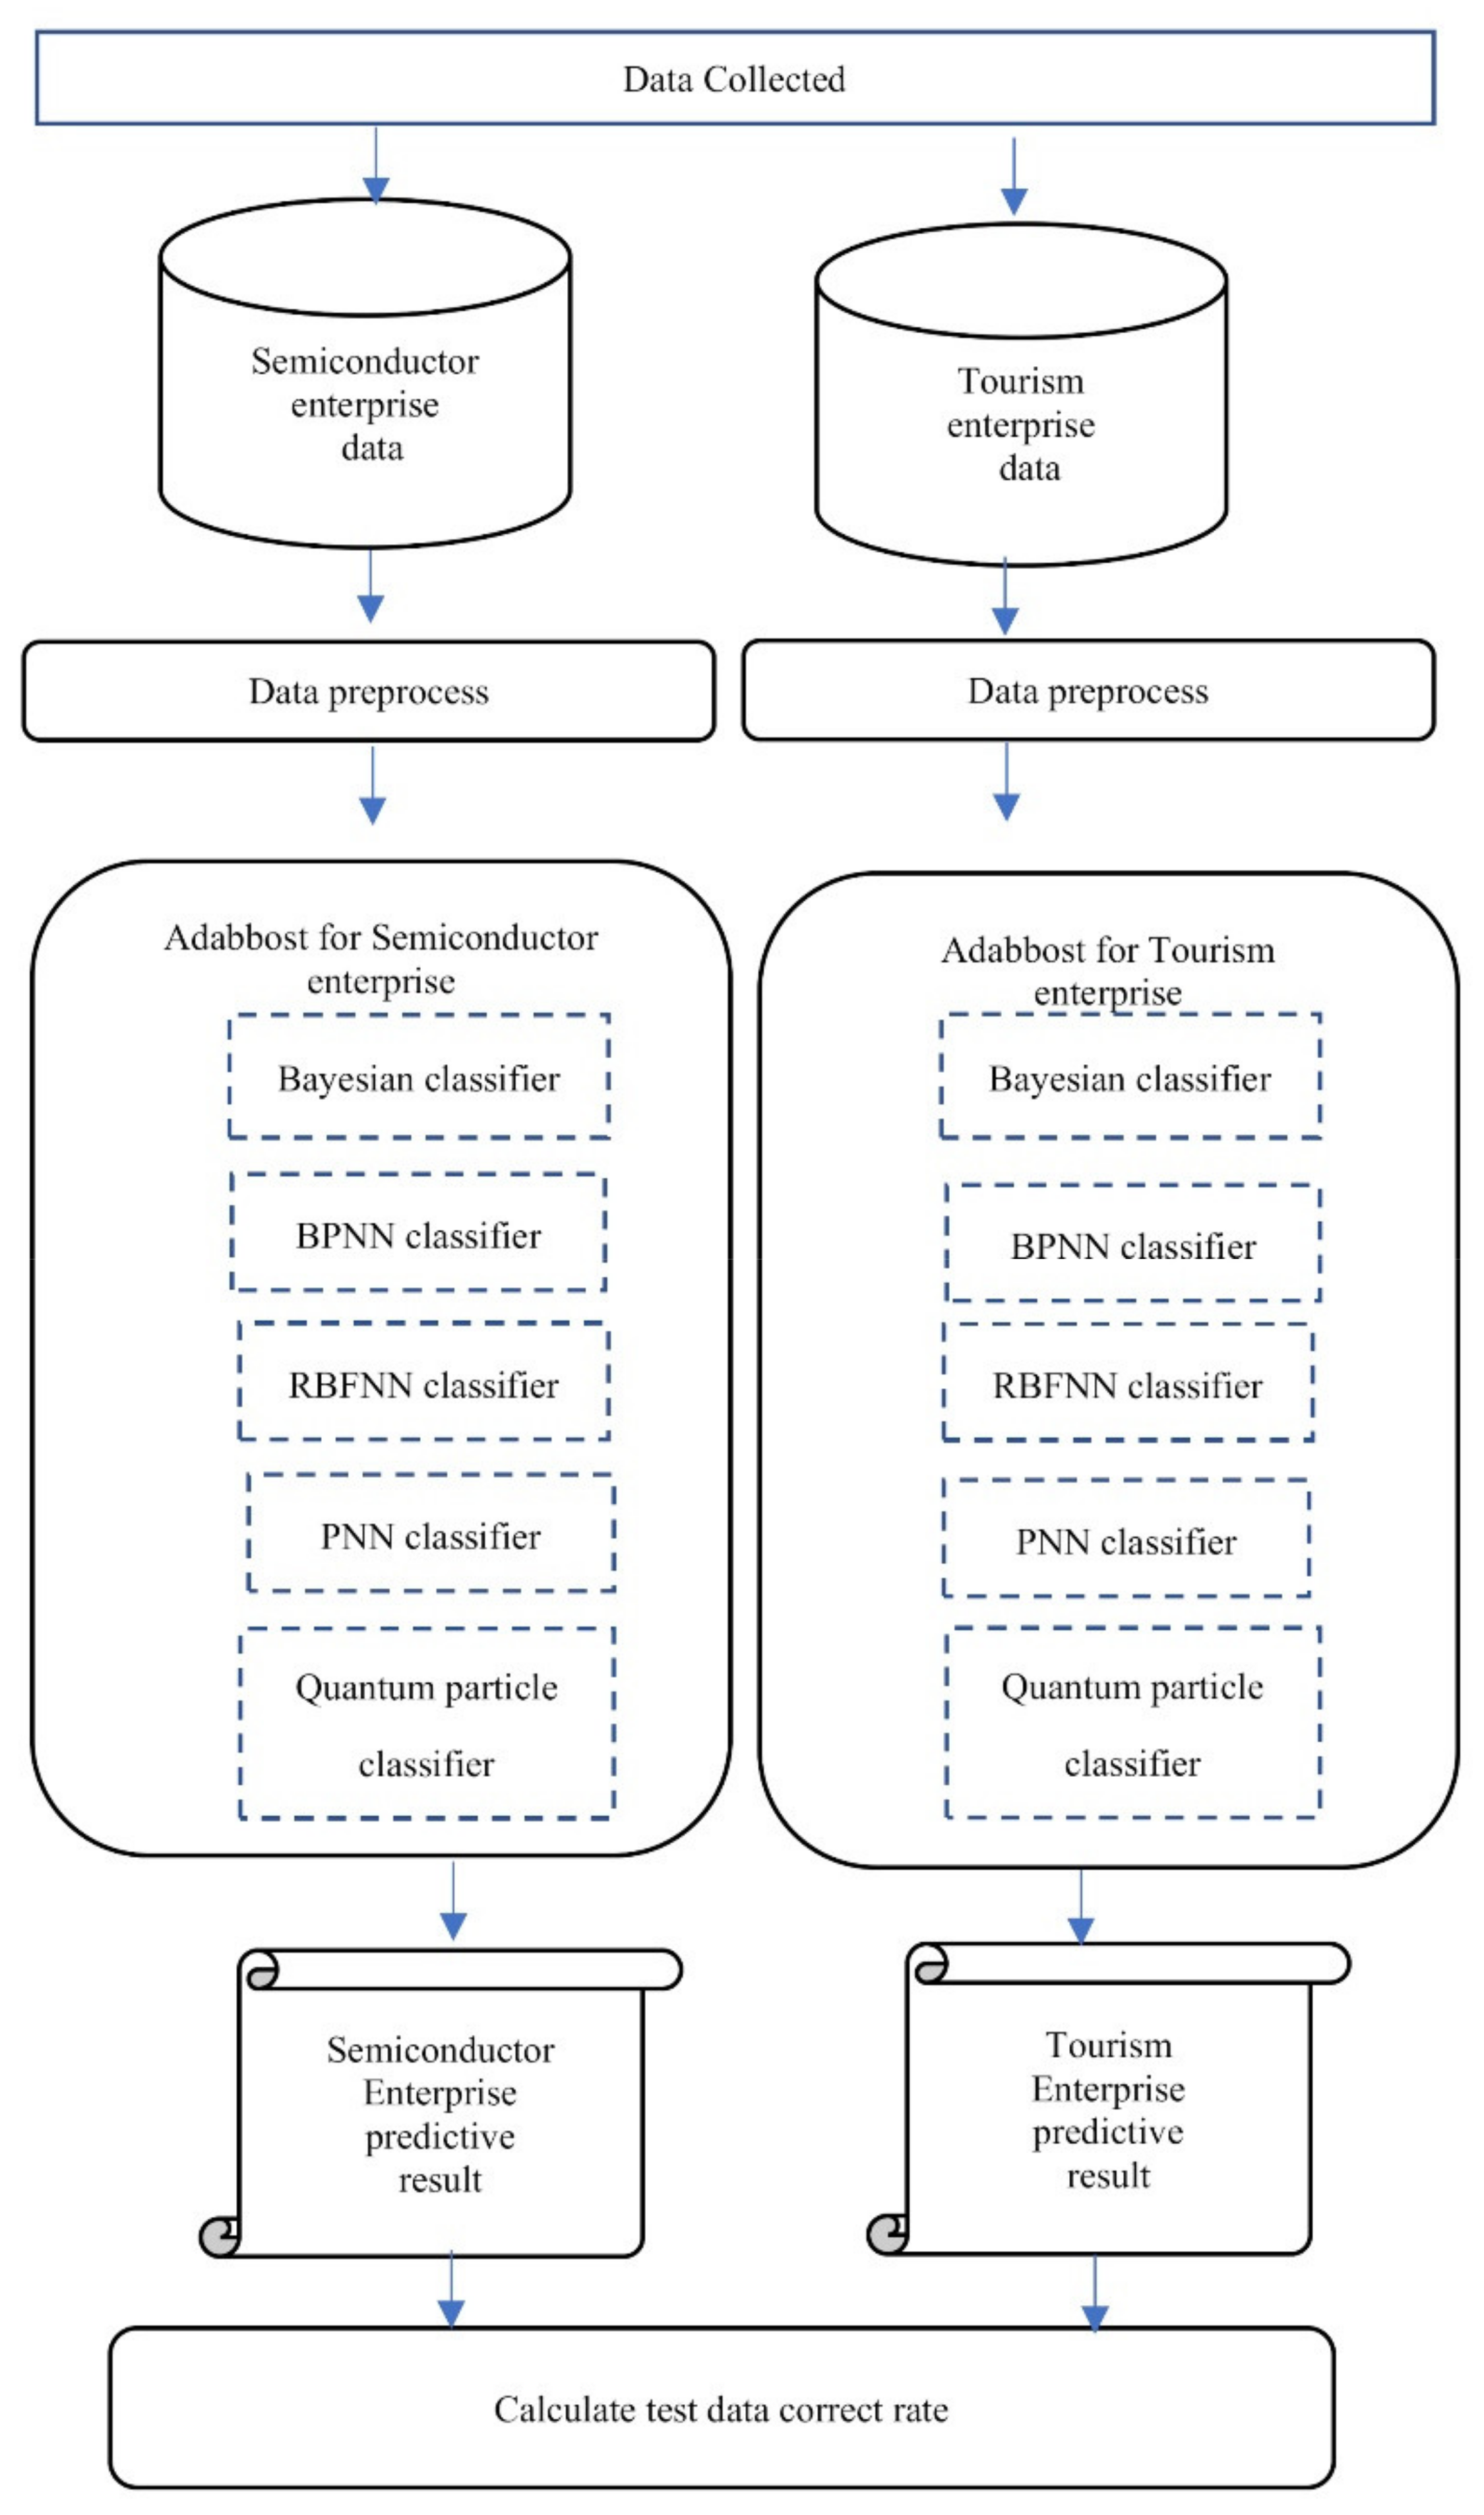
In this research, a Bayesian classifier, back propagation neural network classifier (BPNN classifier), radial basis function neural network classifier (RBFNN classifier), probabilistic neural network classifier (PNN classifier) and quantum particle classifier are applied as weak classifiers for AdaBoost. In the data pre-process step, we normalize all the financial data as 0–1. After training the AdaBoost classifier, the semiconductor enterprise predictive result and the tourism enterprise predictive result were acquired.
In this research, the test data correct rate was used to evaluate the performance of the model. For Tthe formula of the test data correct rate, refer to the equation below.
The test data correct rate was calculated based on the semiconductor enterprise predictive result and the tourism enterprise predictive result. The AdaBoost was trained by the semiconductor enterprise data and the tourism enterprise data individually. For the execution process, refer to
Figure 1.
In this research, “two-class classification” and “multi-class classification” were designed to predict the tourism enterprise performance to provide more detail information. The ROE is the output variable that is represented as the enterprise performance in this research.
In two-class classification, the output variable is set up as 0 if the ROE of the enterprise is smaller than zero. On the other hand, the output variable can be set up as one. In multi-class classification, the relative definition of the output variable is shown in
Table 3.
4.2. Classification Prediction Result
For justifying the superiority of the modified AdaBoost in predicting the enterprise performance, this study applies a different kind of classifier to classify the same data based on the same execution process. Compared with the other machine learning model, the proposed method possesses the better classification ability according to the experiment’s result (for the relative content, refer to
Table 4). We used the five-fold cross validation to verify that the predictive result of the proposed method is stable.
The parameter of each machine learning model is set up as the default value in its initial model. Those values can be justified by a genetic algorithm (GA) or particle swarm optimization (PSO) for optimizing the correct rate. However, the primary research showed that the hyper-parameters optimization does not change the accuracy a lot. However, the calculation time increased greatly. So, all of the machine learning models in this research do not justify the parameter.
In the same way the modified AdaBoost uses the same data to execute the multi-class classification, the modified AdaBoost also possesses a relatively better classification ability (for the relative content, refer to
Table 5).
5. Conclusions and Future Research
In this research, we modify AdaBoost to predict the enterprise performance in different regions in Asia. According to the analysis results, we know that the proposed method possesses the best classification in the two-class classification problem (average test data correct rate of the proposed method is 88.04%) and the multi-classification classification problem (average test data correct rate of the proposed method is 77.98%) for predicting enterprise performance. The advantage of the modified AdaBoost is to promote the predictive ability of the traditional AdaBoost for the newest samples. The machine learning tool is usually applied to classify the newest sample in a practical environment. The modified AdaBoost decides the initial weight of each sample according to the generation time of each sample. So, the modified AdaBoost is good at classifying the newest samples. The contribution of this research is that we designed the modified AdaBoost which can effectively cope with the two-class classification problem and the multi-classification classification problem in the enterprise field when the performance and business model of enterprise has been changed after 2020.
The limitation of the machine learning model is that the classification ability of each kind of machine learning model should be based on the input data, so scholars and managers need to adjust the input data to train the machine learning model for when some kind of special big event happens. This research suggests that the input data should be changed and the machine learning model should be trained again every year.
In the future, the relative scholar can execute the extended research suggested below.
- (1)
Extending the research target
In this research, there are eighty-eight enterprises which have been chosen to collect data. In our research, the data that we gathered focused on the tourism industry and the semiconductor industry. The relative scholar can expand the research target to execute the same research.
- (2)
Extending the research sample in the period after COVID-19
This research has been written in 2021, only a few data can be gathered after COVID-19. The rscholar can collect more data to perform this research in the future.
- (3)
Decision support system
The relative scholar can design the decision support system with a user-friendly interface in order to let the investor use the proposed method.


