
Frequency Domain Feature Extraction Investigation to Increase the Accuracy of an Intelligent Nondestructive System for Volume Fraction and Regime Determination of Gas-Water-Oil Three-Phase Flows


Abstract
:1. Introduction
2. Materials and Methods
2.1. Radiation-Based System
2.2. Frequency Domain Feature Extraction
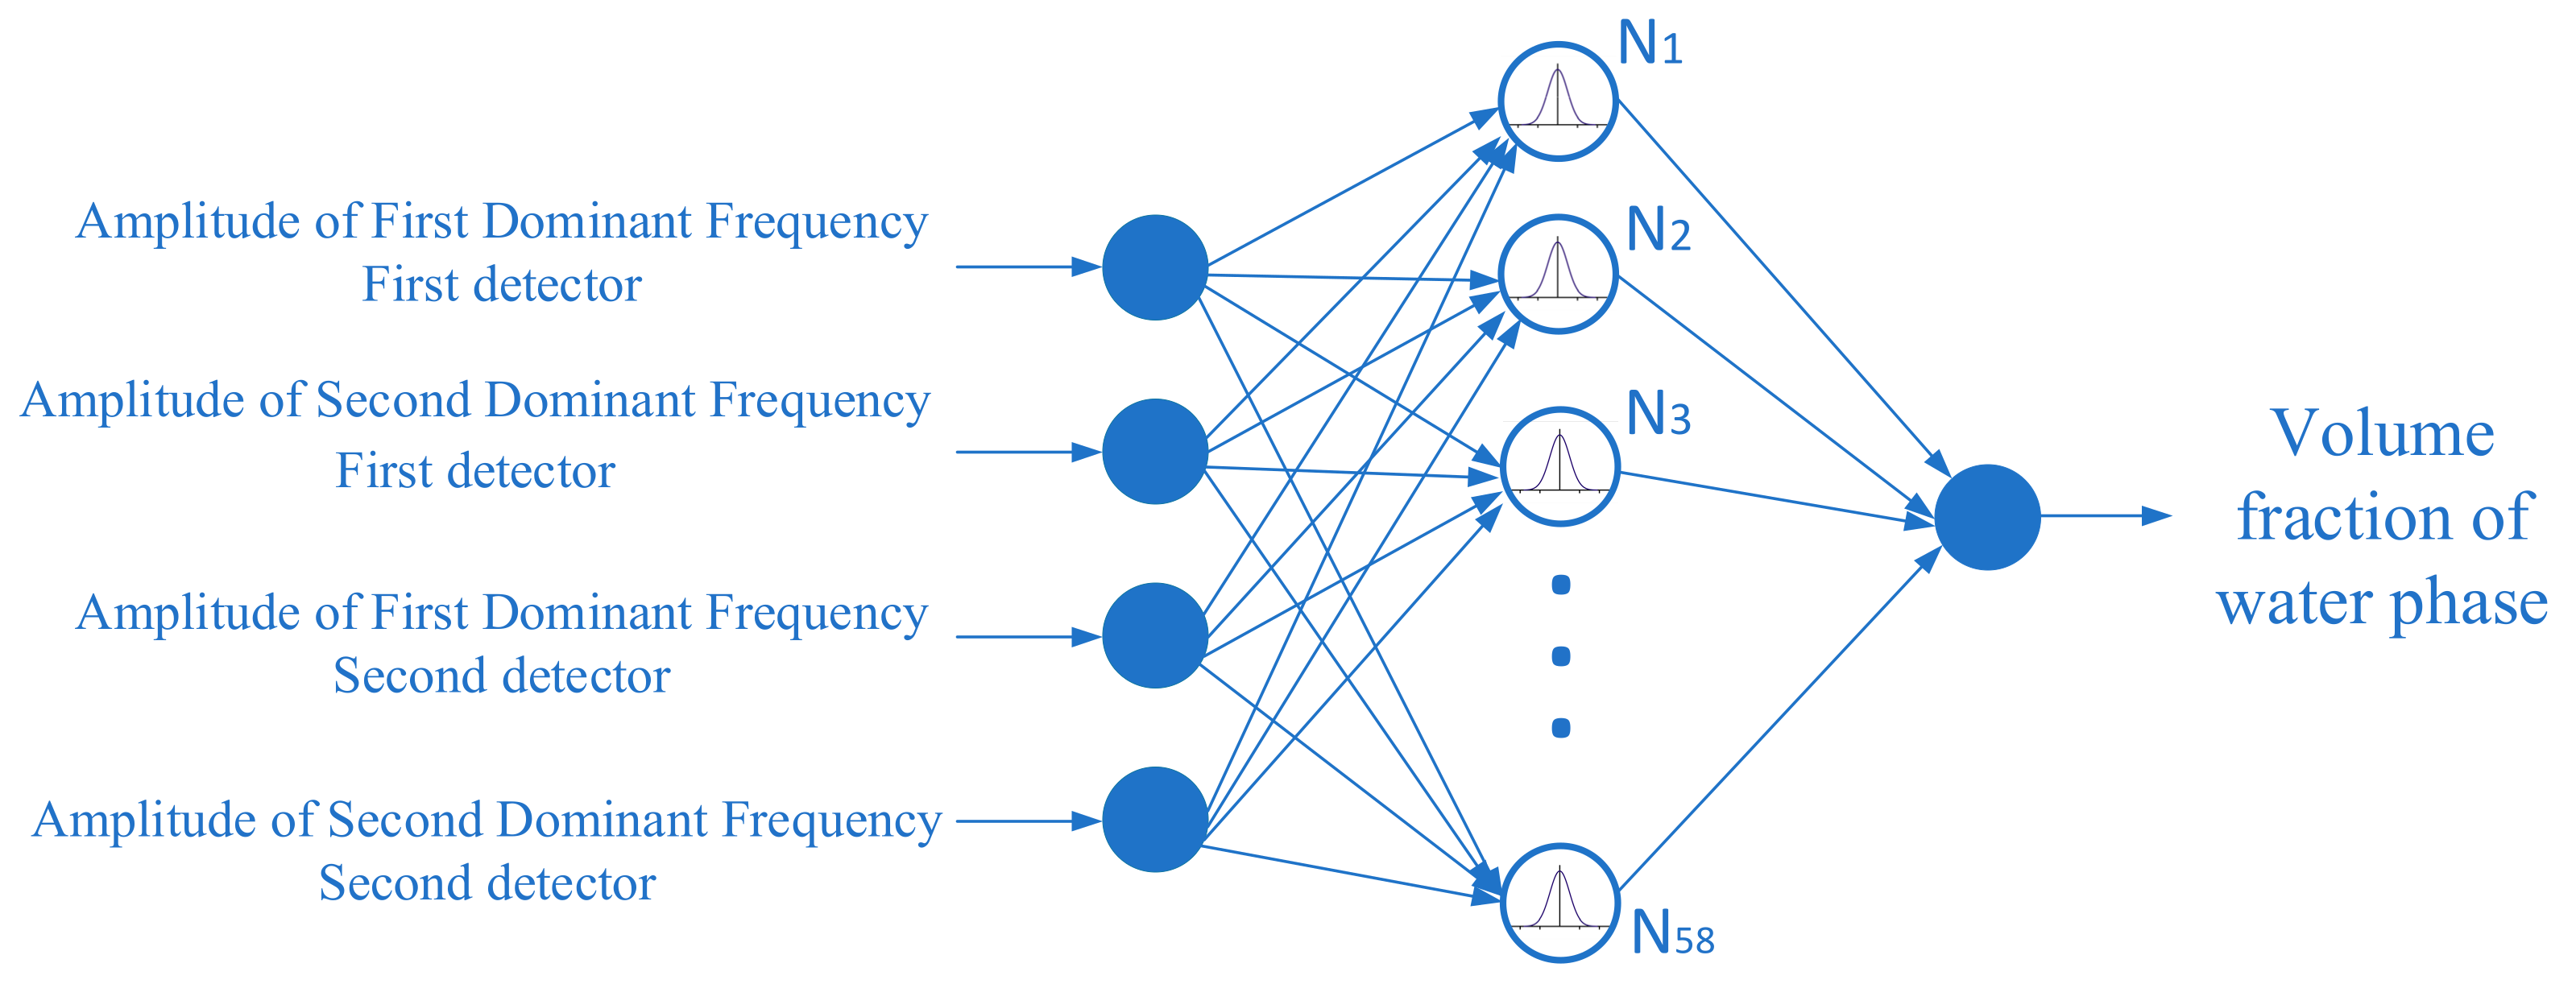
2.3. RBF Neural Network
3. Results and Discussion
4. Conclusions
Author Contributions
Funding
Institutional Review Board Statement
Informed Consent Statement
Data Availability Statement
Conflicts of Interest
References
- Roshani, G.H.; Feghhi, S.A.H.; Mahmoudi-Aznaveh, A.; Nazemi, E.; Adineh-Vand, A. Precise volume fraction prediction in oil–water–gas multiphase flows by means of gamma-ray attenuation and artificial neural networks using one detector. Measurement 2014, 51, 34–41. [Google Scholar] [CrossRef]
- Peyvandi, R.G.; Rad, S.Z.I. Application of artificial neural networks for the prediction of volume fraction using spectra of gamma rays backscattered by three-phase flows. Eur. Phys. J. Plus 2017, 132, 511. [Google Scholar] [CrossRef]
- Sattari, M.A.; Roshani, G.H.; Hanus, R.; Nazemi, E. Applicability of time-domain feature extraction methods and artificial intelligence in two-phase flow meters based on gamma-ray absorption technique. Measurement 2021, 168, 108474. [Google Scholar] [CrossRef]
- Sattari, M.A.; Roshani, G.H.; Hanus, R. Improving the structure of two-phase flow meter using feature extraction and GMDH neural network. Radiat. Phys. Chem. 2020, 171, 108725. [Google Scholar] [CrossRef]
- Roshani, G.H.; Nazemi, E.; Roshani, M.M. Intelligent recognition of gas-oil-water three-phase flow regime and determination of volume fraction using radial basis function. Flow Meas. Instrum. 2017, 54, 39–45. [Google Scholar] [CrossRef]
- Hanus, R.; Zych, M.; Petryka, L.; Jaszczur, M.; Hanus, P. Signals features extraction in liquid-gas flow measurements using gamma densitometry. Part 1: Time domain. EPJ Web Conf. 2016, 114, 02035. [Google Scholar] [CrossRef] [Green Version]
- Hanus, R.; Zych, M.; Petryka, L.; Jaszczur, M.; Hanus, P. Signals features extraction in liquid-gas flow measurements using gamma densitometry. Part 2: Frequency domain. EPJ Web Conf. 2016, 114, 02036. [Google Scholar] [CrossRef] [Green Version]
- Hanus, R.; Zych, M.; Kusy, M.; Jaszczur, M.; Petryka, L. Identification of liquid-gas flow regime in a pipeline using gamma-ray absorption technique and computational intelligence methods. Flow Meas. Instrum. 2018, 60, 17–23. [Google Scholar] [CrossRef]
- Hosseini, S.; Roshani, G.H.; Setayeshi, S. Precise gamma based two-phase flow meter using frequency feature extraction and only one detector. Flow Meas. Instrum. 2020, 72, 101693. [Google Scholar] [CrossRef]
- Roshani, G.H.; Nazemi, E.; Feghhi, S.A.H. Investigation of using 60Co source and one detector for determining the flow regime and void fraction in gas-liquid two-phase flows. Flow Meas. Instrum. 2016, 50, 73–79. [Google Scholar] [CrossRef]
- Roshani, G.H.; Nazemi, E.; Feghhi, S.A.; Setayeshi, S. Flow regime identification and void fraction prediction in two-phase flows based on gamma ray attenuation. Measurement 2015, 62, 25–32. [Google Scholar] [CrossRef]
- Nazemi, E.; Roshani, G.H.; Feghhi, S.A.H.; Setayeshi, S.; Zadeh, E.E.; Fatehi, A. Optimization of a method for identifying the flow regime and measuring void fraction in a broad beam gamma-ray attenuation technique. Int. J. Hydrogen Energy 2016, 41, 7438–7444. [Google Scholar] [CrossRef]
- Roshani, G.H.; Nazemi, E.; Roshani, M.M. Flow regime independent volume fraction estimation in three-phase flows using dual-energy broad beam technique and artificial neural network. Neural Comput. Appl. 2016, 28, 1265–1274. [Google Scholar] [CrossRef]
- Nazemi, E.; Feghhi, S.A.H.; Roshani, G.H.; Peyvandi, R.G.; Setayeshi, S. Precise Void Fraction Measurement in Two-phase Flows Independent of the Flow Regime Using Gamma-ray Attenuation. Nucl. Eng. Technol. 2016, 48, 64–71. [Google Scholar] [CrossRef] [Green Version]
- Song, K.; Liu, Y. A compact x-ray system for two-phase flow measurement. Meas. Sci. Technol. 2017, 29, 025305. [Google Scholar] [CrossRef]
- Roshani, M.; Ali, P.J.M.; Roshani, G.H.; Nazemi, B.; Corniani, E.; Phan, N.-H.; Tran, H.-N.; Nazemi, E. X-ray tube with artificial neural network model as a promising alternative for radioisotope source in radiation based two phase flowmeters. Appl. Radiat. Isot. 2020, 164, 109255. [Google Scholar] [CrossRef]
- Roshani, M.; Phan, G.; Roshani, G.H.; Hanus, R.; Nazemi, B.; Corniani, E.; Nazemi, E. Combination of X-ray tube and GMDH neural network as a nondestructive and potential technique for measuring characteristics of gas-oil–water three phase flows. Measurement 2021, 168, 108427. [Google Scholar] [CrossRef]
- Roshani, G.H.; Ali, P.J.M.; Mohammed, S.; Hanus, R.; Abdulkareem, L.; Alanezi, A.A.; Nazemi, E.; Eftekhari-Zadeh, E.; Kalmoun, E.M. Feasibility Study of Using X-ray Tube and GMDH for Measuring Volume Fractions of Annular and Stratified Regimes in Three-Phase Flows. Symmetry 2021, 13, 613. [Google Scholar] [CrossRef]
- Hernandez, A.M.; Boone, J.M. Tungsten anode spectral model using interpolating cubic splines: Unfiltered x-ray spec-tra from 20 kV to 640 kV. Med. Phys. 2014, 41, 042101. [Google Scholar] [CrossRef] [Green Version]
- Nussbaumer, H.J. The fast Fourier transform. In Fast Fourier Transform and Convolution Algorithms; Springer: Berlin, Germany, 1981; pp. 80–111. [Google Scholar]
- Versaci, M.; Morabito, F.C. Image Edge Detection: A New Approach Based on Fuzzy Entropy and Fuzzy Divergence. Int. J. Fuzzy Syst. 2021, 23, 918–936. [Google Scholar] [CrossRef]
- Karami, A.; Roshani, G.H.; Khazaei, A.; Nazemi, E.; Fallahi, M. Investigation of different sources in order to optimize the nuclear metering system of gas–oil–water annular flows. Neural Comput. Appl. 2018, 32, 3619–3631. [Google Scholar] [CrossRef]
- Burrascano, P.; Ciuffetti, M. Early Detection of Defects through the Identification of Distortion Characteristics in Ultrasonic Responses. Math 2021, 9, 850. [Google Scholar] [CrossRef]
- Farahani, A.; Voghoei, S.; Rasheed, K.; Arabnia, H.R. A Brief Review of Domain Adaptation. arXiv 2020, arXiv:2010.03978. [Google Scholar]
- Roshani, M.; Phan, G.; Faraj, R.H.; Phan, N.H.; Roshani, G.H.; Nazemi, B.; Corniani, E.; Nazemi, E. Proposing a gamma ra-di-ation based intelligent system for simultaneous analyzing and detecting type and amount of petroleum by-products. Neural Eng. Technol. 2021, 53, 1277–1283. [Google Scholar]
- Hassan, A.S.; Meyer, D.F. Analysis of The Non-Linear Effect of Petrol Price Changes on Inflation in South Africa. Int. J. Soc. Sci. Humanit. Stud. 2020, 12, 34–49. [Google Scholar]
- Mosorov, V.; Rybak, G.; Sankowski, D. Plug Regime Flow Velocity Measurement Problem Based on Correlability Notion and Twin Plane Electrical Capacitance Tomography: Use Case. Sensors 2021, 21, 2189. [Google Scholar] [CrossRef] [PubMed]
- Roshani, G.; Hanus, R.; Khazaei, A.; Zych, M.; Nazemi, E.; Mosorov, V. Density and velocity determination for single-phase flow based on radiotracer technique and neural networks. Flow Meas. Instrum. 2018, 61, 9–14. [Google Scholar] [CrossRef]
- Versaci, M.; Angiulli, G.; Di Barba, P.; Morabito, F.C. Joint use of eddy current imaging and fuzzy similarities to assess the integrity of steel plates. Open Phys. 2020, 18, 230–240. [Google Scholar] [CrossRef]
- Roshani, M.; Phan, G.T.; Ali, P.J.M.; Roshani, G.H.; Hanus, R.; Duong, T.; Corniani, E.; Nazemi, E.; Kalmoun, E.M. Evaluation of flow pattern recognition and void fraction measurement in two phase flow independent of oil pipeline’s scale layer thickness. Alex. Eng. J. 2021, 60, 1955–1966. [Google Scholar] [CrossRef]
- Aghakhani, M.; Ghaderi, M.R.; Karami, A.; Derakhshan, A.A. Combined effect of TiO2 nanoparticles and input welding pa-rameters on the weld bead penetration in submerged arc welding process using fuzzy logic. Int. J. Adv. Manuf. Technol. 2014, 70, 63–72. [Google Scholar] [CrossRef]
- Pirasteh, A.; Roshani, S.; Roshani, S. Compact microstrip lowpass filter with ultrasharp response using a square-loaded modified T-shaped resonator. Turk. J. Electr. Eng. Comput. Sci. 2018, 26, 1736–1746. [Google Scholar] [CrossRef]
- Bhore, S.J.; Cha, T.S.; Amelia, K.; Shah, F.H. Insights from computational analysis of full-length β-ketoacyl-[ACP] synthase-II cDNA isolated from American and African oil palms. J. Nat. Sci. Biol. Med. 2014, 5, 73–81. [Google Scholar] [CrossRef] [Green Version]
- Moradi, M.J.; Roshani, M.M.; Shabani, A.; Kioumarsi, M. Prediction of the Load-Bearing Behavior of SPSW with Rectangular Opening by RBF Network. Appl. Sci. 2020, 10, 1185. [Google Scholar] [CrossRef] [Green Version]
- Karimi, M.; Kim, H. Energy scheduling for task execution on intermittently-powered devices. ACM SIGBED Rev. 2020, 17, 36–41. [Google Scholar] [CrossRef]
- Roshani, G.H.; Roshani, S.; Nazemi, E.; Roshani, S. Online measuring density of oil products in annular regime of gas-liquid two phase flows. Measurement 2018, 129, 296–301. [Google Scholar] [CrossRef]
- Karami, A.; Veysi, F. A novel metaheuristic combinatorial algorithm to optimize the natural convection across a vertical enclosure divided by perforated flat horizontal louvers inside. Eur. Phys. J. Plus 2021, 136, 1–33. [Google Scholar] [CrossRef]
- Roshani, S.; Roshani, S. Design of a very compact and sharp bandpass diplexer with bended lines for GSM and LTE applications. AEU Int. J. Electron. Commun. 2019, 99, 354–360. [Google Scholar] [CrossRef]
- Hanus, R.; Zych, M.; Mosorov, V.; Golijanek-Jędrzejczyk, A.; Jaszczur, M.; Andruszkiewicz, A. Evaluation of liquid-gas flow in pipeline using gamma-ray absorption technique and advanced signal processing. Metrol. Meas. Syst. 2021, 28, 145–159. [Google Scholar]
- Roshani, S.; Roshani, S.; Zarinitabar, A. A modified Wilkinson power divider with ultra harmonic suppression using open stubs and lowpass filters. Analog. Integr. Circuits Signal Process. 2019, 98, 395–399. [Google Scholar] [CrossRef]
- Niccolai, A.; Caputo, D.; Chieco, L.; Grimaccia, F.; Mussetta, M. Machine Learning-Based Detection Technique for NDT in Industrial Manufacturing. Math 2021, 9, 1251. [Google Scholar] [CrossRef]
- Dunga, H.M. An empirical analysis on determinants of food security among female-headed households in South Af-rica. Int. J. Soc. Sci. Humanit. Stud. 2020, 12, 66–81. [Google Scholar]
- Basahel, A.; Sattari, M.A.; Taylan, O.; Nazemi, E. Application of Feature Extraction and Artificial Intelligence Techniques for Increasing the Accuracy of X-ray Radiation Based Two Phase Flow Meter. Mathematics 2021, 9, 1227. [Google Scholar] [CrossRef]
- Roshani, G.; Nazemi, E.; Roshani, M. Identification of flow regime and estimation of volume fraction independent of liquid phase density in gas-liquid two-phase flow. Prog. Nucl. Energy 2017, 98, 29–37. [Google Scholar] [CrossRef]
- Karami, A.; Yousefi, T.; Harsini, I.; Maleki, E.; Mahmoudinezhad, S. Neuro-Fuzzy Modeling of the Free Convection Heat Transfer from a Wavy Surface. Heat Transf. Eng. 2014, 36, 847–855. [Google Scholar] [CrossRef]
- Moradi, M.; Daneshvar, K.; Ghazi-Nader, D.; Hajiloo, H. The prediction of fire performance of concrete-filled steel tubes (CFST) using artificial neural network. Thin-Walled Struct. 2021, 161, 107499. [Google Scholar] [CrossRef]
- Rodriguez, A.; Mokoena, M.; Corcho, F.; Bisetty, K.; Perez, J. Computational study of the folded structure of the miniprotein CLN025 in explicit and implicit solvents. J. Nat. Sci. Biol. Med. 2011, 2, 2229–7707. [Google Scholar]
- Jamshidi, M.B.; Siahkamari, H.; Roshani, S.; Roshani, S. A compact Gysel power divider design using U-shaped and T-shaped resonators with harmonics suppression. Electromagnetics 2019, 39, 491–504. [Google Scholar] [CrossRef]
- David, O.O.; Grobler, W. Age Progression, Social Interventions and Food Insecurity in South Africa: Logistic Re-gression Analysis. Int. J. Soc. Sci. Humanit. Stud. 2020, 12, 289–305. [Google Scholar]
- Roshani, G.; Nazemi, E. Intelligent densitometry of petroleum products in stratified regime of two phase flows using gamma ray and neural network. Flow Meas. Instrum. 2017, 58, 6–11. [Google Scholar] [CrossRef]
- Arab, F.; Karimi, M.; Safavi, S.M. Analysis of QoS parameters for video traffic in homeplug AV stand-ard using NS-3. In Proceedings of the 2016 Smart Grids Conference (SGC), Kerman, Iran, 20–21 December 2016; pp. 1–6. [Google Scholar]
- Roshani, G.; Nazemi, E.; Roshani, M. Usage of two transmitted detectors with optimized orientation in order to three phase flow metering. Measurement 2017, 100, 122–130. [Google Scholar] [CrossRef]
- Jamshidi, M.B.; Roshani, S.; Talla, J.; Roshani, S.; Peroutka, Z. Size reduction and performance improvement of a microstrip Wilkinson power divider using a hybrid design technique. Sci. Rep. 2021, 11, 1–15. [Google Scholar] [CrossRef]
- Moradi, M.J.; Hariri-Ardebili, M.A. Developing a Library of Shear Walls Database and the Neural Network Based Predictive Meta-Model. Appl. Sci. 2019, 9, 2562. [Google Scholar] [CrossRef] [Green Version]
- Alkabaa, A.S.; Nazemi, E.; Taylan, O.; Kalmoun, E.M. Application of Artificial Intelligence and Gamma Attenuation Techniques for Predicting Gas-Oil-Water Volume Fraction in Annular Regime of Three-Phase Flow Independent of Oil Pipeline’s Scale Layer. Mathematics 2021, 9, 1460. [Google Scholar] [CrossRef]
- Roshani, S.; Roshani, S. Two-Section Impedance Transformer Design and Modeling for Power Amplifier Applications. Ap-Plied Comput. Electromagn. Soc. J. 2017, 32, 1042–1047. [Google Scholar]
- Zych, M.; Hanus, R.; Vlasak, P.; Jaszczur, M.; Petryka, L. Radiometric methods in the measurement of particle-laden flows. Powder Technol. 2017, 318, 491–500. [Google Scholar] [CrossRef]
- Pirasteh, A.; Roshani, S.; Roshani, S. A modified class-F power amplifier with miniaturized harmonic control circuit. AEU Int. J. Electron. Commun. 2018, 97, 202–209. [Google Scholar] [CrossRef]
- Hussain, M.; Banday, A.; Tabish, M. Computational prediction and identification of new splice variant of PKA catalytic alpha subunit gene in mouse. J. Nat. Sci. Biol. Med. 2011, 2, 687–693. [Google Scholar]
- Kharazmi, O.; Jahangard, S. A new family of lifetime distributions in terms of cumulative hazard rate function. Commun. Fac. Sci. Univ. Ank. Ser. A1Math. Stat. 2020, 69, 1–22. [Google Scholar] [CrossRef]
- Kharazmi, O.; Saadatinik, A.; Jahangard, S. Odd Hyperbolic Cosine Exponential-Exponential (OHC-EE) Distribution. Ann. Data Sci. 2019, 6, 765–785. [Google Scholar] [CrossRef] [Green Version]
- Hayerikhiyavi, M.; Dimitrovski, A. Gyrator-Capacitor Modeling of a Continuously Variable Series Reactor in Different Operating Modes. In Proceedings of the 2021 IEEE Kansas Power and Energy Conference (KPEC), Manhattan, KS, USA, 19–20 April 2021; pp. 1–5. [Google Scholar]
- Hayerikhiyavi, M.; Dimitrovski, A. A Practical Assessment of the Power Grid Inertia Constant Using PMUs. In Proceedings of the 2020 52nd North American Power Symposium (NAPS), Tempe, AZ, USA, 11–13 October 2021; pp. 1–5. [Google Scholar]
- Sarhadi, M.; Aryan, L.; Zarei, M. The Estrogen Receptor and Breast Cancer: A Complete Review. CRPASE 2020, 6, 309–314. [Google Scholar]
- Sadeghi, H.; Bordbar, H.; Hostikka, S. Generating Emissivity Charts for Fuel Gases from High-Resolution Spectral Absorption Data. In Proceedings of the 18th Brazilian Congress of Thermal Sciences and Engineering, online, 16–20 November 2020. [Google Scholar] [CrossRef]
- Sadeghi, H.; Bordbar, H.; Hostikka, S. An Assessment of Wsgg Model for Calculation of Radiative Heat Flux in fds, January 2020. In Proceedings of the 18th Brazilian Congress of Thermal Sciences and Engineering, online, 16–20 November 2020. [Google Scholar] [CrossRef]
- Chapnevis, A.; Guvenc, I.; Bulut, E. Traffic Shifting based Resource Optimization in Aggregated IoT Communication. In Proceedings of the 2020 IEEE 45th Conference on Local Computer Networks (LCN), Sydney, Australia, 16–19 November 2020; pp. 233–243. [Google Scholar]
- Arasteh, S.; Mahdavi, M.; Bideh, P.N.; Hosseini, S.; Chapnevis, A. Security Analysis of two Key Based Wa-termarking Schemes Based on QR Decomposition. In Proceedings of the Iranian Conference on Electrical Engineering (ICEE), Mashhad, Iran, 8–10 May 2018; pp. 1499–1504. [Google Scholar]
- Chapnevis, A.; Sadeghiyan, B. A Secure Two-Party Computation Protocol for Intersection Detection between Two Convex Hulls. arXiv 2020, arXiv:2011.00319. [Google Scholar]
- Ashrafi, R.; Azarbayjani, M.; Cox, R.; Futrell, B.; Glass, J.; Zarrabi, A.; Amirazar, A. Assessing the Performance of UFAD System in an Office Building Located in Various Climate Zones. In Proceedings of the Symposium on Simulation for Architecture and Urban Design, Atlanta, GA, USA, 7–9 April 2019. [Google Scholar]
- Gukeh, M.J.; Roy, T.; Sen, U.; Ganguly, R.; Megaridis, C.M. Lateral Spreading of Gas Bubbles on Submerged Wettability-Confined Tracks. Langmuir 2020, 36, 11829–11835. [Google Scholar] [CrossRef] [PubMed]
- Bernardini, J.; Sen, U.; Jafari Gukeh, M.; Asinari, P.; Megaridis, C.M. Wettability-Engineered Meshes for Gas Mi-crovolume Precision Handling in Liquids. ACS Appl. Mater. Interfaces 2020, 12, 18046–18055. [Google Scholar] [CrossRef] [PubMed]
- Damoulakis, G.; Jafari-Gukeh, M.; Koukoravas, T.P.; Megaridis, C. High-performance Planar Thermal Diode with Wickless Components. J. Electron. Packag. 2021, in press. [Google Scholar] [CrossRef]
- Seyedi, M.; Taher, S.A.; Ganji, B.; Guerrero, J. A Hybrid Islanding Detection Method Based on the Rates of Chang-es in Voltage and Active Power for the Multi-Inverter Systems. IEEE Trans. Smart Grid 2021, 12, 2800–2811. [Google Scholar] [CrossRef]
- Roshani, M.; Sattari, M.A.; Ali, P.J.M.; Roshani, G.H.; Nazemi, B.; Corniani, E.; Nazemi, E. Application of GMDH neural network technique to improve measuring precision of a simplified photon attenuation based two-phase flowmeter. Flow Meas. Instrum. 2020, 75, 101804. [Google Scholar] [CrossRef]
- Hashemi Tonekaboni, N.; Voghoei, S.; Yazdansepas, D. How Personalized Feedback Emails Can En-hance Participation Rate in Online Courses. In Proceedings of the 51st ACM Technical Symposium on Computer Science Education, New York, NY, USA, 11–14 March 2020; p. 1376. [Google Scholar]
- Salimi, J.; Ramezanianpour, A.M.; Moradi, M.J. Studying the effect of low reactivity metakaolin on free and restrained shrinkage of high performance concrete. J. Build. Eng. 2020, 28, 101053. [Google Scholar] [CrossRef]
- Jahanshahi, A.; Taram, M.K.; Eskandari, N. Blokus Duo game on FPGA. In Proceedings of the 17th CSI International Symposium on Computer Architecture & Digital Systems (CADS 2013), Tehran, Iran, 30–31 October 2013; pp. 149–152. [Google Scholar]
- Roshani, S.; Roshani, S. Design of a high efficiency class-F power amplifier with large signal and small signal measurements. Measurement 2020, 149, 106991. [Google Scholar] [CrossRef]
- Rashidisabet, H.; Thomas, P.J.; Ajilore, O.; Zulueta, J.; Moore, R.C.; Leow, A. A systems biology approach to the digital behaviorome. Curr. Opin. Syst. Biol. 2020, 20, 8–16. [Google Scholar] [CrossRef]
- Haykin, S. Neural Networks: A Comprehensive Foundation, 2nd ed.; Prentice-Hall Inc.: Upper Saddle River, NJ, USA, 1999; p. 842. [Google Scholar]
- Shahsavand, A.; Ahmadpour, A. Application of optimal RBF neural networks for optimization and characterization of porous materials. Comput. Chem. Eng. 2005, 29, 2134–2143. [Google Scholar] [CrossRef]
- Yu, B.; He, X. Training radial basis function networks with differential evolution. IEEE Int. Conf. Granul. Comput. 2006, 11, 369–372. [Google Scholar] [CrossRef] [Green Version]
- Hartman, E.J.; Keeler, J.D.; Kowalski, J.M. Layered neural networks with Gaussian hidden units as universal approxima-tors. Neural Comput. 1990, 2, 210–215. [Google Scholar] [CrossRef]
- Cacciola, M.; La Foresta, F.; Morabito, F.C.; Versaci, M. Advanced use of soft computing and eddy current test to evaluate mechanical integrity of metallic plates. NDT E Int. 2007, 40, 357–362. [Google Scholar] [CrossRef]
- Ghanei, S.; Vafaeenezhad, H.; Kashefi, M.; Eivani, A.; Mazinani, M. Design of an expert system based on neuro-fuzzy inference analyzer for on-line microstructural characterization using magnetic NDT method. J. Magn. Magn. Mater. 2015, 379, 131–136. [Google Scholar] [CrossRef]
- Naik, S.; Patel, B.; Pandey, R. Shape, size and maturity features extraction with fuzzy classifier for non-destructive mango (Mangifera Indica, L., cv. Kesar) grading. In Proceedings of the 2015 IEEE Technological Innovation in ICT for Agriculture and Rural Development (TIAR), Chennai, India, 10–12 July 2015; pp. 1–7. [Google Scholar]
- Salgado, C.M.; Pereira, C.M.; Schirru, R.; Brandão, L.E. Flow regime identification and volume fraction prediction in multiphase flows by means of gamma-ray attenuation and artificial neural networks. Prog. Nucl. Energy 2010, 52, 555–562. [Google Scholar] [CrossRef]
- Karami, A.; Roshani, G.H.; Nazemi, E.; Roshani, S. Enhancing the performance of a dual-energy gamma ray based three-phase flow meter with the help of grey wolf optimization algorithm. Flow Meas. Instrum. 2018, 64, 164–172. [Google Scholar] [CrossRef]
- Roshani, G.H.; Karami, A.; Nazemi, E.; Shama, F. Volume fraction determination of the annular three-phase flow of gas-oil-water using adaptive neuro-fuzzy inference system. Comput. Appl. Math. 2018, 37, 4321–4341. [Google Scholar] [CrossRef]
- Rad, S.I.; Peyvandi, R.G. A simple and inexpensive design for volume fraction prediction in three-phase flow meter: Single source-single detector. Flow Meas. Instrum. 2019, 69, 101587. [Google Scholar] [CrossRef]
- Rad, S.Z.I.; Peyvandi, R.G.; Sadrzadeh, S. Determination of the volume fraction in (water-gasoil-air) multiphase flows using a simple and low-cost technique: Artificial neural networks. Phys. Fluids 2019, 31, 093301. [Google Scholar] [CrossRef]


| ANN Type | RBFNN |
|---|---|
| Goal of Mean Squared Error (MSE) | 0 |
| Radial basis functions spread | 4 |
| Maximum neuron in hidden layer | 35 |
| Number of neurons to add between each test | 1 |
| ANN Type | RBFNN | |
|---|---|---|
| Gas | Water | |
| Goal of Mean Squared Error (MSE) | 0 | 0 |
| Radial basis functions spread | 4 | 3 |
| Maximum neuron in hidden layer | 45 | 58 |
| Number of neurons to add between each test | 1 | 1 |
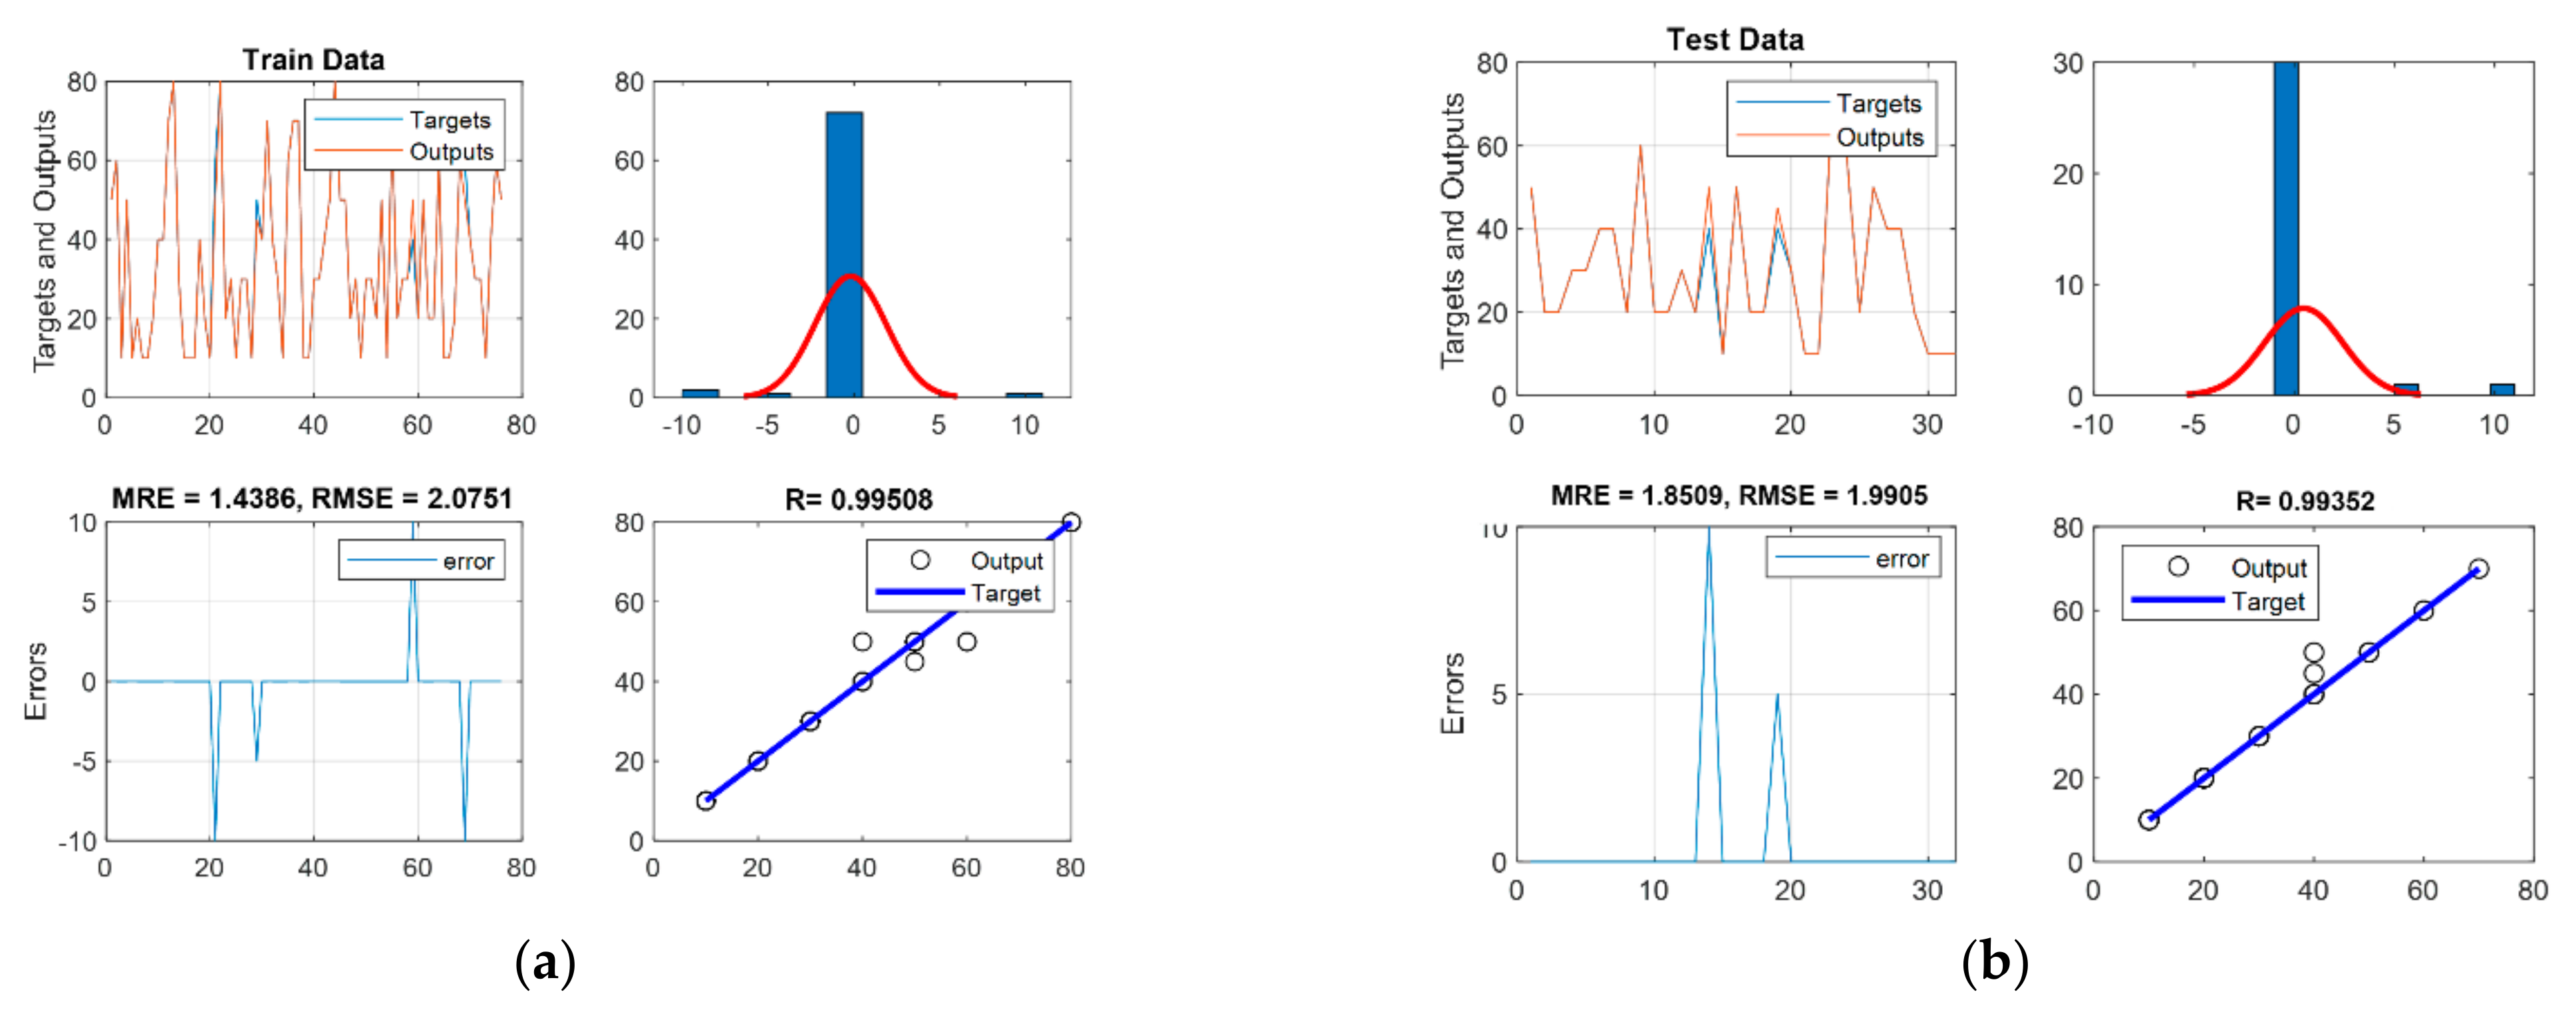
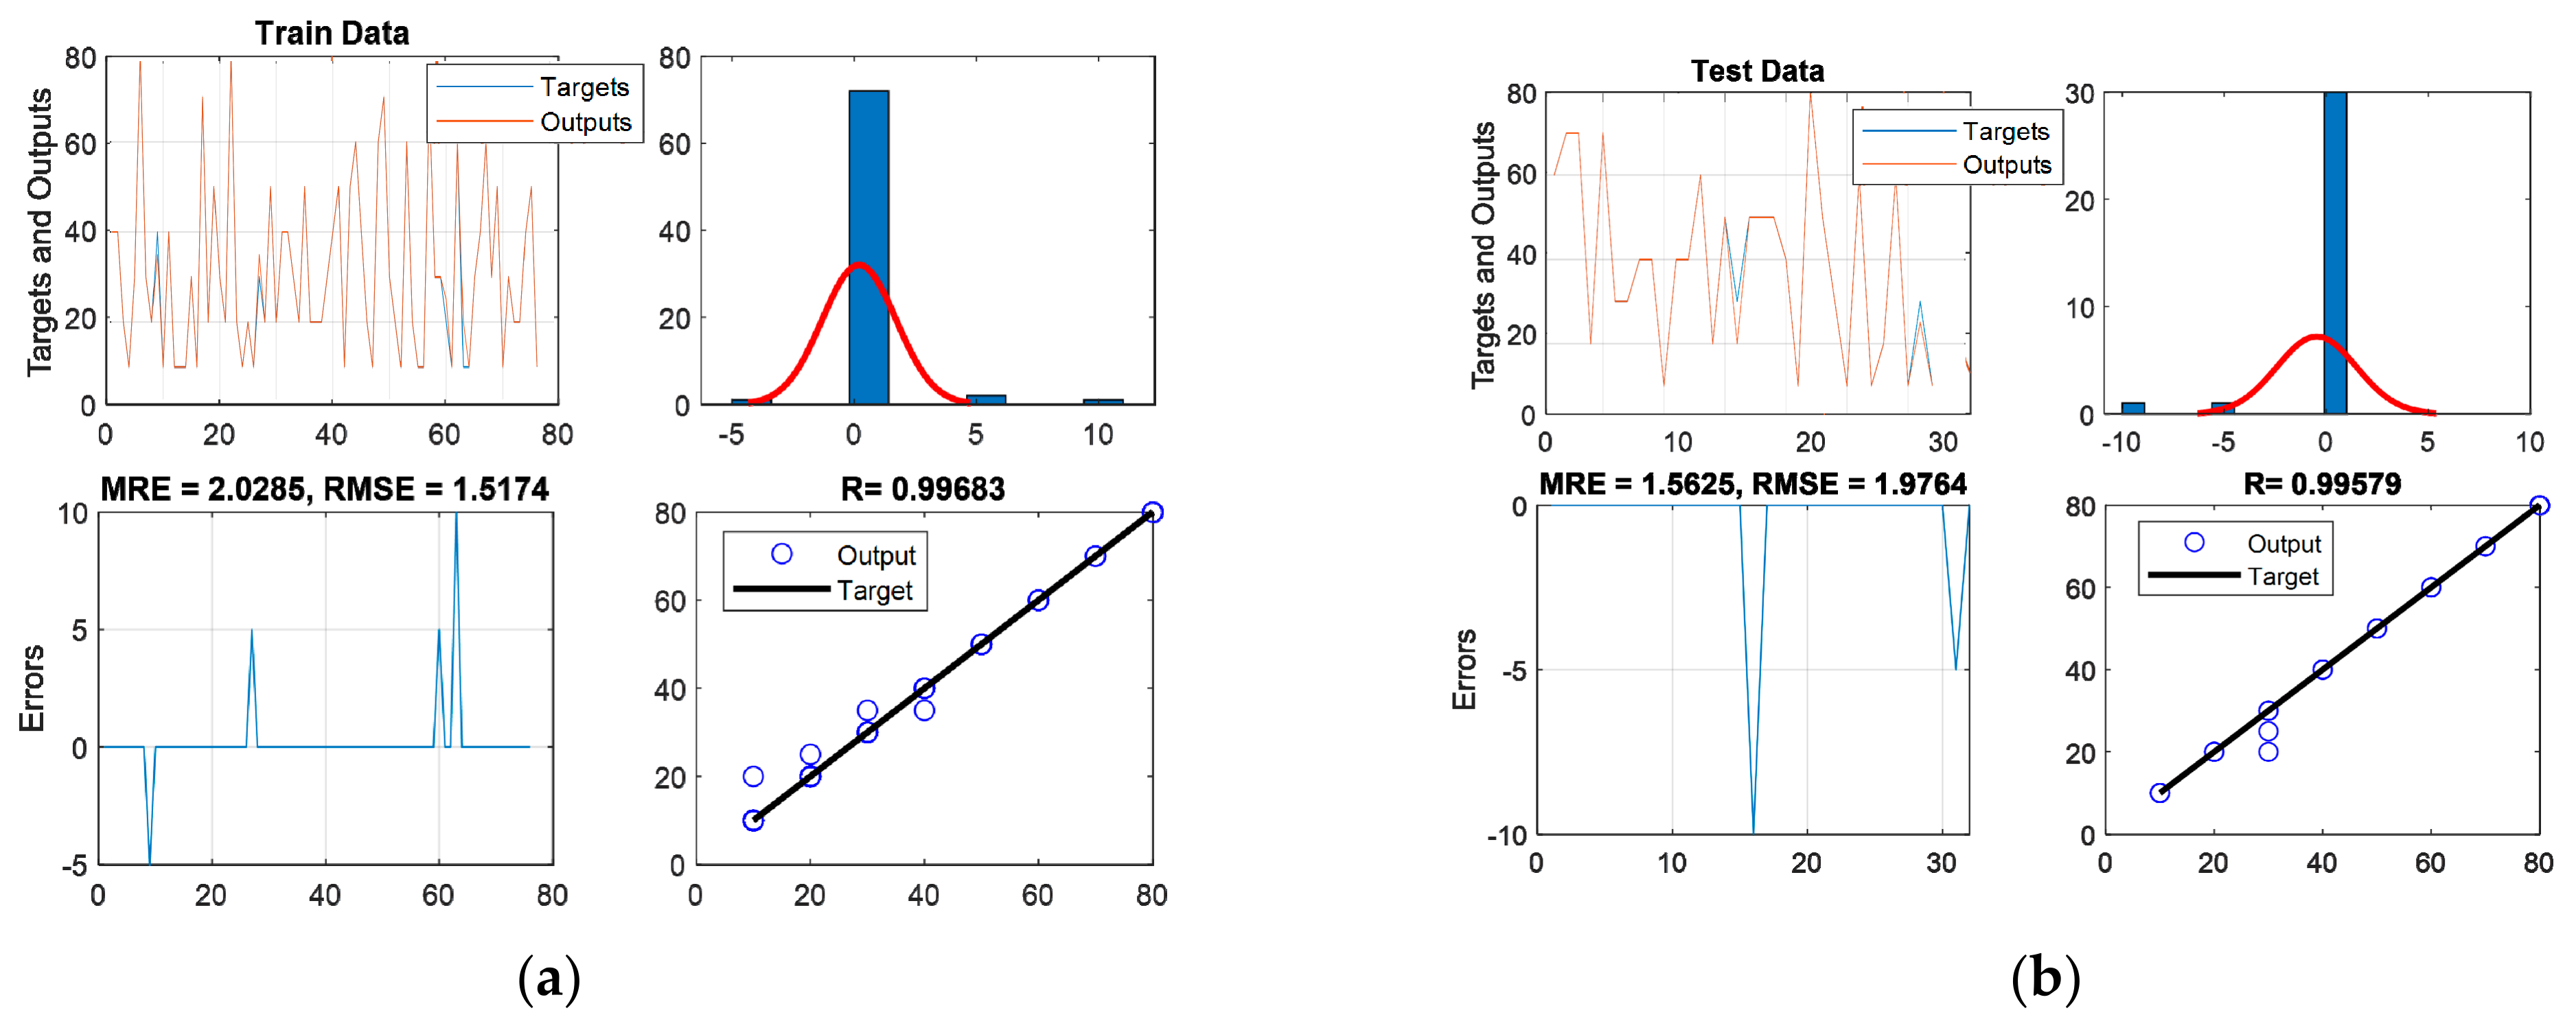
| Output | RMSE Train | MRE Train | RMSE Test | MRE Test |
|---|---|---|---|---|
| Gas fraction | 2.07 | 1.43 | 1.99 | 1.85 |
| Water fraction | 1.57 | 2.02 | 1.97 | 1.56 |
| Reference | Type of ANN | Flow Regime | Regime Classification | Volume Fraction Prediction | |
|---|---|---|---|---|---|
| MRE% | RMSE | ||||
| [2] | MLP | Three Phase (Stratified) | - | 6.47 | 1.6 |
| [17] | GMDH | Three Phase (Annular, Stratified, Homogenous) | Not completely | - | 5.39 |
| [88] | MLP | Three Phase (Annular, Stratified, Homogenous) | Completely | 3.5 | - |
| [89] | Jaya optimization algorithm and neuro-fuzzy network | Three Phase (Stratified) | - | 1.31 | 0.56 |
| [90] | adaptive neuro-fuzzy inference system | Three Phase (Annular) | - | 2.73 | - |
| [91] | MLP | Three Phase (Stratified) | - | 4.64 | 1.49 |
| [92] | MLP | Three Phase (Stratified) | - | 7.08 | 2.48 |
| This study | RBF | Three Phase (Annular, Stratified, Homogenous) | completely | 2.02 | 2.07 |
Publisher’s Note: MDPI stays neutral with regard to jurisdictional claims in published maps and institutional affiliations. |
© 2021 by the authors. Licensee MDPI, Basel, Switzerland. This article is an open access article distributed under the terms and conditions of the Creative Commons Attribution (CC BY) license (https://creativecommons.org/licenses/by/4.0/).
Share and Cite
Taylan, O.; Sattari, M.A.; Elhachfi Essoussi, I.; Nazemi, E. Frequency Domain Feature Extraction Investigation to Increase the Accuracy of an Intelligent Nondestructive System for Volume Fraction and Regime Determination of Gas-Water-Oil Three-Phase Flows. Mathematics 2021, 9, 2091. https://doi.org/10.3390/math9172091
Taylan O, Sattari MA, Elhachfi Essoussi I, Nazemi E. Frequency Domain Feature Extraction Investigation to Increase the Accuracy of an Intelligent Nondestructive System for Volume Fraction and Regime Determination of Gas-Water-Oil Three-Phase Flows. Mathematics. 2021; 9(17):2091. https://doi.org/10.3390/math9172091
Chicago/Turabian StyleTaylan, Osman, Mohammad Amir Sattari, Imene Elhachfi Essoussi, and Ehsan Nazemi. 2021. "Frequency Domain Feature Extraction Investigation to Increase the Accuracy of an Intelligent Nondestructive System for Volume Fraction and Regime Determination of Gas-Water-Oil Three-Phase Flows" Mathematics 9, no. 17: 2091. https://doi.org/10.3390/math9172091
APA StyleTaylan, O., Sattari, M. A., Elhachfi Essoussi, I., & Nazemi, E. (2021). Frequency Domain Feature Extraction Investigation to Increase the Accuracy of an Intelligent Nondestructive System for Volume Fraction and Regime Determination of Gas-Water-Oil Three-Phase Flows. Mathematics, 9(17), 2091. https://doi.org/10.3390/math9172091