Article

Evaluating the Efficiency of Off-Ball Screens in Elite Basketball Teams via Second-Order Markov Modelling

by
Nikolaos Stavropoulos
1,
Alexandra Papadopoulou
2 and
Pavlos Kolias
2,*
1
Laboratory of Evaluation of Human Biological Performance, School of Physical Education and Sport Science, Aristotle University of Thessaloniki, 57001 Thessaloniki, Greece
2
Section of Statistics and Operational Research, Department of Mathematics, Aristotle University of Thessaloniki, 54124 Thessaloniki, Greece
*
Author to whom correspondence should be addressed.
Mathematics 2021, 9(16), 1991; https://doi.org/10.3390/math9161991
Submission received: 8 July 2021 / Revised: 16 August 2021 / Accepted: 17 August 2021 / Published: 20 August 2021

Abstract

:
In basketball, the offensive movements on both strong and weak sides and tactical behavior play major roles in the effectiveness of a team’s offense. In the literature, studies are mostly focused on offensive actions, such as ball screens on the strong side. In the present paper, for the first time a second-order Markov model is defined to evaluate players’ interactions on the weak side, particularly for exploring the effectiveness of tactical structures and off-ball screens regarding the final outcome. The sample consisted of 1170 possessions of the FIBA Basketball Champions League 2018–2019. The variables of interest were the type of screen on the weak side, the finishing move, and the outcome of the shot. The model incorporates partial non-homogeneity according to the time of the execution (0–24″) and the quarter of playtime, and it is conditioned on the off-ball screen type. Regarding the overall performance, the results indicated that the outcome of each possession was influenced not only by the type of the executed shot, but also by the specific type of screen that took place earlier on the weak side of the offense. Thus, the proposed model could operate as an advisory tool for the coach’s strategic plans.

1. Introduction

Basketball is a team sport that is constantly evolving due to the changes in regulations, the faster pace, the increasing physical abilities of the players, and the upgrading of training methods. Offensive movements and players’ tactical cooperation play major roles in both individual and team performance concerning offense [1,2]. The most frequent offensive movement between two players on the strong side is the ball screen. Ball screens are important coordinated movements used in offense, providing enhanced strategy on the court [3]. During the action of ball screen, one player is the screener, who blocks the defensive movements of the opponents from an appropriate area, and the other is the ball handler, who creates opportunities by either passing to the screener-cutter (roll or pop out to the basket) or becoming the cutter by executing a shot himself [4,5]. Previous studies have indicated that the effectiveness of the screen is affected by time-related characteristics, such as the offense’s remaining time, the type of screen and the area of execution [1]. In addition, coordinated movements on the weak side are also extremely important for the overall offensive performance of each team. According to previous findings, the most common offensive tactics used on the weak side are the off-ball screens [6]. The continuous movements and screen types on the weak side are crucial factors in allowing advantageous positions while executing the shots. Previous results in NCAA basketball league have shown that the winning teams had approximately 11 off-ball screens less than the losing teams [7].
Statistical and stochastic modelling has already been applied to model performance in basketball. The most common approach is to apply linear or generalized linear regression models to box-score data, while considering each individual player’s statistics and overall team statistics [8]. Furthermore, researchers have applied quantile regression methods, which can provide more specific descriptions of the relationships between key performance indicators and the outcome of a basketball game compared to multiple regression [9]. These approaches lack the detail of the evolution of the match, as they mainly focus on overall performance. Other studies have used discriminant analysis to obtain the most dominant factors that could potentially lead a team to victory in both the Basketball World Cup and domestic leagues [10,11,12]. Play-by-play data have more recently been included in basketball research and expanded the traditional use of summary statistics of tournaments. Such data can be used for more detailed illustrations of the evolution of basketball matches [13].
Markov models are useful for modelling play-by-play data, as they effectively describe the evolution of future successive possession by each of the two competing teams. One of the earliest attempts was the application of a Markov chain with state space consisting of the team that had the possession, how the possession was taken, and the points scored during the previous possession. This model could derive the progression of the basketball match over time [14]. In NCAA, a combination of logistic regression and Markov modelling has been used to evaluate the rankings of the teams and predict the final standings of the tournament [15]. Furthermore, researchers have applied a Markov model to simulate a basketball match in the NBA and forecast the outcome of the match and the points scored, based on the transition matrix [13]. This model captured the non-homogeneity of a basketball match, which was mainly observed in the first and last minutes of playtime, and provided a more detailed state space, including time, the difference in points and characteristics of the teams. Basketball formations also play a crucial role in the overall performance of a team, as different positions exhibit different characteristics and should optimally cooperate with the rest of the team. Markov chain modelling has been used to compare the offensive and defensive performances of different formations, and the performance of these formations over time [16]. Finally, Markov chains have been used as modelling tools in various other domains, such as manpower planning, finance, healthcare, biology, and others [17,18,19,20,21,22,23,24,25,26,27,28].
The class of high-order Markov chains is an essential stochastic tool, which fits more adequately when the phenomena under investigation incorporate longer dependencies. One of the earliest studies with high-order Markov chains applied them in manpower systems, and they presented a considerably better fit compared to first-order Markov models [29]. A major problem of high-order Markov chains is the great number of the parameters that must be estimated, which increases geometrically according to the order of the model. Raftery, in 1985, was the first to propose a high-order Markov model, called the mixture transition distribution (MTD) model, where each transition probability is a weighted linear combination of the previous transition probabilities [30]. In this formulation, one can estimate a smaller number of parameters by solving a linear system, as in the well-known Yule–Walker system of equations found in time-series analysis. The limiting distribution of high-order Markov chains was studied in [31]. Ching and his colleagues extended Raftery’s model by introducing variability into the transition probability matrices, and proved that, given some mild conditions, the proposed model has a stationary distribution [32]. More recently, in the field of the mixture transition probability models for high-order Markov chains, the G-inhomogeneous Markov system was introduced, and its asymptotic behavior, under assumptions easily met in practice, was studied [33]. Applications of high-order Markov chains can be found in various domains, such as DNA analysis [34,35], analysis of wind speed [36], and manpower planning [29].
To our knowledge, there exist limited studies concerning basketball screens on the weak side of the court and their influences on a game’s outcome. The purpose of the present study was to develop a second-order Markov modelling framework that would evaluate the characteristics of off-ball screens that positively affect the finishing move and the outcome of the offensive movement, thus improving the performance of the team. Apart from the overall performance, the aim of the current paper is to examine how time, expressed either as the quarter of play or as the time clock (0–24 s), could influence the transition probabilities from screens and finishing moves to outcomes. Section 2 presents the main methodological tools adopted in this paper. More specifically, Section 2.1 presents the theoretical background and definitions of high-order Markov chains. Section 2.2 presents the description of the data and the measured variables, embeds the second-order Markov theory in the basketball context, where the state space and the basic parameters of the Markov modelling are provided. Section 3 provides the results of the analysis. Section 4 discusses the obtained results from a basketball viewpoint and finally, the conclusions are provided in Section 5.

2. Modelling Framework

2.1. Second-Order Markov Modelling

A first-order Markov chain { X n } ,   n = 0 , 1 , , with state space V = { 1 , 2 , , m } is a discrete stochastic process, in which the transition to the next state is governed only by the current state of the process and it is independent of the past states. This property, called Markovian, could be written as
P ( X n + 1 = j | X n = i ,     X n 1 = i n 1 ,   , X 0 = i 0 ) = P ( X n + 1 = j | X n = i ) = p i j ( n ) ,
where i , j , i 0 , , i n 1   V and i = 1 m p i j ( n ) = 1 ,   p i j ( n )   0 . The matrix P ( n ) , which contains the probabilities p i j ( n ) is called the transition probability matrix. If the probabilities p i j ( n ) are independent of time, i.e., p i j ( n ) = p i j ,     n , then the Markov chain is called time homogeneous. If we consider a first-order Markov chain, then the k-order Markov chain ( X n ) with state space S = { 1 , 2 , , M } , where the states of S are k-tuples of the elements of V, is a discrete stochastic process, for which the k-order Markovian property holds:
P ( X n + 1 = j | X n = i ,   ,   X 0 = i 0 ) = P ( X n + 1 = j | X n = i ,   ,   X n k + 1 = i n k + 1 ) ,
and the number of states is equal to M = ( m 1 ) m k . In general, the transition probability matrix of the high-order Markov chain will contain many zero cells, as it is impossible to transition to states where the past observations do not overlap. To present the transition probabilities in a more elegant way, we can use the reduced transition probability matrix, which contains only the non-zero probabilities [37]. For example, the reduced transition probability matrix for a second-order Markov chain with state space S = { 1 , 2 } is presented in Table 1. Note that in a second-order Markov chain, the subscript of the probabilities contain three states, where the first two refer to past states and the last one to the next state.
By using this technique, we can transform any Markov chain of order n to a first-order model, by appropriately changing the state space and keeping all the n-tuples. The high-order Markov chains are, in general, more efficient as they acquire memory and can capture longer dependencies compared to the first order; however, the number of parameters increases with geometric growth with respect to the order. This leads to computational problems while estimating all the parameters. Some alternative specifications of the n-order model have been proposed, which reduce the set of parameters by applying linear dependencies between the n-step probabilities [30]. These MTD models are, in general, more practical to estimate, however the assumption of dependent transition probabilities may not be necessary, especially when we are dealing with short-term correlations. In the basketball context, the outcome of each possession could be influenced by two preceding events, namely, the type of screen on the weak side of the court and the finishing action. Thus, a second-order Markov chain could be more feasible for estimation, as the number of varying parameters is reasonable for direct estimations of the transition probabilities. Hence, the model could examine the relationship between those past movements and the final outcome of the offense. In this scenario, the transition probabilities p k i j ( n ) denote the probability that the Markov chain will transition to state j , while currently it is at state i at time n and the previous state was k . With inclusion of the second-order transition probabilities, we can arrange the non-homogeneous second-order transition matrix P ( n ) , which is the basic parameter of the process. The maximum likelihood estimates (MLE) for the transition probabilities of a second-order Markov chain are given by
p ^ k i j ( n ) = N ( k , i ( n ) j ) x M N ( k , i ( n ) x )   ,
where N ( k , i ( n ) j ) denotes the number of transitions from the pair ( k , i ) to state j, starting from the position n. Please note that if we assume that the transition probabilities are time-invariant, that is P ( n ) = P , then the MLE estimates for the transition probabilities are given by
p ^ k i j = N ( k , i j ) x M N ( k , i x )   ,
where ( k , i j ) denotes the number of transitions from the pair ( k , i ) to state j.

2.2. Basketball Modelling

In the context of basketball, assume that { X n } is a discrete first-order Markov chain that denotes the current event taking place during the offense. The events that happen are the screen type (TS), the finishing move type (TF) and the outcome (O). Hence, the process takes values in the three-dimensional state space, which is V = { T S ,   T F , O } . For example, consider the scenario where a team obtains possession and screens outside the paint with a staggered screen and the player that gets the ball shoots from inside the paint with a lay-up and scores a 2-pt shot; then, the associated transitions of this scenario will be, “Staggered screen outside the paint, 0, 0 → 0, Lay-up, 0 → 0,0, Successful 2-pt shot”.
To model the successive events during each offense, we have used a sample of 1170 possessions by 16 competing teams of the FIBA Basketball Champions League 2018–2019. The recordings of the possessions were made using the “SportScout” video-analysis software. The possessions were observed by three assistant coaches, with at least 5 years of experience in professional basketball. Cohen’s kappa (κ) correlation coefficient was used to assess the inter-rater reliability. The values obtained displayed a high degree of agreement (κmin = 0.91). For each possession, the events were recorded, as well as the time of the shot clock (T) and the quarter of playtime (Q1–Q4). The levels of each of the recorded variables are presented in Table 2. The possible outcomes consisted of successful and unsuccessful 2- and 3-pt shots and possession change, which includes turnovers, steals, blocks, offensive fouls, and the violation of the 24 s duration of offense.
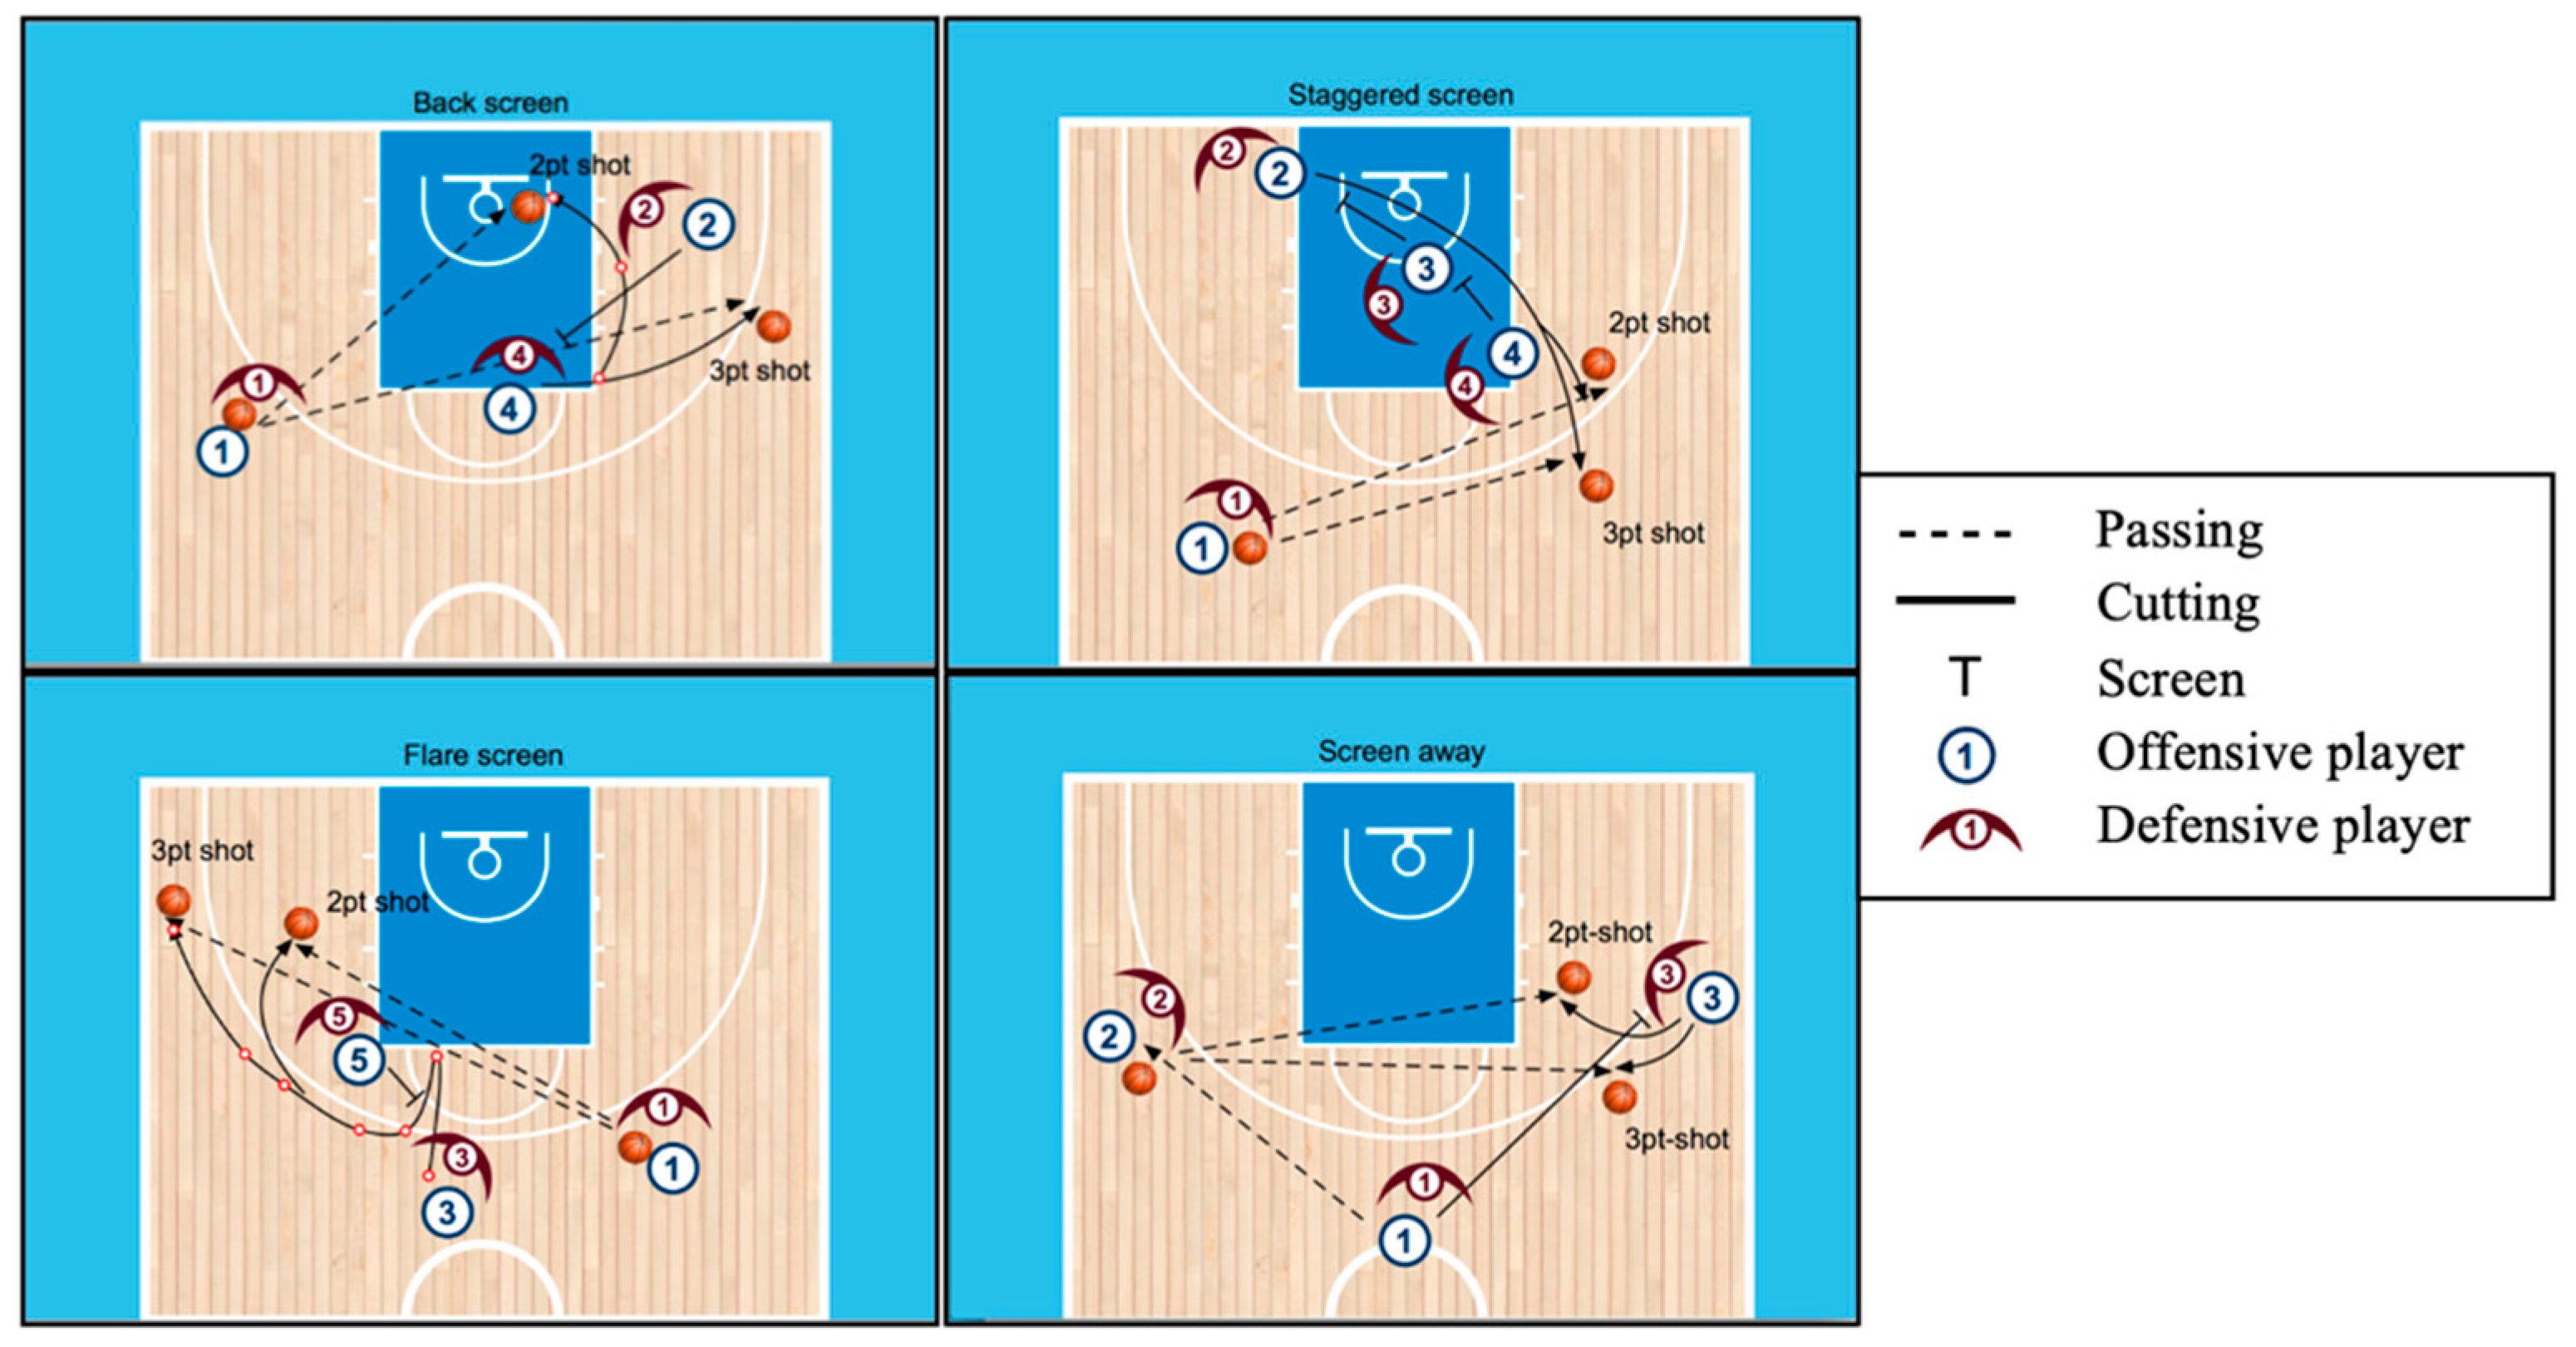
The screen types were defined using standard basketball terminology. More specifically, two consecutive screens for a player, in the same direction away from the ball were defined as a staggered screen. A flare screen was defined as a screen set at the elbow of the free throw line where the player fades out on the weak side. Screen the screener occurs when an offensive player sets a screen and, at the same time, receives a screen from a teammate. To pass on the side and set a screen for a player in the opposite direction was described as a screen away. Down screen is a screen where an offensive player sets himself in a position away from the ball. Back screen occurs when an offensive player stands behind the defensive player with his back toward the basket. Single- and double-staggered screens were combined into one category, as well as the single- and double- high-cross screens. Examples of screen types under consideration are presented in Figure 1.
We shall note here that not all transitions were observed, for example if the finishing move was a middle-range shot (2-pt), the only possible outcomes would be either a successful or unsuccessful 2-pt shot. For the first-order Markov chain, the possible transitions between states are presented in Table 3. Apparently, the Markov chain exhibits periodic behavior with period d = 3, as each screen is always followed by a finishing move and each finishing move is only followed by the outcome of the possession.
It is of interest to examine whether the process { X n } incorporates memory, i.e., a higher-order Markov model would provide a more adequate fit. In relation to basketball, a coach may assume that the outcome of a possession does not only depend on the type of the executed shot, but on the previous characteristics of the phase, such as the type of screen, as it could probably alter the evolution of the possession and provide more space and freedom for a well-executed shot. Hence, we would like to test the null hypothesis that the process is of order r = 1 versus the alternative hypothesis, r = 2. For testing this hypothesis, we used the likelihood ratio test (LRT). The likelihood ratio (LR) is given by
L R = 2 ( L L 1 L L 2 ) ,
where L L 1 and L L 2 denote the log-likelihood of models of order 1 and order 2, respectively. The log-likelihood ratio is an essential tool for the comparison of two competing Markov models [38] and can be used to evaluate well-known goodness-of-fit metrics, such as the AIC and BIC [39]. The likelihood ratio asymptotically follows a chi-squared distribution with degrees of freedom (df) equal to the difference of degrees of freedom of the two models, thus it can provide a p-value that can lead to the rejection of the null hypothesis, if it is smaller than a predefined cut-off value α (commonly α is set to 0.05). Adopting the notations of a previous work, where the authors assessed the order of a Markov chain applied in DNA sequences [40], one can formulate the likelihood ratio for two competing Markov models by
L R = 2 ( a 2 , a 3 n a 2 , a 3 log ( n a 2 , a 3 n a 2 ) a 1 , a 2 , a 3 n a 1 , a 2 , a 3 log ( n a 1 , a 2 , a 3 n a 1 a 2 ) ) ,
where
n a 1 , a 2 , a 3 = k = 1 n 2 I ( X k = a 1 , X k + 1 = a 2 , X k + 2 = a 3 ) ,
n a 2 , a 3 = k = 1 n 1 I ( X k = a 2 , X k + 1 = a 3 ) ,
denote the number of observed triplets and pairs of a 1 , a 2 , a 3   ϵ   S , respectively. Also, we note that the ratios n a 2 , a 3 n a 2 and n a 1 , a 2 , a 3 n a 1 a 2 are the empirical estimators of the transition probabilities, e.g., p ^ a 2 , a 3 and p ^ a 1 , a 2 , a 3 , respectively. The LR could be simplified as
L R = 2 ( a 2 , a 3 n a 2 , a 3 log ( p ^ a 2 , a 3 ) a 1 , a 2 , a 3 n a 1 , a 2 , a 3 log ( p ^ a 1 , a 2 , a 3 ) ) .
In general, a Markov chain of order r with state space S has ( | S | 1 ) | S | r varying parameters. However, in our case, the number of varying parameters would be less, since in the basketball context the transition probability matrix prohibited some transitions. For example, when the offensive player shoots a 3-pt shot, the possible transitions would not include any other outcome, apart from a successful or missed 3-pt shot. More specifically, the numbers of estimated transition probabilities were 82 and 354 for the first- and second-order Markov chain, respectively. The likelihood ratio value was calculated equal to 395.242, which resulted in p < 0.001 , therefore the likelihood ratio test indicated to reject the null hypothesis, in favor of r = 2.
The results of the significant relationships between the three components (screen type, finishing move and outcome) lead to establishing a model that includes second-order dependencies, therefore a second-order Markov chain is proposed to study the effect of screen type and finishing move on the outcome of the possession. The state space S = { ( T S , T F ) , ( T F , O ) , ( O , T S ) } of the second-order Markov chain consists of the ordered pairs of events that belong in the state-space V of the first-order Markov chain. The transition probabilities are presented in Table 4, in reduced form. Several considerations were made regarding the time, as a parameter that influences the frequency of specific off-ball screens and outcomes. First, the off-ball screen possessions were designated into two categories, 0–8 s and 8–24 s, according to the shot clock time at the time of the finishing move. For each subsample, the transition probabilities were estimated and the asymptotic probability vectors were also estimated. Second, we differentiated the offensive movements between the first three quarters and the last quarter of the game, where in the last quarter, as the pace of the game increases, the losing team can make a comeback.

3. Results

3.1. Overall Performance

The screens with the highest frequency were staggered screens (41%), followed by flare screens (15%). Furthermore, offensive players decided to execute their offense by using 3-pt shots (57%), followed by making use of 2-pt shots (22%); conversely, the lay-up frequency appeared lower (10%). The estimated transition probabilities of the first-order Markov chain showed that, on average, the probability of a successful outcome was less when compared to a missed attempt. Except for dunks, where the success was assured, 2-pt shots showed the highest probability of success (p = 0.48), followed by 3-pt shots (p = 0.41) and lay-ups (p = 0.35). Lay-ups also showed the highest probability of a possession change, caused by a block, turnover, or foul (p = 0.27). Table 5 presents the second-order transition probabilities between finishing moves and successful 2- or 3-point shots, conditional on screen type. Schematically, Figure 2 visualizes the relationship between the pairs: screen type/finishing move and screen type/outcome. Lay-ups were mainly enhanced by back screens, as it was found that the succession of back screens and lay-ups results in 0.78 probability of scoring a 2-pt shot. Most 2-pt shots were successfully executed, when the preceding off-ball screen was flare, staggered or down screen. Concerning 3-pt shots, the two types of screens where the outcome was optimal, were the high-cross and screen the screener.

3.2. Time Comparison

Table 6 presents the transition probabilities of the second-order Markov chain, that were estimated separately for the outcomes that took place in the first eight seconds of the possession and the last sixteen seconds of the possession. Screen the screener enhanced both 2- and 3-pt shots during the 0–8 s compared to the last seconds of the possession. High-cross screens were effectively beneficial for 3-pt shots during the interval 0–8 s, on the other hand screen-away was associated with well-executed 3-pt shots in the last seconds of the possession. Table 7 presents the comparison of the successful outcomes between the first to third and fourth quarters of playtime. In general, in the last quarter, the efficiency of the most frequently used screens was elevated, as the probabilities to successfully execute a shot were greater compared to the first three quarters. Flare screens inside the perimeter area and high-cross screen in the last quarter, according to our data, guaranteed the outcome of a 2- and 3-pt shots, respectively.
The asymptotic probabilities of the most-used pairs of screens/finishing moves and finishing moves/outcomes are presented in Table 8. Regarding screens and finishing moves, the most frequent pairs in the court were staggered screens followed by 3-pt shots and flare screens with 3-pt shots. Concerning finishing moves and outcomes, most 3-pt shots were unsuccessful, while the successful and missed 2-pt shots had the same frequency.

4. Discussion

The aim of the present study is to develop a second-order Markov modelling framework that would evaluate the efficiency of off-ball screens that positively affect the finishing move and the outcome. Relevant literature regarding the strong side of the offense have indicated that screens on the strong side were beneficial for the offense [41]; however, limited studies were conducted concerning the weak side. The outcome of every action in the basketball context depends on several factors, such as the type of defense, the characteristics of the players involved, the scoreboard, and the finishing moves and the screen types on the strong and weak side. The present paper, focusing on offensive actions, attempts to investigate the decision taken by the players on the weak side of the offense. While executing weak side offensive movements, it was found that the two screens that had the highest frequency were staggered screens, followed by flare screens. This occurs because in the first type of screen, there are two consecutive screens in the same direction for a teammate away from the ball. A stagger screen creates more space and allows the cutter to rub the defensive player on the first or second screen for a middle range or 3-pt shot. Conversely, flare screens create clear out situations on the perimeter for a 2-pt or 3-pt shot. According to [42], which undertook an analysis of basketball at the Olympic Games, the findings showed that the successful or unsuccessful 2-pt or 3-pt shots are the most important indicators for winning teams.
Our findings also revealed that the players, during off-ball screens, decide to execute their offense more by using 3-pt shots, followed by making use of a middle-range 2-pt shot; conversely, the lay-up option was not frequent. This is in line with [10], in which research at the World Cup 2019 pointed out that winning teams were more successful on their 3-pt shot attempts, on equally competitive teams. Regarding the effectiveness in the variations of executing the off-ball screens and finishing the offense, greater success is observed in using back screens and lay-ups, followed by flare screens and 2-pt shot; whereas the combination of high-cross screens and 3-pt shots was advantageous. Back screens are movements that take place on the “back” of the defensive player while playing defense on the weak side area. Offensive players, executing this type of screen use back door movements to receive the ball for a lay-up. However, although the combination of back screens and lay-ups lead to higher probability of successfully executing the offense, only a few instances of the above actions were observed in the court. Furthermore, flare screen is a collaboration in which the screener sets up a screen at the corner of the free-throw line and the cutter, instead of moving towards the basket, takes the screen and fades out to open space, away from the ball, for a middle-range shot. Moreover, a cross screen appears when a player cuts to the opposite side of the floor to set a screen for a teammate. Predominantly, this happens at the top of the key and gets a player who was on the strong side of the floor open for a quick 3-pt shot. For the execution of this screen, the coach can use two power forwards players, and additionally, a guard one with a center. The results agree with [16], which presented those different formations wherein the players achieved different effectiveness while leading to a basket.
The present study, by applying a second-order Markov model, demonstrated interesting findings, which confirmed that the offense is influenced by specific screens on the weak side of the court. Using staggered screens, it was shown that when the players executed 2-pt shots, they were led to more successful outcomes. This type of screen can be used inside the paint, where the cutter can go into the corner for a 3-pt shot, whenever the attacking player can go out on different sides of the perimeter for a 3-pt shot. The flare screen, executed either inside or outside the perimeter area, provided equal results with regards to successful 3-pt shots. The above combinations could be interpreted by the arrival of American players in European basketball, indicating that the European basketball has become more unrestrained, such as the NBA. Finally, the Markovian model also predicted that a successful offensive combination is a down screen followed by the execution of a 2-pt shot. The latter combination is probably explained by the fact that the attacks take place inside the paint, as the down screen is made to release mainly the taller players and make a flash movement towards the ball, leading to a better position while leading to a basket.
Concerning the shot clock, the results indicated that specific screen types, such as screen the screener and high-cross, that occur rapidly before the set-play of the offense at the top of the key area during the transition game led to more successful offensive movements in the first 8 s of the possession. On the other hand, during the interval 8–24 s of the offense, the players achieved greater mobility, thus they used screen away to provide the perimeter shooter with an optimal area to execute the 3-pt shot. This result confirms previous findings, which showed that defenders have more fatigue during the last seconds of the offense, thus the resulting offensive screen could be successful [43]. The results in the last quarter, showed that 3-pt shots were positively influenced by high-cross, staggered, screen away, back, and down screens. This can be explained by the fact that in the last minutes of playtime, the players using the aforementioned screens aim to optimize their final score. Previous studies suggested that possession effectiveness was found to be elevated by using different tactical strategies during the last minutes of playtime [41]. On the contrary, in the first three quarters, staggered screens, which consist of two consecutive screens from different offensive players, provided the opportunity to a teammate to receive the ball for an easy lay-up or 2-pt shot. In general, in the last quarter, the efficiency of the most frequently-used screens was elevated, as the probabilities to successfully execute a shot were greater, compared to the first three quarters.

5. Conclusions

In the recent years, the study of performance indicators and their use in the strategy of basketball teams to maximize performance has been the subject of extended research. Via second-order Markov modelling, this paper provided insights into the behaviors and interactions of the players using the screens, and the final attempt of the shots on the weak side. In conclusion, attacks away from the ball are movements without prior verbal signals in which players must perform a specific screen with great speed and accuracy. It is worth noting that this study provides useful information for coaches who may have the opportunity to use it in training programs aimed at the individual improvement of players, and also to improve and maximize the team’s offense. We suggest further research that could bring about advances in play, including the area of execution or screen, as a covariate that would influence the outcome of the offense, the cutting movements, or the characteristics of the line-ups on the weak side of the offensive team. In addition, a semi-Markov model could provide a more detailed picture of the offense, incorporating sojourn times between offensive movements, if appropriate data were available. By knowing the strengths and weaknesses of the attack, the coach can have a complete picture of the offense on both sides and adjust the preparation for the next movement to succeed in a basketball game.

Author Contributions

Conceptualization, N.S., A.P. and P.K.; Methodology, N.S., A.P. and P.K.; Software, A.P. and P.K.; Validation, N.S., A.P. and P.K.; Formal analysis, N.S., A.P. and P.K.; Investigation, N.S., A.P. and P.K.; Data curation, N.S., A.P. and P.K.; Writing—original draft preparation, N.S., A.P. and P.K.; Writing—review and editing, N.S., A.P. and P.K.; Visualization, N.S., A.P. and P.K.; Supervision, N.S. and A.P. All authors have read and agreed to the published version of the manuscript.

Funding

This research received no external funding.

Data Availability Statement

The data presented in this study are available on request from the corresponding author. The data are not publicly available due to privacy restrictions.

Acknowledgments

The authors greatly acknowledge the comments and suggestions of the three anonymous referees, which improved the quality and the presentation of the current paper.

Conflicts of Interest

The authors declare no conflict of interest.

References

  1. Gómez, M.; Battaglia, O.; Lorenzo, A.; Lorenzo, J.; Jimenez, S.L.; Sampaio, J. Effectiveness during ball screens in elite basketball games. J. Sports Sci. 2015, 33, 1844–1852. [Google Scholar] [CrossRef] [PubMed]
  2. Lamas, L.; Junior, D.D.R.; Santana, F.; Rostaiser, E.; Negretti, L.; Ugrinowitsch, C. Space creation dynamics in basketball offence: Validation and evaluation of elite teams. Int. J. Perform. Anal. Sport 2011, 11, 71–84. [Google Scholar] [CrossRef]
  3. Vaquera, A.; García-Tormo, J.V.; Ruano, M.G.; Morante, J. An exploration of ball screen effectiveness on elite basketball teams. Int. J. Perform. Anal. Sport 2016, 16, 475–485. [Google Scholar] [CrossRef]
  4. Lamas, L.; Santana, F.; Heiner, M.; Ugrinowitsch, C.; Fellingham, G. Modeling the Offensive-Defensive Interaction and Resulting Outcomes in Basketball. PLoS ONE 2015, 10, e0144435. [Google Scholar] [CrossRef] [PubMed] [Green Version]
  5. Calvo, J.L.; García, A.M.; Navandar, A. Analysis of mismatch after ball screens in Spanish professional basketball. Int. J. Perform. Anal. Sport 2017, 17, 555–562. [Google Scholar] [CrossRef]
  6. Bazanov, B.; Võhandu, P.; Haljand, R. Factors influencing the teamwork intensity in basketball. Int. J. Perform. Anal. Sport 2006, 6, 88–96. [Google Scholar] [CrossRef]
  7. Conte, D.; Tessitore, A.; Gjullin, A.; MacKinnon, D.; Lupo, C.; Favero, T. Investigating the game-related statistics and tactical profile in NCAA division I men’s basketball games. Biol. Sport 2018, 35, 137–143. [Google Scholar] [CrossRef]
  8. Kubatko, J.; Oliver, D.; Pelton, K.; Rosenbaum, D.T. A Starting Point for Analyzing Basketball Statistics. J. Quant. Anal. Sports 2007, 3. [Google Scholar] [CrossRef]
  9. Zhang, S.; Gomez, M.; Yi, Q.; Dong, R.; Leicht, A.; Lorenzo, A. Modelling the Relationship between Match Outcome and Match Performances during the 2019 FIBA Basketball World Cup: A Quantile Regression Analysis. Int. J. Environ. Res. Public Health 2020, 17, 5722. [Google Scholar] [CrossRef]
  10. Stavropoulos, N.; Kolias, P.; Papadopoulou, A.; Stavropoulou, G. Game related predictors discriminating between winning and losing teams in preliminary, second and final round of basketball world cup 2019. Int. J. Perform. Anal. Sport 2021, 21, 383–395. [Google Scholar] [CrossRef]
  11. Ibáñez, S.J.; Sampaio, J.; Sáenz-López, P.; Giménez, J.; Janeira, M.A. Game statistics discriminating the final outcome of junior world basketball championship matches (Portugal 1999). J. Hum. Mov. Stud. 2003, 45, 1–20. [Google Scholar]
  12. Sampaio, J.; Janeira, M. Statistical analyses of basketball team performance: Understanding teams’ wins and losses according to a different index of ball possessions. Int. J. Perform. Anal. Sport 2003, 3, 40–49. [Google Scholar] [CrossRef]
  13. Vračar, P.; Štrumbelj, E.; Kononenko, I. Modeling basketball play-by-play data. Expert Syst. Appl. 2016, 44, 58–66. [Google Scholar] [CrossRef]
  14. Shirley, K. A Markov model for basketball. In New England Symposium for Statistics in Sports; Boston, MA, USA, 2007; p. 82. Available online: http://www.nessis.org/nessis07/Kenny_Shirley.pdf (accessed on 8 June 2021).
  15. Kvam, P.; Sokol, J.S. A logistic regression/Markov chain model for NCAA basketball. Nav. Res. Logist. 2006, 53, 788–803. [Google Scholar] [CrossRef] [Green Version]
  16. Kolias, P.; Stavropoulos, N.; Papadopoulou, A.; Kostakidis, T. Evaluating basketball player’s rotation line-ups performance via statistical markov chain modelling. Int. J. Sports Sci. Coach. 2021. [Google Scholar] [CrossRef]
  17. Young, A.; Vassiliou, P.-C.G. A non-linear model on the promotion of staff. J. R. Stat. Soc. Ser. A 1974, 137, 584–595. [Google Scholar] [CrossRef]
  18. Vassiliou, P.-C.G. A Markov chain model for wastage in manpower systems. J. Oper. Res. Soc. 1976, 27, 57–70. [Google Scholar] [CrossRef]
  19. Vassiliou, P.-C.G. On the Limiting Behaviour of a Nonhomogeneous Markov Chain Model in Manpower Systems. Biometrika 1981, 68, 557. [Google Scholar] [CrossRef]
  20. Tsantas, N.; Vassiliou, P.-C.G. The non-homogeneous Markov system in a stochastic environment. J. Appl. Probab. 1993, 30, 285–301. [Google Scholar] [CrossRef]
  21. Georgiou, A.; Vassiliou, P.-C. Cost models in nonhomogeneous Markov systems. Eur. J. Oper. Res. 1997, 100, 81–96. [Google Scholar] [CrossRef]
  22. Dimitriou, V.; Georgiou, A.; Tsantas, N. The multivariate non-homogeneous Markov manpower system in a departmental mobility framework. Eur. J. Oper. Res. 2013, 228, 112–121. [Google Scholar] [CrossRef]
  23. D’Amico, G.; Di Biase, G.; Manca, R. Income inequality dynamic measurement of Markov models: Application to some European countries. Econ. Model. 2012, 29, 1598–1602. [Google Scholar] [CrossRef]
  24. Faddy, M.J.; McClean, S. Analysing data on lengths of stay of hospital patients using phase-type distributions. Appl. Stoch. Models Bus. Ind. 1999, 15, 311–317. [Google Scholar] [CrossRef]
  25. McClean, S.; Millard, P. Where to treat the older patient? Can Markov models help us better understand the relationship between hospital and community care? J. Oper. Res. Soc. 2007, 58, 255–261. [Google Scholar] [CrossRef]
  26. Garg, L.; McClean, S.; Meenan, B.; Millard, P. Non-homogeneous Markov models for sequential pattern mining of healthcare data. IMA J. Manag. Math. 2008, 20, 327–344. [Google Scholar] [CrossRef]
  27. Almagor, H. A Markov analysis of DNA sequences. J. Theor. Biol. 1983, 104, 633–645. [Google Scholar] [CrossRef]
  28. Waterman, M.S. Introduction to Computational Biology: Maps, Sequences and Genomes. Biometrika 1998, 54, 398. [Google Scholar] [CrossRef]
  29. Vassiliou, P.-C.G. A High Order Non-linear Markovian Model for Promotion in Manpower Systems. J. R. Stat. Soc. Ser. A 1978, 141, 86. [Google Scholar] [CrossRef]
  30. Raftery, A.E. A model for high-order Markov chains. J. R. Stat. Soc. Ser. B 1985, 47, 528–539. [Google Scholar] [CrossRef]
  31. Adke, S.R.; Deshmukh, S.R. Limit distribution of a high order Markov chain. J. R. Stat. Soc. Ser. B 1988, 50, 105–108. [Google Scholar] [CrossRef]
  32. Ching, W.K.; Fung, E.S.; Ng, M.K. A higher-order Markov model for the Newsboy’s problem. J. Oper. Res. Soc. 2003, 54, 291–298. [Google Scholar] [CrossRef]
  33. Vassiliou, P.-C.G.; Moysiadis, T.P. G-Inhomogeneous Markov Systems of High Order. Methodol. Comput. Appl. Probab. 2010, 12, 271–292. [Google Scholar] [CrossRef]
  34. Raftery, A.; Tavaré, S. Estimation and modelling repeated patterns in high order Markov chains with the mixture transition distribution model. J. R. Stat. Soc. Ser. C 1994, 43, 179–199. [Google Scholar] [CrossRef]
  35. Garden, P.W. Markov analysis of viral DNA/RNA sequences. J. Theor. Biol. 1980, 82, 679–684. [Google Scholar] [CrossRef]
  36. Shamshad, A.; Bawadi, M.; Wanhussin, W.; Majid, T.A.; Sanusi, S. First and second order Markov chain models for synthetic generation of wind speed time series. Energy 2005, 30, 693–708. [Google Scholar] [CrossRef]
  37. Berchtold, A.; Raftery, A. The Mixture Transition Distribution Model for High-Order Markov Chains and Non-Gaussian Time Series. Stat. Sci. 2002, 17, 328–356. [Google Scholar] [CrossRef]
  38. Katz, R. On Some Criteria for Estimating the Order of a Markov Chain. Technometrics 1981, 23, 243. [Google Scholar] [CrossRef]
  39. Tong, H. Determination of the order of a Markov chain by Akaike’s information criterion. J. Appl. Probab. 1975, 12, 488–497. [Google Scholar] [CrossRef]
  40. Menéndez, M.L.; Pardo, L.; Pardo, M.C.; Zografos, K. Testing the Order of Markov Dependence in DNA Sequences. Methodol. Comput. Appl. Probab. 2008, 13, 59–74. [Google Scholar] [CrossRef]
  41. Gómez, M.A.; Lorenzo, A.; Ibañez, S.J.; Sampaio, J. Ball possession effectiveness in men’s and women’s elite basketball according to situational variables in different game periods. J. Sports Sci. 2013, 31, 1578–1587. [Google Scholar] [CrossRef]
  42. Leicht, A.S.; Gómez, M.A.; Woods, C.T. Explaining Match Outcome During the Men’s Basketball Tournament at The Olympic Games. J. Sports Sci. Med. 2017, 16, 468–473. [Google Scholar] [PubMed]
  43. Bourbousson, J.; Sève, C.; McGarry, T. Space–time coordination dynamics in basketball: Part 2. The interaction between the two teams. J. Sports Sci. 2010, 28, 349–358. [Google Scholar] [CrossRef] [PubMed]
Figure 1. Execution of indicative offensive screens, back screens (top left), staggered screens (top right), flare screens (bottom left) and screen away (bottom right).
Mathematics 09 01991 g001
Figure 2. Heatmap of the relationship between screen type/finishing move and screen type/outcome.
Mathematics 09 01991 g002
Table 1. Transition probability matrix of a second-order two-state Markov chain in reduced form.
X t
X t 2 X t 1 12
11 p 111 p 112
21 p 211 p 212
12 p 121 p 122
22 p 221 p 222
Table 2. Recorded variables, levels, and coding indices.
VariablesLevelsLevel Coding
Type of screen (TS)Staggered screenTS1
Flare screenTS2
Screen the screenerTS3
Back screenTS4
Down screenTS5
High cross screenTS6
Screen awayTS7
Type of finishing move (TF)DunkTF1
Lay-upTF2
2-pt shotTF3
3-pt shotTF4
NoneTF5
Outcome (O)Successful 2-pt shotO1
Missed 2-pt shotO2
Successful 3-pt shotO3
Missed 3-pt shotO4
Possession changeO5
Time (T)0–8 sT1
8–24 sT2
Quarter (Q)First QuarterQ1
Second QuarterQ2
Third QuarterQ3
Fourth QuarterQ4
Table 3. Possible transitions between the states in the first-order Markov chain.
TS1TS2TS3TS4TS5TS6TS7TF1TF2TF3TF4TF5O1O2O3O4O5
TS10000000XXXXX00000
TS20000000XXXXX00000
TS30000000XXXXX00000
TS40000000XXXXX00000
TS50000000XXXXX00000
TS60000000XXXXX00000
TS70000000XXXXX00000
TF1000000000000XX00X
TF2000000000000XX00X
TF3000000000000XX00X
TF400000000000000XXX
TF50000000000000000X
O1XXXXXXX0000000000
O2XXXXXXX0000000000
O3XXXXXXX0000000000
O4XXXXXXX0000000000
O5XXXXXXX0000000000
TS: Type of screen, TF: Type of finishing move, O: Outcome, X: Non-zero probability.
Table 4. Transition probability matrix of the second-order Markov chain in reduced form.
O   ( X t )
TS   ( X t 2 ) TF   ( X t 1 ) O1O2O5
TS1TF1 p T S 1   T F 1   O 1 p T S 1   T F 1   O 2 p T S 1   T F 1   O 5
TS2TF1 p T S 2   T F 1   O 1 p T S 2   T F 1   O 2 p T S 2   T F 1   O 5
TS3TF1 p T S 3   T F 1   O 1 p T S 3   T F 1   O 2 p T S 3   T F 1   O 5
TS4TF1 p T S 4   T F 1   O 1 p T S 4   T F 1   O 2 p T S 4   T F 1   O 5
TS5TF1 p T S 5   T F 1   O 1 p T S 5   T F 1   O 2 p T S 5   T F 1   O 5
TS6TF1 p T S 6   T F 1   O 1 p T S 6   T F 1   O 2 p T S 6   T F 1   O 5
TS7TF1 p T S 7   T F 1   O 1 p T S 7   T F 1   O 2 p T S 7   T F 1   O 5
TS1TF2 p T S 1   T F 2   O 1 p T S 1   T F 2   O 2 p T S 1   T F 2   O 5
TS2TF2 p T S 2   T F 2   O 1 p T S 2   T F 2   O 2 p T S 2   T F 2   O 5
TS3TF2 p T S 3   T F 2   O 1 p T S 3   T F 2   O 2 p T S 3   T F 2   O 5
TS4TF2 p T S 4   T F 2   O 1 p T S 4   T F 2   O 2 p T S 4   T F 2   O 5
TS5TF2 p T S 5   T F 2   O 1 p T S 5   T F 2   O 2 p T S 5   T F 2   O 5
TS6TF2 p T S 6   T F 2   O 1 p T S 6   T F 2   O 2 p T S 6   T F 2   O 5
TS7TF2 p T S 7   T F 2   O 1 p T S 7   T F 2   O 2 p T S 7   T F 2   O 5
TS1TF5 p T S 1   T F 5   O 1 p T S 1   T F 5   O 2 p T S 1   T F 5   O 5
TS2TF5 p T S 2   T F 5   O 1 p T S 2   T F 5   O 2 p T S 2   T F 5   O 5
TS3TF5 p T S 3   T F 5   O 1 p T S 3   T F 5   O 2 p T S 3   T F 5   O 5
TS4TF5 p T S 4   T F 5   O 1 p T S 4   T F 5   O 2 p T S 4   T F 5   O 5
TS5TF5 p T S 5   T F 5   O 1 p T S 5   T F 5   O 2 p T S 5   T F 5   O 5
TS6TF5 p T S 6   T F 5   O 1 p T S 6   T F 5   O 2 p T S 6   T F 5   O 5
TS7TF5 p T S 7   T F 5   O 1 p T S 7   T F 5   O 2 p T S 7   T F 5   O 5
Table 5. Overall transition probability estimates between finishing moves and screens to successful shots.
Screen   Type   ( X t 2 ) Finishing   Move   ( X t 1 ) Successful   Shot   ( X t )
StaggeredLay-up0.27
Flare 1Lay-up0.17
Screen the screenerLay-up0.44
Back screenLay-up0.78
Down screenLay-up0.45
High crossLay-up0.47
Screen awayLay-up0.15
Staggered2-pt shot0.51
Flare 12-pt shot0.56
Screen the screener2-pt shot0.30
Back screen2-pt shot0.47
Down screen2-pt shot0.50
High cross2-pt shot0.39
Screen away2-pt shot0.48
Staggered3-pt shot0.41
Flare 13-pt shot0.34
Flare 23-pt shot0.33
Screen the screener3-pt shot0.52
Back screen3-pt shot0.29
Down screen3-pt shot0.42
High cross3-pt shot0.67
Screen away3-pt shot0.40
1: inside the paint, 2: perimeter area.
Table 6. Transition probabilities between finishing moves and screens to successful shots.
Successful   Outcome   ( X t )
Screen   Type   ( X t 2 ) Finishing   Move   ( X t 1 ) T1T2
Down screenLay-up0.500.43
Staggered2-pt shot0.580.47
Flare2-pt shot0.330.50
Screen the screener2-pt shot1.000.67
Back screen2-pt shot0.360.56
Down screen2-pt shot0.660.47
Screen away2-pt shot0.550.42
Staggered3-pt shot0.560.38
Flare 13-pt shot0.350.33
Screen the screener3-pt shot0.770.36
Down screen3-pt shot0.520.37
High cross3-pt shot1.000.66
Screen away3-pt shot0.170.44
1: inside the paint.
Table 7. Comparison of the probability estimates between finishing moves and screens to successful outcomes in the first three vs. last quarter.
Successful   Outcome   ( X t )
Screen   Type   ( X t 2 ) Finishing   Move   ( X t 1 ) Q1–Q3Q4
StaggeredLay-up0.300.20
Down screenLay-up0.200.50
Staggered2-pt shot0.520.40
Flare 12-pt shot0.331.00
Down screen2-pt shot0.300.50
Staggered3-pt shot0.380.59
Flare 13-pt shot0.370.14
Screen the screener3-pt shot0.520.50
Back screen3-pt shot0.200.50
Down screen3-pt shot0.370.58
High cross3-pt shot0.631.00
Screen away3-pt shot0.340.69
1: inside the paint.
Table 8. Asymptotic probabilities of frequent screens, finishing moves and outcomes.
TF-OpTS-TFp
TF4-O40.33TS1-TF40.24
TF4-O30.23TS2-TF40.09
TF3-O10.11TS7-TS40.08
TF3-O20.11TS1-TF30.08
TF5-O50.05TS5-TF40.07
TF2-O10.04TS6-TF40.04
TF2-O20.04
TF2-O50.03
TF4-O50.01
TF1-O10.01
Probabilities lower than 0.01 were excluded.
Publisher’s Note: MDPI stays neutral with regard to jurisdictional claims in published maps and institutional affiliations.

