Abstract
In this paper, we propose a master–slave methodology to address the problem of optimal integration (location and sizing) of Distributed Generators (DGs) in Direct Current (DC) networks. This proposed methodology employs a parallel version of the Population-Based Incremental Learning (PPBIL) optimization method in the master stage to solve the location problem and the Vortex Search Algorithm (VSA) in the slave stage to solve the sizing problem. In addition, it uses the reduction of power losses as the objective function, considering all the constraints associated with the technical conditions specific to DGs and DC networks. To validate its effectiveness and robustness, we use as comparison methods, different solution methodologies that have been reported in the specialized literature, as well as two test systems (the 21 and 69-bus test systems). All simulations were performed in MATLAB. According to the results, the proposed hybrid (PPBIL–VSA) methodology provides the best trade-off between quality of the solution and processing times and exhibits an adequate repeatability every time it is executed.
1. Introduction
In this section, we present a general context of the problem addressed, the literature review process that was undertaken, explain the proposed methodology and main contributions, and outline the document organization. The information related to each sub-section is presented below.
1.1. General Context
In both conventional and current electrical systems, different technical and economic aspects that directly affect network operators and users must be enhanced, including their high investment and operating costs, high levels of energy loss associated with energy transportation, and high levels of pollution due to the implementation of power generation sources based on fossil fuels [1]. To address these issues, the electrical sector and several authors have recently focused on developing and promoting various strategies [2]. Some of these strategies are the reconfiguration of electrical networks [3] and the integration of new technologies such as reactive compensators (e.g., ultracapacitors and super inductors) [4,5], energy storage elements [6], and Distributed Generation (DG) sources based on renewable energy resources [7]. These latter sources are some of the most widely applied and developed technologies and the focus of this paper.
The development of power electronics in recent decades has allowed for medium- and large-scale integration of DG sources into both Alternating Current (AC) and Direct Current (DC) networks [8] using mainly renewable energy resources. This has enabled countries to diversify their energy matrices and improve the technical, economic, and environmental conditions of their electrical energy distribution systems [8,9]. DG integration in electrical distribution systems can, for instance, help to reduce power losses, the loading capability of lines, investment and operating costs, and CO2 emissions, as well as to improve voltage profiles [10,11]. Furthermore, it positively impacts the socioeconomic conditions of the region where the electrical system is installed because a high-quality and reliable electricity service drives the region’s economic development while improving the quality of life of its inhabitants [12]. However, it should be noted that the realization of these benefits depends on the methodology implemented to size and locate the DGs in the electrical network: there may be positive or negative technical, economic, and environmental consequences depending on their location and the amount of power injected into the electrical network [1,13].
1.2. Literature Review
After analyzing the contributions made by different authors to the specialized literature in the past decade, we observed a growing tendency towards the investigation and implementation of DC networks given the various benefits they offer over AC networks [14,15]. Their main advantages include reduced complexity in the network’s planning and operation because no reactive analysis is performed, ease of implementation of the main energy generation and storage sources (solar panels and batteries) in this type of network, lower power losses due to a reduced number of energy converting elements, and lower investment costs associated with a reduced number of elements in the electrical energy distribution systems [13,16]. Because of all the aforementioned advantages and with the aim of improving the networks’ operating conditions, this paper addresses the problem of optimal integration of DGs into DC networks.
To solve this problem, various authors have employed specialized software (e.g., optimization software such as the General Algebraic Modeling System (GAMS)) and proposed mixed-integer quadratic programming models and convex and conical optimization methods, among others [17,18,19]. Nonetheless, due to the presence of binary variables within the location problem, these strategies fail to provide an optimal solution, thus requiring the use of specialized software for their implementation. As a result, the complexity of their solution and its implementation costs increase [20].
To reduce the complexity of the solutions to the problem addressed here and promote the use of free software, recent studies have employed optimization methods based on sequential programming [1], mainly master–slave strategies. In these strategies, the master stage deals with the binary problem of optimal location of DGs; the slave stage deals with their sizing (this latter being a problem of continuous variables) [1,20]. For instance, the authors of [21] used the Particle Swarm Optimization (PSO) algorithm to size DGs in a DC network, considering aspects such as costs and power losses, and demonstrated the effectiveness of their proposed method. However, they did not compare their findings with those reported in the literature and employed a single-node network, which does not make it possible to address the problem of location of DGs.
In [22,23], the authors proposed a Continuous Genetic Algorithm (CGA) and an optimization method based on the Black Hole (BH) algorithm to solve the problem of sizing of DGs in DC networks, without considering the problem of their location. Their results showed the effectiveness of the proposed methodologies in terms of reduced processing times and power losses. In [24], three hybrid methodologies were presented and evaluated. The authors used the Genetic Algorithm (GA) and three different continuous techniques (CGA, BH optimization method, and PSO) to solve the master and slave stages, respectively. The three methodologies were validated in the 10- and 21-bus test systems. According to their results, the GA–BH methodology achieved the best trade-off between processing time and power losses, regardless of the total power provided by the DGs and the size of the network. In [20], a hybrid approach based on Population-Based Incremental Learning (PPBIL) and PSO was introduced to solve the problem of optimal integration of DGs into DC networks. After being compared with another nine approaches (including the three presented in a previous study), the proposed approach achieved the best results in terms of processing times and quality of the solution for different network sizes.
As observed in this literature review, DC networks are quite important and there is a need to integrate DG sources into them in order to improve their operating conditions and reduce their processing times. In addition, we identified the reduction of power losses as the most common objective function. To address these issues, hybrid methodologies that combine different highly-efficient optimization algorithms based on sequential programming must be developed, as they eliminate the need for specialized software and deliver good quality solutions with minimal processing requirements.
1.3. Proposed Methodology and Main Contributions
In this paper, we present a methodology based on a master–slave strategy between the PPBIL algorithm and the Vortex Search Algorithm (VSA) for the optimal integration of DGs into DC networks. This methodology makes it possible to reduce processing times and improve the technical conditions of the network, thus minimizing power losses and ensuring compliance with technical constraints. The PPBIL algorithm uses binary variables in the slave stage to solve the location problem, while the VSA works with continuous variables to solve the sizing problem. All this is done while keeping in mind the minimum and maximum power values of the DGs, restricting DG injection, and guaranteeing that the operating constraints of DC networks reported in the literature are met at all times [20]. To validate the effectiveness of the proposed methodology, we employ two test systems (the 21- and 69-bus test systems) and ten hybrid approaches taken from the literature as comparison methods. The following are the main contributions of this study:
- Development of a new hybrid (PPBIL–VSA) methodology to solve problems of binary and continuous variables.
- Improved results in terms of quality of the solution and processing times for the problem of integration of DGs into DC networks.
- Creation of a comparison scenario by selecting and implementing the most efficient techniques to solve the problem of integration of DGs into DC networks.
1.4. Paper’s Organization
The rest of this paper is structured as follows. Section 2 introduces the mathematical formulation of the problem of integration of DGs into DC networks using, as the objective function, the reduction of power losses associated with energy transportation and considering the entire set of technical constraints of DC networks under a DG environment. Section 3 describes the proposed master–slave methodology to solve the problem addressed in this study. Section 4 and Section 5 present the test systems, considerations, and comparison methods employed here to validate the effectiveness, repeatability, and robustness of the proposed methodology. Section 6 details the simulations and analyzes the obtained results. Finally, Section 7 draws the conclusions and outlines possible future lines of work derived from this research.
2. Mathematical Formulation
The mathematical model that represents the problem addressed here (a mixed-integer nonlinear programming problem due to the binary and continuous variables that represent it [20]) consists of: (i) an objective function in charge of reducing power losses in the network and (ii) the mathematical functions that make up the set of constraints of DC networks under a DG environment. We selected this model because it has been widely used to validate different methodologies proposed for the optimal integration of distributed energy resources in DC networks [17,20,23]. The mathematical model employed here is described below.
2.1. Objective Function
We used, as the objective function, the reduction of power losses associated with energy transportation () (see Equation (1)). In Equation (1), denotes the set of nodes that make up the system; and , the voltages at nodes i and j, which interconnect line ; , the conductance associated with the line that interconnects nodes i and j; and , the conductance of the resistive loads connected at the ith node of the system.
2.2. Set of Constraints
The problem of optimal integration of DGs in DC networks to reduce comprises Equations (2)–(8), which are described below.
Equation (2) represents the active global power balance at each node of the DC system, where and denote the power generated and the power demanded at node i, respectively. Equation (3) determines the maximum and minimum voltage allowed for the voltage profiles. Equation (4) establishes the maximum current value for each line that makes up the system, where is the current in line ; , the maximum current allowed in line ; and (), the set of lines that comprise the DC network. Equation (5) represents the minimum and maximum power that can be injected by the DG connected to node i, where is a binary variable that takes a value of 1 or 0 depending on whether node i has a DG installed or not. In this equation, denotes the set of nodes that have DGs installed. It should be noted that the binary nature of variable is defined in Equation (8). In order to limit the number of DGs () within the system, we proposed Equation (6). Finally, Equation (7) restricts the amount of power injected by the DGs to the network, where denotes the maximum power injection.
3. Proposed Master–Slave Methodology
To address the problem of optimal integration of DGs into DC networks, we propose a hybrid methodology based on the PPBIL algorithm [1] and the VSA [25]. In this methodology, the PPBIL algorithm is in charge of locating the DGs, and the VSA is in charge of sizing them. Additionally, since the power flow problem in the sizing of the DGs must be solved to evaluate the objective function and the set of constraints, we used a method based on successive approximations as the power flow method [26]. We selected this method based on the excellent results reported by various authors in terms of convergence and processing times.
The flowchart in Figure 1 summarizes the proposed master–slave (PPBIL–VSA) methodology. It is important to understand that the master stage is the one that governs the problem, while the slave stage is only employed to evaluate the objective function of the individuals generated by it. The main steps of the proposed methodology are described below.
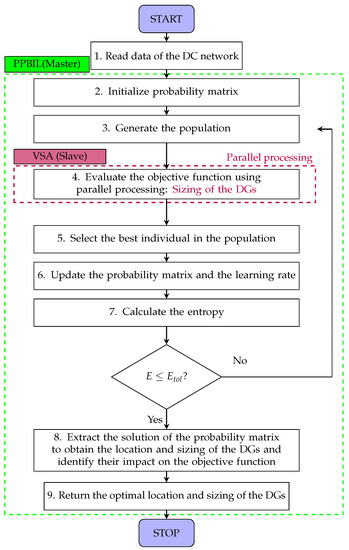
Figure 1.
Proposed master–slave (PPBIL–VSA) methodology.
3.1. Reading the Data of the Electrical System
In this first step, all data of the DC electrical network (e.g., number of nodes and lines, power demanded at each node, and location of the slack node) are read.
3.2. Initializing the Probability Matrix
In this step, since the PPBIL algorithm used in the master stage evolves on the basis of a Probability Matrix (PM), a codification must be developed to evaluate the effect of installing (option 1) or not (option 2) DGs in the DC network. Therefore, we propose the codification presented in Figure 2, which yields a matrix of 2 , where the rows indicate the probabilities of the two aforementioned options and the columns are the nodes of the system (excluding the slack node).
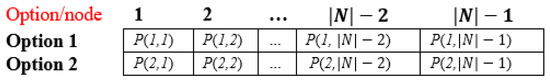
Figure 2.
Probability matrix used by the PPBIL algorithm (Adapted from [1]).
In the PM, denotes the probability of installing a DG at node j and is the probability of not installing it. Said matrix is updated, iteration by iteration, based on the options for the DGs present in the incumbent solution to the problem: the probability of the options that appear within the configuration of the DGs to be installed and proposed by the incumbent solution is increased, while that of the options that do not appear in said configuration is reduced. The sum of the probabilities of installing or not a DG at a specific node must always be 1, as described by the following equation:
When starting the algorithm, a 50% probability is assigned to all the options in the PM to guarantee the same possibility of installing or not a DG in all the system’s nodes.
3.3. Generating the Population
In this third step, a population of individuals is generated based on the information contained in the PM: different configurations for the location of DGs in the system are generated based on the installation probability set in the PM for each node. Figure 3 presents the codification used for the population (P), where the columns indicate the candidate nodes for DG location (excluding the slack node); and the rows, the individuals or possible configurations proposed in the master stage as solutions to the location problem.
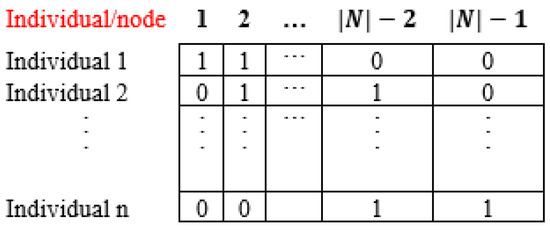
Figure 3.
Codification proposed for the matrix population(Adapted from [1]).
For instance, Individual 1 in the population presented in Figure 3 proposes locating DGs at nodes 1 and 2 by assigning them a value of 1 in the PM and leaving nodes and with no DGs by assigning them a value of 0. It should be noted that, since the objective function of each individual in P is evaluated (slave stage) using parallel processing, the size of the population must match the number of workers available in the computer because computation time is directly linked to the number of processes that parallel processing must carry out to evaluate all the assigned processes [1].
3.4. Evaluating the Objective Function (Slave Stage)
In this step, the aim is to assess the impact of the PPBIL algorithm’s proposed configurations for DG location on the objective function. To that end, DGs are optimally sized with the purpose of reducing power losses in the DC network. This reduction is, thus, the objective function with which the PPBIL algorithm evolves, an evolution that is achieved by implementing the VSA and the SA. The methodology presented in this paper proposes the use of parallel processing to simultaneously evaluate all the individuals in the population and, thus, reduce the processing time required by the solution methodology. This is possible by partitioning the computer’s workers and assigning each the evaluation of an individual using MATLAB’s parallel pool tool [20].
Equation (10) represents the parallel processing time () necessary to evaluate the objective function of all the individuals in the population. In this equation, is the longest time required by the individuals when evaluating the objective function in parallel processing, and returns the integer (greater than or equal to a real number) of the quotient of population size or number of individuals (n) and number of workers (W). The may be required as many times as n exceeds W; therefore, the size assigned to the population should not exceed the number of workers to be used [1].
To size the DGs (a process specific to the slave stage), we employed the VSA approach proposed in [25]. This optimization tool uses the behavior of the vortex formed in stirred fluids to solve nonlinear problems with continuous variables. We selected this technique based on the excellent results reported by the authors to solve the problem of sizing of DGs in DC networks. Its pseudo-code to solve such problem is presented and described in Algorithm 1.
| Algorithm 1 Pseudo-code of the VSA |
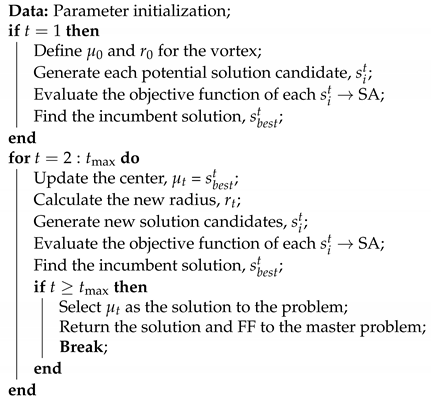 |
To size the DGs, the VSA first loads the data of the electrical system and the algorithm parameters (which are specified in the Results section). Then, in the first iteration, the initial center of the vortex () is defined based on the mean values of the power limits set for the DGs (see Equation (11)). Furthermore, in step 1 of the first iteration, the initial diameter of the vortex (), which is given by Equation (12), is established. With these values, the aim is to generate an initial population of individuals that considers the entire solution space.
Subsequently, in step 2 of the first iteration, the candidate solutions to the problem of sizing the DGs proposed by the master stage are generated by means of a random process that uses Gaussian distributions (see Equation (13)). Equation (13) yields a vector of size 1 and depends on , which, besides being a vector of random variables, is the one that adds this random factor to the VSA, thus improving its exploration. In this equation, is the center of the vortex in iteration t ( for the first iteration), and is the radius of the vortex in iteration t, which is reduced iteration by iteration by means of Equation (14), where I denotes an identity matrix of size 1; a, a constant with a value of [0–1] that controls the reduction of the speed of the vortex radius; and , the maximum number of iterations. It should be noted that the size of the vortex is reduced iteration by iteration until it converges to the solution of the problem.
In step 3 of the first iteration, the objective function of the algorithm (i.e., assessing the impact of each candidate solution delivered by the VSA to size the DGs proposed by the master stage on the reduction of power losses in the DC network) is evaluated. For this purpose, we used the power flow method based on successive approximations because the authors of [27,28] demonstrated that, when compared to the best-performance techniques reported in the literature for DC networks, it provides the best results in terms of convergence and processing times for any type of network. For further information on this power flow method, please refer to the original paper [27,28]. Finally, after evaluating all the candidate solutions proposed by the VSA, the one with the lowest objective function value is selected as the incumbent solution to the problem ().
Subsequently, from until reaching the (convergence criterion), the VSA updates the center of the vortex with the values that make up the incumbent solution, calculates a new value for , generates a new population, and evaluates the objective function of all the individuals and the set of constraints to finally update the incumbent solution in the event that it is outperformed by some other solution in the population. Hence, the incumbent solution in the iteration of the VSA is the solution to the problem of sizing of the DGs. It should be noted that the VSA is applied to each individual proposed by the master stage; thus, the incumbent solution delivered by the VSA becomes the objective function of each individual proposed by the PPBIL algorithm.
3.5. Selecting the Best Individual in the Population
After sizing all the DGs proposed within the individuals in P and evaluating the objective function, the individual with the lowest power losses is selected as the incumbent solution of the master stage. This individual will be later used to update the PM.
3.6. Updating the Probability Matrix and the Learning Rate
Based on the information provided by the individual selected as the incumbent solution to the problem, the probability of all the options in the PM is updated: that of the options that appear within the incumbent solution is increased and that of the options that do not appear within it is reduced. To that end, we used Equation (15), where is the current probability value of the different options in the PM and is the new probability value, which is updated based on the values contained in the incumbent solution.
In Equation (15), increases the probability of option i at node j only for the option selected by the individual that represents the incumbent solution (), thus reducing the probability of the other option when . The probability of the option assigned by the incumbent solution is increased by means of , which is given by Equation (16), where the increase is multiplied by a learning rate (LR) that controls the convergence and exploration of the algorithm.
In Equation (17), and denote the maximum and minimum values assigned to the LR, respectively and is the entropy of the PM, which takes a value of 1 in the first iteration. The value of can range from 0 to 1. Its importance and calculation within the algorithm are described in the next step.
3.7. Calculating the Entropy
Within the PPBIL algorithm, the entropy indicates whether the PM converges to a solution or not and how dispersed the probabilities are within said matrix (see Equation (18)). This may occur naturally when the entropy reaches a value of 0, or the programmer can assign a tolerance value to it (). When this tolerance value is reached, it means that the algorithm converges to a solution; otherwise, a new population is generated based on the current state of the PM, and the algorithm continues.
3.8. Extracting the Solution of the Probability Matrix and the Sizing of the DGs
Since the PPBIL algorithm evolves with a PM, once it meets the convergence criterion, the generators to which a DG will be assigned must be extracted from the PM considering the options with the highest probability for each node. Then, the VSA is applied to this configuration of DGs in order to obtain their sizing and, thus, provide a solution to the problem of location and sizing of DGs in DC networks. Subsequently, the PPBIL–VSA methodology returns the solution found for the problem addressed here.
4. Test Systems
To verify the effectiveness of the proposed hybrid (PPBIL–VSA) methodology, we employed the 21- and 69-bus test systems. Both systems have been widely used in the specialized literature to validate different methodologies for the integration of distributed energy resources into DC networks [12,20,24,29]. The electrical diagrams of each system and their technical characteristics are described below.
4.1. 21-Bus Test System
Figure 4 presents the electrical diagram of the 21-bus test system, which consists of 20 lines and 20 nodes, with constant power loads located at its various nodes. The initial configuration of this system does not include DGs. In addition, it has a single slack node that operates at a nominal voltage of 1 kV and has a power demand of 554 kW and a total power loss of 27.6 kW. In this study, we used a base voltage equal to the nominal voltage and a base power of 100 kW for this system.
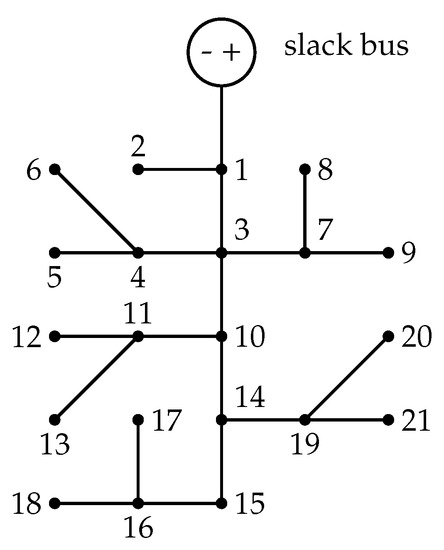
Figure 4.
Electrical configuration of the 21-bus test system [30].
4.2. 69-Bus Test System
Figure 5 illustrates the electrical diagram of the 69-bus test system, which has a total of 69 nodes and 68 lines and a single slack node that operates at a nominal voltage of 12.66 kV. Moreover, its initial configuration has no DGs installed. This system presents a total energy loss of 153 kW, for a total power demand of 3889 kW. In this study, we used a base voltage and power of 12.66 kV and 100 kW, respectively, for this system.
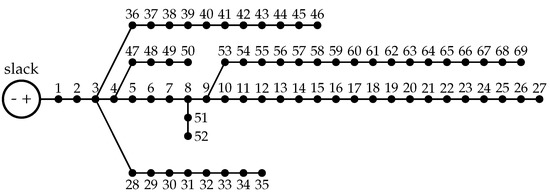
Figure 5.
Electrical configuration of the 69-bus test system [29].
5. Comparison Methods, Parameters, and Technical Considerations
In this section, of the manuscript are described all comparison methods, the parameters used for these, and all technical consideration used inside the test systems and scenarios implemented inside this manuscript.
5.1. Comparison Methods
We employed, as comparison methods, nine master–slave methodologies based on sequential programming and reported in the specialized literature [20,24]. In the master stage, these methodologies propose the implementation of two optimization algorithms for binary variables (PPBIL and GA) and a Parallel Monte-Carlo (PMC) solution, and, in the slave stage, they use the PSO, CGA, and BH algorithms to solve the problem of sizing of DGs, thus leading to the following hybrid methodologies: PPBIL–PSO, PPBIL–GCA, PPBIL–BH, GA–PSO, GA–GCA, GA–BH, PMC–PSO, PMC–GCA, and PMC–BH. In this paper, we propose combining the GA and PMC algorithms with the VSA, which gives rise to two additional hybrid techniques: GA–VSA and PMC–VSA. Due to the poor results obtained when evaluating the PMC–VSA methodology, its results were not included in our analysis. Hence, we obtained a total of ten comparison methods to evaluate the effectiveness and robustness of the proposed PPBIL–VSA methodology.
5.2. Parameterizing the Hybrid Methodologies
In this study, we used the parameters reported by the authors for the different comparison methods taken from the specialized literature [20,24]. The aim was to respect their proposed parametrization because they focused on the same problem, test systems, and considerations that we addressed here. We employed a PSO algorithm to parameterize the PPBIL and VSA optimization techniques used in the proposed hybrid methodology. This allowed us to obtain the best results in terms of quality of the solution and processing times. The parameters of both optimization methods are reported in Table 1.

Table 1.
Parameters of the PPBIL and VSA techniques.
5.3. Technical Considerations
To generate the test scenarios and validate the effectiveness of the methodologies proposed for solving the problem of integration of DGs into DC networks, we incorporated all the technical considerations reported in the specialized literature [20,24]. The most relevant ones are outlined below.
Regarding the technical conditions of the DGs, the integration of maximum three DGs was allowed for both test systems. Likewise, a minimum power of 0 kW was set for both systems; and a maximum power of 150 kW and 1200 kW, for the 21- and 69-bus test systems, respectively. Additionally, the maximum DG injection level was set at 40% of the power supplied by the slack node in the scenarios with no DG.
As for the test systems, the maximum and minimum voltages were set at +/−10% of the nominal voltage of each test system. With respect to the current limits on the lines, homogeneous (non-telescopic) networks were considered for both systems. A wire gauge of 900 kcmils and 400 kcmils was set for the 21-bus test system ( = 520 A) and the 69-bus test system ( = 335 A), respectively.
6. Simulation Results
This section analyzes the simulation results obtained by the different hybrid methodologies when applied to the 21- and 69-bus test systems. It should be noted that all simulations were performed in MATLAB using a Dell Precision T7600 Workstation with the following characteristics: an Intel (R) Xeon (R) ES-2670 CPU that operates at 2.50 GHz with 32 GB of RAM. Since the processor of this workstation can be partitioned into twelve workers, the population of the PPBIL algorithm was set at 12. All the methodologies were executed 1000 times to evaluate the repeatability of the solutions using the mean values of the objective function, the processing times, and the standard deviations. The results obtained in each test system and their analysis are presented below.
6.1. 21-Bus Test System
In this section, we will analyze the results of applying the methodologies selected from the literature and that proposed in this study in the 21-bus test system. Table 2 reports the effect of each methodology on the objective function and processing times after being executed 1000 times. From left to right, it shows the solution methodology, the nodes where the DGs were located and their power levels, the minimum power losses () found (kW) and their reduction (%) with respect to the base case, the average and their average reduction (%) after running the algorithm 1000 times, the average processing time (s), the standard deviation of the obtained solutions (%), the worst node voltage of the system and the node where this occurs, and the maximum current that circulates through the DC network under a DG environment.
Table 2.
Simulation results obtained by the different methodologies in the 21-bus test system.
It is worth noting that the base case considered in this study is a DC network with no DGs. Furthermore, the average response is more important than the best solution when analyzing the effect of the optimization methods applied to a particular problem because it helps to estimate the average impact of each methodology in terms of the objective function. This, together with the standard deviation, makes it possible to evaluate the repeatability and effectiveness of each implemented solution methodology. Therefore, since these indicators, along with processing time, help to identify the methods with the best performance, their analysis will be the basis to demonstrate the effectiveness of the methodology proposed in this paper.
Figure 6 shows the reductions and improvements obtained by the PPBIL–VSA methodology with respect to the other methods. According to this figure, its maximum reduction exceeds those obtained by the other techniques. For instance, it achieved an average improvement in maximum reduction of 9.44%, a maximum reduction of 26.04% with respect to the PMC–BH methodology, and a minimum reduction of 0.01% with respect to the GA–VSA technique.
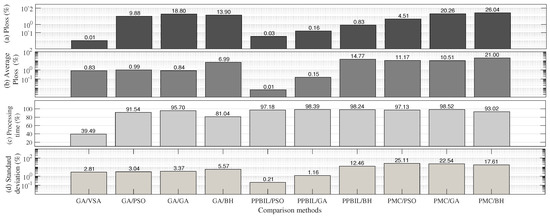
Figure 6.
Reductions obtained by the PPBIL–VSA methodology with respect to the comparison methods in the 21-bus test system.
Regarding average power loss reduction, Figure 6b shows that the PPBIL–VSA methodology obtained the best results, with an average reduction of 6.72%. Moreover, Figure 6c illustrates the effect of each method on processing time. As observed in this figure, the proposed methodology was the fastest in the 21-bus test system, with an average processing time of 3.57 s. In addition, it achieved a reduction of 89.02% compared to the other methods. Additionally, Figure 6d compares the Standard Deviation (STD) obtained by the PPBIL–VSA methodology with that of the other techniques. As can be seen in said figure, the proposed methodology achieves an average STD reduction of 10.11%, having the largest (25.11%) and smallest difference (0.21%) with the PMC–PSO and PPBIL–PSO methods, respectively.
Finally, after analyzing Table 2, particularly columns 7 and 8, we observe that all the proposed solution methodologies meet the technical limits established for the 21-bus system regarding node voltages and currents in the lines. This indicates that all solutions are feasible.
Based on these results, we may conclude that the proposed methodology has the best performance in terms of quality of the solution and processing times in the 21-bus test system. Figure 7 shows the methodology with the best ratio of average power losses to required processing times. In this figure, the y-axis indicates the average processing times required by the solution methodologies; and the x-axis, the average power losses. The best solution to the problem of location and sizing of DGs is the one that is closest to the origin, where the average processing time and average power losses are 0 s and 0 kW, respectively. Based on this premise and after analyzing Figure 7, the solution with the best average processing time–power loss ratio is the PPBIL–VSA methodology, and that with the worst ratio is the PMC–GA method.
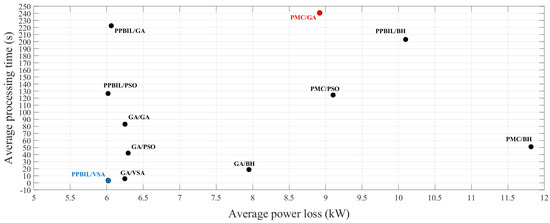
Figure 7.
Trade-off between average power losses and required processing time provided by the hybrid methodologies in the 21-bus test system.
6.2. 69-Bus Test System
Table 3 presents the results obtained after evaluating the different solution methodologies in the 69-bus test system. This table has the same structure and includes the same parameters as Table 2. Its information is analyzed below.
Table 3.
Simulation results obtained by the different methodologies in the 69-bus test system.
Figure 8 illustrates the performance of the proposed methodology in terms of quality of the solution and processing time with respect to the comparison methods. Figure 8a shows the improvements obtained by the PPBIL–VSA methodology with respect to the best solution found by each of the other methods (higher power loss reduction in its 1000 executions). After analyzing the values reported in this figure, the proposed methodology achieved an average improvement of 41.29% and is only outperformed by the GA–VSA technique by just 0.02%.
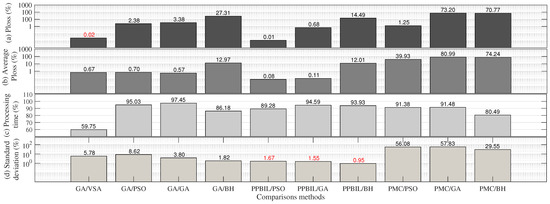
Figure 8.
Reductions obtained by the PPBIL–VSA methodology with respect to the comparison methods in the 69-bus test system.
Figure 8b presents the percentages by which the PPBIL–VSA methodology outperformed the other methods in terms of average power loss reduction, having the largest (74.24%) and smallest difference (0.08%) with the PMC–BH and PPBIL–PSO methods, respectively, and obtaining an improvement in the average power loss reduction of 24.62%. Additionally, the PPBIL–VSA technique reported the shortest processing time when compared to the other methods, with an average reduction of 91.09%. Regarding the standard deviation, the proposed methodology achieved an average reduction of 17.05% and was only outperformed by around 1.39% by the methodologies that use the PPBIL algorithm in the master stage. This small value, however, is compensated by its excellent results in terms of average power loss reduction and required processing times.
As in the 21-bus test system, we analyzed the ratio of power losses to required processing times of each hybrid methodology in the 69-bus test system to identify the most efficient method to solve the problem of integration of DGs into DC networks (see Figure 9). As observed in this figure, the methodology with the best average power losses–processing time ratio is the PPBIL–VSA technique. Thus, when compared to the most efficient methods that have been reported in the specialized literature so far, the methodology proposed in this paper is the most efficient and the one with the best reproducibility to solve the problem of integration of DGs in DC networks for any network size.
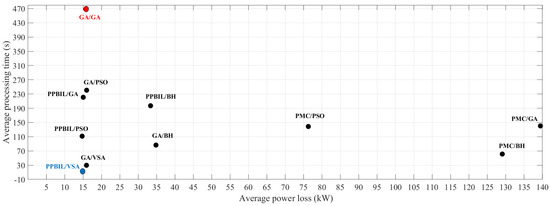
Figure 9.
Trade-off between average power losses and required processing time provided by the hybrid methodologies in the 69-bus test system.
7. Conclusions and Future Work
In this paper, we proposed a new hybrid methodology based on the PPBIL algorithm and the VSA to solve the problem of optimal integration of DGs into DC networks using a master–slave strategy. In addition, the reduction of power losses associated with energy transmission was employed as the objective function. The proposed methodology is based on sequential programming with aim of eliminating the need to use specialized software and, thus, reduce costs and the complexity of the solution. In order to evaluate its effectiveness, robustness, and repeatability, we used the 21- and 69-bus test systems (widely employed in the literature) and ten comparison methods. Likewise, each methodology was executed 1000 times to assess their power loss reduction, average processing times, and standard deviation.
After evaluating the PPBIL–VSA methodology in the 21-bus test system, we observed that it achieved the highest power loss reduction, as well as the best average results in terms of quality of the solution and processing times. Additionally, it reported the lowest standard deviation percentage. Since it yielded the best average responses and lowest levels of standard deviation, the proposed methodology proves to have the best performance and repeatability of the solution for small DC networks.
Regarding the 69-bus test system, the proposed methodology obtained the second highest power loss reduction and was only outperformed by the GA–VSA method by just 0.02% (an almost negligible difference). The PPBIL–VSA methodology, however, obtained the best average results in terms power loss reduction and required processing times, with a low standard deviation (around 1%). This suggests its high effectiveness and repeatability in solving the problem addressed here. It should be noted that, despite the fact that, in terms of standard deviation, the PPBIL–VSA method is outperformed by the other methodologies that use the PPBIL algorithm in the master stage, this small difference is compensated by its average values in terms of quality of the solution and processing times.
Finally, in order to identify the most effective technique in terms of power loss reduction and average required processing times, we designed a graph that included these two indicators in the x- and y-axes. According to the information in this graph, the PPBIL–VSA methodology yielded the best ratio between these two indicators: its solution was the closest to the origin (which represents the best possible solution to the problem, i.e., an average power loss of O kW and a required processing time of 0 s). This result was observed both in the 21- and 69-bus test system. Therefore, we may conclude that the PPBIL–VSA methodology is the best alternative to solve the problem of optimal integration of DGs into DC networks of any size.
As future work, we recommend analyzing 24-h scenarios that vary the generation and demand of power in order to evaluate the operation of the DGs installed in the network. This will require the VSA methodology to be modified so that it operates in a time horizon of 24 h and uses different technical, economic, and environmental aspects as the objective function. Additionally, we propose the integration of energy storage elements along with the DGs. To that end, the mathematical model and the proposed solution strategy must be redesigned.
Author Contributions
Conceptualization, L.F.G.-N., O.D.M., R.A.H.-I., M.G.E. and A.-J.P.-M.; methodology, L.F.G.-N., O.D.M., R.A.H.-I., M.G.E. and A.-J.P.-M.; formal analysis, L.F.G.-N., O.D.M., R.A.H.-I., M.G.E. and A.-J.P.-M.; investigation, L.F.G.-N., O.D.M., R.A.H.-I., M.G.E. and A.-J.P.-M.; resources, L.F.G.-N., O.D.M., R.A.H.-I., M.G.E. and A.-J.P.-M.; writing—original draft preparation, L.F.G.-N., O.D.M., R.A.H.-I., M.G.E. and A.-J.P.-M. All authors have read and agreed to the published version of the manuscript.
Funding
This research was funded by the Intitución Instituto Tecnológico Metropolitano, the Universidad Francisco José de Caldas, the Universidad Tecnológica de Pereira, the University of Cordoba and the Spanish Ministry of Science, Innovation and Universities under the program “Proyectos de I+D de Generacion de Conocimiento” of the National Program for Knowledge Generation and Scientific and Technological Strengthening of the RDi System under grant number PGC2018-098813- B-C33.
Conflicts of Interest
The authors declare no conflict of interest.
References
- Grisales-Noreña, L.F.; Gonzalez Montoya, D.; Ramos-Paja, C.A. Optimal sizing and location of distributed generators based on PBIL and PSO techniques. Energies 2018, 11, 1018. [Google Scholar] [CrossRef] [Green Version]
- Hassan, A.S.; Othman, E.A.; Bendary, F.M.; Ebrahim, M.A. Optimal integration of distributed generation resources in active distribution networks for techno-economic benefits. Energy Rep. 2020, 6, 3462–3471. [Google Scholar] [CrossRef]
- Mishra, R.K.; Swarup, K.S. Adaptive Weight-Based Self Reconfiguration of Smart Distribution Network With Intelligent Agents. IEEE Trans. Emerg. Top. Comput. Intell. 2018, 2, 464–472. [Google Scholar] [CrossRef]
- Gil-González, W.; Montoya, O.D.; Rajagopalan, A.; Grisales-Noreña, L.F.; Hernández, J.C. Optimal selection and location of fixed-step capacitor banks in distribution networks using a discrete version of the vortex search algorithm. Energies 2020, 13, 4914. [Google Scholar] [CrossRef]
- Montoya, O.D.; Chamorro, H.R.; Alvarado-Barrios, L.; Gil-González, W.; Orozco-Henao, C. Genetic-Convex Model for Dynamic Reactive Power Compensation in Distribution Networks Using D-STATCOMs. Appl. Sci. 2021, 11, 3353. [Google Scholar] [CrossRef]
- Nunez Forestieri, J.; Farasat, M. Integrative sizing/real-time energy management of a hybrid supercapacitor/undersea energy storage system for grid integration of wave energy conversion systems. IEEE J. Emerg. Sel. Top. Power Electron. 2020, 8, 3798–3810. [Google Scholar] [CrossRef]
- Hashimoto, J.; Ustun, T.S.; Suzuki, M.; Sugahara, S.; Hasegawa, M.; Otani, K. Advanced Grid Integration Test Platform for Increased Distributed Renewable Energy Penetration in Smart Grids. IEEE Access 2021, 9, 34040–34053. [Google Scholar] [CrossRef]
- Abdmouleh, Z.; Gastli, A.; Ben-Brahim, L.; Haouari, M.; Al-Emadi, N.A. Review of optimization techniques applied for the integration of distributed generation from renewable energy sources. Renew. Energy 2017, 113, 266–280. [Google Scholar] [CrossRef]
- Ehsan, A.; Yang, Q. Optimal integration and planning of renewable distributed generation in the power distribution networks: A review of analytical techniques. Appl. Energy 2018, 210, 44–59. [Google Scholar] [CrossRef]
- Noreña, L.F.G.; Cuestas, B.J.R.; Ramirez, F.E.J. Ubicación y dimensionamiento de generación distribuida: Una revisión. Cienc. Ing. Neogranadina 2017, 27, 157–176. [Google Scholar] [CrossRef] [Green Version]
- Bizuayehu, A.W.; de la Nieta, A.A.S.; Contreras, J.; Catalao, J.P. Impacts of stochastic wind power and storage participation on economic dispatch in distribution systems. IEEE Trans. Sustain. Energy 2016, 7, 1336–1345. [Google Scholar] [CrossRef]
- Grisales-Noreña, L.F.; Montoya, O.D.; Ramos-Paja, C.A. An energy management system for optimal operation of BSS in DC distributed generation environments based on a parallel PSO algorithm. J. Energy Storage 2020, 29, 101488. [Google Scholar] [CrossRef]
- Grisales-Noreña, L.F.; Ramos-Paja, C.A.; Gonzalez-Montoya, D.; Alcalá, G.; Hernandez-Escobedo, Q. Energy management in PV based microgrids designed for the Universidad Nacional de Colombia. Sustainability 2020, 12, 1219. [Google Scholar] [CrossRef] [Green Version]
- Dragičević, T.; Lu, X.; Vasquez, J.C.; Guerrero, J.M. DC microgrids—Part II: A review of power architectures, applications, and standardization issues. IEEE Trans. Power Electron. 2015, 31, 3528–3549. [Google Scholar] [CrossRef] [Green Version]
- Montoya, O.D.; Gil-González, W.; Grisales-Noreña, L.F. On the mathematical modeling for optimal selecting of calibers of conductors in DC radial distribution networks: An MINLP approach. Electr. Power Syst. Res. 2021, 194, 107072. [Google Scholar] [CrossRef]
- Rodriguez, P.; Rouzbehi, K. Multi-terminal DC grids: Challenges and prospects. J. Mod. Power Syst. Clean Energy 2017, 5, 515–523. [Google Scholar] [CrossRef] [Green Version]
- Montoya, O.D.; Gil-González, W. A MIQP model for optimal location and sizing of dispatchable DGs in DC networks. Energy Syst. 2021, 12, 181–202. [Google Scholar] [CrossRef]
- Ji, H.; Wang, C.; Li, P.; Zhao, J.; Song, G.; Wu, J. Quantified flexibility evaluation of soft open points to improve distributed generator penetration in active distribution networks based on difference-of-convex programming. Appl. Energy 2018, 218, 338–348. [Google Scholar] [CrossRef]
- Wong, L.A.; Ramachandaramurthy, V.K.; Taylor, P.; Ekanayake, J.; Walker, S.L.; Padmanaban, S. Review on the optimal placement, sizing and control of an energy storage system in the distribution network. J. Energy Storage 2019, 21, 489–504. [Google Scholar] [CrossRef]
- Grisales-Noreña, L.F.; Montoya, O.D.; Ramos-Paja, C.A.; Hernandez-Escobedo, Q.; Perea-Moreno, A.J. Optimal Location and Sizing of Distributed Generators in DC Networks Using a Hybrid Method Based on Parallel PBIL and PSO. Electronics 2020, 9, 1808. [Google Scholar] [CrossRef]
- Wang, P.; Wang, W.; Xu, D. Optimal sizing of distributed generations in dc microgrids with comprehensive consideration of system operation modes and operation targets. IEEE Access 2018, 6, 31129–31140. [Google Scholar] [CrossRef]
- Montoya, O.; Gil-González, W.; Grisales-Noreña, L. Optimal Power Dispatch of Dgs in Dc Power Grids: A Hybrid Gauss-Seidel-Genetic-Algorithm Methodology for Solving the OPF Problem; World Scientific and Engineering Academy and Society: Athens, Greece, 2018. [Google Scholar]
- Garzon-Rivera, O.; Ocampo, J.; Grisales-Norena, L.; Montoya, O.; Rojas-Montano, J. Optimal Power Flow in Direct Current Networks Using the Antlion Optimizer. Stat. Optim. Inf. Comput. 2020, 8, 846–857. [Google Scholar] [CrossRef]
- Grisales-Noreña, L.F.; Garzon-Rivera, O.D.; Montoya, O.D.; Ramos-Paja, C.A. Hybrid metaheuristic optimization methods for optimal location and sizing DGs in DC networks. In Workshop on Engineering Applications; Springer: Cham, Switzerland, 2019; pp. 214–225. [Google Scholar]
- Montoya, O.D.; Gil-González, W.; Grisales-Noreña, L. Vortex search algorithm for optimal power flow analysis in DC resistive networks with CPLs. IEEE Trans. Circuits Syst. II Express Briefs 2019, 67, 1439–1443. [Google Scholar] [CrossRef]
- Montoya, O.D.; Garrido, V.M.; Gil-González, W.; Grisales-Noreña, L.F. Power flow analysis in DC grids: Two alternative numerical methods. IEEE Trans. Circuits Syst. II Express Briefs 2019, 66, 1865–1869. [Google Scholar] [CrossRef]
- Grisales-Noreña, L.F.; Montoya, O.D.; Gil-González, W.J.; Perea-Moreno, A.J.; Perea-Moreno, M.A. A Comparative Study on Power Flow Methods for Direct-Current Networks Considering Processing Time and Numerical Convergence Errors. Electronics 2020, 9, 2062. [Google Scholar] [CrossRef]
- Montoya, O.D.; Grisales-Noreña, L.F.; Gil-González, W. Triangular matrix formulation for power flow analysis in radial DC resistive grids with CPLs. IEEE Trans. Circuits Syst. II Express Briefs 2019, 67, 1094–1098. [Google Scholar] [CrossRef]
- Molina-Martin, F.; Montoya, O.D.; Grisales-Noreña, L.F.; Hernández, J.C. A Mixed-Integer Conic Formulation for Optimal Placement and Dimensioning of DGs in DC Distribution Networks. Electronics 2021, 10, 176. [Google Scholar] [CrossRef]
- Montoya, O.D.; Grisales-Noreña, L.; González-Montoya, D.; Ramos-Paja, C.; Garces, A. Linear power flow formulation for low-voltage DC power grids. Electr. Power Syst. Res. 2018, 163, 375–381. [Google Scholar] [CrossRef]
Publisher’s Note: MDPI stays neutral with regard to jurisdictional claims in published maps and institutional affiliations. |
© 2021 by the authors. Licensee MDPI, Basel, Switzerland. This article is an open access article distributed under the terms and conditions of the Creative Commons Attribution (CC BY) license (https://creativecommons.org/licenses/by/4.0/).