Article

An RFM Model Customizable to Product Catalogues and Marketing Criteria Using Fuzzy Linguistic Models: Case Study of a Retail Business

by
Rocío G. Martínez
1,*,
Ramon A. Carrasco
1,
Cristina Sanchez-Figueroa
2 and
Diana Gavilan
1
1
Department of Management and Marketing, Complutense University of Madrid, UCM, 28223 Madrid, Spain
2
Department of Statistics and Applied Economy, UNED University, 28040 Madrid, Spain
*
Author to whom correspondence should be addressed.
Mathematics 2021, 9(16), 1836; https://doi.org/10.3390/math9161836
Submission received: 30 June 2021 / Revised: 20 July 2021 / Accepted: 25 July 2021 / Published: 4 August 2021
(This article belongs to the Special Issue Mathematics and Mathematical Physics Applied to Financial Markets)

Abstract

:
In the field of strategic marketing, the recency, frequency and monetary (RFM) variables model has been applied for years to determine how solid a database is in terms of spending and customer activity. Retailers almost never obtain data related to their customers beyond their purchase history, and if they do, the information is often out of date. This work presents a new method, based on the fuzzy linguistic 2-tuple model and the definition of product hierarchies, which provides a linguistic interpretability giving business meaning and improving the precision of conventional models. The fuzzy linguistic 2-tuple RFM model, adapted by the product hierarchy thanks to the analytical hierarchical process (AHP), is revealed to be a useful tool for including business criteria, product catalogues and customer insights in the definition of commercial strategies. The result of our method is a complete customer segmentation that enriches the clusters obtained with the traditional fuzzy linguistic 2-tuple RFM model and offers a clear view of customers’ preferences and possible actions to define cross- and up-selling strategies. A real case study based on a worldwide leader in home decoration was developed to guide, step by step, other researchers and marketers. The model was built using the only information that retailers always have: customers’ purchase ticket details.

1. Introduction

We live in a fast-changing digital world. In today’s age, customers expect sellers to talk directly with them and offer the perfect product, with the right message and at the correct time. Big Data analytics have an immense potential to empower customer experience management, as they can help organizations to achieve a better and faster understanding of the customer journey and make decisions to improve the customer experience (Wedel and Kannan [1]).
There are many organizations still learning how to capture data from the multitude of available touchpoints, devices, media and applications (Maechler et al. [2]). In some cases, even if they have the data, organizations still face difficulties in understanding and managing those data and generating relevant insights (Said et al. [3]). Information about customers is achieved through the use of analytics (Wedel and Kannan [1]), and despite its use becoming more common, many companies still use basic and poor analytics to extract information from their customers (Moorman [4]; Ramsbotham et al. [5]).
Digital transformation has been a revolution in the way companies manage their business and also in the way they manage relationships with customers, employees, suppliers, and other stakeholders (Bresciani et al. [6]; Scuotto et al. [7]).
Digitalization is changing the relationship between consumers and companies (Taiminen and Karjaluoto [8]). Consumers have the possibility to actively communicate with other consumers and businesses on their customer journey (Verhoef et al. [9]) and dynamic capabilities foster the digital transformation of customer value creation (Matarazzo et al. [10]).
With an ever-increasing mobility and connectivity and an ever-faster pace of life, the ability to attract customers, as well as the attention span of consumers and the time they have, is decreasing daily (Kartajaya et al. [11]).
Liu et al. [12] define digital transformation or “digitalization” as “the integration of digital technologies into business processes”. Part of this digital transformation is based on the need to study and understand consumer behaviour, which analyses how groups, individuals, and organizations behave and how they choose products, services or experiences to fulfil their needs (Chen and Popovich [13]; Kuchinka et al. [14]; Sirgy [15]; Yuan et al. [16]). This has been driven by the increase in online transactions and changes in the profiles of online customers (Eger et al. [17]).
Customer behaviour analysis is driven by relationship marketing management as it is trying to focus marketing by ensuring the importance of the relationship with the customer (Rahman and Reynolds [18]). The recency, frequency and monetary (RFM) model is related to the acquisition, retention and relationship management of the most profitable customers for a business; therefore, it is important to marketing departments to be able to develop more efficient targeted marketing campaigns (Hughes [19]; Bult and Wansbeek [20]; Yeh et al. [21]).
In marketing, customer lifetime value (CLV) is the value that a customer contributes to a business over the entire lifetime of a company. It can also be defined as the net present value of the cash flows attributed to the relationship with a customer, and consequently, it emulates a customer’s future profitability (Gupta et al. [22]; Kumar and Reinartz [23]). It is a useful metric used by marketing managers, especially when they focus on customer acquisition and retention. In this study, we worked with the RFM model and calculated the customer lifetime value based on the RFM values, which we call the RFMScore.
Retailers almost never have data related to their customers beyond their purchase history, and if they do, the information is often out of date. Therefore, the only customer information we used for this investigation is that of historical transactional data related to purchases and products.
In this work, a detailed review of the literature related to the RFM model and its extensions is presented. From this review, we highlight the contribution of the authors Heldt et al. [24] and Moghaddam et al. [25] as the only authors who have taken the product into account in the extension of the model. Heldt et al. [24] developed the RFMP model (recency, frequency, monetary, and product) including the product dimension to improve the accuracy of CLV prediction. They worked at the product level but did not consider the product catalogue hierarchies. The fact that it requires the calculation of the CLV per each product and each customer seems to be unrealistic for retailers that normally have millions of customers and products. The other approximation to the RFM model enriched with product information was conducted by Moghaddam et al. [25], who introduced the RFMV model (recency, frequency, monetary and variety), which only includes the variety of products purchased by the customer.
Considering that we only have customers’ purchase data and calculating a customer’s value for each product can be too expensive, our main goal for this research is to find a solution to these two issues. Therefore, the question of our research is how to improve the efficiency of the current models to define the marketing strategy of a retailer, using exclusively sales and product data, maintaining the customer-centric focus enriched with the information that resides only in a product catalogue, which is contained within the historical sales repository.
This research is an improvement of the fuzzy linguistic 2-tuple RFM model by including the information related to the product catalogue to help organizations calculate the CLV and segment the customer database. Using the different weights defined by the AHP model, we generated a customizable tool according to business needs, commercial calendars and any unexpected issue. The product catalogue was hierarchised, applying the principal component analysis (PCA), which revealed the patterns’ defined by customers when they make a purchase.
It is very important to understand that not all products have the same purchase process or implications from the customer’s point of view. Some of these can be purchased following an impulsive feeling (Virvilaitė and Saladienė [26]; Chen [27]), but others are very complex products to buy, and demand an extremely high effort from the customers in terms of planning, decision making or even monetary effort. A sales team is interested in analysing which products are normally co-purchased (Chang and Tsai [28]), and marketing managers should be interested in elements such as determining the potential buyers for a certain product. Obviously, all of them should be interested in determining the frequency, monetary and recency value for each customer. Therefore, both models, the traditional RFM and the new one, which includes the RFMScore per product hierarchy, will be very useful tools to help areas of the company and build an effective customer-product management system.
Customers’ RFMScores per product hierarchy will be segmented to define the hidden profiles on customers’ purchase behaviours, and the traditional RFMScore, built with only three attributes—recency, frequency and monetary—will be used to enrich the new model.
The experimental analysis was based on a worldwide leader in home furniture and decoration that sells online and offline. Data were collected throughout 4 years, including all purchases for customers belonging to their loyalty club during that period. This ensured the possibility of linking all historical purchases to each customer. The dataset had 25 million records of ticket lines related to more than 250,000 different customers.
The analysis was conducted using R and Python languages embedded in nodes of Knime 4.3.2 (https://www.knime.com/, accessed on 30 July 2021), an open source software, recognized by Gartner as one of the leaders in data science and machine learning platforms.
The rest of this paper is organized as follows. In Section 2, we review the materials and methods, including the literature review and the preliminary knowledge to be applied in subsequent sections. In Section 3, the proposed model is presented showing the developed approach, the economic and mathematical model and a very detailed implementation of the model in real-world data. Section 4 contains the discussion and limitations of the model and issues for future research and to close the document, Section 5 details the research conclusions.

2. Materials and Methods

In this section, we summarize the literature review, including a timeline with important improvements for the RFM model; we also include the theoretical contents and previous works that we consider essential to be able to follow our proposal.

2.1. Literature Review

The RFM model is a very well-known technique that is defined by three measures (recency, frequency and monetary), which are normally divided into five equal quintiles (20% group) and combined into a three-digit RFM cell code (Bult and Wansbeek [20]; Bitran and Mondschein [29]; Miglautsch [30]; Chang et al. [31]; Miglautsch [32]). According to our experience and prior findings, RFM values could be firm-specific and are based on the nature of the products and customers’ behaviour (Lumsden et al. [33]). Many authors have attempted to improve the original RFM model. Wei et al. [34] prepared a summary of these improvements covering RFM different versions until 2010, and Ernawati et al. [35] continued that work and summarized new versions and improvements to the RFM model from 2015 to 2021. One of the proved improvements of the traditional RFM model was the fuzzy linguistic 2-tuple RFM model (Carrasco et al. [36,37]; Martínez et al. [38]).
As we already mentioned, CLV is the value a customer contributes to a business over their entire lifetime at the company. By making use of CLV, companies tend to place emphasis on long-term customer satisfaction and loyalty instead of maximizing short-term relations and sales (Gupta et al. [22]; Kumar [39]; Fader et al. [40]). There are many publications related to other models that attempt to calculate customers’ behaviour (Bolton [41]; Baesens et al. [42]; Malthouse [43]; Berry and Linoff [44]; Malthouse and Blattberg [45]; Rud [46]; Zhang et al. [47]), but CLV estimation based on recency, frequency and monetary (RFM) values remains the most used.
Our proposal is an extension of the fuzzy linguistic 2-tuple RFM model, and it is applied to both historical and current products purchased by customers, to calculate the customer value based on the RFMScore. Wong and Wei [48] calculated the weighted RFMScore. The weight determination for each variable of the RFM to create the RFMScore depends on the factor’s importance in the application (Dursun and Caber [49]; Peker et al. [50]); some authors applied the same weights to each attribute (Peker et al. [50]; Hamdi and Zamiri [51]; Weng [52]), but other researchers applied the analytical hierarchical process (AHP) to define the correspondence weights, such as Moghaddam et al. [25], He and Li [53], Rezaeinia and Rahmani [54], Marisa et al. [55], Patel et al. [56], Hosseini and Mohammadzadeh [57], Dachyar et al. [58] and Monalisa et al. [59]. We will take advantage of their findings and use AHP to define the different weights of each RFMScore per product category, obtaining a more complete approach to customer preferences and customer value.
Taking advantage of customers’ purchase behaviour, we define a new hierarchy of products that better responds to customers’ needs, not only to business needs, and will help retailers to better determine their customers’ preferences. We applied PCA to discover patterns in product original hierarchies and aggregated a huge number of product dimensions into a more manageable number that fitted customers preferences (Maćkiewicz, and Ratajczak [60]; Karamizadeh et al. [61]; Abdi and Williams [62]; Paul et al. [63]; Bryant and Yarnold [64]).
Figure 1 shows, in a timeline, a summary of the main RFM model improvements. The publications that have a direct relation with our work are highlighted in bold.
The criterion when constructing this table was to show the key moments in the evolution of the RFM model; therefore, only the first versions of each evolution appear in the table.
It can be seen how Hughes [19] first defined the RFM model in 1994; Bult and Wansbeek [20] first introduced the use of the RFMScores; Suh et al. [65] combined the RFM model with data mining algorithms; Miglautsch [30] used the RFMScores to perform the first customer segmentations; Kaymak [66] introduced the concept of Fuzzy RFM by segmenting with the fuzzy c-means algorithm; Hsieh [67] was the first to modify the variables R, F and M to ensure the application of this model to a particular business. In the same year, Tsai and Chiu [68] introduced the concept of weighted RFM. In 2005, Buckinx and Van den Poel [69] introduced the length dimension to the model; Fader et al. [40] described enriching it with the CLV; and Liu and Shih applied the AHP to calculate the weights of the variables R, F and M to define CLV and applied the results to customer segmentation. They also calculated association rules for the construction of a collaborative recommender system.
In 2008, Yeh et al. [21] added the variable of time. In 2009, Coussement and Van den Poel [70] introduced emotions in the model; Chen et al. [71] enriched the model with the Apriori algorithm; in 2010, Hosseini et al. [72] applied the model to a B2B business and entered the variable period for client activity; Li et al. [73] introduced pointwise mutual information; and Sekhavat et al. [74] added the duration variable. In 2014, significant improvements were made by Albadvi et al. [75] who applied fuzzy WRFM with a pareto/NBD distribution to segment and estimate the future CLV. In 2015, Carrasco et al. [36] introduced the linguistic 2-tuple RFM model; Güçdemir and Selim [76] applied the AHP model in an interesting way to weight the customer segments they obtained; and Zhang et al. [47] enriched the model with cumpliness.
In 2016, the segment of Dursun and Caber [49] included the dimension of seasonality; He and Li [53] enriched it by entering users’ satisfaction into e-commerce websites; Hosseini and Mohammadzadeh [57] included length in the model; and Song et al. [77] introduced an interesting element, time, as a dynamic dimension. In 2017, an interesting contribution for our research occurred: Moghaddam et al. [25] introduced product information although only through the variable V related to the variety of products. Peker et al. [50] added length and periodicity. In 2018, Li et al. [78] applied k-means to segment clients with the enriched model thanks to the length and membership duration. In 2019, Heldt et al. first directly described the product [24]. They estimated the future CLV for each product. Martinez et al. [38] demonstrated the improvement in the results of customer segmentation attributable to the linguistic 2-tuple model. In 2021, we have models, such as the PRFM of Hajmohamad et al. [79], which works on the profit margin, and that of Hwan and Lee [80], which applies the TexRank algorithm to improve the RFM by including website-specific weights and is thus able to work with clients without their purchase history. Chen and Huang [81] introduced the discretization of variables as an improvement to the model, and Bueno et al. [82] improved it by introducing opinion aggregations.

2.2. Theoretical Fundamentals

2.2.1. The 2-Tuple Fuzzy Linguistic Model

The fuzzy linguistic 2-tuple approach (Herrera and Martínez [83]) is a continuous model of information representation (Herrera and Herrera [84]) that has been used in many business and management applications. This model carries out processes of “computing with words” without a loss of information, which is typical of other fuzzy linguistic approaches. Henceforth, we explain the basic notations and operational details to explain our proposal.
Let S = {s0, …, sT} be a linguistic term set with odd cardinality, where the mid-term represents the neutral value, and the rest of the terms are symmetric with respect to it. We assume that the semantics of labels are given by means of triangular membership function μSi, [0, 1] [0, 1], and consider all terms distributed on a scale on which a total order is defined, i.e., si ≤ sj i < j. This portrayal is accomplished by the 3-tuple (i,j,k), where j is the mark where the membership is 1, and i and k are the left and right limits of the definition domain of the triangular membership function, respectively. Figure 2 represents the semantics assigned in five terms via triangular membership function, where:
VB = very bad = (0, 0, 0.25); B = bad = (0, 0.25, 0.5); N = neutral = (0.25, 0.5, 0.75); G = good = (0.5, 0.75, 1); and VG = very good = (0.75, 1, 1).
In this fuzzy linguistic context, if a symbolic method aggregating linguistic information (Herrera and Herrera [84]) obtains a value b [0, T], and b {0, , T}, then an approximation function is used to express the result in S.
Definition 1.
(Herrera and Martínez [83]) Let b be the result of an aggregation of the indexes of a set of labels assessed in a linguistic term set S, i.e., the result of a symbolic aggregation operation, b ∈ [0, T]. Let i = round(b) and α = b − i be two values, such that i ∈ [0, T] and α ∈ [−0.5, 0.5), then α is called a symbolic translation.
The fuzzy linguistic 2-tuple approach is developed from the concept of symbolic translation by representing the linguistic information by means of 2-tuple (si, αi), si S and αi [−0.5, 0.5), where si represents the information linguistic label, and αi is a numerical value expressing the value of the translation from the original result b to the closest index label, i, in the linguistic term set S. The value (si, αi) can also be represented as si ± αi (+or—depending on the sign of αi).
This model defines a set of transformation functions between numeric values and 2-tuple:
Definition 2.
(Herrera and Martínez [83]) Let S = {s1, …, sT} be a linguistic term set and b ∈ [0, T] a value representing the result of a symbolic aggregation operation, then the 2-tuple that expresses the equivalent information to b is obtained with the following function:
:   0 , T S × 0.5 ,   0.5 b = s i ,   α , w i t h s i ,   i = r o u n d b α = b i ,   α Î 0.5 ,   0.5 .
where round(·) is the usual round operation, si has the closest index label to b and α is the value of the symbolic translation.
For all ∆, there exists ∆−1, defined as follows:
−1(si, α) = i + α.
The negation operator is defined as follows:
neg((si, α)) = ∆(T − (∆−1(si, α))).
Information aggregation consists of obtaining a value that summarizes a set of values. Hence, the result of the aggregation of a set of 2-tuples must be a 2-tuple. Using the functions ∆ and ∆−1 that transform numerical values into linguistic 2-tuples and vice versa without the loss of information, any of the existing aggregation operators can be easily extended for dealing with linguistic 2-tuples.
In the case of a comparison between 2-tuples (si, α1) and (sj, α2), if i < j, then (si, α1) is smaller than (sj, α2). If i = j and α1 = α2, then (si, α1) and (sj, α2) include the same information; if i = j and α1 < α2, then (si, α1) is smaller than (sj, α2); and if i = j and α1 > α2, then (si, α1) is bigger than (sj, α2). Below, we describe the aggregation operators that we use in our model:
Definition 3.
(Porcel et al. [85]). Let A = {(l1, α1), …, (ln, αn)} be a set of linguistic 2-tuples and W = {w1, …, wn} be their associated weights. The 2-tuple weighted average Āw is as follows:
Ā w ( l 1 ,   α 1 ) ,   ,   ( l n ,   α n )   =   i = 1 n b i w i i = 1 n w i
Definition 4.
(Porcel et al. [85]). Let A = {(l1, α1), …, (ln, αn)} be a set of linguistic 2-tuples. The 2-tuple average Ā is as follows:
Ā ( l 1 ,   α 1 ) ,   ,   ( l n ,   α n )   =   i = 1 n b i n .

2.2.2. The Fuzzy Linguistic 2-Tuple RFM Model

The RFM model was first proposed by Hughes in 1994 [19]. It is a popular tool of customer value analysis and has been extensively used for measuring customer lifetime value (Cheng and Chen [86]) and in customer segmentation and behaviour analysis (Chen et al. [87]). The RFM analytic approach is a common model that identifies customer purchase behaviour and differentiates important customers from large data by three variables:
  • Recency (R): the time (in units such as days, months and years) since the most recent purchase transaction or shopping visit.
  • Frequency (F): The total number of purchase transactions or shopping visits in the period examined.
  • Monetary value (M): the total value of the purchases within the period examined.
The aim, therefore, is to categorize each customer by means of scores based on these three variables, typically based on quintiles (5 represents 20% of the best customers in that variable, and 1 represents 20% of the worst), from which a unique score is calculated which represents the customer’s value. However, these scores are not very precise, so in Carrasco et al. [37], Martinez et al. [38], an improvement in the RFM is proposed, which consists of representing these scores using the fuzzy linguistic 2-tuple model. The stages of this proposal are explained below:
  • Data collection: let U = {u1, …, u#U} be the set of customers who have made at least one purchase over a pre-established analysis period. Let T = {(u1, d1, a1), …, (u#T, d#T, a#T)} be the details of transactions or purchases made by such customers in this period, where the ui U identifies the customer of such a purchase on the date di for the amount of ai.
  • Customer aggregation: in this phase, T is aggregated at the customer level, obtaining the set TU = {(u1, r1, f1, m1), …, (u#U, r#U, f#U, m#U)}, where re would be the days since the last purchase of the customer ue (using a later fixed reference date for all customer purchases), fe is the number of times the customer has purchased and me contains the total amount of these purchases.
  • Score computation: in this step, the set RFM = {(u1, R1, F1, M1, RFM1), …, (u#U, R#U, F#U, M#U, RFM#U)} with the fuzzy linguistic 2-tuple RFMScores is obtained. First, a symmetric and uniformly distributed domain S using five linguistic labels is defined. These labels have a semantic meaning for the variables of the RFM model referring to the degree of agreement with the goodness of the variable:
    Let S = {s0, …, sT} be with T = 4: s0 = very bad = VB; s1 = bad = B; s2 = neutral = N; s3 = good = G; and s4 = very good = VG, with the definition shown in Figure 2.
Therefore, the following variables are calculated: Re, Fe, Me, RFMiS × [−0.5, 0.5). For each customer ue, i = 1, …, #U, we obtain Ae = (Ae1, Ae2, Ae3) with Ae1 = Re, Ae2 = Fe and Ae3 = Me. First, customers are sorted in ascending order according to each of the individual components Be = (Be1, Be2, Be3), with Be1 = re, Be2 = fe and Be3 = me, contained in TU. Now, we define rankei ∈ {1, …, #U} as the ranking of each client with respect to each of these variables:
percent_rankei = (rankei − 1)/(n − 1)
with percent_rankei ∈ [0, 1], e = 1, …, #U and i = 1, …, 3. The final 2-tuple score Aei is obtained as follows:
A e i = ( p e r c e n t _ r a n k e i ,   i f   i     1 n e g p e r c e n t _ r a n k e i ,   i f   i = 1  
where ∆(·) and neg(·) are defined in Section 2.2.1 (Equations (1) and (3)). We use the negation function on recency, as the larger scores represent the most recent buyers. The 2-tuple RFMe, which characterizes together the Re, Fe and Me scores, is calculated for each customer using Equation (5) as RFMe = Āw [Aei], with the user-defined weights W = {wR, wF, wM} previously defined by the marketing experts.

2.2.3. Analytical Hierarchical Process (AHP)

This technique is a systematic and hierarchical method to help the decision maker to solve complex multicriteria decision making (MCDM) problems, which involves ranking alternatives. The AHP model has been widely used to calculate the customer lifetime value by applying the AHP to define the importance of the RFM variables (Liu and Shih [88]). To adopt the AHP method for the objective of this work, the following steps proposed by Saaty [89] and Carrasco et al. [37] are followed.

Structuring of the Decision Problem into a Hierarchical Model

This consists of the decomposition of the decision problem into elements, according to their common characteristics, visually constructing a hierarchical model of different interrelated criteria, facilitating their understanding and evaluation. The first level always contains the goal of the problem; the second level is constituted by the criteria, which can be subdivided into sub-criteria; and the last level contains different alternatives. Thus, in this step, we define the alternatives set A = {a1, …, a#A} and the hierarchical criteria for assessing them C. C1 = {c11, …, c1#C1}, each of these criteria c1i can, in turn, be subdivided into sub-criteria, at several levels, c1ij = {c1i1, …, c1#Cij}, and thus recursively.

Making Pairwise Comparisons and Obtaining the Judgmental Matrix

In this step, the opinion of the decision makers is used to compare parts of elements of a particular level with respect to a specific element at the immediate superior level. Let PW = (pwij)nxn be a pairwise comparison matrix where element pwij represents the importance of criterion i over criterion j evaluated by the decision makers, which judge the relative importance of one criterion over another with respect to the goal. The relative importance of one sub-criterion over another with respect to the main dimension will also be calculated. Every judgment will be represented from the predefined rating scale of the numbers of Table 1. Each entry aij of the judgmental matrix is governed by the three rules: pwij > 0; pwij = 1/pwji reciprocal property; and pwii = 1 for all i.

Obtaining Local Weights and Consistency of Comparisons

The criteria weight vector, w, is built using the eigenvector method through the following equation:
j = 1 n p w i j w j = λ m a x
where λ m a x is the is the maximum eigenvalue of PW and w is the normalized eigenvector associated with the main eigenvalue of PW. This approach provides the best priority weights for each criterion or sub-criterion. The consistency of the AHP can be checked by the consistency ratio (CR), which is defined as follows:
C R = C I R I
that is, the division between the consistency index (CI), defined as λ m a x n n 1 , and the random consistency index (RI), which represents the consistency of a randomly generated pairwise comparison matrix. Table 2 shows the RI provided by Saaty.
If CR ≤ 0.1, the results of the individual hierarchical type are satisfied, and coherence is guaranteed; otherwise, it will be necessary to adjust the values of the elements of the pairwise comparison, and the judgments should be made once again by the decision makers that are more consistent.

3. Results

3.1. Developed Approach

This section explains the proposed model to define the best commercial strategy attributable to the RFM model, customizable by the product catalogue and marketing criteria using the fuzzy linguistic 2-tuple RFM model. The process consists of the following four steps represented in Figure 3. In step 1, we prepare the product hierarchy to be able to introduce the product information into the model. In step 2, we calculate the different weights for the variables and the fuzzy linguistic 2-tuple RFMScore per product category. In step 3, we are able to define customer segments based on the RFMScore by product category, and in the last step, we have all the tools to define the marketing strategy. The scheme shows how our model is able to include purchase and customer databases, historical and current products from a catalogue, business experts’ opinions and social events as inputs to define the 2-tuple linguistic model and the RFMScore per product for customer segmentation where product catalogue hierarchies and business criteria are applied to customize the results and adapt them to business needs.

3.2. Steps of Economic and Mathematical Model

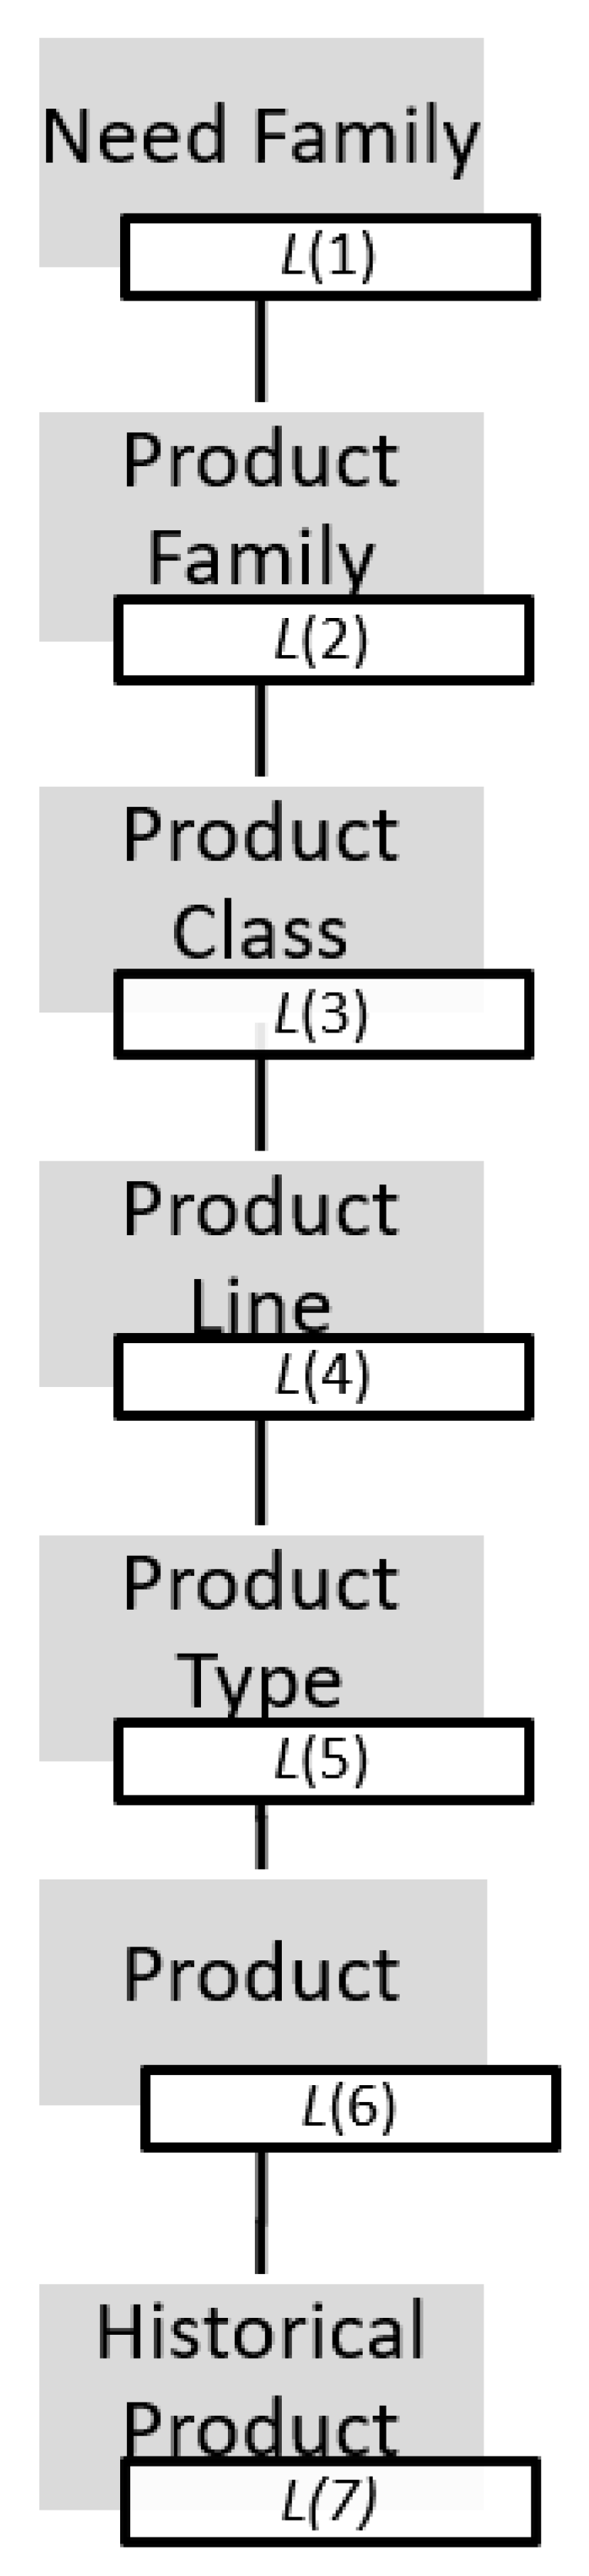
3.2.1. Product Representation: Step 1

Let P = {p1, …, p#P} be a set of a company’s products that can be bought, that are currently in use in the company, and let HP = {hp1, …, hp#HP} be the set of a historical company’s products, i.e., products that are not possible to buy now as they are out of range.
A company’s product portfolio is typically organized into a hierarchy. Therefore, set H = k = 1 # H L k as a product hierarchy, where each L(k) implies a classification of the set P, and the higher the k-level is, the more detailed the classification is. Additionally, each L(k), with k > 1, is subordinate to the L(k − 1).
With this hierarchy, we can represent the usual levels present in the product portfolio Kotler [90], as shown in Figure 4, where L(6) corresponds to the set P and L(7) corresponds to the set HP.
In any retailer, the range of products is continually renewed; each season, products that are no longer manufactured are replaced by others of better quality or adapted to market trends, etc. As our system will use historical databases of customer purchases, all products included in the catalogue are needed, even if they are not currently in use, i.e., included in the set P. For this reason, we include the last level, HP, where all products that have historically existed in the company would be included. To manage this new level, it is necessary that each product of the previous level, P, is also created in the HP level. In addition, each terminated product is related to a current product. In this way, we can use previous purchases of non-current products to profile current customers.
An example of these kinds of products for our retailer, a leader in home decoration, is the desk we can see in Figure 5.
Products from the example perfectly adjust to the product hierarchy representation presented in Figure 4: L(1) = products and furniture for working at home; L(2) = tables and desks; L(3) = computer desks and tables; L(4) = home desks; L(5) = MALM desk with removable top; L(6) = MALM desk with a removable top, white 151 × 65 cm; L(7) = MALM reversible shelf, Artik white and Canadian oak, Duplo model, 120 × 53 × 144 cm.

3.2.2. RFM Based on Product Hierarchy: Step 2

Let U = {u1, …, u#U} be a company’s current customers. In companies that use a relational strategy based on RFM, they often define this set of customers based on past purchases, using a period of analysis that varies according to the type of company. Therefore, customers are included in the analysis if they have made any type of purchase in the defined period.
Similarly, we use a vector model to represent the purchased products. Then, for a customer e, we have a vector, VUe = (VUe1, …, VUe#L(kmax)), where each component VUej represents the purchase’s importance for the products of the corresponding category in L(kmax) for the customer ue. The value Ae represents the global RFMScore for that particular customer. Some authors note the importance of using the amount of the purchases in recommendation systems and highlight that this usefulness also depends on the recency of the purchase (Pradel et al. [91]). Generalizing this idea, we calculate the importance of the purchase based on the fuzzy linguistic 2-tuple RFM model shown in Section 2.2. Therefore, each VUej S × [−0.5, 0.5), where S is defined in Definition 2, which is equivalent to the set S (Figure 2).
With the aim of calculating this vector, we should follow the next sub-steps.

Obtaining the Weights of Each Product

A retail company usually has a product portfolio, i.e., the set P, composed of a variety of products, some of which are of great importance as they can generate customer loyalty, and others that are considered less important. In addition, to calculate the importance of the purchase, as mentioned above, we use three variables: recency, frequency and monetary. Using the example of frequency, for certain products (e.g., a bed), this frequency is not very important as its life cycle is longer, and we do not need to buy beds continuously. However, for others with a very short life cycle (e.g., scented candles), frequency is fundamental. In order to solve these two issues, i.e., the importance of the product within the portfolio and the importance of the RFM variables for these products, we propose to use the AHP introduced in Section 2.2.3. We follow the typical phases of this process.
  • Structuring of the decision problem into a hierarchical model
In order to structure the MCDM, it is necessary to define the available alternatives and the required criteria. The alternatives are the RFM variables: A = {R, F, M}.
The aim is to obtain the importance of each of these variables for each of the products in the catalogue, historical or otherwise, i.e., P and HP. Therefore, the criteria could be the P set of products in use. This would make the problem unmanageable, due to their high number. Fortunately, companies usually have a well-structured product catalogue, as seen in Section 3.1. To define the criteria, we use a portion of the hierarchical portfolio, H, defined in the section.
The value of C = k = 1 k m a x L k , with kmax ∈ {2, …, 5}, indicates the maximum level of detail in the portfolio where the importance of the products, as well as the importance for the evaluation of the RFM variables, can be determined. Figure 6 shows the final hierarchy of the proposed AHP model.
2.
Making pairwise comparison
The marketing experts fill in the different pairwise matrices corresponding to the criteria of the hierarchical model C, expressing the relative importance of some categories over others in order to assess the customers’ purchases. Furthermore, for each of the L(kmax) elements, the importance of each of the alternatives is evaluated, i.e., of the three RFM variables, generating the corresponding pairwise matrices.
3.
Obtaining local weights and consistency of comparisons
In order to ensure the coherence of the given matrices, their CR (Equation (9)) has to be lower than or equal to 0.1. If the CR is not good enough, it will be considered that the business specifications do not meet their quality criteria, i.e., they may contradict each other. Therefore, it is necessary that the pairwise comparison matrices are revised to improve their consistency ratio.
Once the consistency of the matrices has been checked, the weight of each criterion and sub-criterion is calculated. The local weights of the lower level of the criterion (more granular level within the product portfolio chosen in the first step) for each of the RFM alternatives are expressed as follows: wR = (wR1, …, wR#L(kmax)), wF = (wF1, …, wF#L(kmax)) and wM = (wM1, …, wM#L(kmax)). Finally, from these local weights, using the hierarchical structure, we obtain the weights WRFM = {WR, WF, WM}.

Obtaining the Fuzzy Linguistic 2-Tuple RFM Value for Each Customer and Each Product

In this step, we apply the fuzzy linguistic 2-tuple RFM model for each customer and for each of the product categories L(kmax) from which the customer has purchased during the chosen analysis period. Therefore, we follow the step explained in Section 2.2. individually for each historical product obtaining its corresponding category in L(kmax) and the corresponding VUe value, which would give us the global RFMScore for each of the categories of that level. From this vector, we can obtain the value Ae that represents the global RFM value for the client using the WRFM weight matrix by means of the operator Āw (Equation (4)).

3.2.3. Customer Segmentation by 2-Tuple RFM Value per Product: Step 3

The RFMScores per product obtained in 3.2.2 (VUe) are used to define clusters of customers with the same patterns. There are many clustering algorithms for this, but the RFM model works well with the k-means algorithm. The main objective is to obtain k clusters CHP = {CHP1, …, CHPk} with their correspondents k centroids, vs. = (vs1, vs2, …, vs#(Lmax)), which is the s = 1…k, one for each cluster. The values of these centroids could be expressed using the model fuzzy linguistic 2-tuple model; thus, we achieve a better linguistic interpretability.

3.2.4. Strategy by Segment under Business and Product Preferences: Step 4

Once we defined the set of clusters CHP, different strategies should be designed to match business needs with customers’ needs and therefore, customers’ lifecycles will be longer and business will consequently improve.

3.3. Case of the Model Implementation

This work was elaborated with a real transactional dataset from an online and offline retailer, a worldwide leader in home furnishing and decoration.
The dataset contains more than 25 million ticket lines concerning purchases from May 2014 to May 2020.
The most common situation for retailers is to not have access to socio-demographical information about their customers, or in the case they have it, data are usually out of date as no one remembers to update their own data when something changes. Therefore, the only information about customers we used for this investigation was historical transactional data, which will ensure the usefulness of the experiment for other retailers as they will also have the same details. As detailed in Section 3.1, data will be detailed at the L(7) product level, which means that the dataset will include historical products, HP, and current products, P.
Data were analysed using the Knime Analytics Platform, intuitive, low code and open source software for creating data science. Our intention was to help other researchers and business professionals to understand their data and define machine learning models accessible for everyone.
In this work, we solved a real business problem. Business experts were involved to make decisions and ensure the obtained results make sense for real situations.
Following the scheme shown in Figure 3, each step of the scheme is detailed.

3.3.1. Step 1: Product Hierarchy Definition

Retailers have a huge number of products, which are organised into a structure in order to make them manageable. This classifies a company’s products and services by their essential components into a logical structure. The product hierarchy is defined to answer business needs, but customers’ purchasing behaviour does not have to follow that structure.
Observing the definition of the product catalogue made previously, and the example already introduced in Section 3.1, the current catalogue of the company, with its HP and P products, adapts perfectly to the hierarchy’s defined scheme.
To bring to light the products’ hierarchy defined based on customer purchase patterns, we define a new hierarchy, denoted as H, and we carried out a principal component analysis of customer transactional data.
Starting from the customer’s purchase ticket details, we must create a new dataset in which each client will be classified following the new hierarchy, which will be defined by analysing customer behaviour patterns.
In the first step, KMO (Kaiser–Meyer–Olkin) and Bartlett’s (BTS) tests were applied in order to check whether there was a certain redundancy between the variables that can be summarized with a few factors. These new factors define the product hierarchy that is hidden in customer buying patterns. Both tests were calculated by comparing the observed correlation matrix to the identity matrix. The KMO test was associated with the degree of common variance. Bartlett’s test determines whether the correlation matrix is an identity matrix (Ocal et al. [92]; Hair et al. [93]; Ali et al. [94]).
Bartlett’s test resulted in a p-value of 0.0, so we concluded that the correlation matrix between the original product areas is not the identity matrix, and the KMO test resulted in an overall MSA of 0.98, so it was clear that we could reduce the original structure into a new, more manageable one, which will form a new product hierarchy that will reflect the way customers make purchases. Figure 7 shows the new aggregation.
All main furniture areas were strongly correlated with accessories, i.e., when a customer buys a bed and mattress, they also buy accessories, such as pillows, bedlinen and cushions. To differentiate main furniture from these “easy to buy accessories”, it was decided to create an “artificial” dimension only for accessories that are purchased in a very different way, and this was called the impulsive products category.
Critic products include all furniture products with a very long decision journey as they are more expensive, difficult to buy and designed by the client and they imply great trust in the brand. These products create loyal customers as once the customer buys one of these critic products, the brand associated with these products will always be present in the customer’s life.
Reflexive products were an isolated group of products that are important, but not as difficult to purchase as the critic ones.
Evolving products were products related to children. They will change as children grow up.
Seasonal products also became isolated, and this is an interesting category as it will be very useful to generate a sensation of novelty and create traffic to the stores seasonally for all kinds of customers.

3.3.2. Step 2: RFMScore Definition Based on Product Hierarchy

The dataset used in this step contains all the historical purchase information related to 219.199 (#U) customers with more than 25 million ticket lines concerning purchases from May 2014 to May 2020.
As retailers do not usually have socio-demographical information about their customers, they need to find a new way to learn more about their clients to support their business decisions. Figure 8 shows an example of the customer information available on any retailer.
The information available is the customer ID, the date of the purchase, the product identification number and the amount paid for each product that each customer has purchased on each visit.

Step 2.1: Obtaining the RFM Weights for Each Historical Product

To facilitate the understanding of the following sections, we enumerated the different tasks that each one of them encompasses.
  • Structuring the decision problem into a hierarchical model
In Section 4.1, step 1, we proceeded to define a more suitable catalogue H for marketing decisions; these specifications can be carried out only using levels 1 and 2, i.e., kmin = kmax = 2, which indicates that C = L(2) with #L(2) = 5, C = {Critic, Reflexive, Evolving, Seasonal, Impulsive}.
The hierarchical AHP model is shown in Figure 9.
The main objective is to define the importance of each alternative (recency, frequency and monetary) based on the underlying information found on customers’ product purchases.
2.
Making pairwise comparisons
Marketing experts collaborated in this step. Some questionnaires were prepared in order to help them to fulfil the different pairwise matrices corresponding to the criteria of the hierarchical model described in Figure 9. Experts expressed the importance of some categories over others, taking into account what customers have bought but also introducing the preferences of the business into this judgment.
The first pairwise matrix compares the five criteria; Table 3 represents the pairwise matrix.
We can observe how business experts gave more importance to critic products than any other product category. Critic products are very complex products with a long purchase journey; therefore, when a customer acquires them, they will remain engaged with this brand for a long period of time. The second category was reflexive products. The products that are summarized in this category have a simpler purchasing process, and yet they generate many sales for the business in addition to being important to achieve a comfortable bedroom atmosphere. Evolving and impulsive products follow in the level of importance. Evolving products are related to children. Families with children will need, over time, to change furniture and decorations as their children grow up; they are, therefore, a key customer segment for the business as this type will remain linked to the brand longer than any other. Impulsive products are important as they work very well as traffic generators and as products to engage all kind of customers, because they do not need a long purchase decision process and are accessible for everyone. The less important category was seasonal; products belonging to this category are useful for creating a novelty feeling and catalogue refreshment but are smaller in sales that any other category.
After the first pairwise matrix was completed, it was necessary to evaluate all criteria against the three alternatives. Figure 10 shows the pairwise matrices for this process.
It is easy to observe how for critic products, the most important alternative is clearly monetary as they are products that customers purchase only once and spend a large amount of time and money on. Reflexive products involve the same situation but weaker, and evolving products invert the order and are more important for frequency than for recency, monetary always being the most important. Seasonal products have a totally different balance as they are products that appear seasonally in the catalogue. For them, recency is not important, but frequency and monetary have the same weights. Impulsive products, due to their own definition, should have high importance for recency and frequency and low importance for monetary.
3.
Obtaining local weights and consistency of matrix comparisons
Subsequently, all matrices were defined, and their consistency was checked. Table 4 includes the CR for all of our matrices.
Once the consistency was checked, the weight of each criterion and sub-criterion was calculated as we defined in Equation (8).
Table 5 shows the eigenvector of matrix H, which can be understood as the weights for the five different criteria, and also the five eigenvectors for the matrix of critic products vs. R, F and M alternatives; the matrix of reflexive products vs. R, F and M alternatives; the matrix of evolving products vs. R, F and M alternatives; the matrix of seasonal products vs. R, F and M alternatives; and the matrix of impulsive products vs. R, F and M alternatives.
Once we defined the local weights, we were able to calculate the final weights for the R, F and M alternatives by multiplying both tables, therefore we extract the final vector (wR, wF, wM) as shown in Equation (10).
0.18 0.23 0.10 0.08 0.44 0.07 0.12 0.26 0.44 0.44 0.75 0.65 0.64 0.47 0.11 × 0.45 0.15 0.25 0.03 0.13 = 0.204 0.186 0.609
Therefore, wR = 0.204, wF = 0.186 and wM = 0.609. This allowed us to determine the importance of each alternative for this company—approximately 61% for monetary, 19% for frequency and 20% for recency. It is remarkable that these local weights could be changed to adapt to business needs, which transforms this method into an important tool for marketers. With this methodology, companies will be able to adapt their preferences (weights of products) to support business needs following the commercial calendar or marketing actions. This will ensure marketing campaign success. If they have, during a certain period of time, a focus on a particular area, for example, a living room, they will have a tool to reinforce those areas working with the pairwise comparison matrices, changing the weights for each area and consequently each product will inherit the weights from their hierarchy.

Step 2.2: Obtaining the 2-Tuple RFM Value for Each User and Product

These calculations are stored in the following vector for each Ue customer: VUe = (VUe1, …, VUe#P), where VUeiS1 × [−0.5, 0.5) represents the linguistic 2-tuple importance value of the product pi for the customer Ue. If the customer had never purchased that product (during the period), it would have a 0 value or the tuple (VB, 0.0).
Figure 11 shows a sample of customers with fuzzy linguistic 2-tuple RFMScores per product area.
We can see how each customer was classified in terms of their RFMScore per product hierarchy. For example, the first customer (with CustomerID = 0223) is a bad customer with a negative alpha for critic products and very bad in reflexive, evolving, seasonal and impulsive products. The third customer (CustomerID = 00193) is very good in critic, evolving and impulsive products but not in seasonal and reflexive products. Therefore, here we discover a way to keep this customer “alive”, which is offering them the seasonal collections four times per year or to redecorate their bedroom with new small furniture and bed textiles.
The last column of this table includes the global fuzzy linguistic 2-tuple RFMScore per product, which offers a general view of the customer value where the different product areas have been taken into account to define the Ae value. Following our example, we can see how customer “02330” is a bad customer reinforced with a negative alpha value and customer “00193” is a very good one, but as they have VB values in reflexive and seasonal, the A00193 = (VG, −0.054), i.e., they are a very good customer but with a negative alpha, which indicates that they can still improve.

3.3.3. Step 3: Clustering Customers Based on RFMScore for Each Product Hierarchy

Once we classified every customer in terms of fuzzy linguistic 2-tuple RFMScore per product area, i.e., we calculated the VUe vector, we can move to the next step and try to define groups of customers with similar profiles based on these RFMScores. When a customer has a high value in one product hierarchy, this means that they are a very good customer for that aggregation of products; therefore, we will be able to define a customized strategy based on their characteristics. The best way to achieve a global picture of our customers to properly define the correct actions for each one is to launch a segmentation using the RFMScores calculated with product hierarchies and weights defined by business experts.
The first step was to define the optimal number of clusters, which was calculated based on the within-cluster-sum-of-squares (WCSS) method, also taking into account the expert interpretation of customers, so it was decided to take five as the optimal number of clusters. Figure 12 shows the elbow graph where we can see how k = 5 fits perfectly with this decision.
Clustering was performed using the k-means algorithm. Variables used to define customer clusters were the fuzzy linguistic 2-tuple RFMScore per each product hierarchy. Figure 13 shows the radar plot for each cluster.
Once clusters CHP were defined and described, we classified the full customer database in terms of their historical purchases; therefore, we were also able to define other areas with potential for each customer. It is important to remark the fact that all this information was acquired only using the historical purchase database.

3.3.4. Step 4: Strategy by Segment under Business and Product Preferences

At this point, we developed our proposal to be able to improve strategic marketing decisions based on the fuzzy linguistic 2-tuple RFM model per product hierarchy. The linguistic labels offer better interpretability to better understand the data. It is remarkable that local weights defined per product category could be changed to follow business needs, which transforms this method into an important tool for marketers. With this methodology, companies will be able to adapt their preferences (weights of products) to support business needs following the commercial calendar or marketing actions.

4. Discussion

We defined a method that helps retailers better approach their customers by analysing the only data that all of them have: the ticket line details.
As we already mentioned, our model is based on the fuzzy linguistic 2-tuple approach that carries out processes of “computing with words” without a loss of information and offers more accurate linguistic interpretability.
For the sake of seeing the new contributions of this work, we compare the results with the global fuzzy linguistic 2-tuple RFM model presented by Carrasco et al. [36]. Despite not being the focus of our research, we consider it important to show the calculation of the global fuzzy linguistic 2-tuple RFM model with our dataset in order to better understand the contributions of our approach. To facilitate the interpretability of the full process, we indicated each different step of the followed method.

4.1. Global RFMScore Definition

  • Defining recency, frequency and monetary global variables.
We will work again with the same dataset containing all the details of ticket lines per customer.
Figure 14 shows the output table from Knime after calculating the first three variables, the traditional recency, frequency and monetary.
As observed, when we calculated the RFMScore by product hierarchy, the first customer “02330” has bad recency, very low frequency and low monetary value. Customer number “00193” has very good recency, good frequency and monetary value. This customer was classified as very good for critic, evolving and impulsive hierarchies and they were very bad for reflexive and seasonal products. They belonged to CHP4, which has been labelled as “High potential for Reflexive and Seasonal”; therefore, here, we have a tool to engage and develop this customer by offering them seasonal and reflexive products to maintain the customer’s engagement and enlarge their customer lifetime. Working with only ticket details, we were able to develop a tool to better known customers, but we do not know right now how active they are, which means, on top of having good or bad behaviour in terms of product hierarchies, the question that arises is: is this customer active or not?
2.
Obtaining fuzzy linguistic 2-tuple RFM model.
Working with the three variables shown in Figure 14, we were able to calculate the fuzzy RFM model. Figure 15 shows the new variables in terms of fuzzy linguistic 2-tuple.
Again, we can follow our known customers and see how customer “02330” is very bad in recency and frequency and a bad customer in monetary values. Customer “00193” is a good customer with a positive alpha parameter for recency and a very good one for the other categories but with a negative alpha parameter, which means that this customer is very good but still has space to improve.
3.
Calculating the RFMScores and the fuzzy linguistic 2-tuple RFMScore.
In order to be able to aggregate the three fuzzy variables and obtain a unique score for each customer, we can also calculate the fuzzy linguistic 2-tuple RFMScore by assigning weights to each dimension. In this case, experts found it more difficult to find the perfect weight for recency, frequency and monetary as they wanted to increase all three variables, so they decided to balance them, assigning one third for each one, indicating vector W = (1/3, 1/3, 1/3). With no extra information and after working with the possibility to prioritize per product area, it remains difficult for them to rank the three variables. We calculated the RFMScore for each customer as RFMDScore = RScore × 1/3 + FScore × 1/3 + MScore × 1/3, and once we have the RFMScore, we can also translate it into a fuzzy linguistic 2-tuple format. Figure 16 shows our sample of customers with these new variables calculated.
Following our customers used as an example, “02330” is a very bad customer in terms of global 2-tuple RFMScore as they have a 0.1 value for his global RFMScore (which has been standardized into 0–1 values). Additionally, customer “00193”, having a RFMscore of 0.918, has a value of very good with a negative alpha in the 2-tuple format.
4.
Clustering customers based on global RFMScore.
Once we prepared all variables, we can complete the RFMScore and fuzzy linguistic 2-tuple RFMScore with the customer segmentation based on the three variables, fuzzy linguistic 2-tuple recency, frequency and monetary.
Working with business experts, after observing the elbow graph, we decided to define four clusters to segment our customer database. Figure 17 shows the new elbow graph, in this case calculated for the three variables mentioned above.
Clustering was performed using the k-means algorithm. In this case, the variables used to define customer clusters were the fuzzy linguistic 2-tuple recency, frequency and monetary. The process uncovers four clusters called Ci. Figure 18 shows the radar plots for each cluster.
The radar plots effectively describe each cluster. In this case, we only have three variables; we can see in Figure 18a how all variables have very high values, which is why we labelled this cluster as top. Figure 18b shows a group of customers with bad recency but relatively good monetary and frequency value. This cluster has customers that once were good customers, but they are abandoning the brand, which is why we labelled the cluster as churn. Figure 18c shows the cluster where the worse customers are grouped; the three variables have very low values, so we labelled the cluster as worse. Figure 18d shows a group of customers with very good recency but low values for frequency and monetary; these customers seem to be new customers; therefore, they are starting their purchases, and they will improve in time, which is why we labelled this cluster as new.

4.2. Comparing and Enriching Results

The global RFM model offers marketers a good view of customer activity but not information about products. The RFMScore per product hierarchy and the consequent segmentation classifies the customer database into different groups that offer marketers and businesspeople the possibility to push products following the business needs, and consequently, to develop custom strategies adjusted to the customers groups.
As shown in Table 6, the concatenation of both models in the cross table helps to see how coherent the results are. Top customers in terms of products are mainly grouped into top customers in terms of activity (RFM model), which means that the best products create loyal customers with a high level of activity in terms of recency, frequency and monetary. Customers in the group labelled as low in all categories are grouped into worse customers (low recency, low frequency and low monetary) or new customers (good recency but low frequency and monetary). On the other hand, if we focus on the vertical component of the table, we see how customers labelled as churn in terms of RFM are behaving in terms of product hierarchies, and we have a great tool to try to reactivate the most interesting ones.
Finally, Table 7 shows the cross table for the linguistic labels assigned to customers after the calculation of the 2-tuple RFMScore per product hierarchy with the different weights from the AHP model, (60% for monetary, 18% for frequency and 20% for recency), as we defined in 3.3.2.1 and labels assigned to customers coming from the fuzzy global RFMScore were expert assigned 33% for their recency value, 33% for their frequency value and 33% for their monetary value.
Both models are necessary and complement each other. The customer who is VG in terms of product may not be VG in terms of general recency, frequency and monetary and vice versa.
The other result of our work was a very complete customer segmentation that enriched the clusters obtained with the traditional fuzzy linguistic 2-tuple RFM model and offers a clear view of customer preferences and possible actions to define cross and up-selling strategies as well as adapt communication to follow the customer life-cycle.
We detected some limitations to our approach that open interesting areas for future research. The first one is related to the geospatial information that was not included in the model. We suspect that the geolocation of customers may be directly affecting their preferences and shopping patterns. This information was not entered into the model and could be a very interesting area to continue our work. This point becomes especially relevant if we take into account that online sales have opened doors to the world for any small business that wants to sell through the Internet. We also think that the seasonality of the data could also be affecting the results, so exploring the inclusion of seasonality factors could further improve the results of the model. Another possible improvement to our theoretical model could be the generalization to a multi-hierarchical fuzzy 2-tuple model; as Cid-López et al. [95] stated, it will offer a richer interpretation of the result. Other possible ways to improve our findings will be the inclusion of new variables into the model, such as the periodicity or cadence of customer purchases (Peker et al. [50]). It will also be interesting to apply this model to other businesses to enrich results.

5. Conclusions

This work improves the fuzzy linguistic 2-tuple RFM model by including product information in the model to calculate the RFMScore for each of the products that a customer has bought. As the number of references could be huge, we described, thanks to PCA, the product hierarchy defined by customers during their purchases. The AHP method, with the support of business experts, helped us to define the different weights of each RFMScore per product category, obtaining a more complete approach to customer preferences and customer value.
The fuzzy linguistic 2-tuple RFM model adapted by the product hierarchy was revealed as a useful tool for including the business criteria, product catalogues and customer insights on the definition of commercial strategies. It is remarkable that the local weights defined per product category could be changed to follow business needs, which transforms this method into an important tool for marketers. With this methodology, companies will be able to adapt their preferences (weights of products) to support the business needs following the commercial calendar or marketing actions.
The concatenation of the global fuzzy linguistic 2-tuple RFM model with the new fuzzy linguistic 2-tuple RFM model per product hierarchy offers a more effective customer segmentation that enriches the results offered by each model separately.
As a consequence of this approach, retailers will be able to combine the two different perspectives, the customer-centric, by applying the global fuzzy linguistic 2-tuple RFM model, and the product-centric one, thanks to the fuzzy linguistic 2-tuple RFM model per product hierarchy.
Something important to remark is that, if we want to know customer preferences, we need to work with all historical products, current or out-of-the-range, related to each customer. The out-of-range products are necessary to better profile each customer, but if we need to use the insights extracted from this analysis to recommend a product to a customer, we should recommend only products that are currently “alive”. Here, some retailers may have a problem if they have not saved their sales history or if they are not able to identify each ticket to each customer. Bear in mind that analysing anonymous tickets is not the same as being able to associate each purchase with the customer who has made it over time.
One difficulty encountered in the development of the empirical model was the big need of business knowledge to define the structure and weights of the hierarchical model. The joint work of business experts and researchers was necessary for the correct interpretation and definition of the hierarchies.
The proposed theoretical model has been implemented using R and Python languages embedded in nodes of Knime 4.3.2. This has allowed us to verify their results on a practical and not just theoretical level. Everything is open source to help other researchers and professionals to apply our contribution.

Author Contributions

Conceptualization, R.G.M. and R.A.C.; methodology, R.G.M. and R.A.C.; software, R.G.M.; validation, R.G.M.; R.A.C.; C.S.-F. and D.G.; formal analysis, R.G.M. and R.A.C.; investigation, R.G.M.; R.A.C. and C.S.-F.; resources, R.G.M. data curation, R.G.M. and C.S.-F.; writing—original draft preparation, R.G.M. and R.A.C.; writing—review and editing, R.G.M.; R.A.C.; C.S.-F.; visualization, R.G.M. and C.S.-F.; supervision, R.A.C.; project administration, R.G.M. and R.A.C.; funding acquisition, D.G. All authors have read and agreed to the published version of the manuscript.

Funding

The APC was funded by Complutense University of Madrid, Department of Management and Marketing, Faculty of Economics and Business.

Institutional Review Board Statement

Not applicable.

Informed Consent Statement

Not applicable.

Data Availability Statement

Not applicable.

Conflicts of Interest

The authors declare no conflict of interest.

References

  1. Wedel, M.; Kannan, P.K. Marketing Analytics for Data-Rich Environments. J. Mark. 2016, 80, 97–121. [Google Scholar] [CrossRef]
  2. Maechler, N.; Neher, K.; Park, R. From touchpoints to journeys: Seeing the world as customers do. McKinsey Q. 2016, 2, 2–10. [Google Scholar]
  3. Said, E.; Macdonald, E.K.; Wilson, H.N.; Marcos, J. How organizations generate and use customer insight. J. Mark. Manag. 2015, 31, 1158–1179. [Google Scholar] [CrossRef] [Green Version]
  4. Moorman, C. Top Ten Results from the CMO Survey—August 2019. Available online: https://tinyurl.com/yx75qt3f (accessed on 21 December 2019).
  5. Ransbotham, S.; Kiron, D.; Prentice, P.K. Minding the analytics gap. MIT Sloan Manag. Rev. 2015, 56, 63–68. [Google Scholar]
  6. Bresciani, S.; Ferraris, A.; Del Giudice, M. The management of organizational ambidexterity through alliances in a new context of analysis: Internet of Things (IoT) smart city projects. Technol. Forecast. Soc. Chang. 2018, 136, 331–338. [Google Scholar] [CrossRef]
  7. Scuotto, V.; Arrigo, E.; Candelo, E.; Nicotra, M. Ambidextrous innovation orientation effected by the digital transformation. Bus. Process Manag. J. 2019, 26, 1121–1140. [Google Scholar] [CrossRef]
  8. Taiminen, H.M.; Karjaluoto, H. The usage of digital marketing channels in SMEs. J. Small Bus. Enterp. Dev. 2015, 22, 633–651. [Google Scholar] [CrossRef]
  9. Verhoef, P.C.; Broekhuizen, T.; Bart, Y.; Bhattacharya, A.; Dong, J.Q.; Fabian, N.; Haenlein, M. Digital transformation: A multidisciplinary reflection and research agenda. J. Bus. Res. 2021, 122, 889–901. [Google Scholar] [CrossRef]
  10. Matarazzo, M.; Penco, L.; Profumo, G.; Quaglia, R. Digital transformation and customer value creation in Made in Italy SMEs: A dynamic capabilities perspective. J. Bus. Res. 2021, 123, 642–656. [Google Scholar] [CrossRef]
  11. Kartajaya, H.; Setiawan, I.; Kotler, P. Marketing 4.0. LID Editorial. 2018. Available online: https://www.ucentral.edu.co/sites/default/files/inline-files/WP03_Lavirtualidad_zapata_Web.pdf (accessed on 1 June 2021).
  12. Liu, D.Y.; Chen, S.W.; Chou, T.C. Resource fit in digital transformation lessons learned from the CBC Bank global e-banking ptoject. Manag. Decis. 2011, 49, 1728–1742. [Google Scholar] [CrossRef]
  13. Chen, I.J.; Popovich, K. Understanding customer relationship management (CRM). Bus. Process Manag. J. 2003, 9, 672–688. [Google Scholar] [CrossRef] [Green Version]
  14. Kuchinka, D.G.J.; Balazs, S.; Gavriletea, M.D.; Djokic, B.-B. Consumer Attitudes toward Sustainable Development and Risk to Brand Loyalty. Sustainability 2018, 10, 997. [Google Scholar] [CrossRef] [Green Version]
  15. Sirgy, M.J. Self-congruity theory in consumer behavior: A little history. J. Glob. Sch. Mark. Sci. 2018, 28, 197–207. [Google Scholar] [CrossRef]
  16. Yuan, X.; Li, D.; Mohapatra, D.; Elhoseny, M. Automatic removal of complex shadows from indoor videos using transfer learning and dynamic thresholding. Comput. Electr. Eng. 2018, 70, 813–825. [Google Scholar] [CrossRef]
  17. Eger, L.; Komárková, L.; Egerová, D.; Mičík, M. The effect of COVID-19 on consumer shopping behaviour: Generational cohort perspective. J. Retail. Consum. Serv. 2021, 61, 102542. [Google Scholar] [CrossRef]
  18. Rahman, I.; Reynolds, D. The influence of values and attitudes on green consumer behavior: A conceptual model of green hotel patronage. Int. J. Hosp. Tour. Adm. 2017, 20, 47–74. [Google Scholar] [CrossRef]
  19. Hughes, A.M. Strategic Database Marketing; Probus Publishing Company: Chicago, IL, USA, 1994. [Google Scholar]
  20. Bult, J.R.; Wansbeek, T. Optimal Selection for Direct Mail. Mark. Sci. 1995, 14, 378–394. [Google Scholar] [CrossRef]
  21. Yeh, I.-C.; Yang, K.-J.; Ting, T.-M. Knowledge discovery on RFM model using Bernoulli sequence. Expert Syst. Appl. 2009, 36, 5866–5871. [Google Scholar] [CrossRef]
  22. Gupta, S.; Hanssens, D.; Hardie, B.; Kahn, W.; Kumar, V.; Lin, N.; Ravishanker, N.; Sriram, S. Modeling customer lifetime value. J. Service Res. 2006, 9, 139–155. [Google Scholar] [CrossRef]
  23. Kumar, V.; Reinartz, W. Creating Enduring Customer Value. J. Mark. 2016, 80, 36–68. [Google Scholar] [CrossRef]
  24. Heldt, R.; Silveira, C.S.; Luce, F.B. Predicting customer value per product: From RFM to RFM/P. J. Bus. Res. 2021, 127, 444–453. [Google Scholar] [CrossRef]
  25. Moghaddam, S.Q.; Abdolvand, N.; Harandi, S.R. A RFMV model and customer segmentation based on variety of products. Inf. Syst. Telecommun. 2017, 5, 155. [Google Scholar]
  26. Virvilaitė, R.; Saladienė, V. Models investigation of factors affecting consumer impulsive purchase behaviour in retail envi-ronment. Econ. Manag. 2012, 17, 664–670. [Google Scholar] [CrossRef] [Green Version]
  27. Chen, T. Impulse purchase varied by products and marketing channels. J. Int. Manag. Stud. 2008, 3, 154–161. [Google Scholar]
  28. Chang, H.-C.; Tsai, H.-P. Group RFM analysis as a novel framework to discover better customer consumption behavior. Expert Syst. Appl. 2011, 38, 14499–14513. [Google Scholar] [CrossRef]
  29. Bitran, G.R.; Mondschein, S.V. Mailing Decisions in the Catalog Sales Industry. Manag. Sci. 1996, 42, 1364–1381. [Google Scholar] [CrossRef]
  30. Miglautsch, J.R. Thoughts on RFM scoring. J. Database Mark. Cust. Strat. Manag. 2000, 8, 67–72. [Google Scholar] [CrossRef]
  31. Chang, E.-C.; Huang, S.-C.; Wu, H.-H. Using K-means method and spectral clustering technique in an outfitter’s value analysis. Qual. Quant. 2009, 44, 807–815. [Google Scholar] [CrossRef]
  32. Miglautsch, J.R. Application of RFM principles: What to do with 1-1-1 customers? J. Database Mark. 2002, 9, 319–324. [Google Scholar] [CrossRef] [Green Version]
  33. Lumsden, S.-A.; Beldona, S.; Morrison, A.M. Customer Value in an All-Inclusive Travel Vacation Club: An Application of the RFM Framework. J. Hosp. Leis. Mark. 2008, 16, 270–285. [Google Scholar] [CrossRef]
  34. Wei, J.T.; Lin, S.Y.; Wu, H.H. A review of the application of RFM model. Afr. J. Bus. Manag. 2010, 4, 4199–4206. [Google Scholar]
  35. Ernawati, E.; Baharin, S.S.K.; Kasmin, F. A review of data mining methods in RFM-based customer segmentation. J. Phys. Conf. Ser. 2021, 1869, 012085. [Google Scholar] [CrossRef]
  36. Carrasco, R.A.; Blasco, F.; Herrera-Viedma, E. A 2-tuple Fuzzy Linguistic RFM Model and Its Implementation. Procedia Comput. Sci. 2015, 55, 1340–1347. [Google Scholar] [CrossRef] [Green Version]
  37. Carrasco, R.A.; Blasco, M.F.; García-Madariaga, J.; Herrera-Viedma, E. A Fuzzy Linguistic RFM Model Applied to Campaign Management. Int. J. Interact. Multimed. Artif. Intell. 2019, 5, 21. [Google Scholar] [CrossRef] [Green Version]
  38. Martínez, R.G.; Carrasco, R.A.; Garcia-Madariaga, J.; Gallego, C.P.; Herrera-Viedma, E. A comparison between Fuzzy Linguistic RFM Model and traditional RFM model applied to Campaign Management. Case study of retail business. Procedia Comput. Sci. 2019, 162, 281–289. [Google Scholar] [CrossRef]
  39. Kumar, V. Customer Lifetime Value: The Path to Profitability; Now Publishers Inc.: Norwell, MA, USA, 2008. [Google Scholar]
  40. Fader, P. Customer Centricity: Focus on the Right Customers for Strategic Advantage; Wharton Digital Press: Philadelphia, PA, USA, 2020. [Google Scholar]
  41. Bolton, R. A Dynamic Model of the Duration of the Customer’s Relationship with a Continuous Service Provider: The Role of Satisfaction. Mark. Sci. 1998, 17, 45–65. [Google Scholar] [CrossRef] [Green Version]
  42. Baesens, B.; Viaene, S.; Poel, D.V.D.; Vanthienen, J.; Dedene, G. Bayesian neural network learning for repeat purchase modelling in direct marketing. Eur. J. Oper. Res. 2002, 138, 191–211. [Google Scholar] [CrossRef] [Green Version]
  43. Malthouse, E.C. Scoring Models. In Kellogg on Integrated Marketing; Iacobucci, D., Calder, B., Eds.; John Wiley & Sons, Inc.: Hoboken, NJ, USA, 2003; pp. 227–249. [Google Scholar]
  44. Berry, M.J.; Linoff, G.S. Data Mining Techniques, 2nd ed.; Wiley Publishing, Inc.: Indianapolis, IN, USA, 2004. [Google Scholar]
  45. Malthouse, E.C.; Blattberg, R.C. Can we predict customer lifetime value? J. Interact. Mark. 2005, 19, 2–16. [Google Scholar] [CrossRef] [Green Version]
  46. Rud, O.P. Data Mining Cookbook: Modeling Data for Marketing, Risk, and Customer Relationship Management; John Wiley & Sons: Hoboken, NJ, USA, 2001. [Google Scholar]
  47. Zhang, Y.; Bradlow, E.T.; Small, D.S. Predicting Customer Value Using Clumpiness: From RFM to RFMC. Mark. Sci. 2015, 34, 195–208. [Google Scholar] [CrossRef] [Green Version]
  48. Wong, E.; Wei, Y. Customer online shopping experience data analytics: Integrated customer segmentation and customised services prediction model. Int. J. Retail Distrib. Manag. 2018, 46, 406–420. [Google Scholar] [CrossRef]
  49. Dursun, A.; Caber, M. Using data mining techniques for profiling profitable hotel customers: An application of RFM analysis. Tour. Manag. Perspect. 2016, 18, 153–160. [Google Scholar] [CrossRef]
  50. Peker, S.; Kocyigit, A.; Eren, P.E. LRFMP model for customer segmentation in the grocery retail industry: A case study. Mark. Intell. Plan. 2017, 35, 544–559. [Google Scholar] [CrossRef]
  51. Hamdi, K.; Zamiri, A. Identifying and segmenting customers of pasargad insurance company through RFM model (RFM). Int. Bus. Manag. 2016, 10, 4209–4214. [Google Scholar]
  52. Weng, C.-H. Knowledge discovery of digital library subscription by RFC itemsets. Electron. Libr. 2016, 34, 772–788. [Google Scholar] [CrossRef]
  53. He, X.; Li, C. The Research and Application of Customer Segmentation on E-Commerce Websites. In Proceedings of the 2016 6th International Conference on Digital Home (ICDH), Guangzhou, China, 2–4 December 2016; pp. 203–208. [Google Scholar] [CrossRef]
  54. Rezaeinia, S.M.; Rahmani, R. Recommender system based on customer segmentation (RSCS). Kybernetes 2016, 45, 946–961. [Google Scholar] [CrossRef]
  55. Marisa, F.; Ahmad, S.S.S.; Yusof, Z.I.M.; Fachrudin, F.; Akhriza, T.M. Segmentation Model of Customer Lifetime Value in Small and Medium Enterprise (SMEs) using K-Means Clustering and LRFM Model. Int. J. Integr. Eng. 2019, 11. [Google Scholar] [CrossRef]
  56. Patel, Y.S.; Agrawal, D.; Josyula, L.S. The RFM-based ubiquitous framework for secure and efficient banking. In Proceedings of the 2016 International Conference on Innovation and Challenges in Cyber Security (ICICCS-INBUSH), Greater Noida, India, 3–5 February 2016; pp. 283–288. [Google Scholar]
  57. Hosseini, Z.Z.; Mohammadzadeh, M. Knowledge discovery from patients’ behavior via clustering-classification algorithms based on weighted eRFM and CLV model: An empirical study in public health care services. Iran. J. Pharm. Res. 2016, 15, 355. [Google Scholar]
  58. Dachyar, M.; Esperanca, F.M.; Nurcahyo, R. Loyalty Improvement of Indonesian Local Brand Fashion Customer Based on Customer Lifetime Value (CLV) Segmentation. IOP Conf. Ser. Mater. Sci. Eng. 2019, 598, 012116. [Google Scholar] [CrossRef] [Green Version]
  59. Monalisa, S.; Nadya, P.; Novita, R. Analysis for Customer Lifetime Value Categorization with RFM Model. Procedia Comput. Sci. 2019, 161, 834–840. [Google Scholar] [CrossRef]
  60. Maćkiewicz, A.; Ratajczak, W. Principal components analysis (PCA). Comput. Geosci. 1993, 19, 303–342. [Google Scholar] [CrossRef]
  61. Karamizadeh, S.; Abdullah, S.M.; Manaf, A.A.; Zamani, M.; Hooman, A. An overview of principal component analysis. J. Signal Inf. Process. 2013, 4, 173. [Google Scholar] [CrossRef] [Green Version]
  62. Abdi, H.; Williams, L.J. Principal component analysis. Wiley Interdiscip. Rev. Comput. Stat. 2010, 2, 433–459. [Google Scholar] [CrossRef]
  63. Paul, L.C.; Suman, A.A.; Sultan, N. Methodological analysis of principal component analysis (PCA) method. Int. J. Comput. Eng. Manag. 2013, 16, 32–38. [Google Scholar]
  64. Bryant, F.B.; Yarnold, P.R. Principal-Components Analysis and Exploratory and Confirmatory Factor Analysis; American Psychological Association: Washington, DC, USA, 1995. [Google Scholar]
  65. Suh, E.; Noh, K.; Suh, C. Customer list segmentation using the combined response model. Expert Syst. Appl. 1999, 17, 89–97. [Google Scholar] [CrossRef]
  66. Kaymak, U. Fuzzy target selection using RFM variables. In Proceedings of the Joint 9th IFSA World Congress and 20th NAFIPS Interna-tional Conference (Cat. No. 01TH8569), Vancouver, BC, Canada, 25–28 July 2001; pp. 1038–1043. [Google Scholar]
  67. Hsieh, N.C. An integrated data mining and behavioural scoring model for analysing bank customers. Expert Syst. Appl. 2004, 27, 623–633. [Google Scholar] [CrossRef]
  68. Tsai, C.-Y.; Chiu, C.-C. A purchase-based market segmentation methodology. Expert Syst. Appl. 2004, 27, 265–276. [Google Scholar] [CrossRef]
  69. Buckinx, W.; Poel, D.V.D. Customer base analysis: Partial defection of behaviourally loyal clients in a non-contractual FMCG retail setting. Eur. J. Oper. Res. 2005, 164, 252–268. [Google Scholar] [CrossRef]
  70. Coussement, K.; Poel, D.V.D. Improving customer attrition prediction by integrating emotions from client/company interaction emails and evaluating multiple classifiers. Expert Syst. Appl. 2009, 36, 6127–6134. [Google Scholar] [CrossRef]
  71. Chen, Y.L.; Kuo, M.H.; Wu, S.Y.; Tang, K. Discovering recency, frequency, and monetary (RFM) sequential patterns from customers’ purchasing data. Electron. Commer. Res. Appl. 2009, 8, 241–251. [Google Scholar] [CrossRef]
  72. Hosseini, S.M.S.; Maleki, A.; Gholamian, M.R. Cluster analysis using data mining approach to develop CRM methodology to assess the customer loyalty. Expert Syst. Appl. 2010, 37, 5259–5264. [Google Scholar] [CrossRef]
  73. Li, Y.-M.; Lin, C.-H.; Lai, C.-Y. Identifying influential reviewers for word-of-mouth marketing. Electron. Commer. Res. Appl. 2010, 9, 294–304. [Google Scholar] [CrossRef]
  74. Sekhavat, Y.A.; Fathian, M.; Gholamian, M.R.; Alizadeh, S. Mining important association rules based on the RFMD tech-nique. Int. J. Data Anal. Tech. Strateg. 2010, 2, 1–21. [Google Scholar] [CrossRef]
  75. Albadvi, A.; Norouzi, A.; Sepehri, M.M.; Amin Naseri, M.R. An Integrated Pareto/NBD-fuzzy weighted RFM model for customer segmentation in non-contractual setting. J. Bus. Manag. 2014, 6, 417–440. [Google Scholar]
  76. Güçdemir, H.; Selim, H. Integrating multi-criteria decision making and clustering for business customer segmentation. Ind. Manag. Data Syst. 2015, 115, 1022–1040. [Google Scholar] [CrossRef]
  77. Song, M.; Zhao, X.E.H.; Ou, Z. Statistic-based CRM approach via time series segmenting RFM on large scale data. In Proceedings of the 9th International Conference on Utility and Cloud Computing, Shanghai, China, 6–9 December 2016; pp. 282–291. [Google Scholar]
  78. Li, H.; Yang, X.; Xia, Y.; Zheng, L.; Yang, G.; Lv, P. K-LRFMD: Method of customer value segmentation in shared trans-portation filed based on improved K-means algorithm. J. Phys. Conf. Ser. 2018, 1060, 012012. [Google Scholar] [CrossRef] [Green Version]
  79. Hajmohamad, M.M.; Rahimi, N.; Sasanizadeh, B. PRFM Model Developed for the Separation of Enterprise Customers Based on the Distribution Companies of Various Goods and Services. J. Syst. Manag. 2021, 6, 77–99. [Google Scholar] [CrossRef]
  80. Hwang, S.; Lee, Y. Identifying customer priority for new products in target marketing: Using RFM model and TexRank. Marketing 2021, 17, 125–136. [Google Scholar]
  81. Chen, Q.; Huang, M. Rough fuzzy model based feature discretization in intelligent data preprocess. J. Cloud Comput. 2021, 10, 1–13. [Google Scholar] [CrossRef]
  82. Bueno, I.; Carrasco, R.A.; Porcel, C.; Kou, G.; Herrera-Viedma, E. A linguistic multi-criteria decision making methodology for the evaluation of tourist services considering customer opinion value. Appl. Soft Comput. 2021, 101, 107045. [Google Scholar] [CrossRef]
  83. Herrera, F.; Martinez, L. A model based on linguistic 2-tuples for dealing with multigranular hierarchical linguistic contexts in multi-expert decision-making. IEEE Trans. Syst. Man Cybern. Part B 2001, 31, 227–234. [Google Scholar] [CrossRef] [Green Version]
  84. Herrera, F.; Herrera-Viedma, E. Aggregation operators for linguistic weighted information. IEEE Trans. Syst. Man Cybern. Part A Syst. Hum. 1997, 27, 646–656. [Google Scholar] [CrossRef] [Green Version]
  85. Porcel, C.; Tejeda-Lorente, A.; Martínez, M.A.; Herrera-Viedma, E. A hybrid recommender system for the selective dis-semination of research resources in a technology transfer office. Inf. Sci. 2012, 184, 1–19. [Google Scholar] [CrossRef]
  86. Cheng, C.-H.; Chen, Y.-S. Classifying the segmentation of customer value via RFM model and RS theory. Expert Syst. Appl. 2009, 36, 4176–4184. [Google Scholar] [CrossRef]
  87. Chen, D.; Sain, S.L.; Guo, K. Data mining for the online retail industry: A case study of RFM model-based customer seg-mentation using data mining. J. Database Mark. Cust. Strategy Manag. 2012, 19, 197–208. [Google Scholar] [CrossRef]
  88. Liu, D.-R.; Shih, Y.-Y. Integrating AHP and data mining for product recommendation based on customer lifetime value. Inf. Manag. 2005, 42, 387–400. [Google Scholar] [CrossRef]
  89. Saaty, T.L. Decision making with the analytic hierarchy process. Int. J. Serv. Sci. 2008, 1, 83. [Google Scholar] [CrossRef] [Green Version]
  90. Kotler, P.T. Marketing Management; Pearson Education: London, UK, 2019. [Google Scholar]
  91. Pradel, B.; Sean, S.; Delporte, J.; Guérif, S.; Rouveirol, C.; Usunier, N.; Dufau-Joel, F. A case study in a recommender system based on purchase data. In Proceedings of the 17th ACM SIGKDD International Conference on Knowledge Discovery and Data Mining, San Diego, CA, USA, 21–24 August 2011; pp. 377–385. [Google Scholar]
  92. Öcal, M.E.; Oral, E.L.; Erdis, E.; Vural, G. Industry financial ratios—Application of factor analysis in Turkish construction industry. Build. Environ. 2007, 42, 385–392. [Google Scholar] [CrossRef]
  93. Hair, J.F.; Anderson, R.E.; Babin, B.J.; Black, W.C. Multivariate Data Analysis: A Global Perspective; Pearson Education: London, UK, 2010. [Google Scholar]
  94. Ali, S.B.; Mahdi, A.; Malihe, J. The effect of employees’ performance appraisal procedure on their intrinsic motivation. Int. J. Acad. Res. Bus. Soc. Sci. 2012, 2, 161. [Google Scholar]
  95. Cid-López, A.; Hornos, M.J.; Carrasco, R.A.; Herrera-Viedma E y Chiclana, F. Linguistic model of multi-criteria decision making with expressive richness output variable. Expert Syst. Appl. 2017, 83, 350–362. [Google Scholar] [CrossRef] [Green Version]
Figure 1. Timeline of RFM model’s main improvements of the RFM model.
Mathematics 09 01836 g001
Figure 2. A set of five linguistic terms and their semantics.
Mathematics 09 01836 g002
Figure 3. Overview of our proposed model.
Mathematics 09 01836 g003
Figure 4. Product hierarchy, adapted from (Kotler, [90]).
Mathematics 09 01836 g004
Figure 5. (a) Example of a product out of the range and (b) the current product which can be related to (a).
Mathematics 09 01836 g005
Figure 6. AHP hierarchy.
Mathematics 09 01836 g006
Figure 7. New product hierarchy H.
Mathematics 09 01836 g007
Figure 8. Example of data in an operational database from a retailer.
Mathematics 09 01836 g008
Figure 9. AHP model.
Mathematics 09 01836 g009
Figure 10. Pairwise matrices for each criterion vs. each alternative: (a) comparisons of R, F and M regarding critic products, and we can observe how for critic products, M > R > F; (b) comparisons of reflexive products, and here, M > R > F; (c) comparisons of evolving products, where experts said that M > F > R; (d) in seasonal products M ≥ F > R; and (e) impulsive products with F = R > M.
Mathematics 09 01836 g010
Figure 11. Output table from Knime. Sample of customers with their fuzzy linguistic 2-tuple RFMScore per product hierarchy (VUe) and the global RFMScore (Ae).
Mathematics 09 01836 g011
Figure 12. Elbow graph to decide the optimal number of clusters.
Mathematics 09 01836 g012
Figure 13. Radar plots per cluster CHP.
Mathematics 09 01836 g013
Figure 14. Output table from Knime. Sample of customers with their RFM variables.
Mathematics 09 01836 g014
Figure 15. Output table from Knime. Sample of customers with their RFM variables and fuzzy linguistic 2-tuple recency, frequency and monetary attributes.
Mathematics 09 01836 g015
Figure 16. Output table from Knime. Sample of customers with global RFMScore and global fuzzy linguistic 2-tuple RFMScore.
Mathematics 09 01836 g016
Figure 17. Elbow graph to decide the optimal number of clusters.
Mathematics 09 01836 g017
Figure 18. Radar plots per cluster.
Mathematics 09 01836 g018aMathematics 09 01836 g018b
Table 1. Saaty’s scale (Saaty [89]).
Intensity of ImportanceDefinitionExplanation
1Equal importanceTwo activities contribute equally to the objective
2Weak or slight
3Moderate importanceExperience and judgement slightly favour one activity over another
4Moderate plus
5Strong importanceExperience and judgement strongly favour one activity over another
6Strong plus
7Very strong or demonstratedAn activity is favoured very strongly over another; its dominance is demons
importancetrated in practice
8Very, very strong
9Extreme importanceThe evidence favouring one activity over another is of the highest possible order of affirmation
Reciprocals of Above If activity i has one of the above non-zero numbers assigned to it when compared with activity j, then j has the reciprocal value when compared with i.
1.1–1.9If the activities are very closeIt may be difficult to assign the best value, but when compared with other contrasting activities, the size of the small numbers would not be too noticeable, however, they can still indicate the relative importance of the activities.
Table 2. Random consistency index by Saaty [89].
n12345678910
Random consistency index (R.I.)000.580.91.121.241.321.411.451.49
Table 3. Pairwise matrix H comparing the five product dimensions.
CRITICREFLEXIVEEVOLVINGSEASONALIMPULSIVE
CRITIC14393
REFLEXIVE1/411/382
EVOLVING1/33192
SEASONAL1/91/81/911/9
IMPULSIVE1/31/21/291
Table 4. Consistency ratio for all pairwise matrices.
Matrix HMatrix CRITICMatrix REFLEXIVEMatrix EVOLVINGMatrix SEASONALMatrix ACCESSORIES
Consistency Ratio0.0890.0300.0040.0370.0040.000
<0.1<0.05<0.05<0.05<0.05<0.05
Table 5. Local weights from comparison matrices.
Matrix H Matrix CRITICMatrix REFLEXIVEMatrix EVOLVINGMatrix SEASONALMatrix ACCESSORIES
wCRITIC0.45wR0.180.230.100.080.44
wREFLEXIVE0.15wF0.070.120.260.440.44
wEVOLVING0.25wM0.750.650.640.470.11
wSEASONAL0.03
wIMPULSIVE0.13
Table 6. Cross table to enrich 2-tuple RFMScore per product hierarchy cluster with the global fuzzy RFM clusters.
Global Fuzzy Linguistic 2-Tuple RFM Clusters
Fuzzy linguistic 2-tuple RFMScore per product
hierarchy clusters
WORSENEWCHURNTOPTotal%CRITICREFLEXIVEEVOLVINGSEASONALIMPULSIVE
TOP ALL BUT NOT
REFLEXIVE
55464566961883%
TOP ALL BUT NO
SEASONAL
521354500622,59729,00913%
LOW IN ALL CATEGORIES55,06418,70611,02275085,54239%
GROWTH POTENTIAL515013,19020,112873047,18222%
HIGH POTENTIAL FOR
REFLEXIVE AND SEASONAL
465719415,15628,46351,27823%
Total60,73140,49951,76066,209219,199100%
Table 7. Cross tables for linguistic labels of fuzzy RFMScore per product vs. fuzzy global RFMScore in a net amount and percentage.
Linguistic Labels for Global RFMScoreLinguistic Labels for Global RFMScore
VBBNGVGTotal VBBNGVGTotal
Linguistic labels for RFMScore per product hierarchyVB23,8623538 27,400Linguistic labels for RFMScore per product hierarchyVB87%6% 13%
B353844,07571843 54,800B13%80%13%0% 25%
N 714840,2427409 54,799N 13%73%14% 25%
G 39737343,577381154,800G 0%13%80%14%25%
VG 381123,58927,400VG 0%7%86%13%
Total27,40054,80054,79954,80027,400219,199 Total100%100%100%100%100%100%
Publisher’s Note: MDPI stays neutral with regard to jurisdictional claims in published maps and institutional affiliations.

