Article

Development and Validation of a Post-Earthquake Safety Assessment System for High-Rise Buildings Using Acceleration Measurements

by
Koji Tsuchimoto
1,*,
Yasutaka Narazaki
2 and
Billie F. Spencer, Jr.
1
1
Department of Civil and Environmental Engineering, University of Illinois at Urbana-Champaign, Urbana, IL 61801, USA
2
Zhejiang University—University of Illinois at Urbana-Champaign Institute, Zhejiang University, Haining 314400, China
*
Author to whom correspondence should be addressed.
Mathematics 2021, 9(15), 1758; https://doi.org/10.3390/math9151758
Submission received: 20 June 2021 / Revised: 20 July 2021 / Accepted: 22 July 2021 / Published: 26 July 2021

Abstract

:
After a major seismic event, structural safety inspections by qualified experts are required prior to reoccupying a building and resuming operation. Such manual inspections are generally performed by teams of two or more experts and are time consuming, labor intensive, subjective in nature, and potentially put the lives of the inspectors in danger. The authors reported previously on the system for a rapid post-earthquake safety assessment of buildings using sparse acceleration data. The proposed framework was demonstrated using simulation of a five-story steel building modeled with three-dimensional nonlinear analysis subjected to historical earthquakes. The results confirmed the potential of the proposed approach for rapid safety evaluation of buildings after seismic events. However, experimental validation on large-scale structures is required prior to field implementation. Moreover, an extension to the assessment of high-rise buildings, such as those commonly used for residences and offices in modern cities, is needed. To this end, a 1/3-scale 18-story experimental steel building tested on the shaking table at E-Defense in Japan is considered. The importance of online model updating of the linear building model used to calculate the Damage Sensitive Features (DSFs) during the operation is also discussed. Experimental results confirm the efficacy of the proposed approach for rapid post-earthquake safety evaluation for high-rise buildings. Finally, a cost-benefit analysis with respect to the number of sensors used is presented.

1. Introduction

Many of the largest cities in the world lie in regions of high seismicity, the concentration of people, infrastructure, and assets creates high potential for social and economic disruption. For example, the 2011 Great East Japan Earthquake hit Tohoku region, causing severe damage to many buildings, as well as to other civil infrastructure systems. The earthquake also affected the Tokyo Metropolitan area (about 400 km away from the epicenter), where many high-rise buildings swayed for an extended period [1]. More than 5 million people were stranded and unable to return home on the day of the earthquake, due to the limited operation of the transportation network [2]. As a result, the Tokyo government established guidelines to ensure that citizens have a safe shelter in the aftermath of a significant earthquake [3]. Nonetheless, issues still remain, in that determining whether a building can withstand aftershocks can be challenging. In addition, the 2016 Kumamoto earthquake which hit the central Kyushu area was comprised of two intense earthquakes within 28 h [4]. Some structures that survived the first earthquake collapsed by the second earthquake, due to the damage caused by the first earthquake. Loss of human life could have been reduced if the damage state of buildings had been assessed quickly and occupants notified after the first earthquake. These experiences illustrate the crucial need for a system that can evaluate the safety of structures rapidly after a seismic event and direct evacuation of occupants if safety issues are identified.
The evaluation by experts is currently performed to assess buildings in the affected area after an earthquake. In the United States, the Applied Technology Council (ATC) published a field manual for post-earthquake building inspection, which categorizes a building into three safety levels: Inspected, restricted use, and unsafe [5]. After the assessment of a building, experts complete assessment forms and subsequently place placards on the buildings indicating the results of the inspection. In Japan, a similar inspection process is carried out by experts based on a manual issued by The Japan Building Disaster Prevention Association [6]. Japan currently has 110,375 certified experts who can inspect damaged structures [7], while the Tokyo Metropolitan government reported that Tokyo has more than 1.9 million buildings [8]. Should a major seismic event occur be inflicted on Tokyo, the number of experts is clearly insufficient to affect the timely safety assessment of many buildings. Recognizing the need to accelerate the inspection process, the Department of Building Inspection in the City and County of San Francisco, in cooperation with the Structural Engineers Association of Northern California (SEAONC), developed the Building Occupancy Resumption Program (BORP) to enable building owners to pre-certify private post-earthquake inspection of their buildings by qualified experts [9]. Regardless of who carries out the inspections, they are labor intensive and time consuming, potentially placing the lives of the inspectors at risk.
Structural Health Monitoring (SHM) offers important tools to evaluate the state of a structure after seismic events. For example, researchers have proposed approaches for detecting damaged structures in an affected area after natural disaster using satellite imagery at the city-scale [10,11,12,13]. The developed tools reported therein, combined with the capabilities derived from the Geographic Information System (GIS), can make quick comparisons of images of the affected areas before and after catastrophic events to find collapsed or partially collapsed structures. This approach is effective for rapidly assessing the situation at a regional level but does not provide adequate information to assess whether a building can be reoccupied.
Other researchers have proposed the use of measured accelerations to estimate the maximum interstory drift angle that can be used to rapidly assess a building’s safety. For example, Xu et al. [14] presented a method to estimate the maximum interstory drift angle for a Multi-Degree-of-Freedom (MDOF) shear structure using a single accelerometer. The numerical example showed good performance, however, the analysis evaluation of the model was linear and differences in the responses between the as-built structure and the numerical shear structure were not considered. Tsuchimoto et al. [15] proposed an approach applying Convolutional Neural Networks (CNNs) to sparse acceleration measurement data to infer the maximum interstory drift angle, based on which the building’s safety was estimated. The proposed approach was validated for a nonlinear model of a five-story steel building and suggested as a tool for making decisions regarding building re-occupancy. However, experimental validation on large-scale structures is required prior to this approach being accepted by practitioners for field implementation. Additionally, the approach should be extended to the assessment of high-rise buildings, such as those commonly used for residences and offices in modern cities.
To bridge the gap between the prototype diagnostic system developed previously [15] and a realizable system that is effective for large-scale high-rise buildings, accurate characterization of the as-built structure is crucial. In structural engineering, parametric model updating has been investigated actively, where unknown or uncertain parameters (e.g., mass, stiffness, and damping ratio) of a mathematical model are estimated based on the measurement data [16]. Approaches that seek optimal parameters by maximizing a goodness-of-fit function have been extended to Bayesian model updating methods that incorporate measurements with different degrees of uncertainty with the prior knowledge about the structure (e.g., initial parameters of the mathematical model) [17,18,19]. In particular, Yuen, Beck, and Katafygiotis [20] have proposed an efficient Bayesian model updating approach using incomplete modal measurement data. When the goal is to predict the structural response accurately, a more general class of (non-parametric) system identification algorithms, such as Eigensystem Realization Algorithm, System Realization using Information Matrix and Multi-input, multi-output Frequency Domain Identification (MFDID) (e.g., [21,22,23,24]), allow for the development of models that can represent accurately the dynamic response of structures subject to seismic excitation.
With a focus on enabling field implementation, this paper proposes an approach for rapid post-earthquake safety assessment of tall buildings using sparse accelerations. To this end, a 1/3-scale 18-story experimental steel building tested on the shaking table at E-Defense in Japan [25] is considered. Following a brief overview of previous work, an approach is proposed for model updating of the linear building model, using nonparametric system identification, which is important for the calculation of Damage Sensitive Features (DSFs) during the operation. Subsequently, experimental validation is performed using data from a shaking-table test of a 1/3-scale 18-story experimental steel building. A CNN is trained to estimate the maximum interstory drift angle based on the measured ground excitation and accelerations at selected floors, which is then used to classify the building into one of three categories, “safe”, “restricted use”, and “unsafe”. This study shows that online model updating of the linear building model is essential to ensure the accuracy of the approach. Finally, a cost-benefit analysis is performed in terms of both initial costs and ongoing maintenance. These results demonstrate the efficacy of the proposed framework for rapid safety assessment of as-built structures after seismic events. The contribution of this research is the development and validation of an effective approach for rapid post-earthquake safety assessment that is feasible in the field environment. Steps are designed to incorporate the available information before and after the installation to reduce the effect of modeling errors. The cost-benefit assessment also provides insight into the economic feasibility of the proposed system.

2. Post-Earthquake Safety Assessment of Buildings

This section discusses the proposed post-earthquake safety assessment approach for high-rise buildings. The approach is based on previous work by the authors [15], which is summarized first for the reader’s convenience. Subsequently, the process of system identification, model calibration, and online model updating, which are required for full-scale implementation, are described in detail.

2.1. Rapid Safety Assessment Using Convolutional Neural Networks

The building safety assessment after earthquakes can be performed by investigating the change of structural properties before and after the events. Researchers have reported that the Interstory Drift Angle (IDA) is a valid indicator of structures’ safety [26,27]. Many destructive tests (i.e., horizontal cyclic test) of materials (e.g., reinforced concrete, steel, and wood/timber) have been conducted to identify structural performance/conditions, based on the hysteresis behavior observed in the form of force-interstory drift (or angle) curves [28]. Design codes for buildings (e.g., American Society of Civil Engineers (ASCE) 7–10 [29]) state that all structures shall conform to an allowable interstory drift and drift angle for each risk category. These experiments and design codes provided a rationale for estimating the maximum interstory drift and drift angle to assess the conditions of buildings rapidly after earthquakes. For the proposed system, the maximum IDA is selected as the damage index, DI, i.e., [15]:
D I = max j { max t ( θ j ( t ) ) }
where θ j ( t ) = d j ( t ) / h j is the time history of interstory drift angle, d j ( t ) is the time history of interstory drift, and h j is the story height of the jth floor.
After estimation of the maximum IDA, three categories were proposed for safety classification: (i) Safe, (ii) restricted use, and (iii) unsafe. Safe indicates that a detailed inspection is not required, and the structure is immediately habitable. Unsafe implies that the structure is uninhabitable and immediate evacuation is required. Restricted use is between safe and unsafe, where the structure is still habitable, but a detailed inspection is recommended. Safety classification using maximum IDA can be defined using data from past disasters. The Japan Structural Consultant Association (JSCA) has developed a performance-based design code that can evaluate building performance against lateral forces (e.g., earthquake, wind) to ensure the integrity of building structures [30,31]. Seismic performance can be categorized based on structural types (e.g., reinforced concrete, steel, etc.) and the type of seismic frame system (e.g., moment frame, brace, Reinforced Concrete (RC) wall, etc.). Table 1 and Table 2 describe the relationship between maximum IDA and building condition of RC and steel moment frame structure.
Based on these two studies, the safety classification for steel moment frame structure was proposed as follows: (i) Safe, if the maximum IDA is less than 0.5%; (ii) restricted use, if the maximum IDA is greater than 0.5% and less than 1.0%; and (iii) unsafe, if the maximum IDA is greater than 1.0%. The safety classification for this purpose can be stated in terms of the proposed damage index, DI, as:
(1)
Safe: 0 D I 0.005 ;
(2)
Restricted use: 0.005 < D I 0.01 ; ;
(3)
Unsafe: D I > 0.01 .
Direct measurement of the IDA is not easy in many cases, requiring special sensors (e.g., making-off plate attached with stiff needle, laser). To address this problem, researchers have proposed that a damage sensitive feature can indicate the presence of structural damage based on the measured response [32]. The DSF proposed by the authors [15] for building structures is given by differencing the measured accelerations and the acceleration predicted by a linear numerical model of the building model as follows:
D S F i ( t ) = Δ x ¨ i ( t ) = x ¨ i , measured ( t ) x ¨ i , linear ( t )
where x ¨ i , measured ( t ) is the ith measured acceleration and x ¨ i , linear ( t ) is the corresponding ith story acceleration derived from the linear numerical model. Previous work by the authors revealed a strong correlation between this DSF, when used in conjunction with the input ground excitation, and earthquake damage.
The CNN is employed to discover the complex relationship between DSFs and the maximum IDA. The input to the CNN is: (i) Measured ground acceleration, and (ii) DSFs at the selected floors calculated by Equation (2). The CNN requires training data to estimate the maximum IDA from various kinds of ground excitation. Since a large amount of training data from full-scale damaged buildings is not readily available, a 3D nonlinear analysis model is created from design drawings and building investigations (for existing buildings) to represent an as-built structure. Next, simplified linear and nonlinear models are developed by matching pushover analysis results with those of the 3D model. These simplified models are used to create training data efficiently.
Monte Carlo simulation is employed to generate training data, which consist of input data (ground motion and DSFs) and output data (maximum IDA). The following uncertainties are considered in the ground motion: (i) Different maximum acceleration, (ii) different response acceleration spectrum, (iii) different damping coefficient due to soil layers, and (iv) different time duration of peak location. For the simplified nonlinear analysis model, the following uncertainties are considered: (i) Different stiffnesses after yielding and (ii) different yielding points. More details concerning this approach to the post-earthquake safety assessment can be found in [15].

2.2. Parametric Model Updating

When the proposed approach for post-earthquake safety assessment is applied to the high-rise buildings, the simplified model should represent the 3D model accurately. Otherwise, the CNNs trained by a dataset generated using the simplified model will not perform well. However, for high-rise buildings, creating simplified models that accurately predict the building response is not straightforward. To address this problem, this research applies parametric model updating for initial model calibration.
The model calibration is based on the Bayesian Model Updating (BMU) approach [20]. The goal of the BMU in this research is to update each stiffness parameter of the simplified linear model, so that the natural periods and mode shapes match between the model and the reference data. The BMU starts with parameterizing the stiffness matrix by the linear combination of M sub-matrices:
K = i = 1 M θ i K i
where K i is a part of the stiffness matrix that depends on ith story stiffness, K i , and θ i is a scaling factor optimized by the BMU method ( θ i initially starts from 1.0).
This method updates scale parameters, θ = [ θ 1 ,   θ 2 , ] T , natural frequencies, ω = [ ω 1 ,   ω 2 , ] T , and mode shapes, ϕ = [ ϕ 1 T ,   ϕ 2 T , ] T , using the reference natural frequencies, ω ^ = [ ω ^ 1 ,   ω ^ 2 , ] T , and mode shapes, ψ ^ = [ ψ ^ T 1 ,   ψ ^ T 2 , ] T . The following variables are defined:
e i = ( ω i 2 M + K ) ϕ i
ϵ = [ ω ^ ω ψ ^ Γ ϕ ]
ν = θ θ 0
where Γ selects the Degrees-of-Freedom (DOFs) where the reference mode shapes are available, and θ 0 is the initial condition of the scale parameters (i.e., the vector of ones).
The method assumes e i ,   ϵ ,   ν are Gaussian random variables, and alternately updates ω , ϕ , and θ , so that the log-likelihood of the observed variables are maximized. This method is effective for matching both natural frequencies and mode shapes for the reference data. Example results applying the method to the 18-story shear building model described in the next section are shown in Figure 1.
Model calibration discussed in this section is adopted for the training data generation and the CNN training for post-earthquake safety assessment. This step enhances the consistency of the generated data with the actual structural behavior. Model calibration based on this parametric model updating can be applied when (i) the system is initially installed, using the modal information from the 3D model as reference and (ii) the entire system needs to be updated, using the measurement of modal information after completion of building.

2.3. Online Model Updating

The structural properties of typical buildings will change slowly over the course of time, requiring the linear model to be updated in real time. When an earthquake occurs, the linear response in Equation (2) is calculated using the updated model, based on which the DSFs are obtained. Nonparametric system identification techniques for online model updating are broadly classified into two categories: Frequency domain methods (e.g., [33,34]) and time domain methods (e.g., [35,36]). For cases when both input and output data are available, as in this research, Kim et al. [37] presented a frequency domain method for Multi-Input and Multi-Output (MIMO) systems that fit a rational polynomial transfer function to the measured Frequency Response Function (FRF) by the Maximum Likelihood Approach (MFDID). Juang [38] proposed a time domain method known as Eigen System Realization using the Information Matrix (SRIM) to identify the state-space model of the structure. This approach is an extension of the Eigensystem Realization Algorithm (ERA)/DC method [39], which fits a state-space model directly to the time-history data using correlation matrices. The order of the state-space model and the modal selection are performed automatically by observing the singular values and the modal quality index termed Extended Modal Assurance Criteria of the Observability Matrix (EMACO). Since this approach can identify a model of the structure automatically, subsequent sections use the SRIM method to obtain the up-to-date representation of the linear structural properties.

3. Experimental Validation

This section discusses the experimental validation of the proposed rapid safety evaluation approach using a 1/3-scale 18-story steel building that was tested at E-Defense in Japan [25]. First, a summary of the shaking table tests of this building are provided. Then, a 3D analysis model is developed, from which linear and nonlinear simplified 18-DOF analysis models are derived. The parameters of the simplified models are initialized using the results of the pushover analysis of the 3D model and each stiffness of the floor is calibrated with the 3D analysis model using parametric model updating (the BMU method) to match the first three natural periods and mode shapes. The differences in responses of the simplified linear and nonlinear analysis models are explored to demonstrate the efficacy of DSFs. Training data for the CNN is produced by Monte Carlo simulation applied to the simplified linear and nonlinear analysis models. Initial evaluation of the CNN is conducted using the simplified nonlinear model subjected to new ground motions that were not considered during training of the CNN. A confusion matrix is used to evaluate the accuracy of the proposed approach for safety evaluation. Finally, the proposed approach is validated using the results of the destructive experimental tests conducted at E-Defense.

3.1. Summary of Shaking Table Test for a 1/3-Scale Building

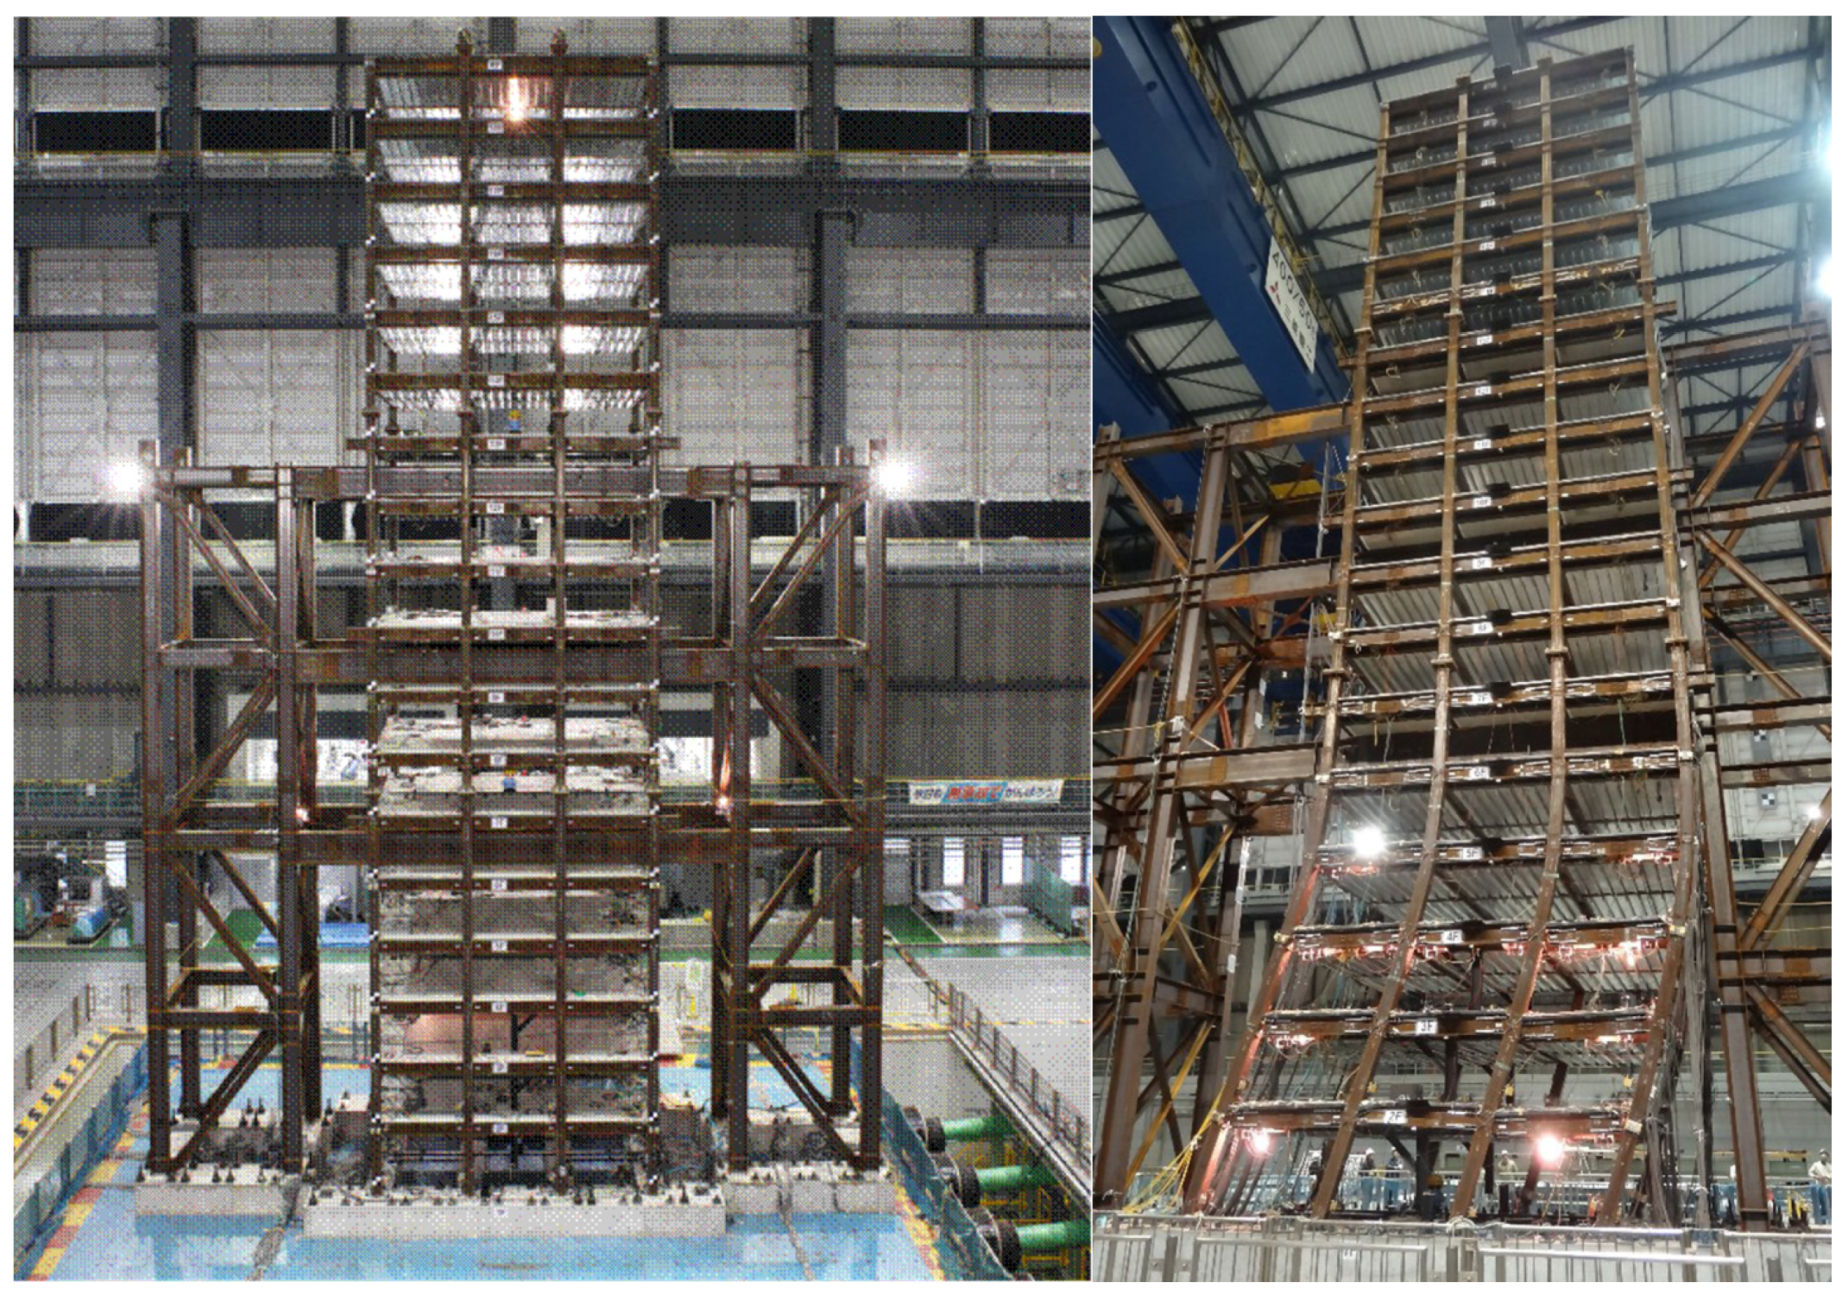
A 1/3-scale 18-story steel building was tested at E-Defense in Japan [25], with the goal of understanding the process of collapse under earthquakes which were not considered in the design stage, as well as to measure the capacity of buildings designed by the Japanese building code. The target structure is a high-rise office building made of steel typically found in Japan (see Figure 2). The floor has a rectangular plan of 6 m (2 m × 3 spans) width and 5 m (5 m × 1 span) length in perpendicular direction. The floor height is 1.35 m, except 1.7 m for the first floor, with a 0.7 m reinforced concrete foundation, and the total building height is 25.35 m (see Figure 3). The total weight of the structure is 4179 kN. The structural frames are designed to be simple steel moment frames. Box columns and I-beams support the vertical and horizontal loads. The steel grade of these components is SM490A, which has nominal strength of 325 MPa and tensile strength of 490 MPa. The steel columns are welded to the steel ground beams, which are embedded in the reinforced concrete foundation. The reinforced concrete foundation is then anchored to the shaking table with steel tendons. Following the design practice, the beams are designed to yield prior to the columns. Three-axial servo-type accelerometers (TOKYO SOKUSHIN, AS-3357) with a sampling frequency of 200 Hz were installed to all the floors to measure the acceleration during the tests.
The input random excitation was created to represent a long-period earthquake based on the Nankai Trough as the epicenter. Its maximum acceleration is 420 cm/s2 with the duration time of 460 s. Its response pseudo-velocity spectrum has a constant value of 110 cm/s from 0.8 s to 10 s. This structure was subjected to this created input random excitation in a single direction (y-direction in Figure 3). The magnitude of input random excitation was gradually increased from approximately 40% of maximum velocity (pSv = 40 cm/s) until the structure collapsed (Figure 2). The excitations and damage states of the structure are summarized in Table 3. In this study, small-to-moderate earthquakes are targeted due to the importance in safety assessment near the boundary between “safe” and “restricted use”. On the other hand, “unsafe” structures with severe damage can be easily determined by external inspection (e.g., crack of external wall, residual yielding). Therefore, the following seven cases are chosen from experimental results (Table 3) for validation of the proposed framework.

3.2. Modeling of an 18-Story Building

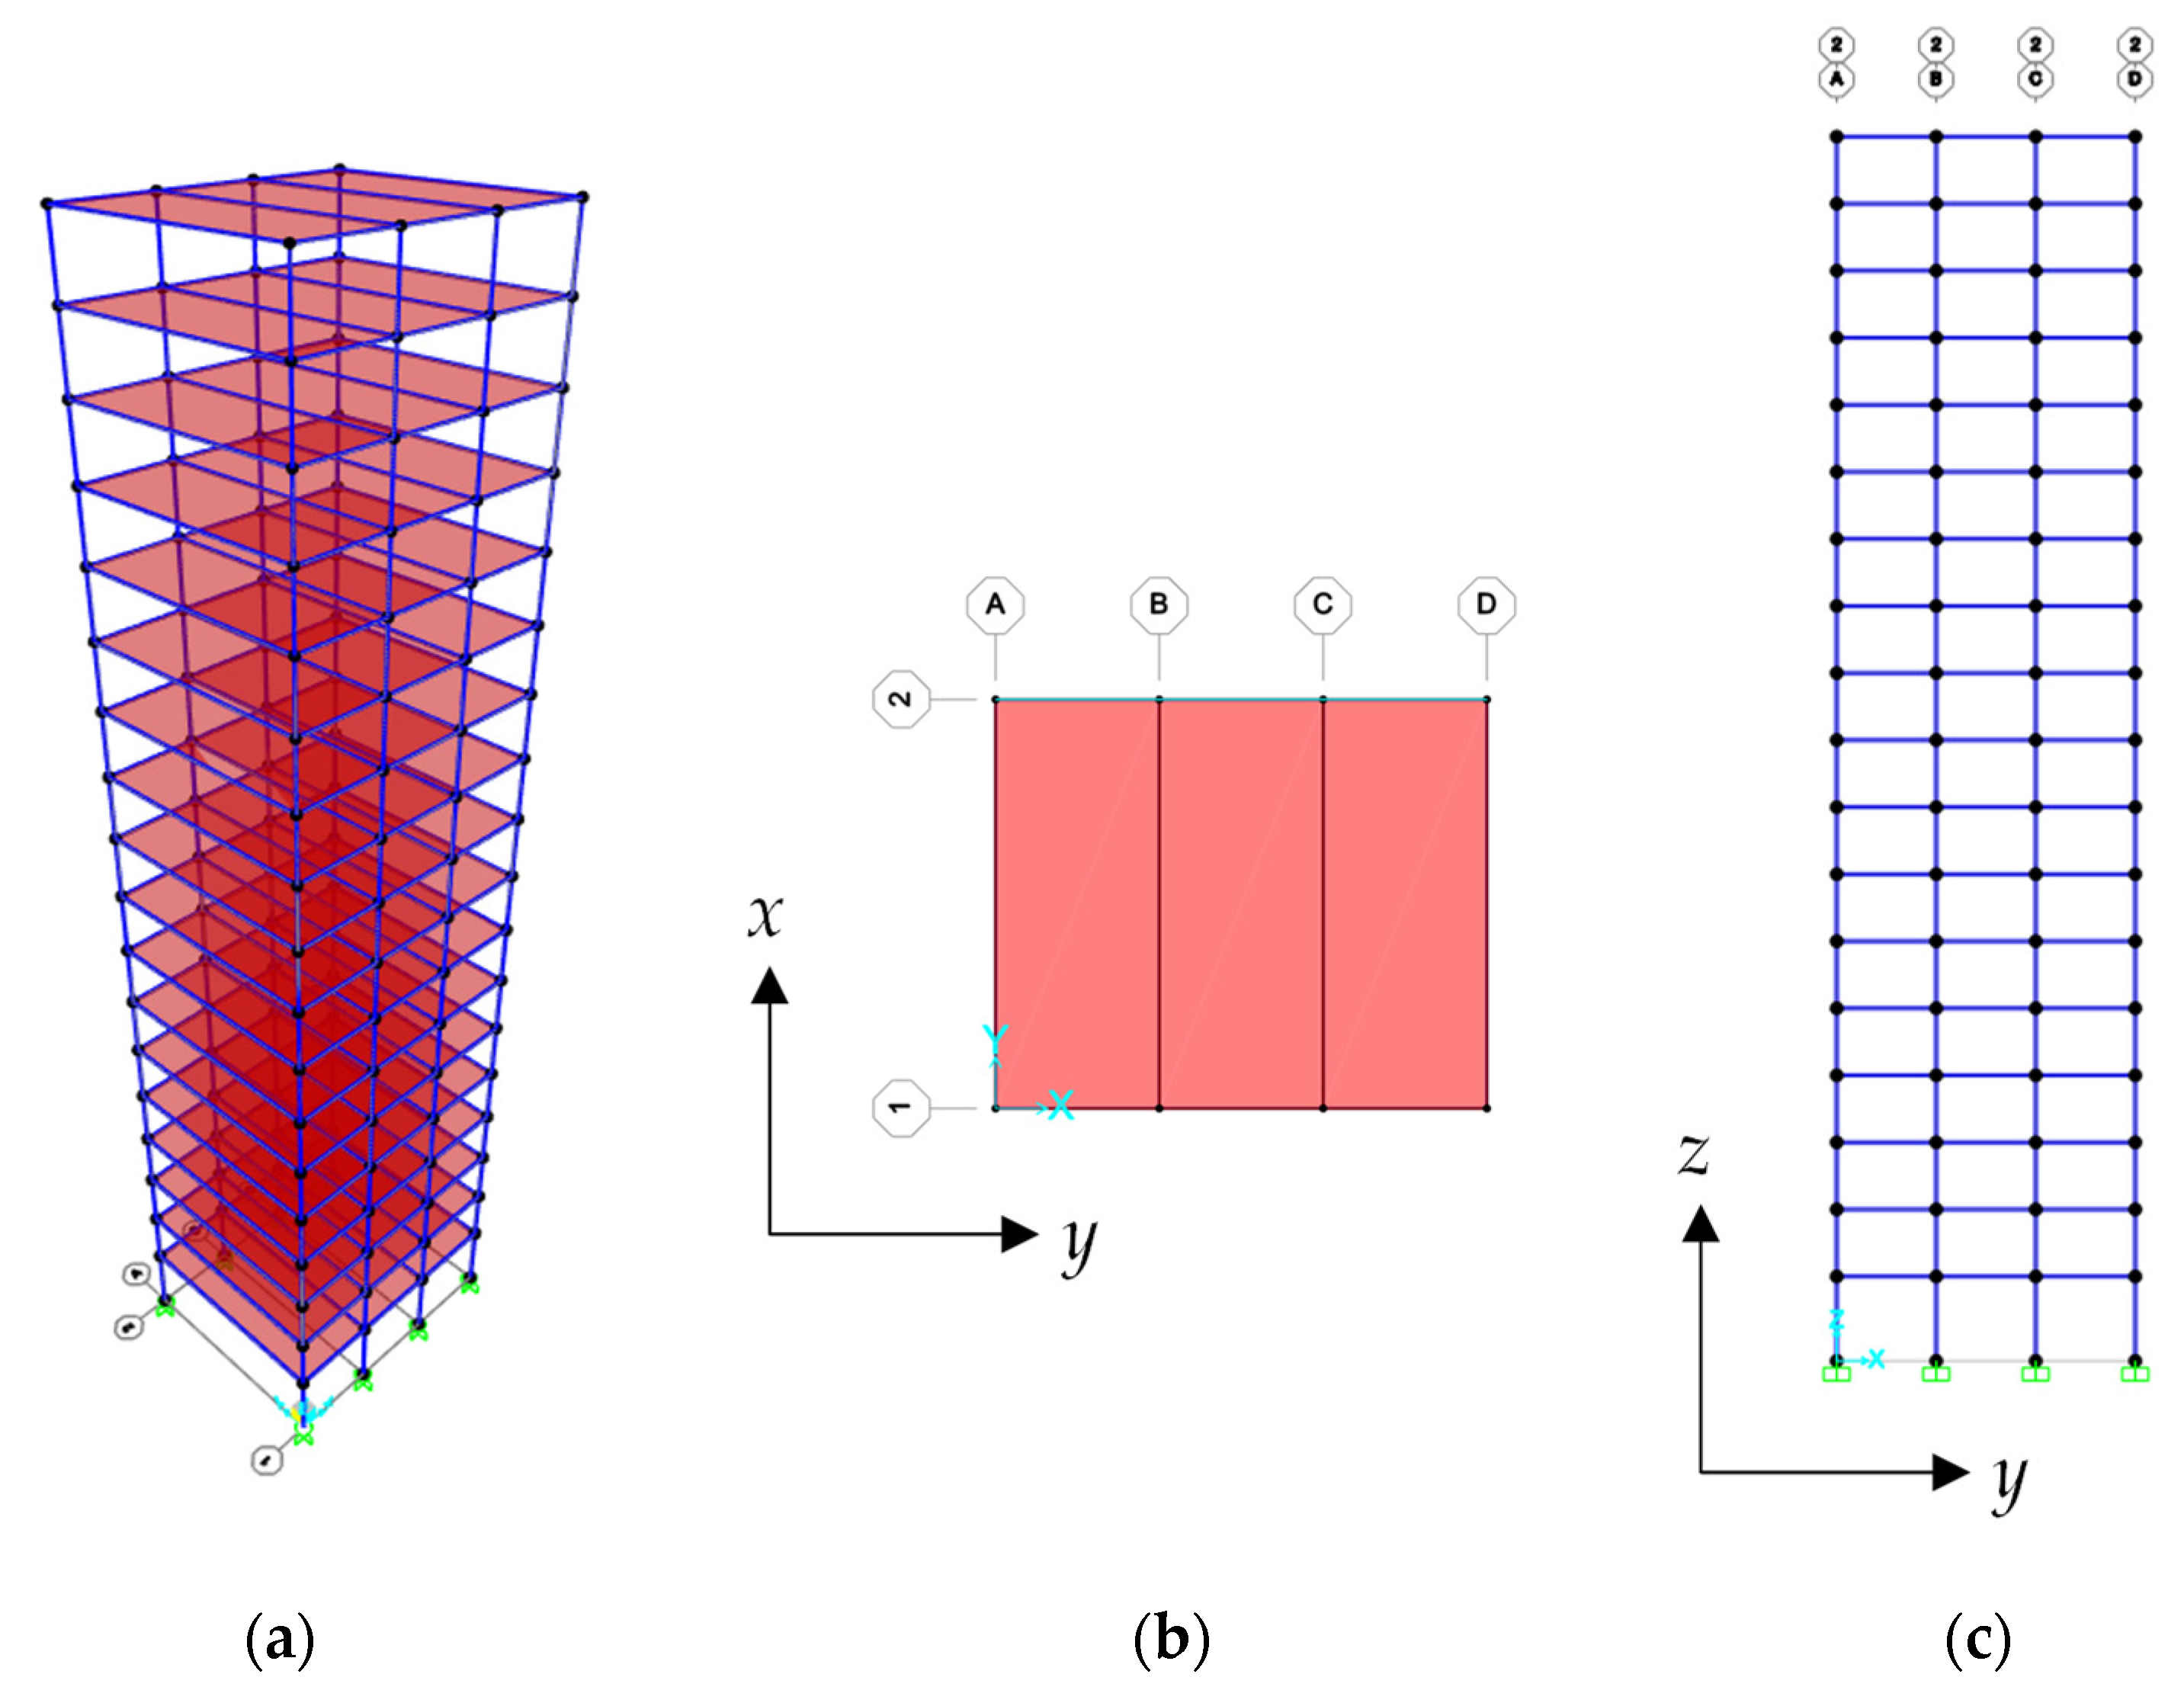
A 3D nonlinear analysis model is developed in SAP2000 (Figure 4, [40]) based on a 1/3-scale steel building with a fix-base condition. The following basic concepts of the 3D analysis model are considered: Columns with axial, bending, and shear deformation, beams with bending and shear deformation. Beams and columns are modeled as nonlinear frame elements with lumped plasticity at both ends, representing plastic hinges. The plastic hinges follow a bilinear restoring force model, as described in FEMA-356 [41]. Beams are assigned as M3 (subjected to strong axis bending moment) hinges. On the other hand, columns are attributed to P-M2-M3 (subjected to axial force and both axes) hinges due to the interaction of axial force and bending moment. All of the floors are assumed rigid. Modal damping ratios are set to 1%, consistent with the reported values for the similar high-rise steel building [42]. Pushover analysis, which is a static and nonlinear procedure in which the magnitude of the loading or deflection is incrementally increased in accordance with a certain lateral load pattern <reference>, is then conducted to obtain the initial stiffness of each story and the nonlinear performance of the structure (i.e., hysteresis loops for the restoring force and interstory drift angle).

3.3. Simplified Analysis Models

A large amount of training data is needed to train the CNN effectively. Due to the computational expense of running the 3D nonlinear analysis, the simplified linear and nonlinear shear analysis models are developed to enable the efficient generation of training data. The DSFs during seismic events are calculated using the “measured” response from the nonlinear model, as well as the “predicted” response from the linear analysis model. To represent the nonlinear structural response, the Bouc-Wen hysteresis model [43,44,45] is employed.
The pushover analysis results from the 3D analysis model are initially used to determine the parameters of the linear and nonlinear models. Then, the initial stiffness is calibrated to match with natural periods and mode shapes derived from the 3D analysis model. The Bayesian Model Updating (BMU) method [20] is applied to determine each optimal stiffness arrangement ([ k 1 ,   k 2 ,   ,   k 18 ]) to match both first three natural periods and mode shapes. The equation governing the interstory hysteretic restoring force is given by the Bouc-Wen model as follows:
F i = α i k i d i + ( 1 α i ) k i d y i z i
z ˙ i = 1 d y i { γ i | d ˙ i | | z i | n i 1 z i β i d ˙ i | z i | n i + A i d ˙ i }
where F i is the restoring force due to the stiffness of the ith story, k i is the elastic stiffness of the ith story, d i is the interstory drift of the ith floor, and d y i is a parameter controlling the deformation of the story when the yielding begins, α i is the ratio of the post- to pre-yield stiffness. A i , γ i , and β i are the shape coefficients of the ith hysteresis loop, and n i governs the associated smoothness of the transition part from elastic to plastic response.
The parameters for the Bouc-Wen hysteresis curves are obtained by trial-and-error so as to correspond with the pushover curve derived from the 3D analysis model. The parameters for both the linear and nonlinear models are listed in Table 4.
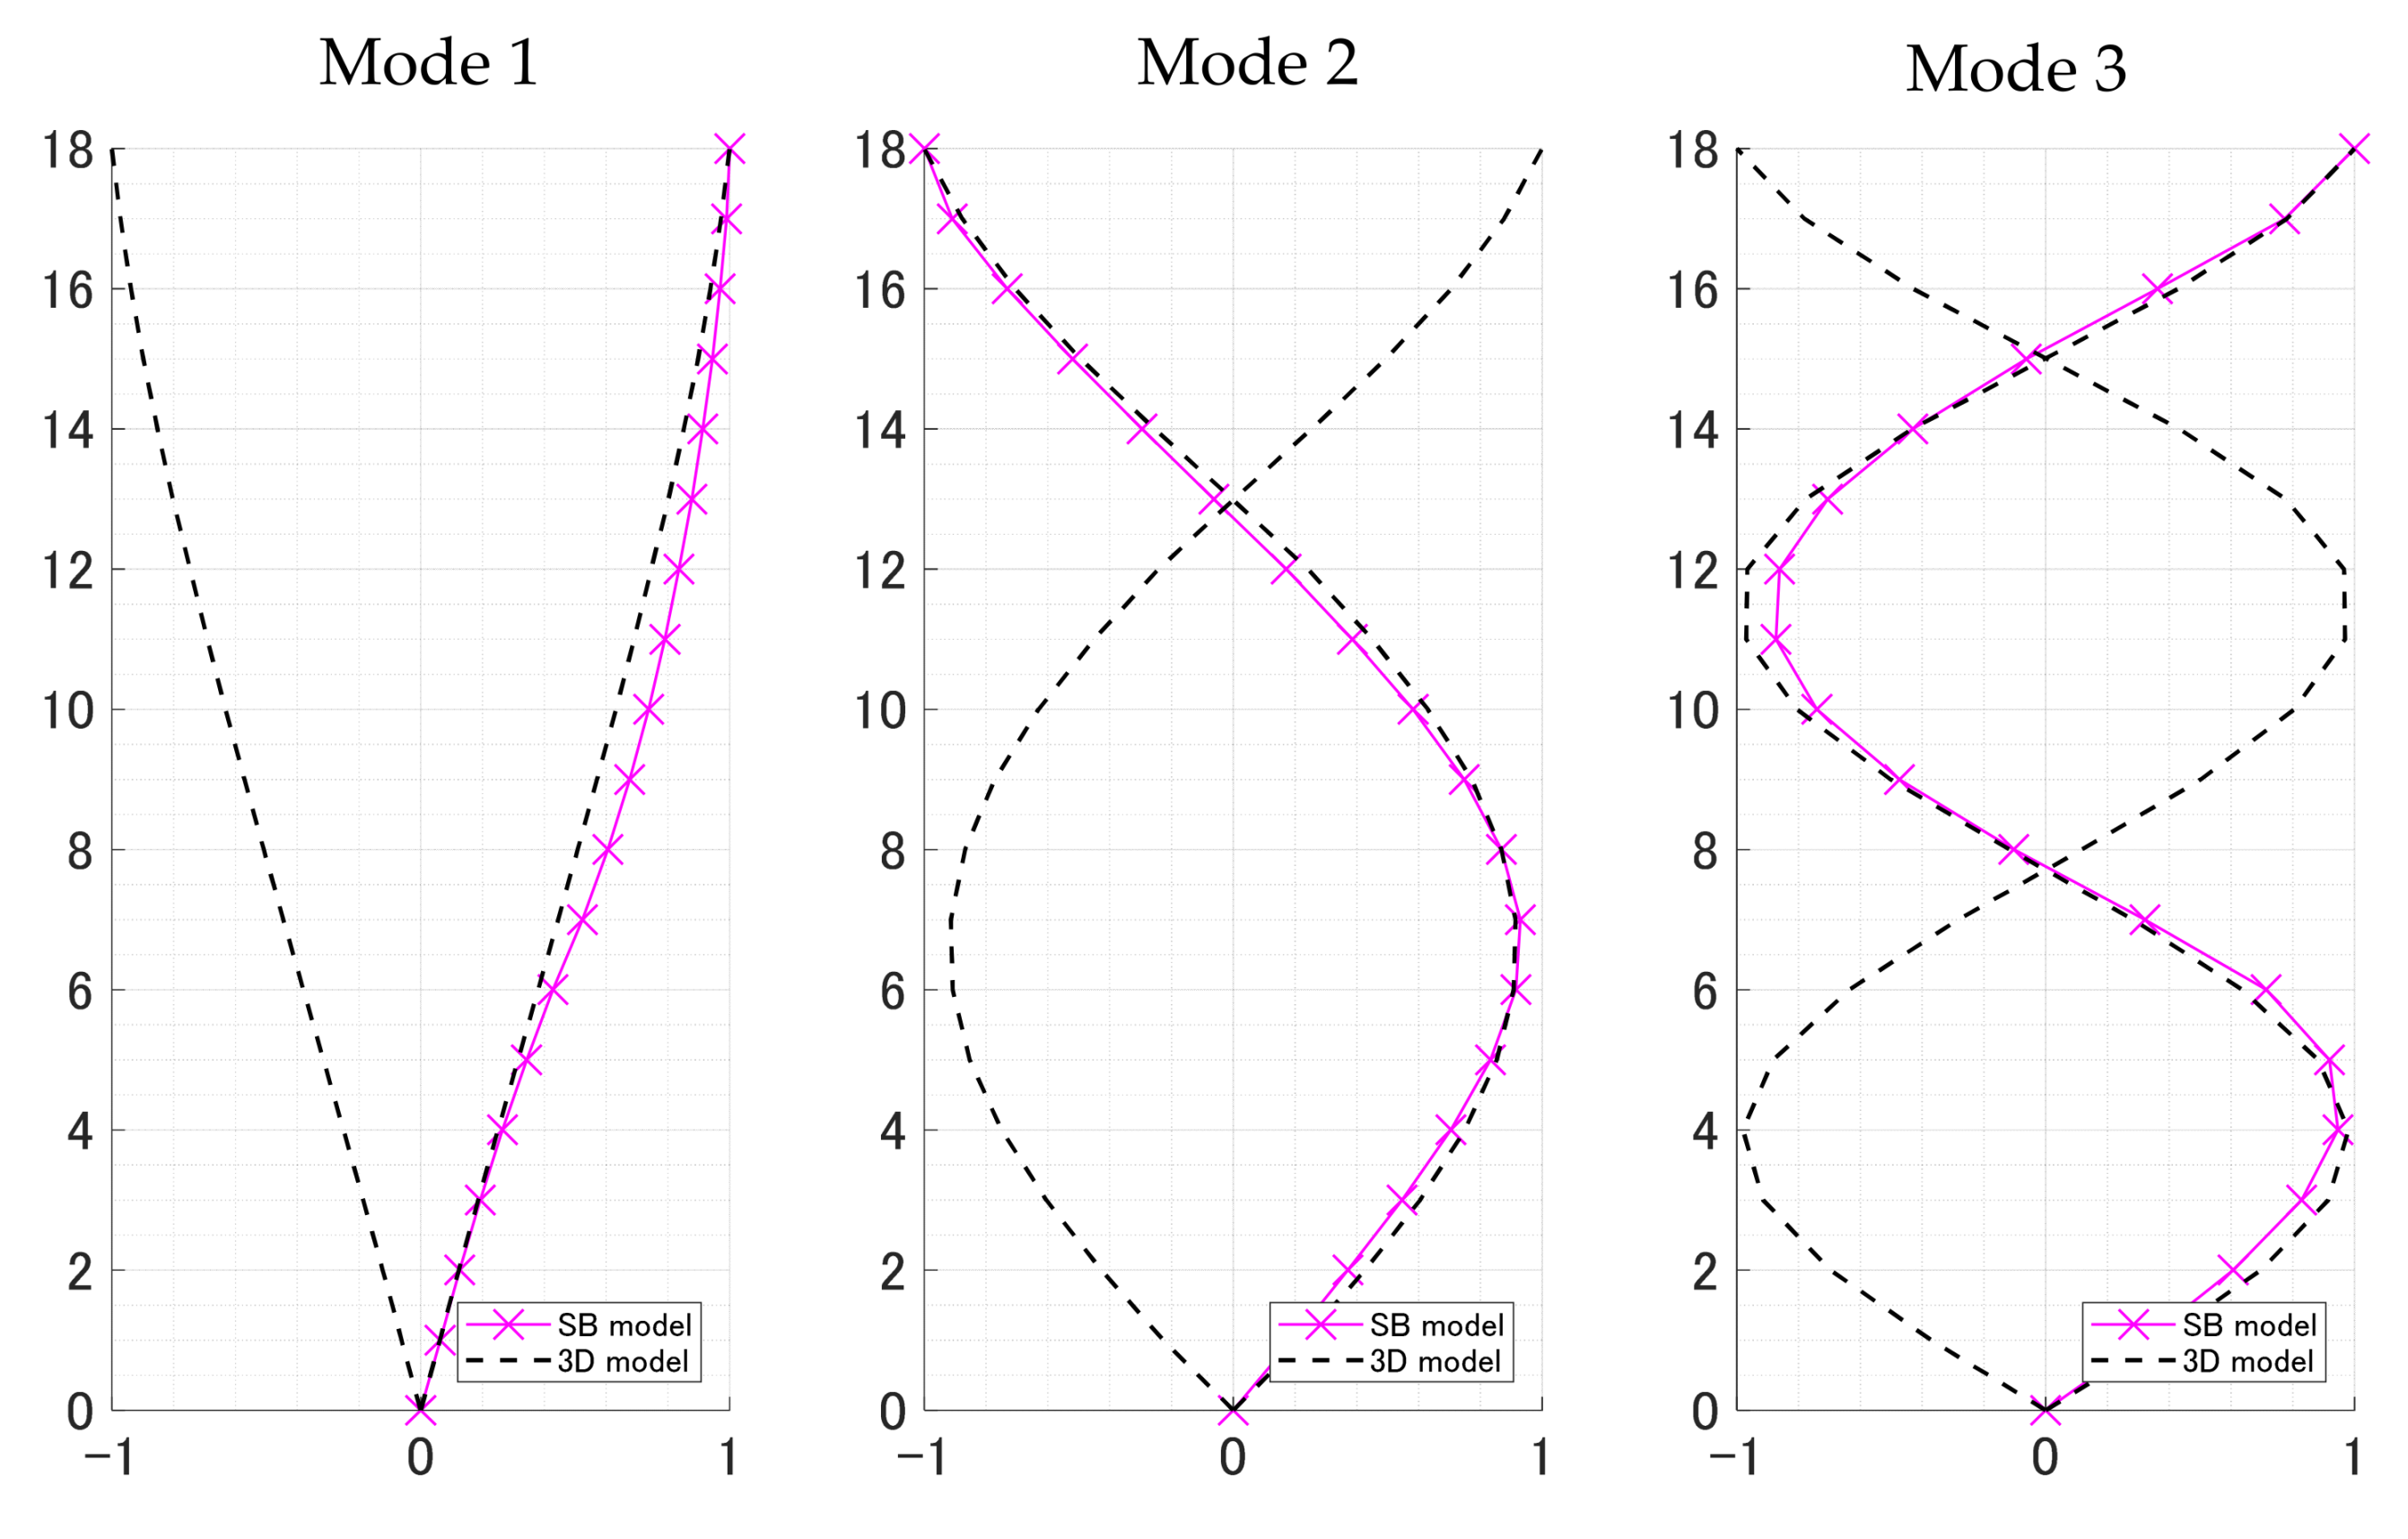
The modal analysis of the 3D model is also performed to obtain natural periods and mode shapes. Comparison of natural periods and mode shapes between the 3D and simplified analysis models after stiffness optimization using the BMU method are provided in Table 5 and Figure 5.
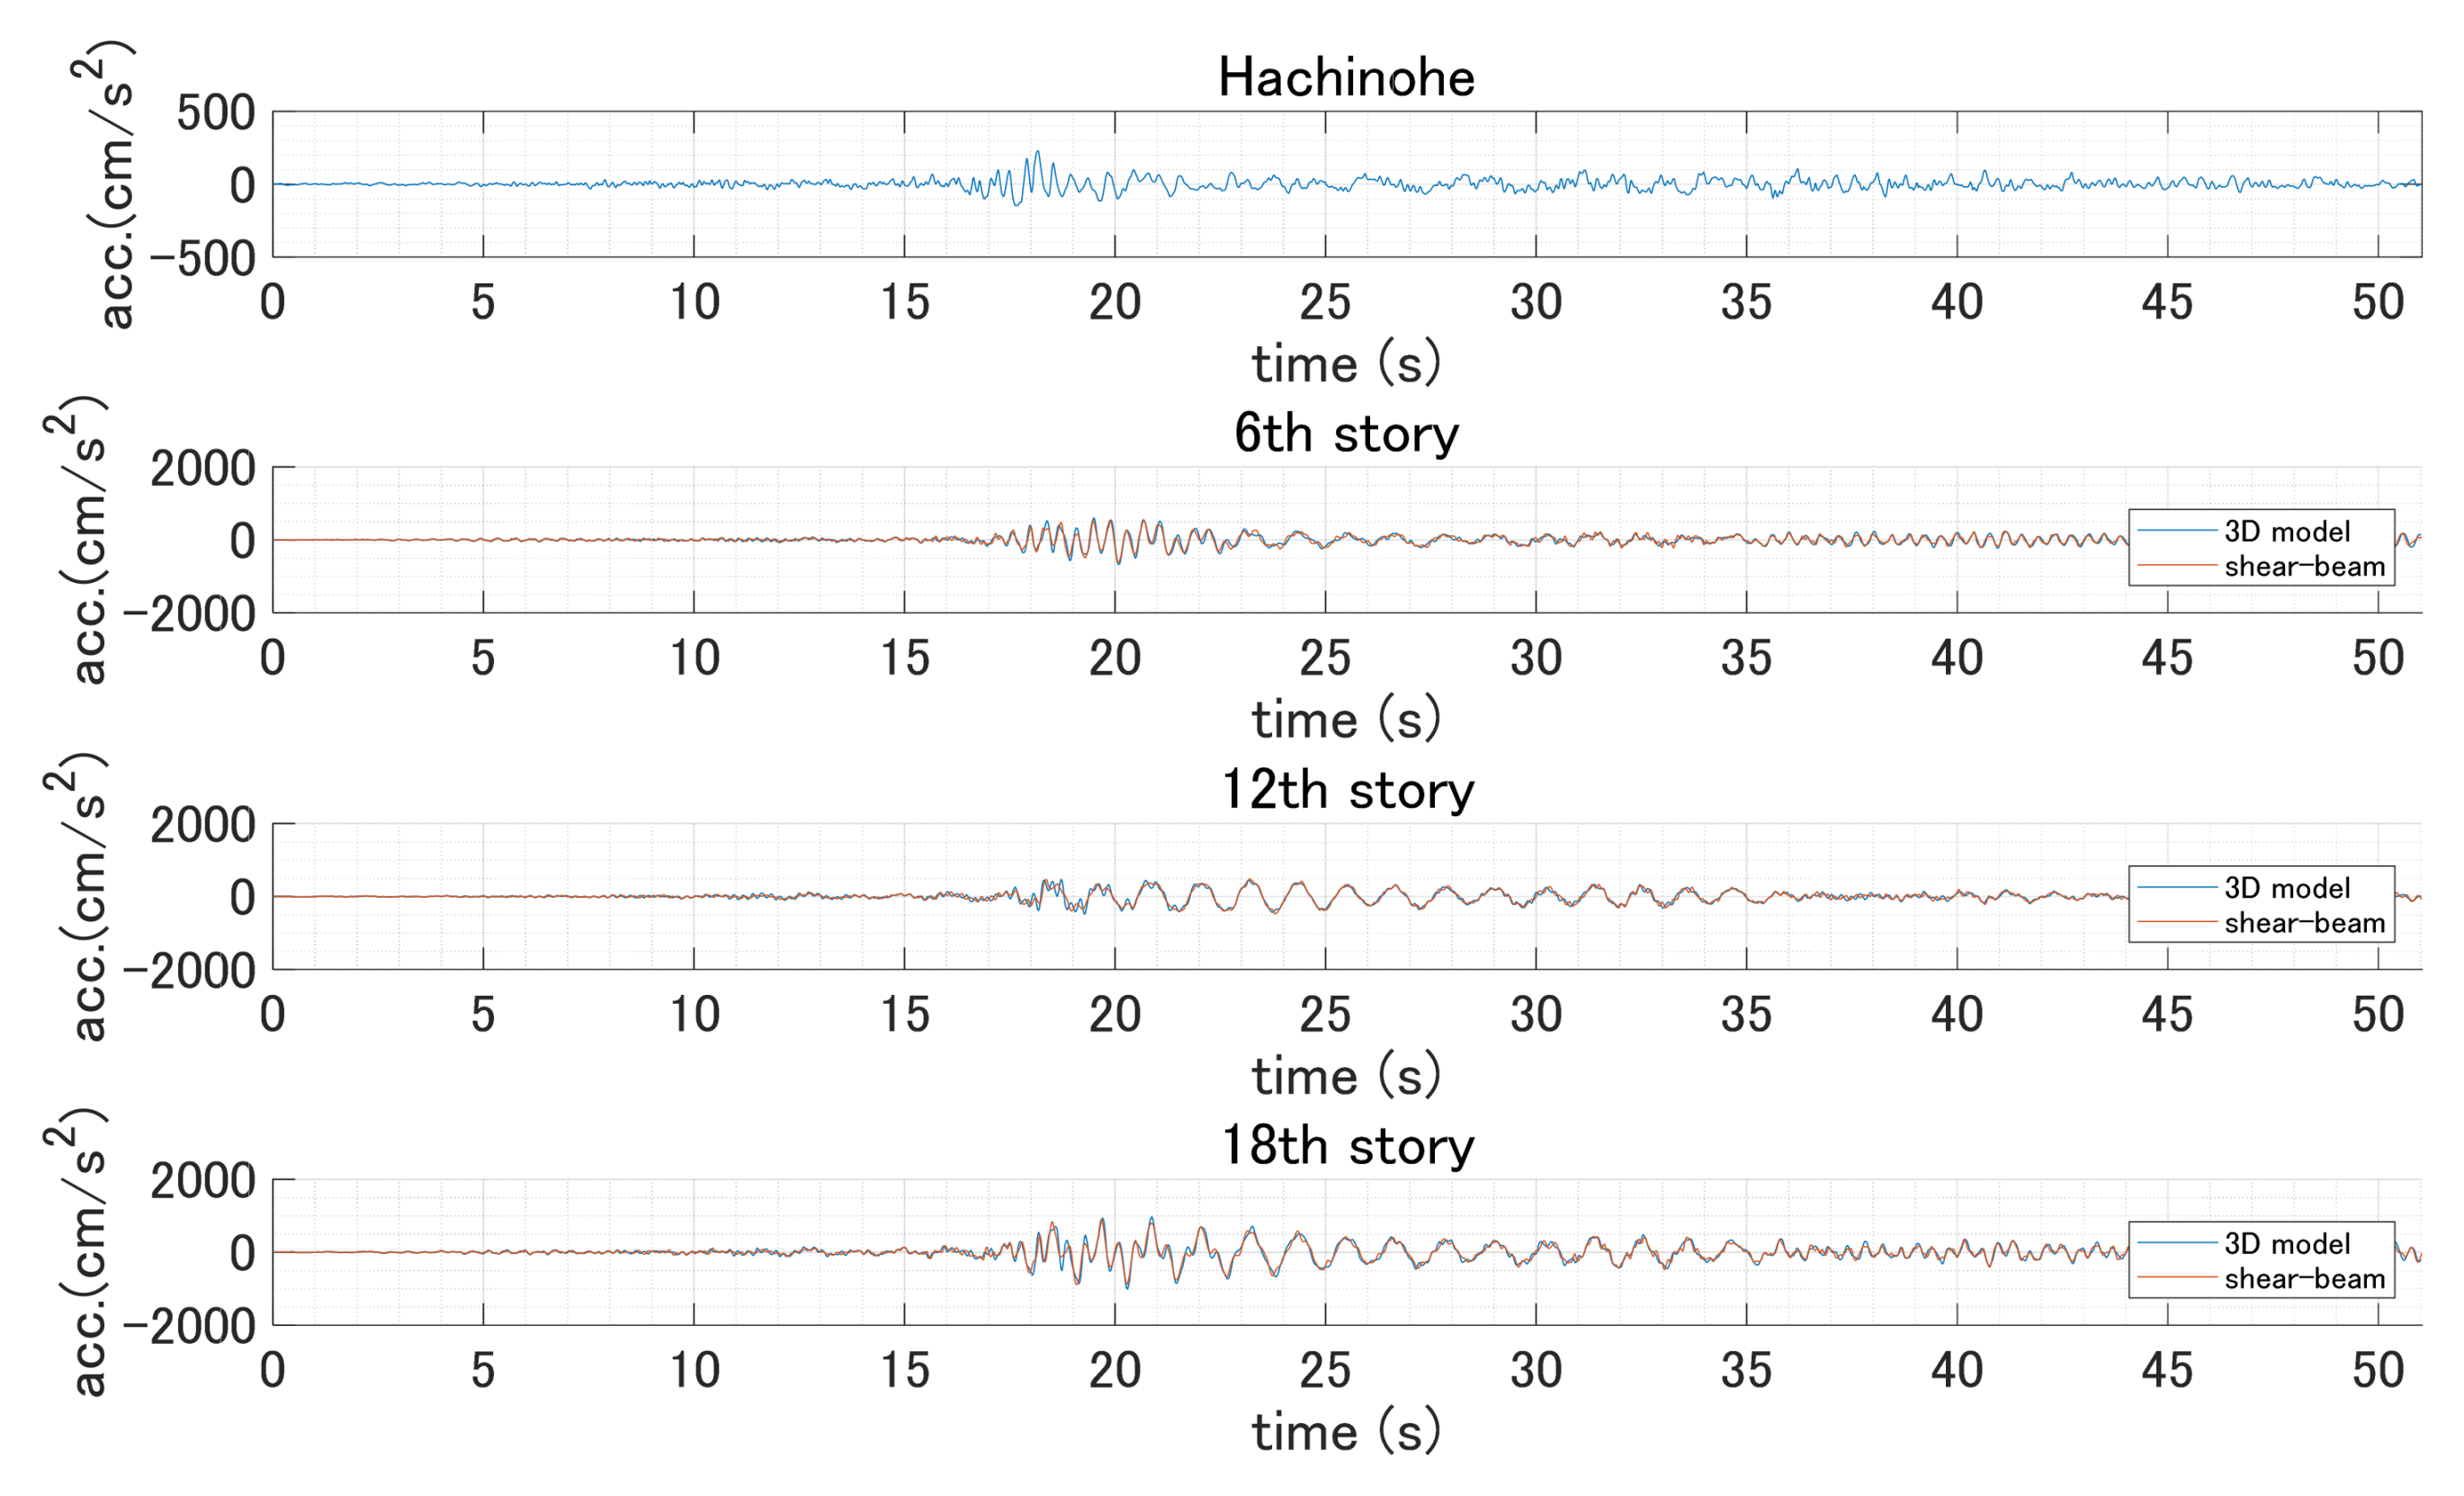
In addition, the time history response analysis of both 3D and simplified planar models are conducted to confirm the response accelerations. Modal damping (1% damping in each mode) is adopted for both the 3D and simplified models. The Hachinohe historical earthquake (1968) [46], which is one of the earthquakes often been selected to check its responses at the design stage, is used for comparison. From Figure 5 and Figure 6, the simplified linear analysis model after optimizing stiffness by the BMU method represents the behavior of the 3D analysis model closely.

3.4. Damage Sensitive Feature (DSF)

To create training data for the CNN, Monte Carlo simulation is carried out using various random excitations for the selected DSFs. A band-limited white noise filtered according to the Kanai-Tajimi spectrum [47] is utilized to generate input excitations. Table 6 shows the parameters of both the Kanai-Tajimi filter and envelope function used in this research. The following envelope function is applied after the filtering [48]:
ψ ( t ) = γ 1 · t · e x p ( γ 2 t )
The range of excitation power intensity is chosen, such that the resulting response spans both the linear and nonlinear range. The equation with respect to power intensity G 0 and variance σ 2 of band limited white noise is given by:
σ 2 = 2 π G 0 Δ t
where Δ t is the width of the pulses for the band-limited white noise. A total of 50,000 (6250 for each of the eight different values of G 0 ) are generated. Figure 7 shows the relations between the mean values of the DSF and the square root of G 0 at 6th, 12th, and 18th floors, which are proportional to the amplitude of excitation. From Figure 7, the value of DSF gradually increases after yielding, as the amplitude of the random ground motion increases. Since small-to-moderate damage in a building precipitates itself primarily as additional structural damping due to hysteresis, the DSF (differences between the measured responses and those predicted by the linear model) at the top floor takes larger values than those at the lower floors. This observation clearly indicates that taking differences between the acceleration from the nonlinear analysis and the one predicted by the linear analysis model can be a feature that represents damage existence. This DSF is used as input to the Convolutional Neural Network (CNN) for safety evaluation described in the next section.

3.5. Training of the Convolutional Neural Networks

This study uses DSFs at the three floors (6th, 12th, and 18th floor), along with the ground excitation, as the input for the training of CNN. The selection was made to balance the performance and cost. This research considers uncertainties in both the ground motion and the simplified nonlinear model parameters by sampling the values uniformly from the ranges listed in Table 6 and Table 7.
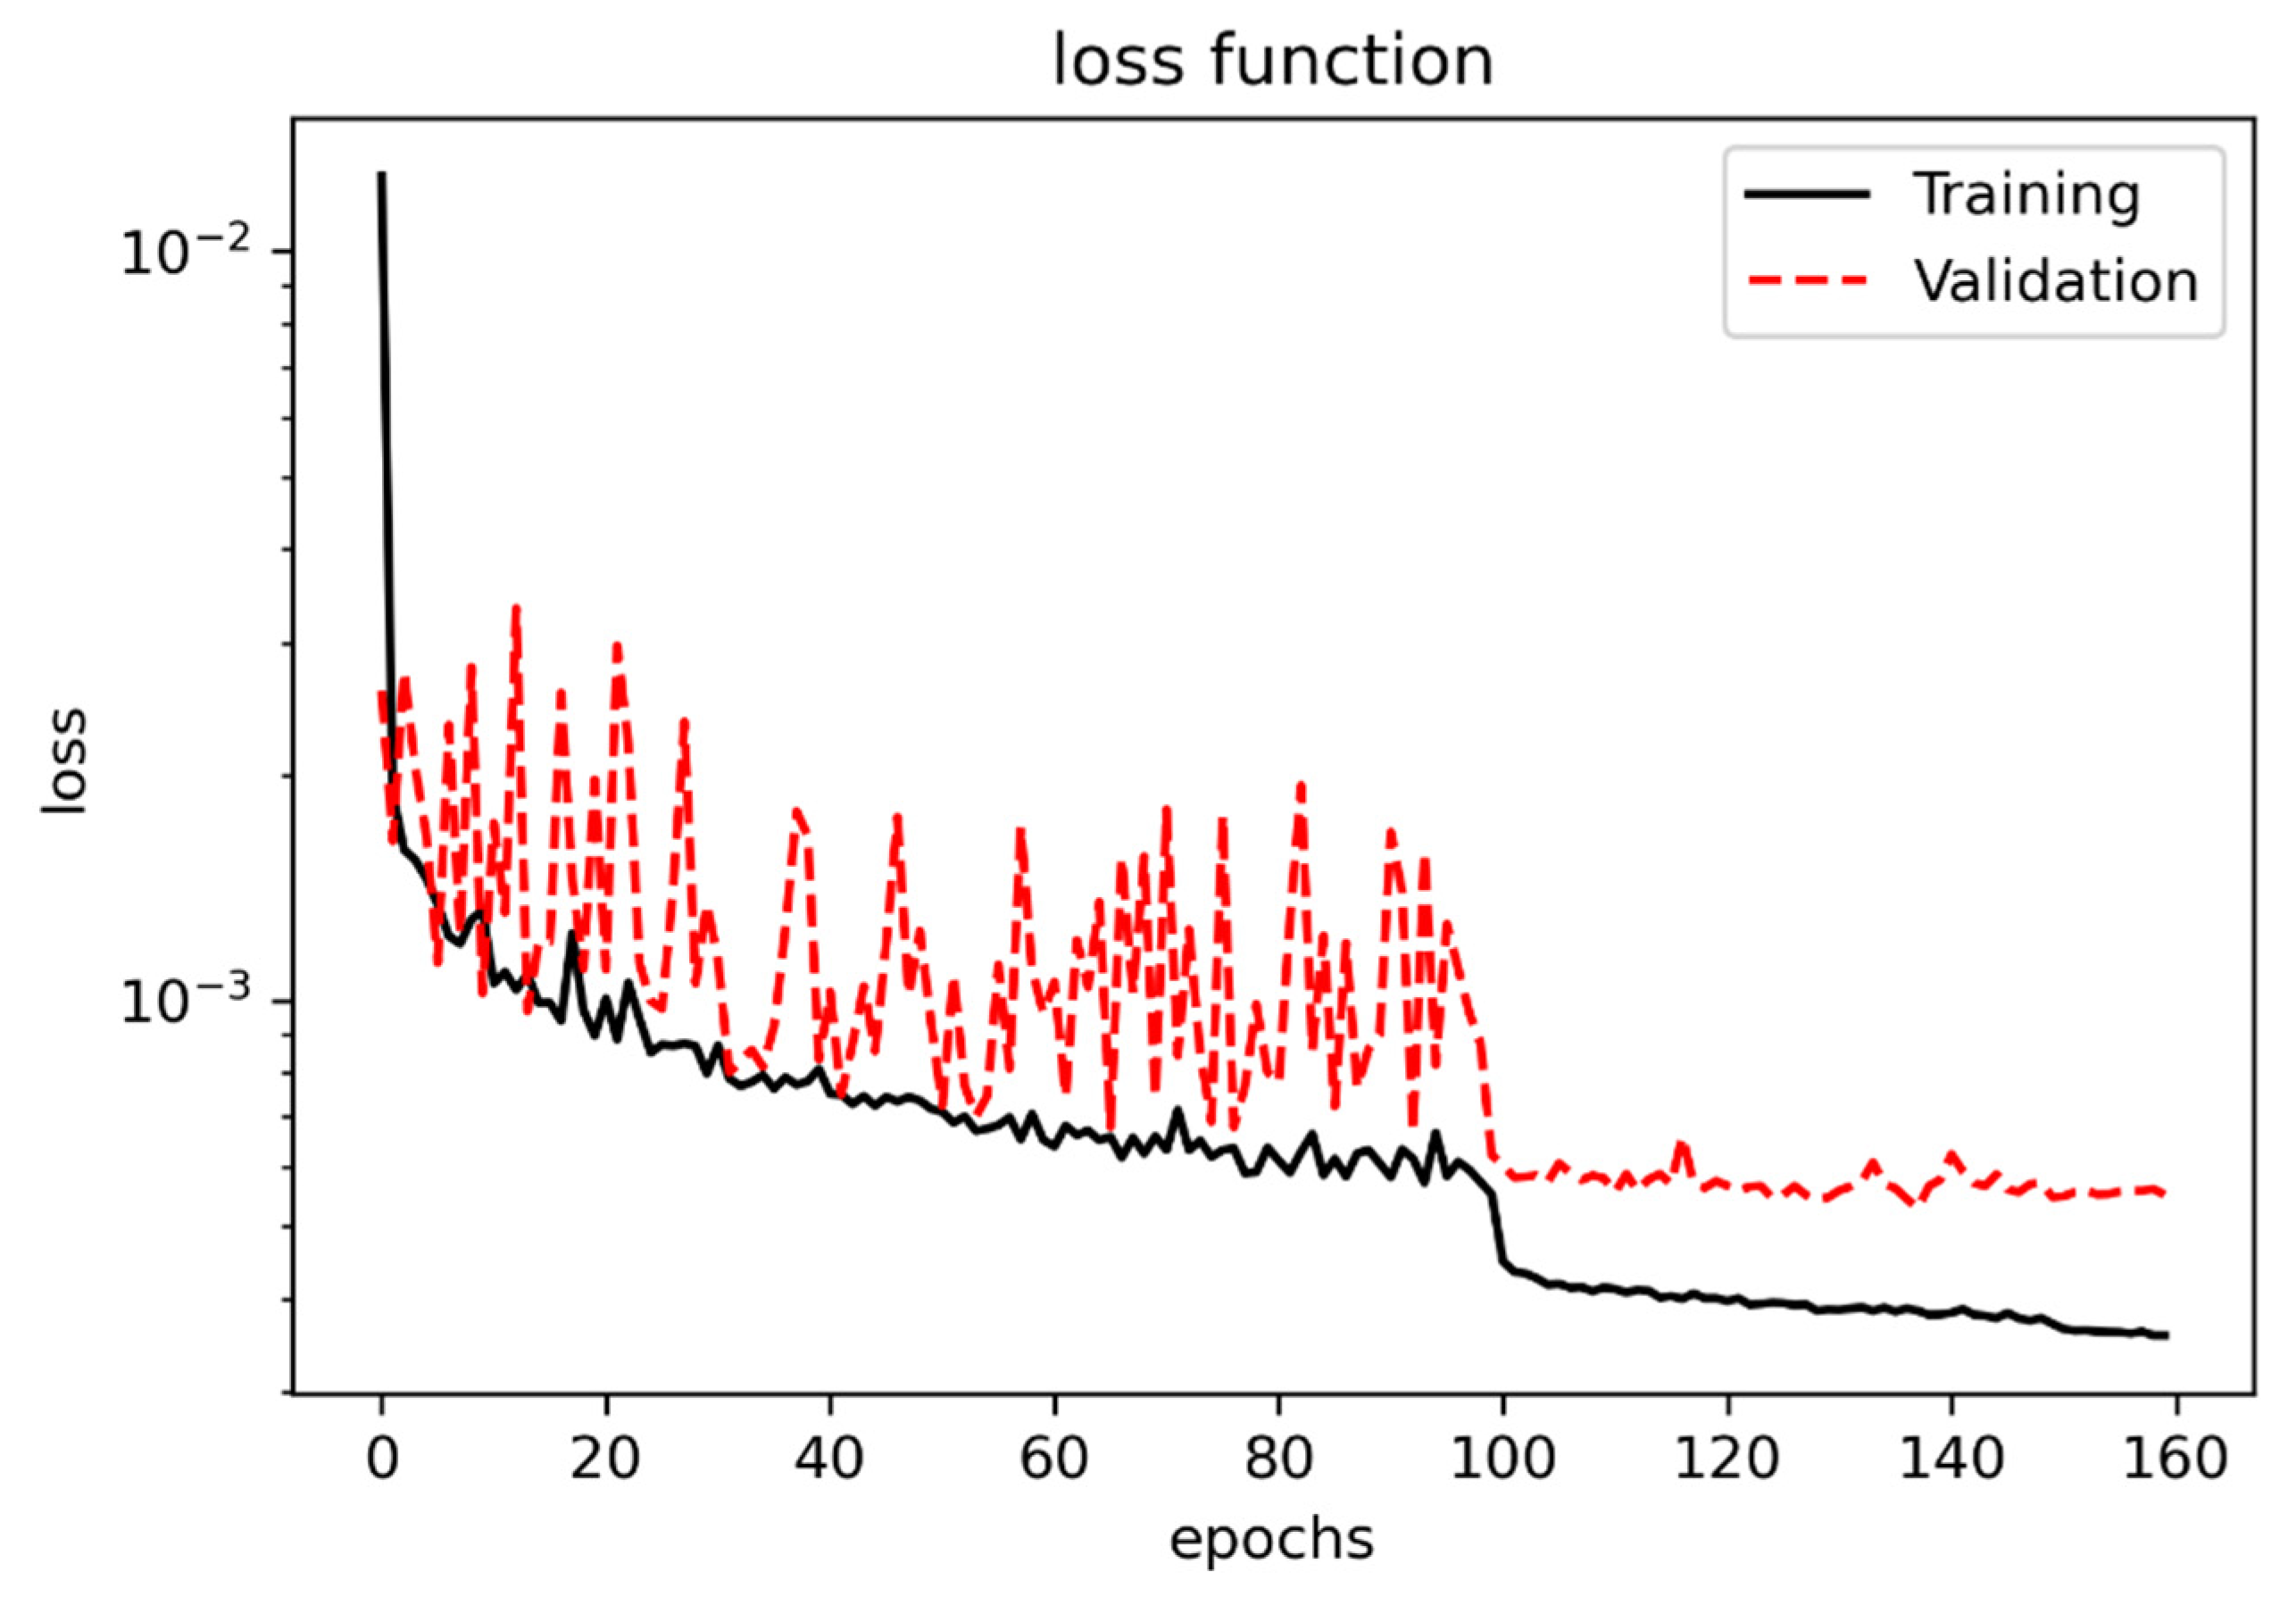
The CNN architecture is shown in Table 8. A total of 44,500 training data, which consist of ground motion and three DSFs (6th, 12th, and 18th story) with 3101 sampling data points are generated. Before the data are put into the network, two types of data augmentation are applied: (i) Data portions made of 3001 points are cropped out randomly, and (ii) −1 is multiplied to the ground excitation and the DSFs with a probability of 0.5. These augmentation schemes are determined based on the observation of the physical properties of the problem: The estimated damage index should not vary with the measurement start time (time-invariance), and two similar excitations applied in the opposite directions should lead to the identical damage index (symmetric structure or even function). The data augmentation allows the network to learn those properties in a data-driven manner. A reverse Huber function is selected as a loss function of the training process [49,50]. The decrease in the reverse Huber loss functions evaluated for the training and 500 validation data sets are shown in Figure 8, which indicates that the network converges.
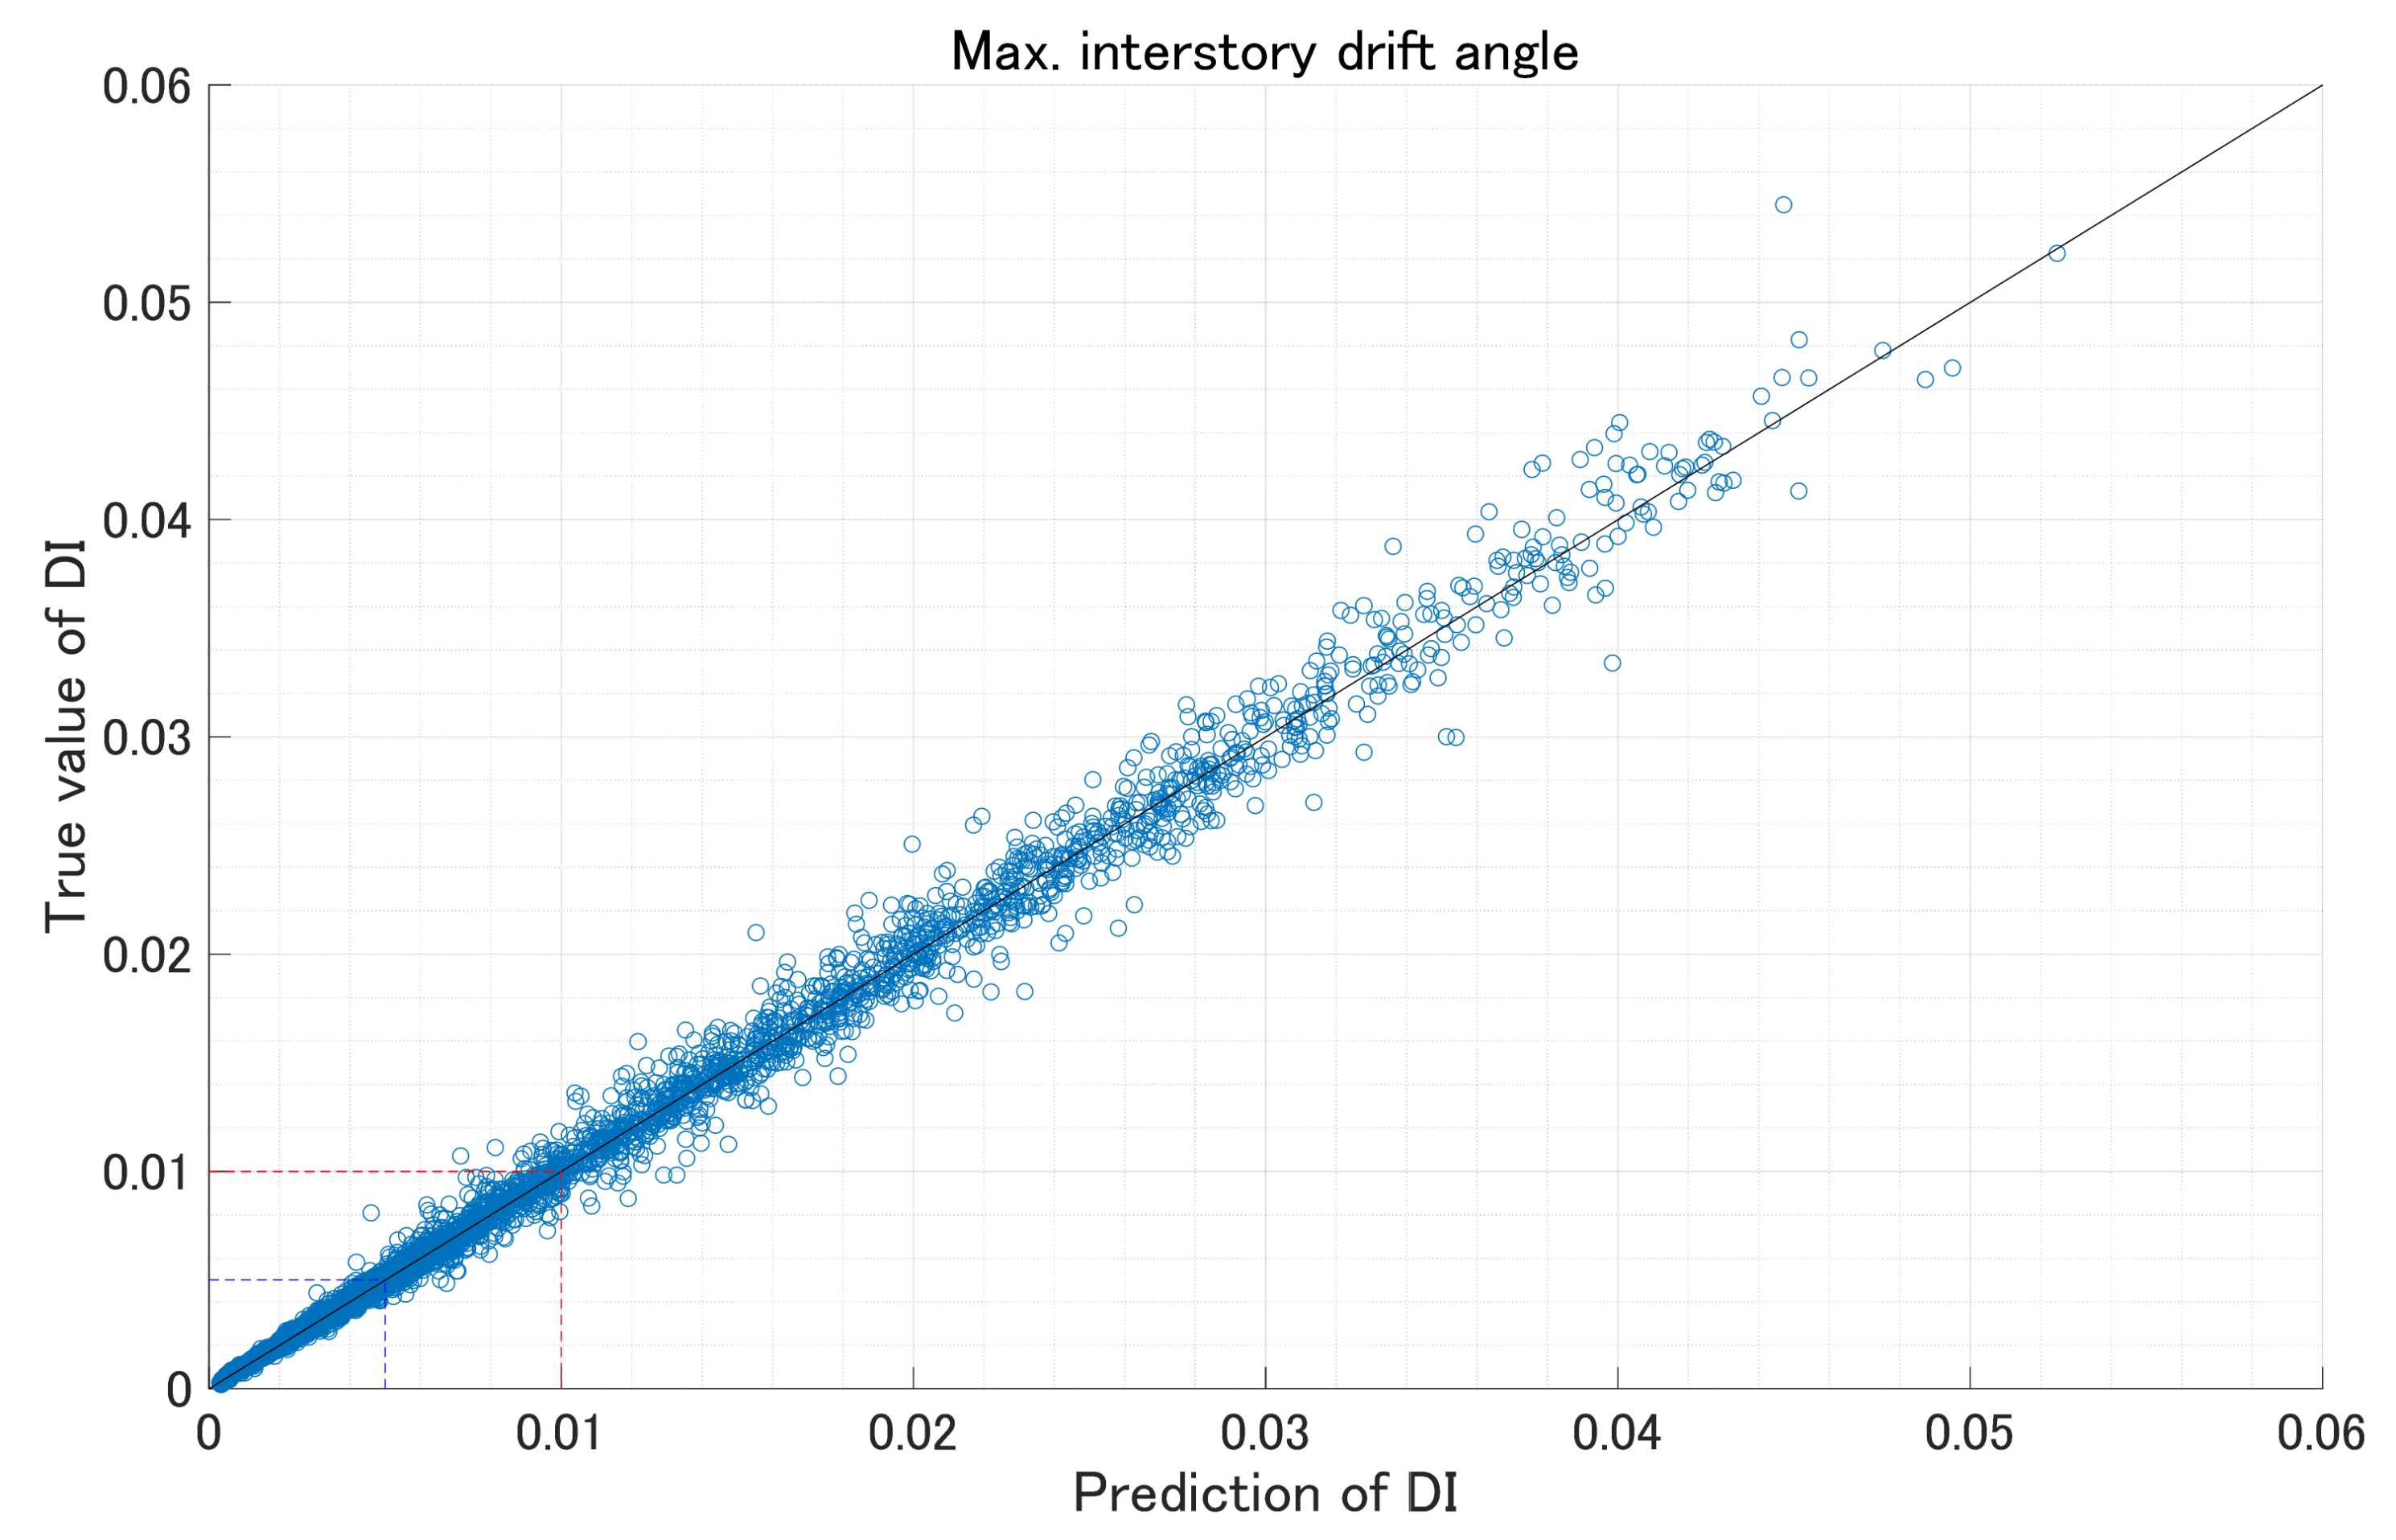
A testing set of 5000 new ground motions is created using the same sampling method shown in Table 6. Measured accelerations are derived using the simplified nonlinear analysis model to calculate DSFs of three corresponding floors (6th, 12th, and 18th floor). Figure 9 describes the scatter plot between estimated and true values for the maximum IDA. The plots should be on the black linear line if predictions match the true values.
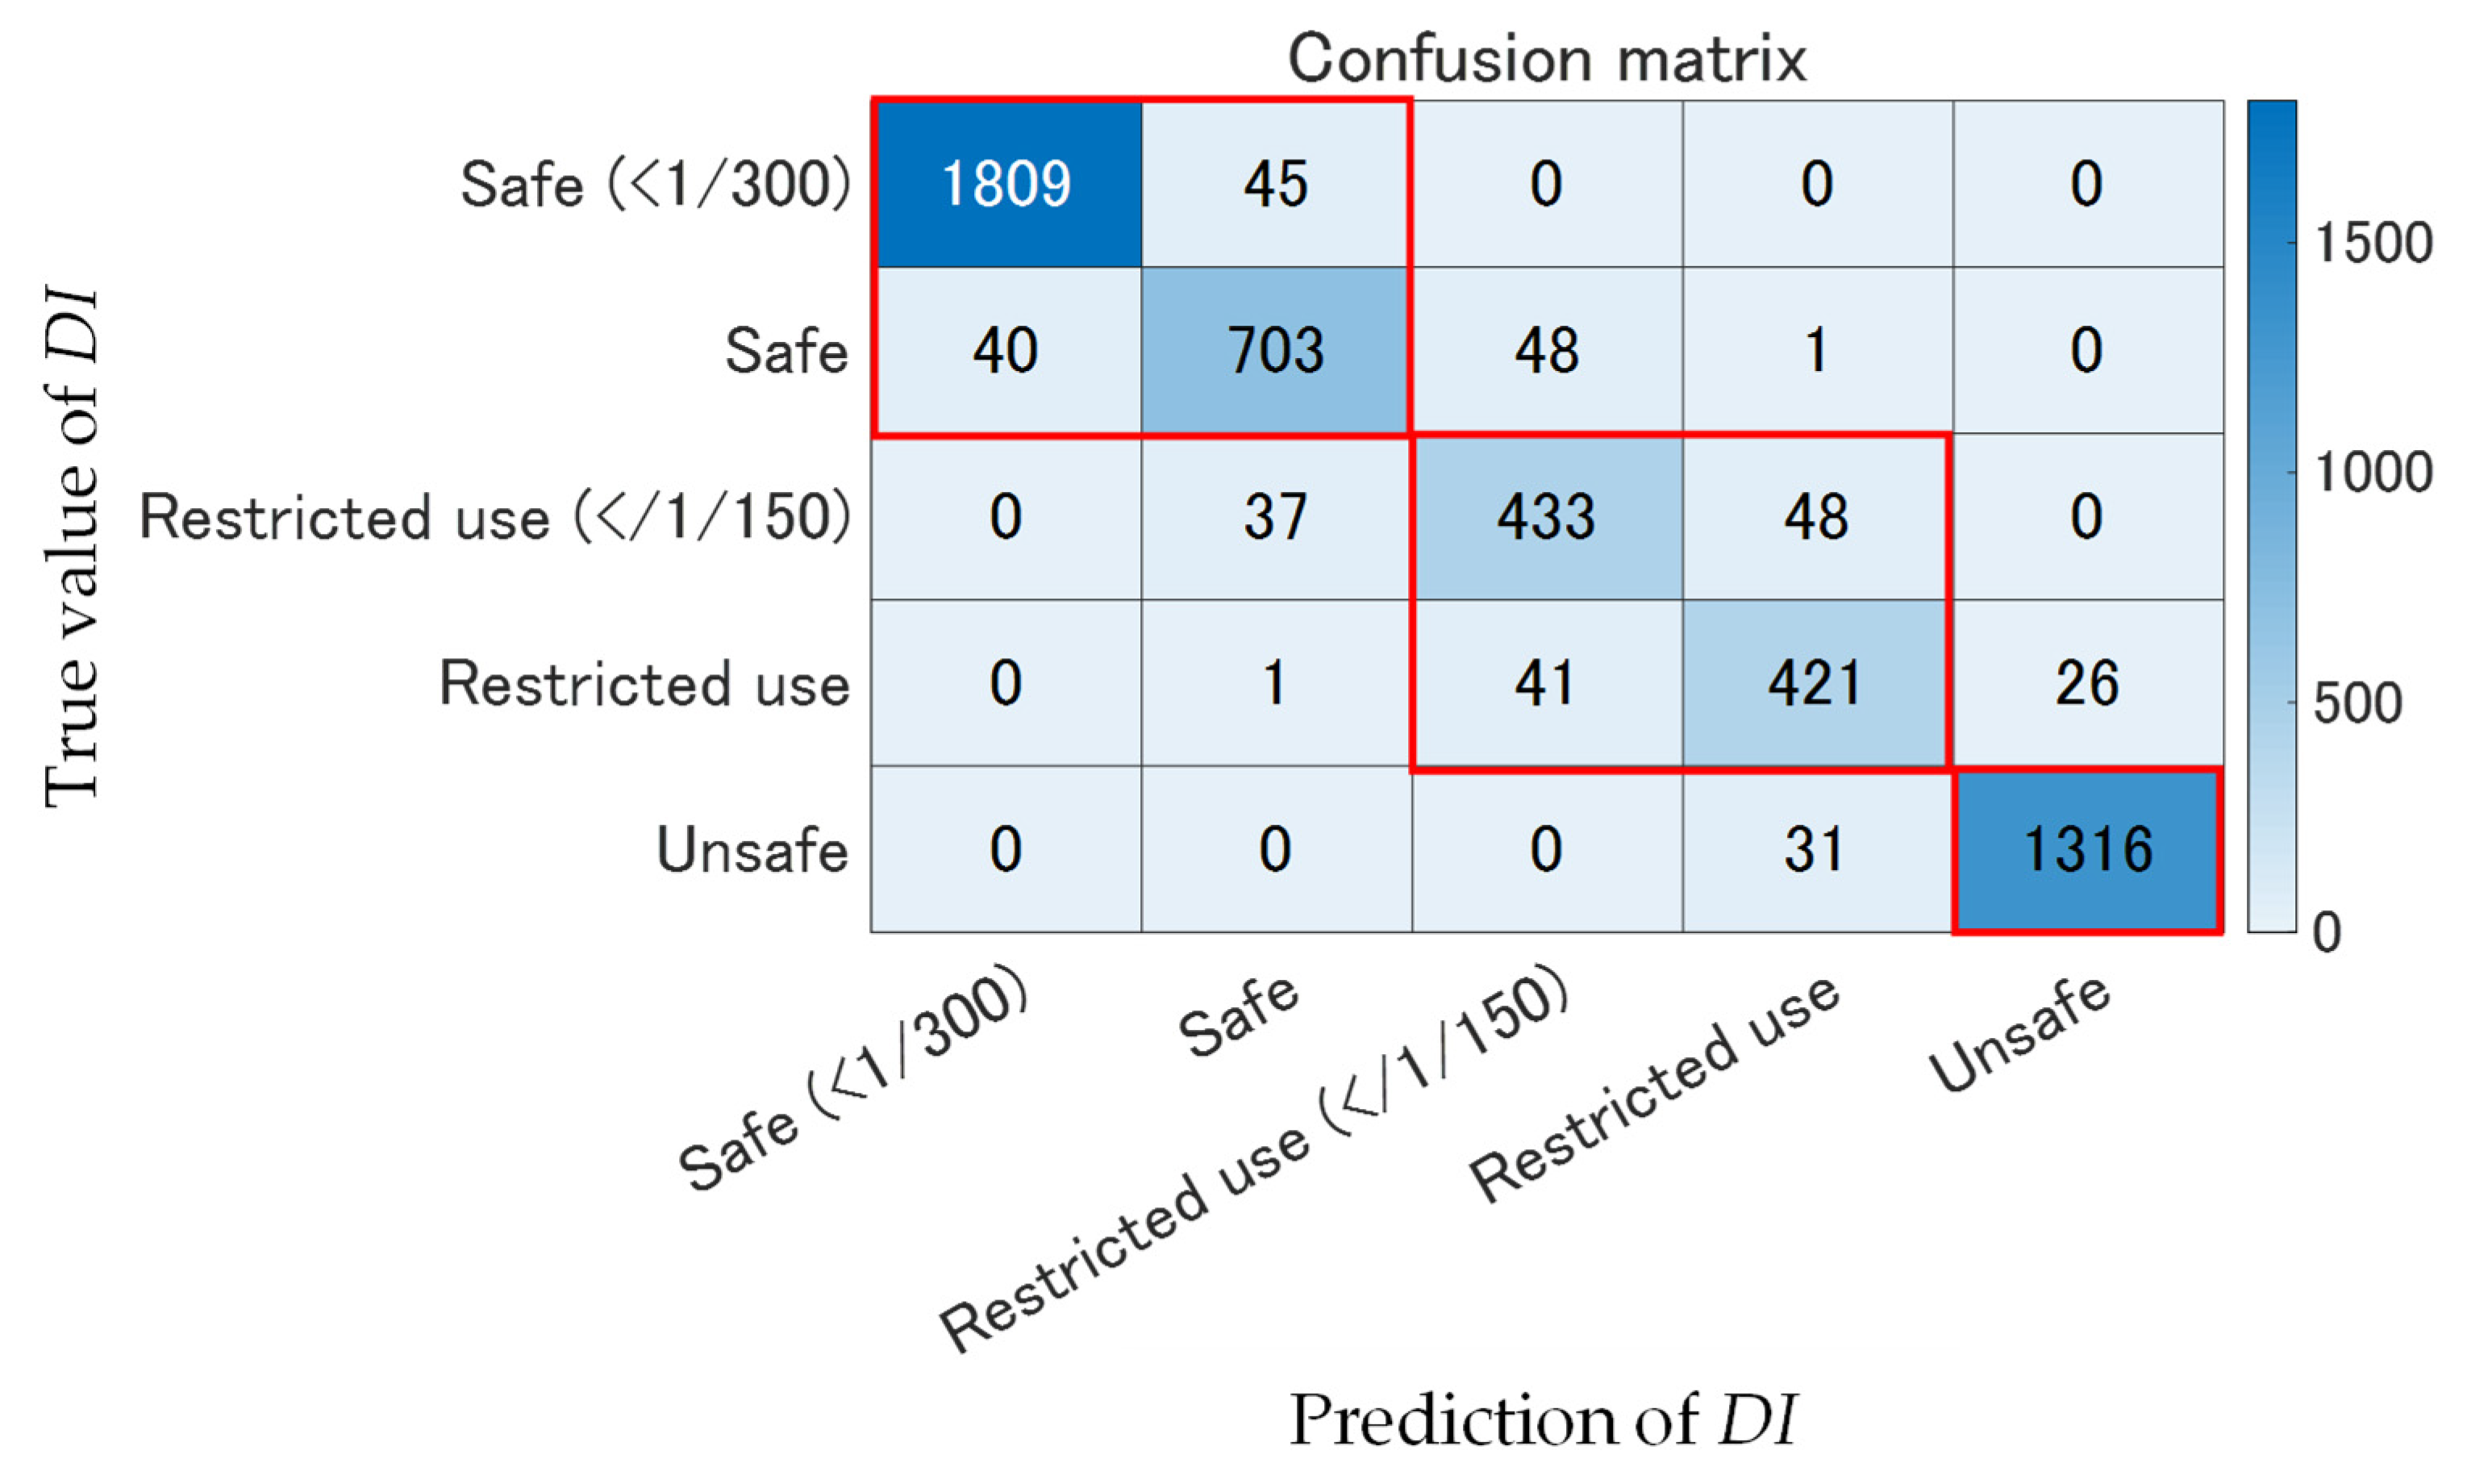
Safety evaluation is conducted based on the process of safety classification described in Section 2.1, which are categorized into three regions: “safe”, “restricted use”, and “unsafe”. In this research, the “safe” zone is further divided into two sections, if the estimated maximum IDA took less or more than 0.33% (=1/300). Simultaneously, the “restricted use” zone is also divided into two sections, at an estimated maximum IDA 0.67% (=1/150). These additional categories help engineers judge building safety conditions more accurately, especially for the “restricted use” zone, where the building conditions of near 0.5% (=1/200) and near 1.0% (=1/100) differs significantly. The accuracy of safety evaluation using 5000 data records is illustrated using the confusion matrix shown in Figure 10. An accuracy of 97.1% indicates that the proposed approach applied to a high-rise building has a high potential for safety evaluation after seismic events.

3.6. Validation Results Using Experimental Data

This section further validates the CNN trained in Section 3.5 using the experimental data listed in Table 3 (totally seven experimental cases). The DSFs at the 6th, 12th, and 18th floor are computed using the measured acceleration and the acceleration predicted by the simplified linear analysis model. Then, the trained CNN is applied to the ground acceleration and the corresponding DSFs to estimate the maximum IDA. Finally, safety classification is performed based on the estimated maximum IDA to check the accuracy of the proposed framework.
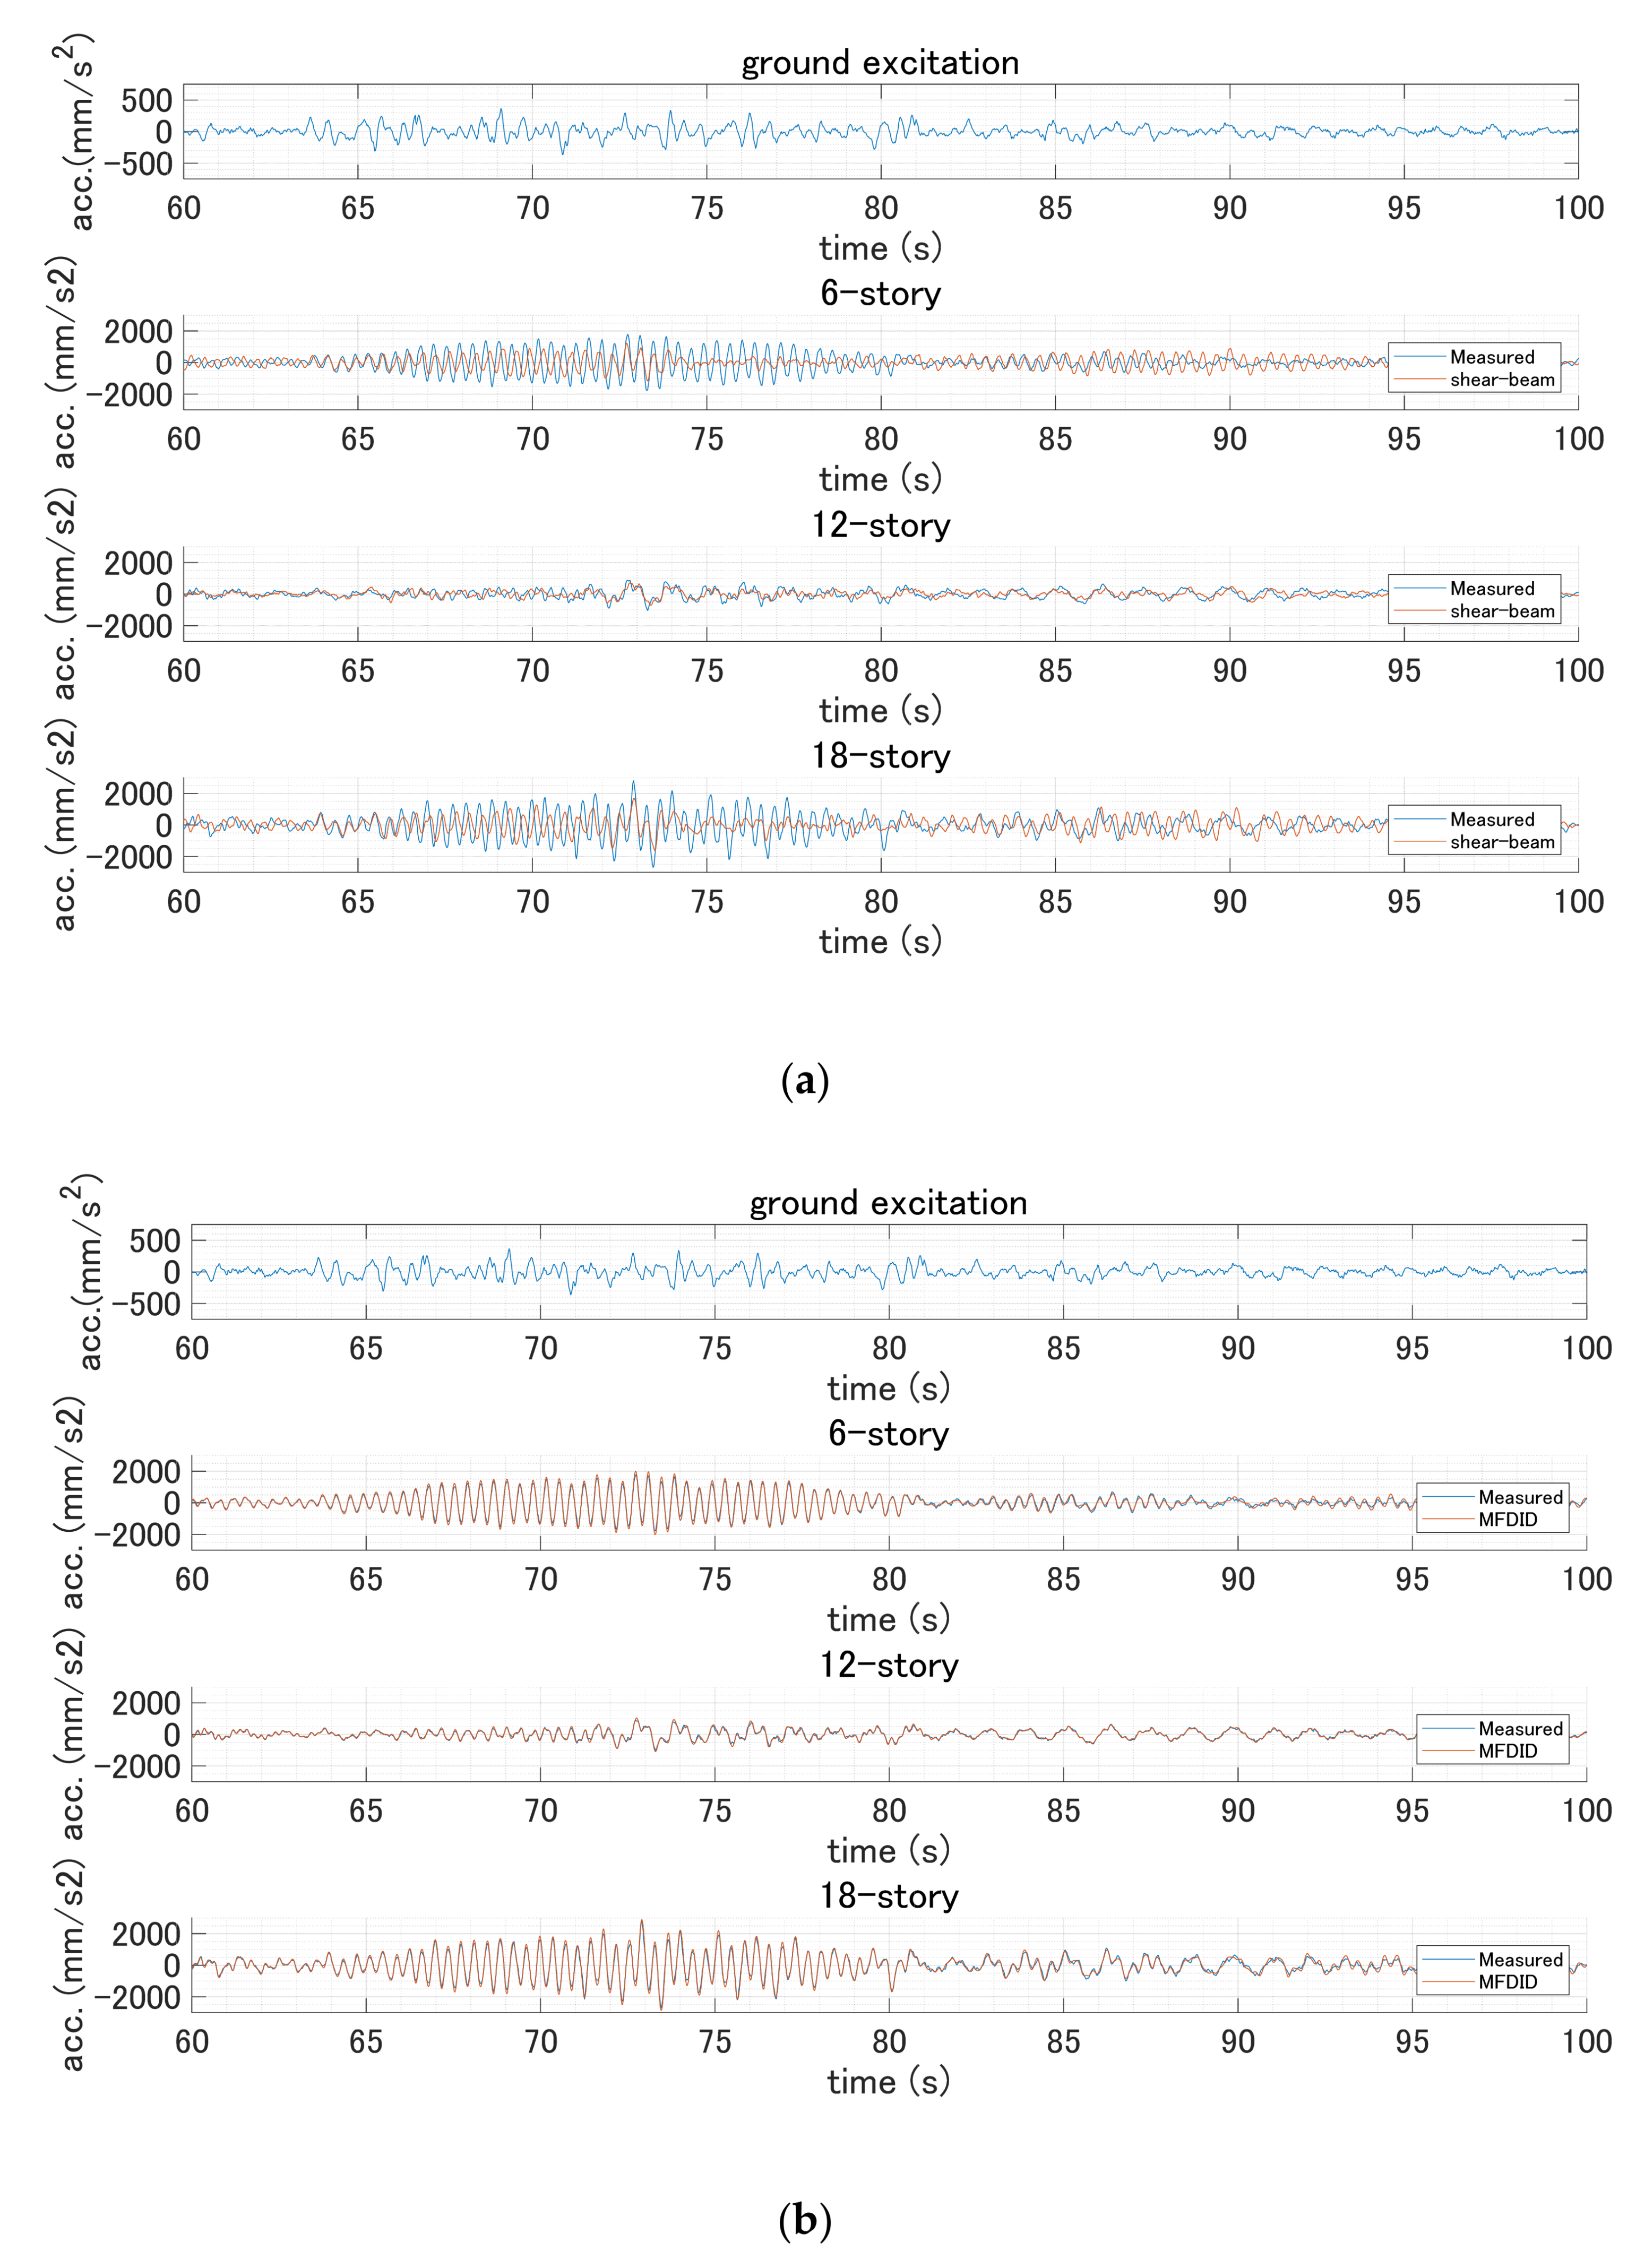
To demonstrate the effectiveness of nonparametric system identification for the predicted linear analysis model, comparisons of time history response accelerations are presented in Figure 11 using results of experimental case 1 in Table 3. The simplified linear analysis model is updated using the nonparametric system identification (SRIM method) to match measured time history response accelerations. Figure 11 shows that applying the SRIM method provides a more accurate correspondence of response accelerations for the selected floors (assumed sensor locations). The updated model is used in the subsequent evaluations.
The ground excitation and the selected DSFs used for CNN training contain 3001 data points collected at a sampling frequency of 50 Hz (total of 60 s). However, the experimental data contain 55,400 data points, which were sampled at 200 Hz. Therefore, the original measured data were filtered and down-sampled to 50 Hz, which still allow measurement of the first three modes ( f 3 = 4.6   Hz ). After down-sampling, the number of data points decreases to 13,850, which is further divided into overlapping segments with 3001 data points. These sliding windows are chosen to contain the maximum acceleration, which cause a strong impact and deformation to the building. In this study, four windows (containing 3001 data points that include maximum acceleration) are prepared to estimate the maximum IDA. An example of the four selected windows are shown in Figure 12 using experimental case 2.
Figure 13 compares the prediction from four different windows and true values of DI estimated using experimental acceleration data. The maximum DI for each experimental case is finally chosen for safety classification. Results show that the proposed approach can reasonably estimate the DI, especially for small-to-moderate levels of ground excitation, which indicate that the proposed system can deal with situations where the earthquake record has varying lengths.
Safety classification for the experimental structure is then carried out using the predicted maximum DI from four windows. To show the effectiveness of the online model updating using nonparametric system identification, two cases are compared: Using BMU only (without SRIM, denoted as BMU only), and using both BMU and SRIM (denoted as BMU + SRIM). The confusion matrices in Figure 14 indicate the estimation accuracy using the trained CNNs. The accuracy of estimating safety levels are 85.7% for BMU only and 100% for BMU + SRIM. The accuracy improvement is particularly significant for the small-to-moderate damage level (less than 1% of IDA). From these results, the proposed approach using nonparametric system identification is demonstrated to be effective for post-earthquake safety assessment of as-built high-rise buildings.
For future work, combining insights from online model updating is critical from the point of seeking the big changes in the analysis model due to sensor issues and structural damage (residual yielding and deformation) caused by seismic events. Nonparametric model updating (e.g., [51,52]) is promising for informing these types of issues in advance during the operation by updating the analysis model using measured accelerations.

4. Discussion of Cost-Benefit Tradeoffs

This section discusses some of the cost-benefit tradeoffs for the proposed rapid condition assessment system. As discussed in the introduction, this rapid safety evaluation system can support the building owner to report the building condition after seismic events. This immediate safety evaluation leads customers to determine business continuity and, if safety issues are observed, require immediate evacuation to protect users from building disaster. This system can also save the cost of periodical human inspections of buildings, which include investigation of invisible structural components (e.g., beams, columns, and slabs) covered by ceiling and finishing. On the other hand, this system requires periodical maintenance of its components, such as Personal Computer (PC), Uninterruptable Power Supply (UPS), and accelerometers. In addition, the initial system and labor (include engineering) cost cannot be neglected. This section discusses the proposed rapid safety assessment system with regards to initial cost and ongoing maintenance. In this study, systems with different numbers of accelerometers are compared based on the percentage of total cost and accuracy of estimation.
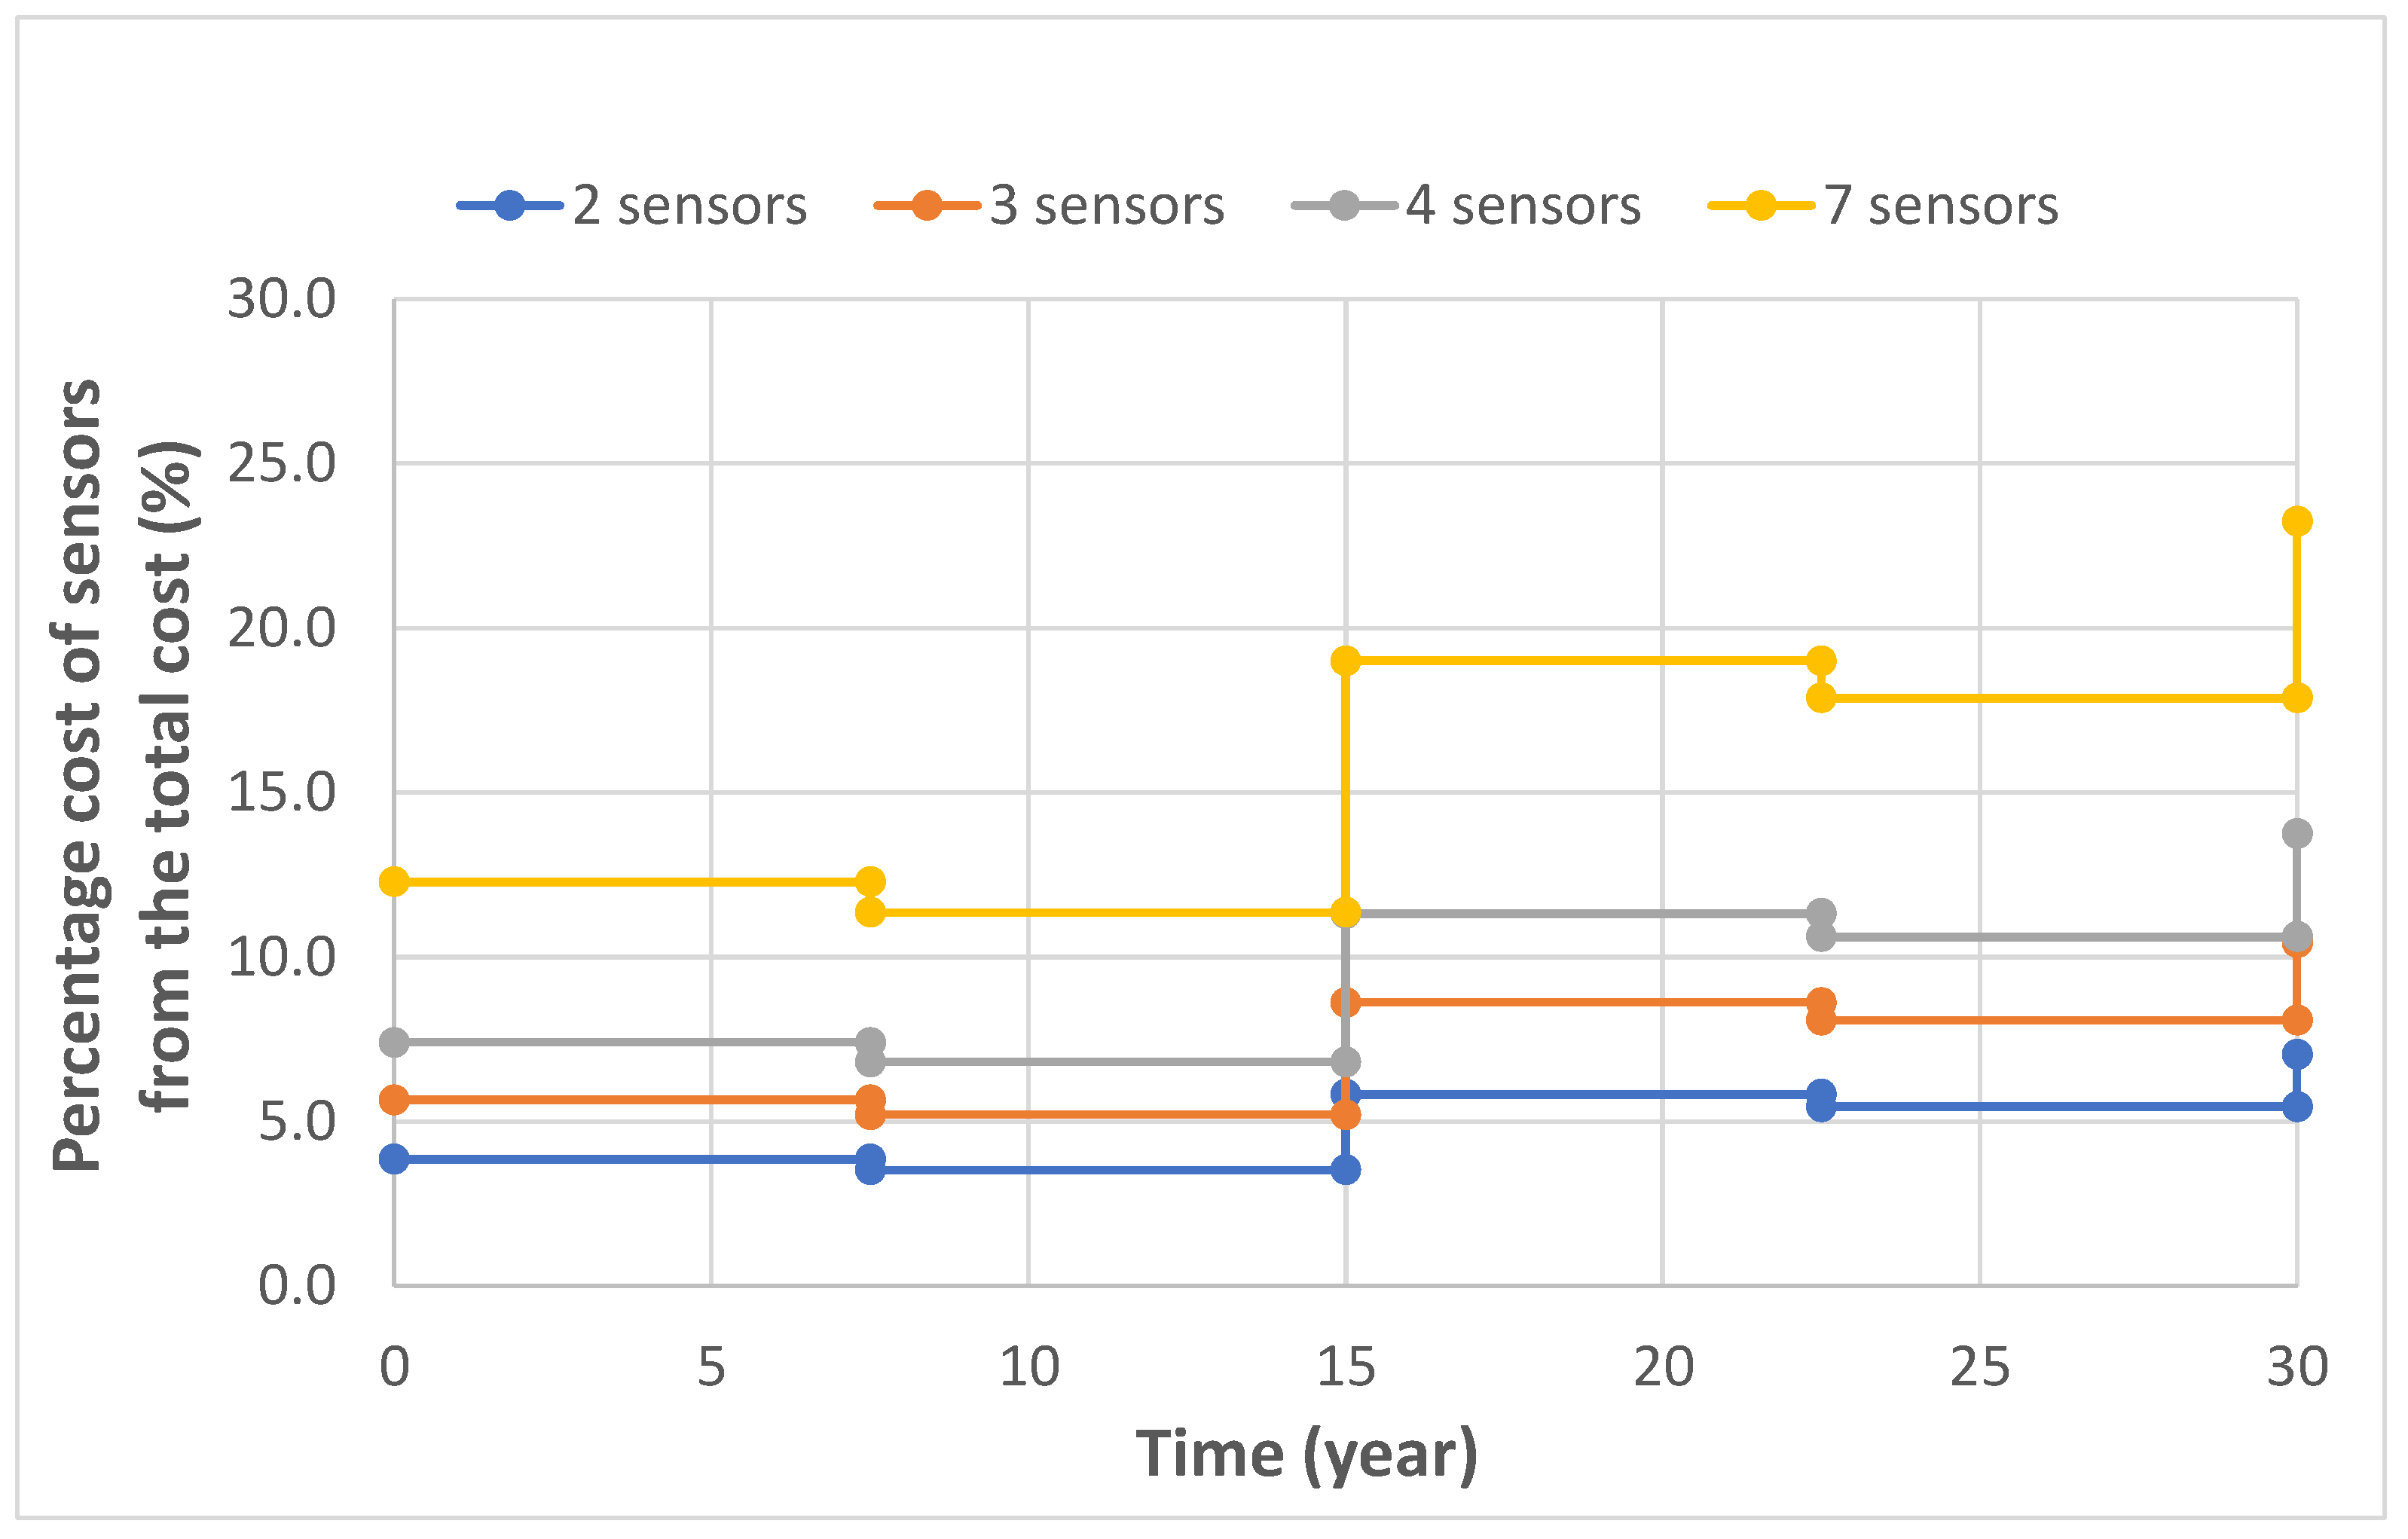
Initial costs include the software for the assessment system, the PC, a UPS, sensors, installation, and engineering. Maintenance and replacement costs cannot be neglected due to the limited lifetime of PC, UPS, and sensors, when compared to that of the building. The PC and UPC need to be replaced every 7 to 8 years, while accelerometers are required to be replaced approximately every 15 years [53]. Based on the study conducted by Mita et al. [54], a comparison of the percentage that the sensor cost dominated from the total cost are shown in Figure 15. The percentage of sensor cost (total cost of sensors/total of initial and running cost) is clearly dominated as the time elapsed due to the necessity of sensor updating (every 15 years). From these results, minimizing the number of sensors employed is one of important factors to be considered.
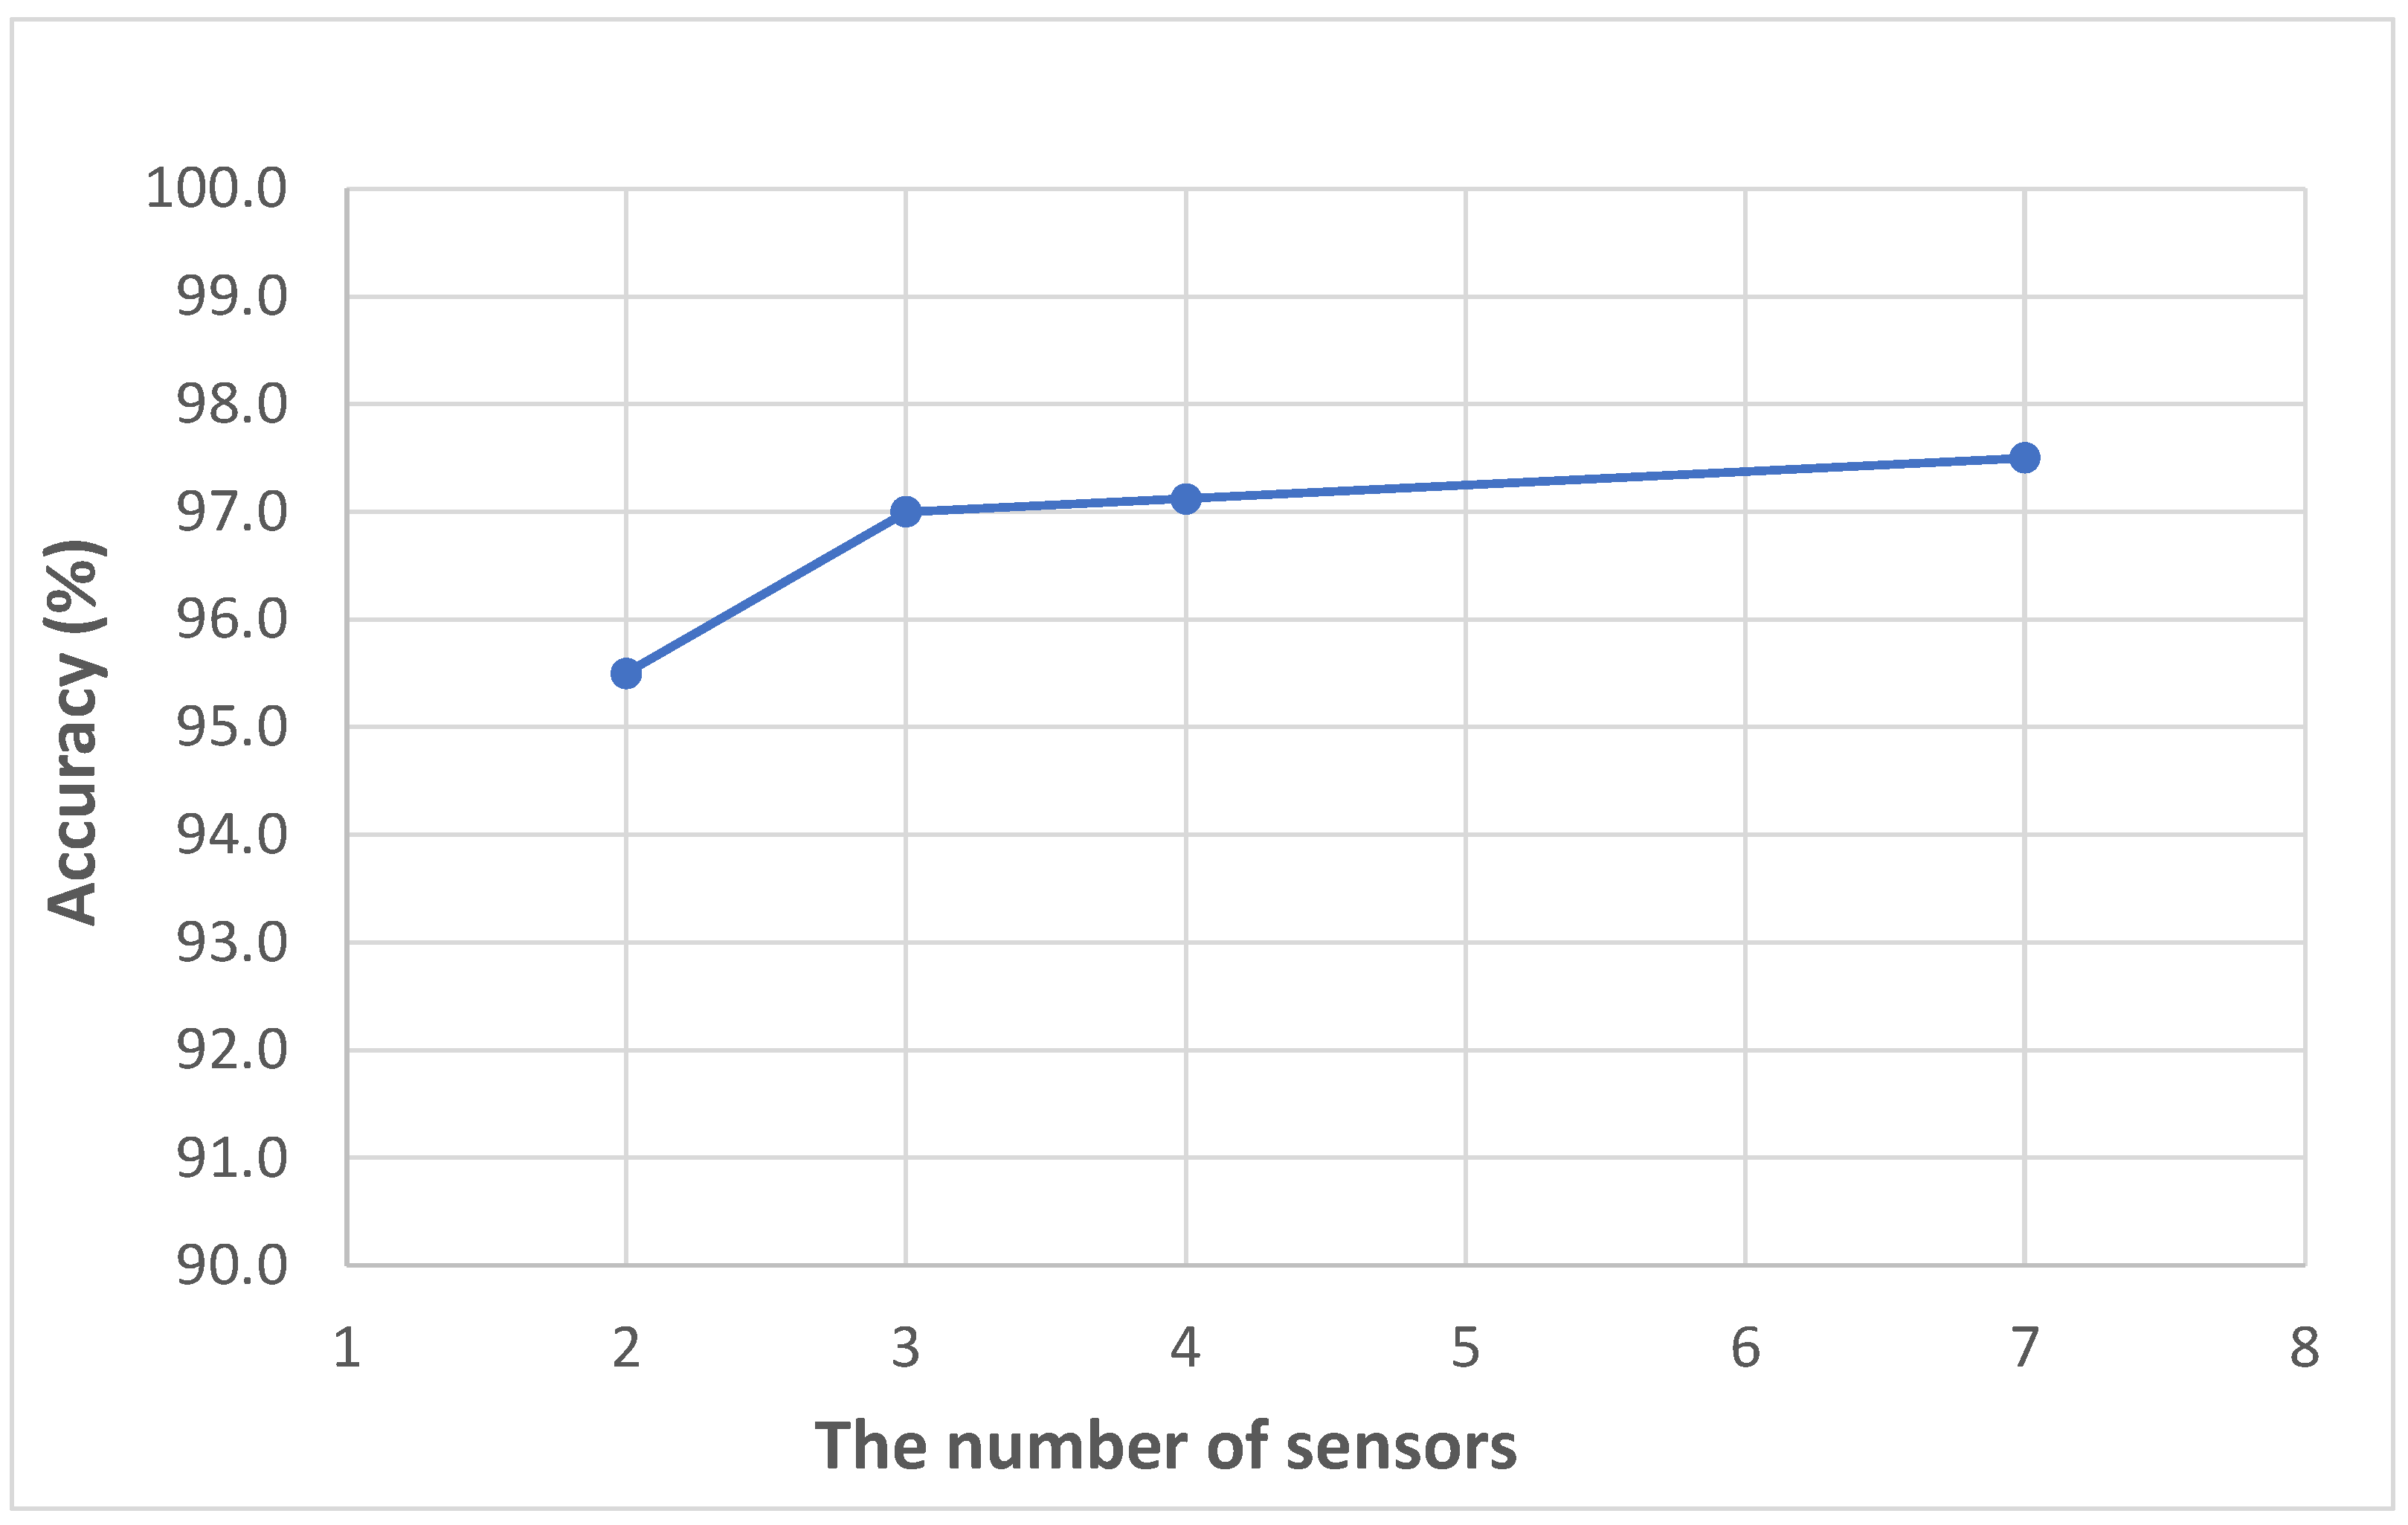
The comparison of training accuracy based on the number of sensors used is then performed. Four different cases are considered (i.e., 2, 3, 4, and 7 sensors located with equal intervals along the height of the building). Training is conducted based on using 44,500 samples created from Table 6. The accuracy of each case is calculated using 5000 different samples for testing to estimate DI and classified following the safety classification procedure. Figure 16 describes the result of accuracy based on the number of sensors used in this system. Applying two sensors (at the top and bottom) slightly decreases the accuracy of training. However, the number of sensors used in this system does not extremely affect to the result of accuracy. This result demonstrates the efficacy of the proposed system that can be adopted with a reasonable number of sensors even for the case of a high-rise building.

5. Conclusions

This paper proposes and experimentally validates an approach for rapid post-earthquake safety assessment of tall buildings using sparse accelerations. To this end, a 1/3-scale 18-story experimental steel building tested on the shaking table at E-Defense in Japan was considered. A brief overview of the previous work was first presented, followed by a description of the parametric model updating and online model updating methods employed for the simplified linear analysis model used to calculate the Damage Sensitive Features (DSFs) during the operation. Subsequently, validation was performed using data from a shaking-table test of the 1/3-scale 18-story experimental steel building. A CNN was trained to estimate the Maximum Interstory Drift Angle (IDA) based on the measured ground excitation and accelerations at selected floors for the 1/3-scale 18-story building. These results were then used to classify the building into one of three categories, “safe”, “restricted use”, and “unsafe”. After completion of training, the CNN evaluation was performed using testing data, achieving more than 97.1% of accuracy. The system was further validated experimentally using the large-scale experimental data from the E-defense test in Japan. The comparisons of the safety assessment approaches with and without online model updating showed that updating the linear state-space model using the SRIM method is effective for obtaining accurate DSFs. Applying ground excitation and DSFs after the nonparametric model updating led to the correct classification of all experimental cases. Finally, the cost-benefit analysis of this system was introduced, where the significance of the initial and maintenance cost was discussed. These evaluations concluded that the proposed approach for high-rise buildings indicates that the building condition can be determined rapidly after a seismic event occurs.

Author Contributions

Conceptualization, K.T., Y.N.; formal analysis, K.T., Y.N.; methodology, K.T.; software, K.T., Y.N.; supervision, B.F.S.J.; validation, K.T., Y.N.; visualization, K.T.; writing—original draft preparation, K.T.; writing—review and editing, K.T., Y.N., B.F.S.J.; All authors have read and agreed to the published version of the manuscript.

Funding

This research was funded by the Design Department of Taisei Corporation.

Institutional Review Board Statement

Not applicable.

Informed Consent Statement

Not applicable.

Data Availability Statement

Not applicable.

Acknowledgments

The first author was supported by a fellowship from the Design Department of Taisei Corporation, this generous support is gratefully acknowledged. The authors also wish to thank the National Research Institute for Earth Science and Disaster Resilience (NIED) in Japan for the use of data from part of a project “Special Project for the Maintenance and Recovery of Functionality in Urban Infrastructure” financed by MEXT in Japan.

Conflicts of Interest

The authors declare no conflict of interest.

References

  1. Takewaki, I.; Murakami, S.; Fujita, K.; Yoshitomi, S.; Tsuji, M. The 2011 off the Pacific coast of Tohoku earthquake and response of high-rise buildings under long-period ground motions. Soil Dyn. Earthq. Eng. 2011, 31, 1511–1528. [Google Scholar] [CrossRef] [Green Version]
  2. Government of Japan. Website of the Cabinet Office. Available online: http://www.kkr.mlit.go.jp/plan/daishinsai/ (accessed on 11 March 2021). (In Japanese)
  3. Ordinance for Measures Concerning Stranded Persons; Tokyo Metropolitan Government: Tokyo, Japan, 2013.
  4. Shirahama, Y.; Yoshimi, M.; Awata, Y.; Maruyama, T.; Azuma, T.; Miyashita, Y.; Mori, H.; Imanishi, K.; Takeda, N.; Ochi, T.; et al. Characteristics of the surface ruptures associated with the 2016 Kumamoto earthquake sequence, central Kyushu, Japan. Earth Planets Space 2016, 68, 191. [Google Scholar] [CrossRef] [Green Version]
  5. ATC-20-1. Field Manual: Postearthquake Safety Evaluation of Buildings; Applied Technology Council: Redwood City, CA, USA, 2005. [Google Scholar]
  6. The Japan Building Disaster Prevention Association. Postearthquake Quick Inspection of Damaged Buildings. Available online: http://www.kenchiku-bosai.or.jp/files/2013/11/epanfall.pdf (accessed on 17 October 2020).
  7. Website of The Japan Building Disaster Prevention Association. Available online: http://www.kenchiku-bosai.or.jp/assoc/oq-index/ (accessed on 17 October 2020). (In Japanese).
  8. Tokyo Metropolitan Government. Statistical Yearbook of Tokyo Metropolitan. Available online: https://www.toukei.metro.tokyo.lg.jp/homepage/ENGLISH.htm (accessed on 17 October 2020).
  9. City and County of San Francisco, Department of Building Inspection. BORP Guidelines for Engineers. Available online: https://sfdbi.org/borp#:~:text=The%20program%20allows%20San%20Francisco,consists%20of%20three%20basic%20phases/ (accessed on 25 April 2021).
  10. Casciati, F.; Gamba, P.; Giorgi, F.; Marazzi, A.; Mecocci, A. A Flexible Environment for Earthquake Rapid Damage Detection and Assessment. In Proceedings of the 1997 International Geoscience and Remote Sensing Symposium on Remote Sensing, Singapore, 3–8 August 1997; pp. 113–115. [Google Scholar]
  11. Gamba, P.; Casciati, F. GIS and image understanding for near-real-time earthquake damage assessment. Photogramm. Eng. Remote Sens. 1998, 64, 987–994. [Google Scholar]
  12. Bortoluzzi, D.; Casciati, F.; Elia, L.; Faravelli, L. Remote monitoring of urban and infrastructural areas. Earthquakes Struct. 2014, 7, 449–462. [Google Scholar] [CrossRef]
  13. Balkaya, C.; Casciati, F.; Casciati, S.; Faravelli, L.; Vece, M. Real-time identification of disaster areas by an open-access vision-based tool. Adv. Eng. Softw. 2015, 88, 83–90. [Google Scholar] [CrossRef]
  14. Xu, K.; Mita, A. Estimation of Maximum Drift of MDOF Shear Structures Using Only One Accelerometer. Struct. Health Monit. 2021, 18, 113–120. [Google Scholar]
  15. Tsuchimoto, K.; Narazaki, Y.; Hoskere, V.; Spencer, B.F. Rapid postearthquake safety evaluation of buildings using sparse acceleration measurements. Struct. Health Monit. 2021, 20, 1822–1840. [Google Scholar] [CrossRef]
  16. Mottershead, J.; Friswell, M. Model Updating In Structural Dynamics: A Survey. J. Sound Vib. 1993, 167, 347–375. [Google Scholar] [CrossRef]
  17. Beck, J.L.; Katafygiotis, S.L. Updating models and their uncertainties. I: Bayesian statistical framework. J. Eng. Mech. 1998, 124, 455–461. [Google Scholar] [CrossRef]
  18. Yuen, K.L. Bayesian Methods for Structural Dynamics and Civil Engineering; John Wiley & Sons: Hoboken, NJ, USA, 2010. [Google Scholar]
  19. Huang, Y.; Shao, C.; Wu, B.; Beck, J.L.; Li, H. State-of-the-art review on Bayesian inference in structural system identification and damage assessment. Adv. Struct. Eng. 2019, 22, 1329–1351. [Google Scholar] [CrossRef]
  20. Yuen, K.V.; Beck, J.L.; Katafygiotis, L.S. Efficient model updating and health monitoring methodology using incomplete modal data without mode matching. Struct. Control. Health Monit. 2006, 13, 91–107. [Google Scholar] [CrossRef]
  21. Mustafa, S.; Debnath, N.; Dutta, A. Bayesian probabilistic approach for model updating and damage detection for a large truss bridge. Int. J. Steel Struct. 2015, 15, 473–485. [Google Scholar] [CrossRef]
  22. Siringoringo, D.; Fujino, Y. System identification of suspension bridge from ambient vibration response. Eng. Struct. 2008, 30, 462–477. [Google Scholar] [CrossRef]
  23. Siringoringo, D.M.; Fujino, Y. System identification applied to long-span cable-supported bridges using seismic records. Earthq. Eng. Struct. Dyn. 2008, 37, 361–386. [Google Scholar] [CrossRef]
  24. Narazaki, Y.; Hoskere, V.; Spencer, B.F. Free vibration-based system identification using temporal cross-correlations. Struct. Control. Health Monit. 2018, 25, e2207. [Google Scholar] [CrossRef]
  25. Suita, K.; Suzuki, Y.; Takahachi, M. Collapse behavior of an 18-story steel moment frame during a shaking table test. Int. J. High-Rise Build. 2015, 4, 171–180. [Google Scholar]
  26. Mita, A.; Hirai, K.; Ozawa, S. Design Strategy of Structural Health Monitoring System Consisting of Four Sensors for Tall Buildings. In Proceedings of the 8th European Workshop on Structural Health Monitoring, Bilbao, Spain, 5–8 July 2016. [Google Scholar]
  27. Tsang, H.-H.; Su, R.; Lam, N.T.K.; Lo, S.H. Rapid assessment of seismic demand in existing building structures. Struct. Des. Tall Spéc. Build. 2009, 18, 427–439. [Google Scholar] [CrossRef]
  28. Port and Airport Research Institute. Large Size Structure Laboratory. Available online: https://www.pari.go.jp/unit/kozo/facilities/facility1.html. (accessed on 11 March 2021). (In Japanese).
  29. ASCE. Minimum Design Loads for Buildings and Other Structures; American Society of Civil Engineers: Reston, VA, USA, 2010. [Google Scholar]
  30. JSCA. The guide to safe buildings. In JSCA Performance-Based Seismic Design; Japan Structural Consultants Association: Tokyo, Japan, 2018. (In Japanese) [Google Scholar]
  31. Kitamura, H.; Miyauchi, Y.; Fukushima, J.; Fukada, Y.; Mori, N. Study on standard for judging structural performance in performance-based design. J. Struct. Constr. Eng. AIJ 2004, 576, 47–54. [Google Scholar] [CrossRef] [Green Version]
  32. Sohn, H.; Farrar, C.R. Damage diagnosis using time series analysis of vibration signals. Smart Mater. Struct. 2001, 10, 446–451. [Google Scholar] [CrossRef] [Green Version]
  33. Levi, E.C. Complex-curve fitting. IEEE Trans. Autom. Control. 1959, 4, 37–44. [Google Scholar] [CrossRef]
  34. de Vries, D.K.; van den Hof, P.M.J. Frequency domain identification with generalized orthonormal basis functions. IEEE Trans. Autom. Control. 1998, 43, 656–669. [Google Scholar] [CrossRef] [Green Version]
  35. Ho, B.L.; Kalman, R.E. Effective Construction of Linear State Variable Models from Input/Output Data. at-Automatisierungstechnik 1966, 14, 545–548. [Google Scholar] [CrossRef]
  36. Juang, J.N. Applied System Identification; Prentice-Hall, Inc.: Hoboken, NJ, USA, 1994. [Google Scholar]
  37. Kim, S.B.; Spencer, B.F.; Yun, C.-B. Frequency Domain Identification of Multi-Input, Multi-Output Systems Considering Physical Relationships between Measured Variables. J. Eng. Mech. 2005, 131, 461–472. [Google Scholar] [CrossRef]
  38. Juang, J.-N. System Realization Using Information Matrix. J. Guid. Control. Dyn. 1997, 20, 492–500. [Google Scholar] [CrossRef]
  39. Juang, J.N.; Cooper, J.E.; Wright, J.R. An eigensystem realization algorithm using data correlations (ERA/DC) for modal parameter identification. Control. Theory Adv. Technol. 1988, 4, 5–14. [Google Scholar]
  40. Wilson, E.; Habibullah, A. Sap 2000 Integrated Finite Element Analysis and Design of Structures Basic Analysis Refence Manual; Computers and Structures: Berkeley, CA, USA, 1998. [Google Scholar]
  41. Federal Emergency Management Agency, FEMA-356. Prestandard and Commentary for Seismic Rehabilitation of Buildings; Federal Emergency Management Agency: Washington, DC, USA, 2000.
  42. Arakawa, T.; Yamamoto, K. Frequencies and damping ratios of a high rise building based on microtremor measurement. In Proceedings of the 13th World Conference on Earthquake Engineering, Vancouver, BC, Canada, 1–6 August 2004. [Google Scholar]
  43. Baber, T.T.; Wen, Y.-K. Random vibration of hysteretic degrading systems. J. Eng. Mech. Div. 1981, 107, 1069–1087. [Google Scholar] [CrossRef]
  44. Wen, Y.K. Equivalent linearization for hysteretic systems under random vibration. J. Appl. Mech. 1980, 47, 150–154. [Google Scholar] [CrossRef]
  45. Bouc, R. Force vibration of mechanical systems with hysteresis. In Proceedings of the 4th Conference Nonlinear Oscillation, Prague, Czech Republic, 5–9 September 1967; p. 315. [Google Scholar]
  46. Building Performance Standardization Association. Typical Measured Historical Earthquake in Japan. Available online: https://www.seinokyo.jp/jsh/top/ (accessed on 11 March 2021). (In Japanese).
  47. Soong, T.T.; Grigoriu, M. Random Vibration of Mechanical and Structural Systems; NASA STI/Recon Technical Report A; NASA: Washington, DC, USA, 1993; Volume 93, p. 14690. [Google Scholar]
  48. Bogdanoff, J.L.; Goldberg, J.E.; Bernard, M.C. Response of a simple structure to a random earthquake-type disturbance. Bull. Seismol. Soc. Am. 1961, 51, 293–310. [Google Scholar] [CrossRef]
  49. Laina, I.; Rupprecht, C.; Belagiannis, V.; Tombari, F.; Navab, N. Deeper Depth Prediction with Fully Convolutional Residual Networks. In Proceedings of the 2016 Fourth International Conference on 3D Vision (3DV), Stanford, CA, USA, 25–28 October 2016; Institute of Electrical and Electronics Engineers (IEEE): Piscataway, NJ, USA, 2016; pp. 239–248. [Google Scholar]
  50. Zwald, L.; Lambert-Lacroix, S. The berhu penalty and the grouped effect. arXiv 2012, arXiv:1207.6868. [Google Scholar]
  51. Li, B.; Kiureghian, A.D. Operational modal identification using variational bayes. Mech. Syst. Signal Process. 2017, 88, 277–398. [Google Scholar] [CrossRef] [Green Version]
  52. Li, B.; Au, S.-K. An expectation-maximization algorithm for Bayesian operational modal analysis with multiple (possibly close) modes. Mech. Syst. Signal Process. 2019, 132, 490–511. [Google Scholar] [CrossRef]
  53. Application of Structural Health Monitoring and Validation of Operation Services. Available online: http://www.nilim.go.jp/lab/ieg/tasedai/shiryou/091030_1_5_2.pdf (accessed on 3 April 2021). (In Japanese).
  54. Implementation of Shelter Guidance System for Commuters Who Are Unable to Return Home Based on Structural Health Monitoring. Available online: https://www.jst.go.jp/ristex/funding/files/JST_1115131_13418904_mita_ER.pdf (accessed on 3 April 2021). (In Japanese).
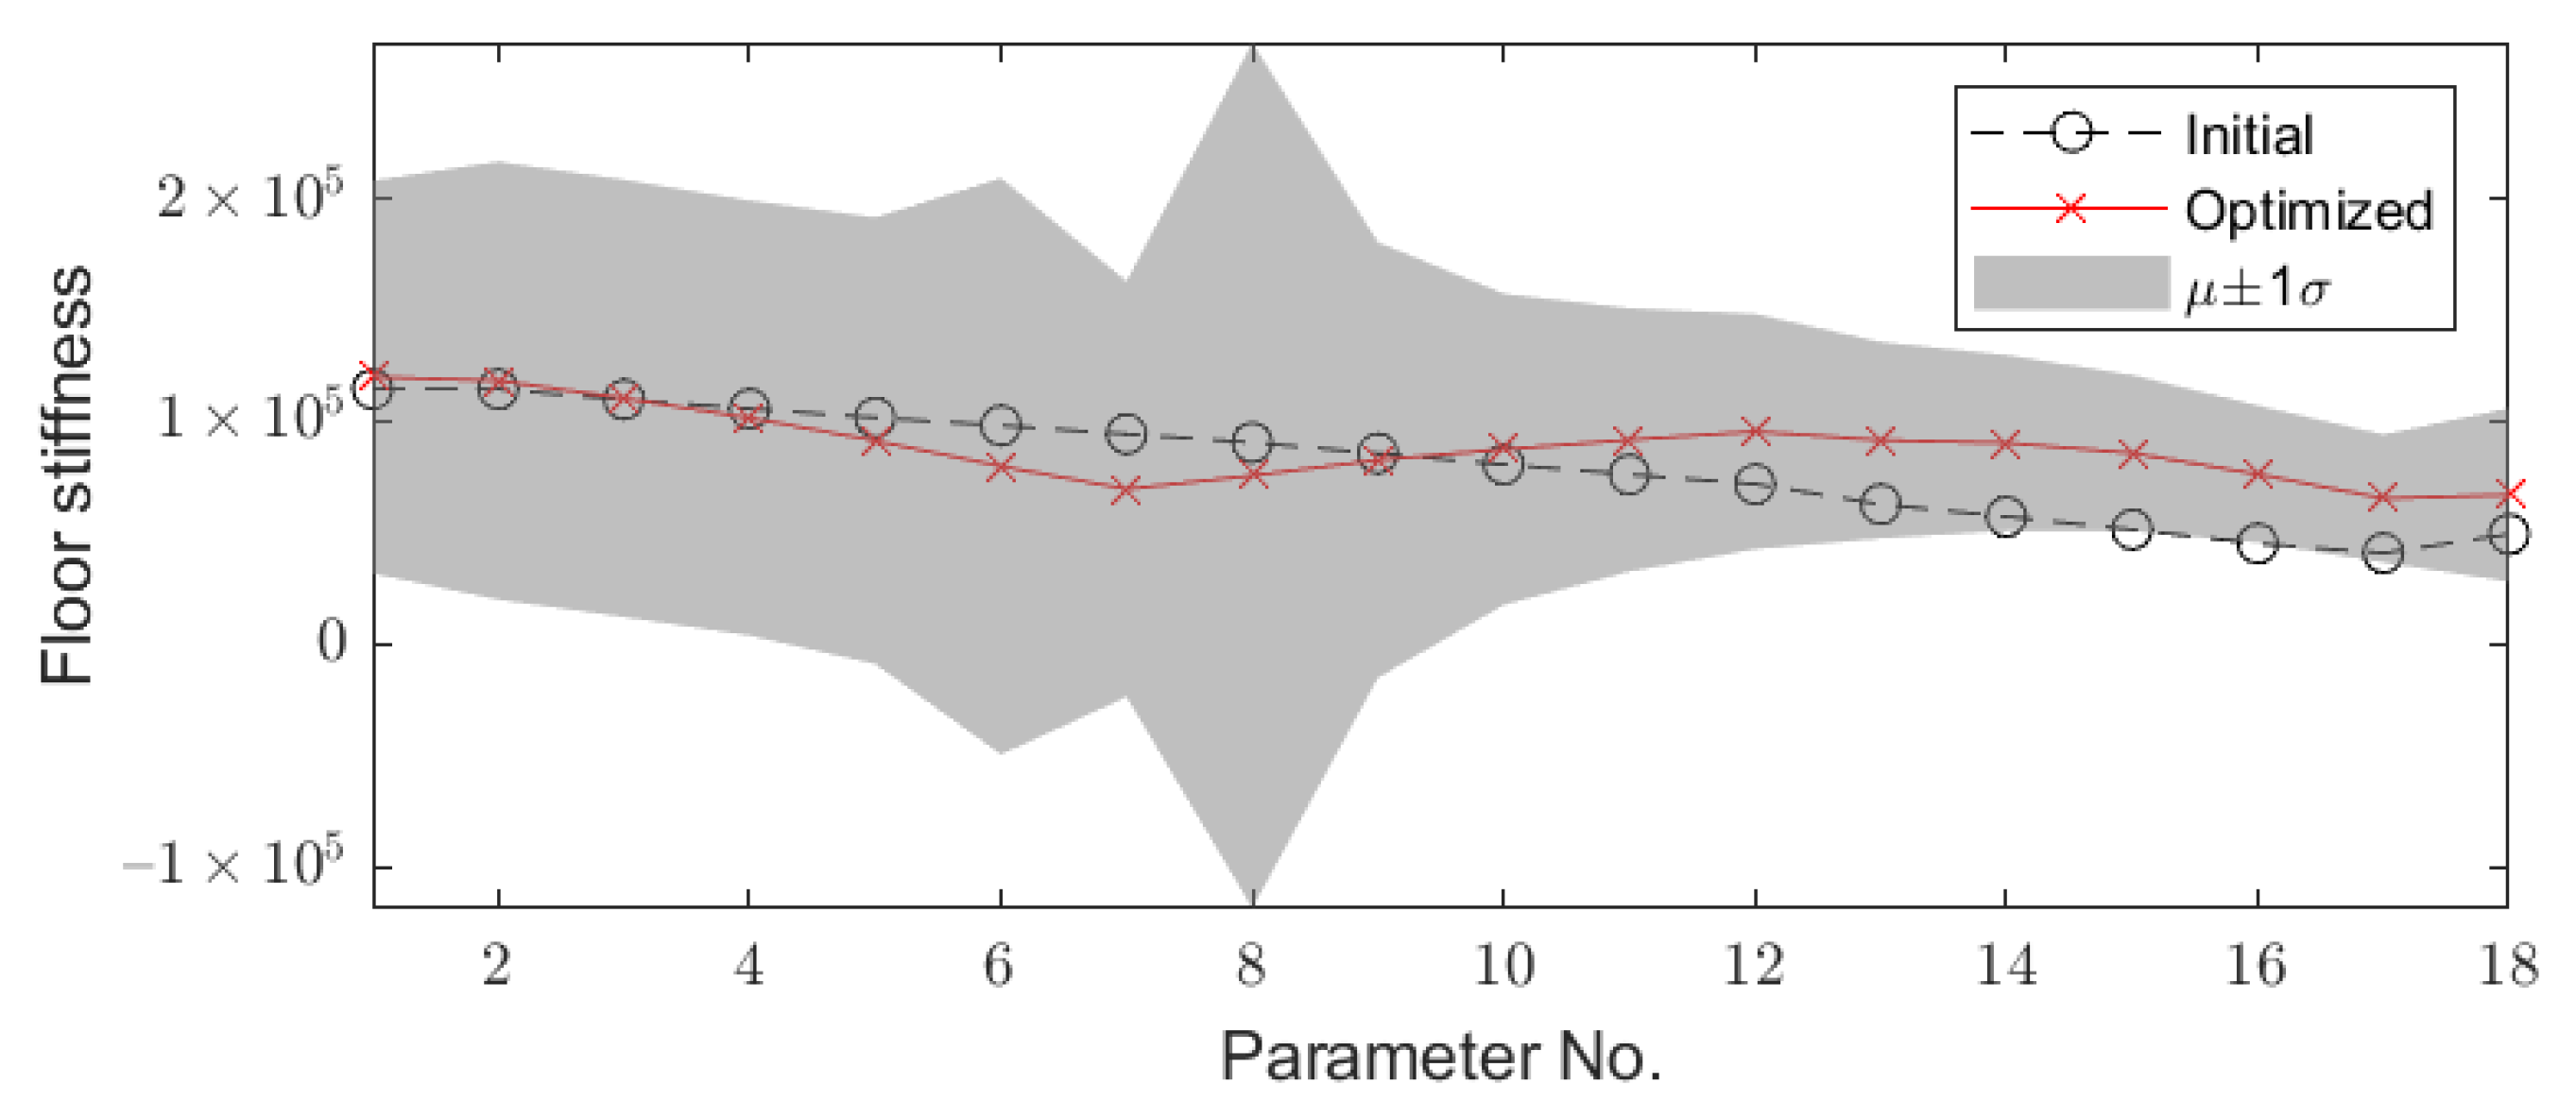
Figure 1. Example BMU results (floor stiffness, reference: Modal information from the 3D model).
Mathematics 09 01758 g001
Figure 2. Overview of a 1/3-scale 18-story steel building structure (left) and collapsed situation of lower stories (right).
Mathematics 09 01758 g002
Figure 3. Framing plan and elevation of a 1/3-scale steel building: (a) Framing plan; (b) framing elevation plan.
Mathematics 09 01758 g003
Figure 4. The 18-story steel experimental structural analysis model: (a) Three-dimensional view; (b) plan view; (c) elevation view (y-axis).
Mathematics 09 01758 g004
Figure 5. Comparison of 1st to 3rd mode shapes between the 3D and simplified planar model (y-direction).
Mathematics 09 01758 g005
Figure 6. Comparison of response accelerations between the 3D and simplified planar model (y-direction).
Mathematics 09 01758 g006
Figure 7. Mean value of damage sensitive features (DSFs, 6th, 12th, and 18th story).
Mathematics 09 01758 g007
Figure 8. Transition of cost function (Reverse Huber) between the prediction and true value.
Mathematics 09 01758 g008
Figure 9. Scatter plot between the estimated and true values for the maximum IDA.
Mathematics 09 01758 g009
Figure 10. Safety evaluation using the confusion matrix.
Mathematics 09 01758 g010
Figure 11. Comparison of time history response accelerations using experimental input excitation: (a) Measured and linear model fitted to the 3D model by parametric model updating (BMU method); (b) measured and updated linear model fitted to the experimental data by nonparametric system identification (SRIM method).
Mathematics 09 01758 g011
Figure 12. Example of four windows (3001 data points) selected to contain the maximum acceleration of DSF for Experiment 2.
Mathematics 09 01758 g012
Figure 13. Scatter plot between predictions and true values from experimental data: (a) Results of estimation using four window cases (red: Experimental cases 1−7 of Table 3); (b) results of estimation using the maximum DI from four window cases.
Mathematics 09 01758 g013
Figure 14. Safety classification using the confusion matrix with the BMU and SRIM methods: (a) Results of confusion matrix using parametric model updating (BMU method); (b) results of confusion matrix using nonparametric system identification (SRIM method).
Mathematics 09 01758 g014
Figure 15. Percentage cost of sensors from the total cost.
Mathematics 09 01758 g015
Figure 16. Comparison of training accuracy based on the number of sensors used.
Mathematics 09 01758 g016
Table 1. Relationship between the RC moment frame system and maximum interstory drift angle [30].
Building ConditionNo DamageMinor DamageDamageExtreme Damage
Maximum drift angle1/3001/1501/1001/75
Residual crack widthLess than 0.2 mm0.2 mm0.2–1.0 mmMore than 1.0 mm
RepairNo needMinor repairRepair of crack
Small-scale repair
Repair of crack
Large-scale repair
Table 2. Relationship between the steel moment frame system and maximum interstory drift angle [30].
Building ConditionNo DamageMinor DamageDamageExtreme Damage
Maximum drift angle1/2001/1501/1001/75
Ductility ratio μ 1.02.03.04.0
RepairNo needMinor repairSmall-scale repairLarge-scale repair
Table 3. Results of shaking table test and its safety classification.
Exp.pSv
(cm/s)
Maximum Drift AngleDamage StateSafety Classification
1161/556 (at 14th floor)No damage (elastic)Safe
2401/171 (at 14th floor)No damage (elastic)Restricted use
3811/110 (at 3rd and 14th floor)2nd–4th floor beam end yieldedRestricted use
4 and 51101/90 and 1/91 (at 14th floor)2nd–7th floor beam end and column base yieldedUnsafe
6 and 71801/62 and 1/55 (at 11th floor)2nd–14th floor beam end yieldedUnsafe
Table 4. Parameters of Bouc-Wen hysteresis curve for the 18-DOF shear-building model.
StoryFloor Height (m)Mass (kN)Stiffness (105 kN/m) d y i   ( cm ) α i   A i   n i   β i   γ i  
11.70230.51.201.280.031.020.50.5
21.35230.51.181.140.041.020.50.5
31.35230.51.101.140.041.020.50.5
41.35230.51.021.140.041.020.50.5
51.35230.50.911.140.051.020.50.5
61.35230.50.801.140.051.020.50.5
71.35230.50.700.910.061.020.50.5
81.35230.50.761.140.071.020.50.5
91.35230.50.831.140.071.020.50.5
101.35230.50.871.140.071.020.50.5
111.35230.50.921.140.071.020.50.5
121.35230.50.951.140.071.020.50.5
131.35230.50.921.140.071.020.50.5
141.35230.50.901.140.071.020.50.5
151.35230.50.861.140.071.020.50.5
161.35230.50.761.140.071.020.50.5
171.35230.50.651.140.071.020.50.5
181.35230.50.671.140.071.020.50.5
Table 5. Comparison of natural periods between 3D and simplified planar model (y-direction).
Mode3D Model (s)Simplified Model (s)
1st1.181.18
2nd0.390.39
3rd0.220.25
Table 6. Parameter range for input ground motion.
ContentsRange
Power intensity ( G s )0.01–0.10
Natural period (s)0.20–3.00
Damping coefficient0.20–0.50
Time duration (s)60.0
Envelope ( γ 1 )0.15, 0.30, 0.45, and 1.50
Envelope ( γ 2 )0.06, 0.11, 0.17, and 0.55
Table 7. Parameter range for the simplified nonlinear model.
ContentsRange
Secondary slope α true ± 1.4 %   of   α true
Yielding point x y ,   true ± 12 %   of   x y , true
Table 8. Summary of each hidden layer in CNN.
Input LayerThe size of inputs: 4 × 3001
(Ground acceleration, 6th, 12th, and 18th floor of DSFs)
Convolutional layer1st convolutional layer
Learnable filter size: 4 × 10
The number of filters: 256
Stride: 1
Activation function: relu
2nd convolutional layer
Learnable filter size: 1 × 10
The number of filters: 256
Stride: 1
Activation function: relu
3rd convolutional layer
Learnable filter size: 1 × 10
The number of filters: 256
Stride: 1
Activation function: relu
4th convolutional layer
Learnable filter size: 4 × 10
The number of filters: 256
Stride: 1
Activation function: relu
Pooling layerMaximum pooling layer: 1 × 5
Fully connected layerThe number of fully connected layers: 2 layers
The number of cells: 1024 each
Activation function: relu
Output layerThe size of output: 1 (maximum interstory drift angle of all floors)
Publisher’s Note: MDPI stays neutral with regard to jurisdictional claims in published maps and institutional affiliations.