1. Introduction
Breast cancer is one of the main causes of cancer death worldwide. Computer-aided diagnosis systems aim to reduce the cost of diagnosis while maintaining the same efficiency of the process. Conventional classification methods depend on feature extraction methods, and to overcome many difficulties of those feature-based methods, deep learning techniques are becoming important approaches to adopt.
Breast cancer classifiers use different methods and different data. Some methods use images [
1,
2,
3], some use biological data [
4,
5], and some integrate many types of data [
6,
7].
Many recent studies have incorporated deep learning, and especially Deep Forest in their studies. Deep forest is still a young research area. However, a lot of work has shown promising results for employing this model in healthcare systems and bioinformatics. For example, reference [
8] presents GcForest-PPI, which is a model that uses Deep Forest for the prediction of protein–protein interaction networks. Their model showed and enhanced prediction accuracy and a suggested improvement in drug discovery. The work in reference [
9] combined Deep Forest and autoencoders, for the prediction of lncRNA-miRNA interaction, and their model showed improved results. Additionally, reference [
10] uses deep learning with Random Forests on the METABRIC dataset, to make use of the different types of data. Their results enhanced the sensitivity values by 5.1%. Additionally, several studies have used deep learning and Deep Forest with the histopathological images data and mammography images [
2,
3,
11,
12,
13].
IntClust is breast cancer subtyping technique into 10 subtypes. The IntClust subtyping is dependent on molecular drivers that are obtained using combined genomics and transcriptomic data. Pam50 is another breast subtyping method, and it consists of 5 subtypes [
14].
For breast cancer subtyping, several data combined with several techniques have been employed. Since 2011, Mendes et al. [
15] employed a clustering method with gene expression data, and showed that the subtyping obtained confirms with already established subtypes. Gene expression and methylation data have been used with different Random Forests models [
16]. The study showed that gene expression data outperforms methylation data; however, some features are only discovered using methylation. The work done in [
17] uses histopathological images, which was covered above; however, this work is specific to breast cancer. Histopathological images were used with a Stacked Sparse Autoencoder (SSAE), which is a deep learning strategy, and has shown improved performance, with an F-measure of 84.49% and an average area under Precision-Recall curve (AveP) 78.83%. Reference [
18] proposes a method that uses histopathological images and extracts features using a convolutional neural network (CNN). The CNN designed obtained an enhanced performance, which was also slightly better when different CNNs were fused. In 2017, Bejnordi et al. [
19] applied deep learning algorithms to detect lymph nodes for breast cancer in whole-slide pathology images cans and proposed an improved diagnosis.
Deep forest was used in [
20] to classify cancer subtypes, and the model suffered from overfitting and ensemble diversity challenges because of small sample size and high dimensionality of biological data. This is overcome in the use of extensive biological data in this research by employing the METABRIC dataset.
A deep learning technique has also been proposed in [
21], and it shows a higher performance than traditional machine learning methods for cancer subtype classification.
The small data size and imbalanced data problems have been addressed in [
22], where an enhanced algorithm to handle the data was proposed, combining traditional techniques with deep learning methods. The results obtained confirmed that deep learning enhances performance; in addition to that, methylation data were suggested to be effectively used to improve diagnosis of cancer.
In reference [
5], a deep neural networks model uses multi-omics data to classify breast cancer subtypes. The types of omics data used were mRNAdata, DNAmethylation data, and copy number variation (CNV), and the system achieved higher accuracy and area under curve.
Additionally, the authors in reference [
6] confirm that deep neural networks perform better than traditional methods as it automatically extracts features from raw data. The data used is copy number alteration and gene expression data for breast cancer patients (METABRIC). The model presented integrates the datasets and the performance is superior to other models.
Moreover, the authors in reference [
23] use a network propagation method with a deep embedded clustering (DEC) method to classify the breast tumors into four subtypes. Reference [
24] employs deep learning techniques for feature extraction and classification to classify breast cancer lesions using mammograms. The system achieved high accuracy using fused deep features for two datasets compared to similar methods. Additionally, Zhang et al. [
25] used a convolutional neural network (CNN) and a recurrent neural network (RNN) to classify three breast cancer subtypes using MRI data. The accuracy achieved was 91% and 83%, using CNN and CLSTM, respectively. Reference [
26] combined graph convolutional network (GCN) and convolutional neural network (CNN) to analyze breast mammograms with an accuracy of 96.10 ± 1.60%. Reference [
27] also used deep learning on histopathological images for breast cancer subtyping. Deep feature fusion and enhanced routing (FE-BkCapsNet) is used, and results achieved over 90% of accuracy.
Among many others, references [
4,
7] integrated multiple datasets to address the problem of cancer subtype classification. Xue et al. [
4] used integrated omics data for cancer subtype classification using a deep neural forest model, HI-DFNForest, proposing an improved performance. It has been shown that integration of multi-omics data may enhance cancer subtype classification. However, not all types of data are available extensively, and not all types of data add to the classification process. In addition, employing all types of data imposes the restriction of very high time requirements. In the process of diagnosis of cancer, time becomes an important issue due to the critical cases of patients. In reference [
7], it was shown that without using sampling techniques on the METABRIC dataset, the results obtained for classification of cancer subtypes are low. Additionally, there is a very big challenge regarding images, where the number of available samples is only 208, much lower than other omics data. Moreover, the techniques used to achieve the highest accuracy obtained were relatively high. In this paper, it was shown that gene expression alone can achieve comparable results on the Deep Forest configuration employed. In addition to achieving very fast performance.
The objective of this work is to extend the previous research [
7] by employing a Deep Forest model for using feature combining and classifying the generated integrative data profiles, and enhancing the previously proposed framework through using the full dimension gene expression data and examining the computational performance.
In this paper, a cascade Deep Forest is employed to classify breast cancer subtypes for both subtyping, IntClust (10 subtypes) and Pam50 (5 subtypes), using the METABRIC datasets, namely clinical, gene expression, CNA, and CNV. The full dataset is used, without dimensionality reduction, and without sampling. Several configurations for the cascade Deep Forest are employed and the results obtained are an accuracy of 83.45% for 5 subtypes and 77.55% for 10 subtypes. Other obtained performance metrics also confirm the outperformance of employing gene expression solely, where the precision, recall, specificity, F1-measure, Jaccard, Hamming loss, and Dice are 0.822, 0.774, 0.961, 0.772, 0.640, 0.225, 0.709, respectively, for 10 subtypes. The measures are 0.8421, 0.833, 0.904, 0.820, 0.711, 0.166, and 0.852, for the 5 subtypes, respectively. The precision and Dice measures are slightly higher for the integrated profile gene expression, clinical, CNA, and CNV. The significance of this work is that it is shown that using gene expression data alone with the cascade Deep Forest classifier achieves comparable accuracy to other techniques with higher computational performance, where the time recorded is about 5 s for 10 subtypes, and 7 s for 5 subtypes.
The main contribution of this paper is to:
Employ the omics METABRIC sub-datasets of gene expression, CNA, and CNV, in addition to the clinical dataset in full dimension without sampling.
Develop a cascade Deep Forest-based model for breast cancer subtype classification using multi-omics data.
Obtain comparable results using only omics data without using histopathological images.
Improve the classification time for breast cancer subtyping through using the cascade Deep Forest classifier.
The rest of this paper is organized as follows. The methods used in evaluating the employed model for breast cancer subtyping are elaborated in
Section 2. In
Section 3, experimental results are presented, followed by a discussion in
Section 4. Finally, a conclusion is presented in
Section 5.
2. Materials and Methods
The proposed system in this manuscript uses integrative clinical data and genomics data generated from the extraction and combination of the gene expression, Copy Number Aberrations (CNA), and Copy Number Variations (CNV) feature sets from the genomics dataset.
As depicted in
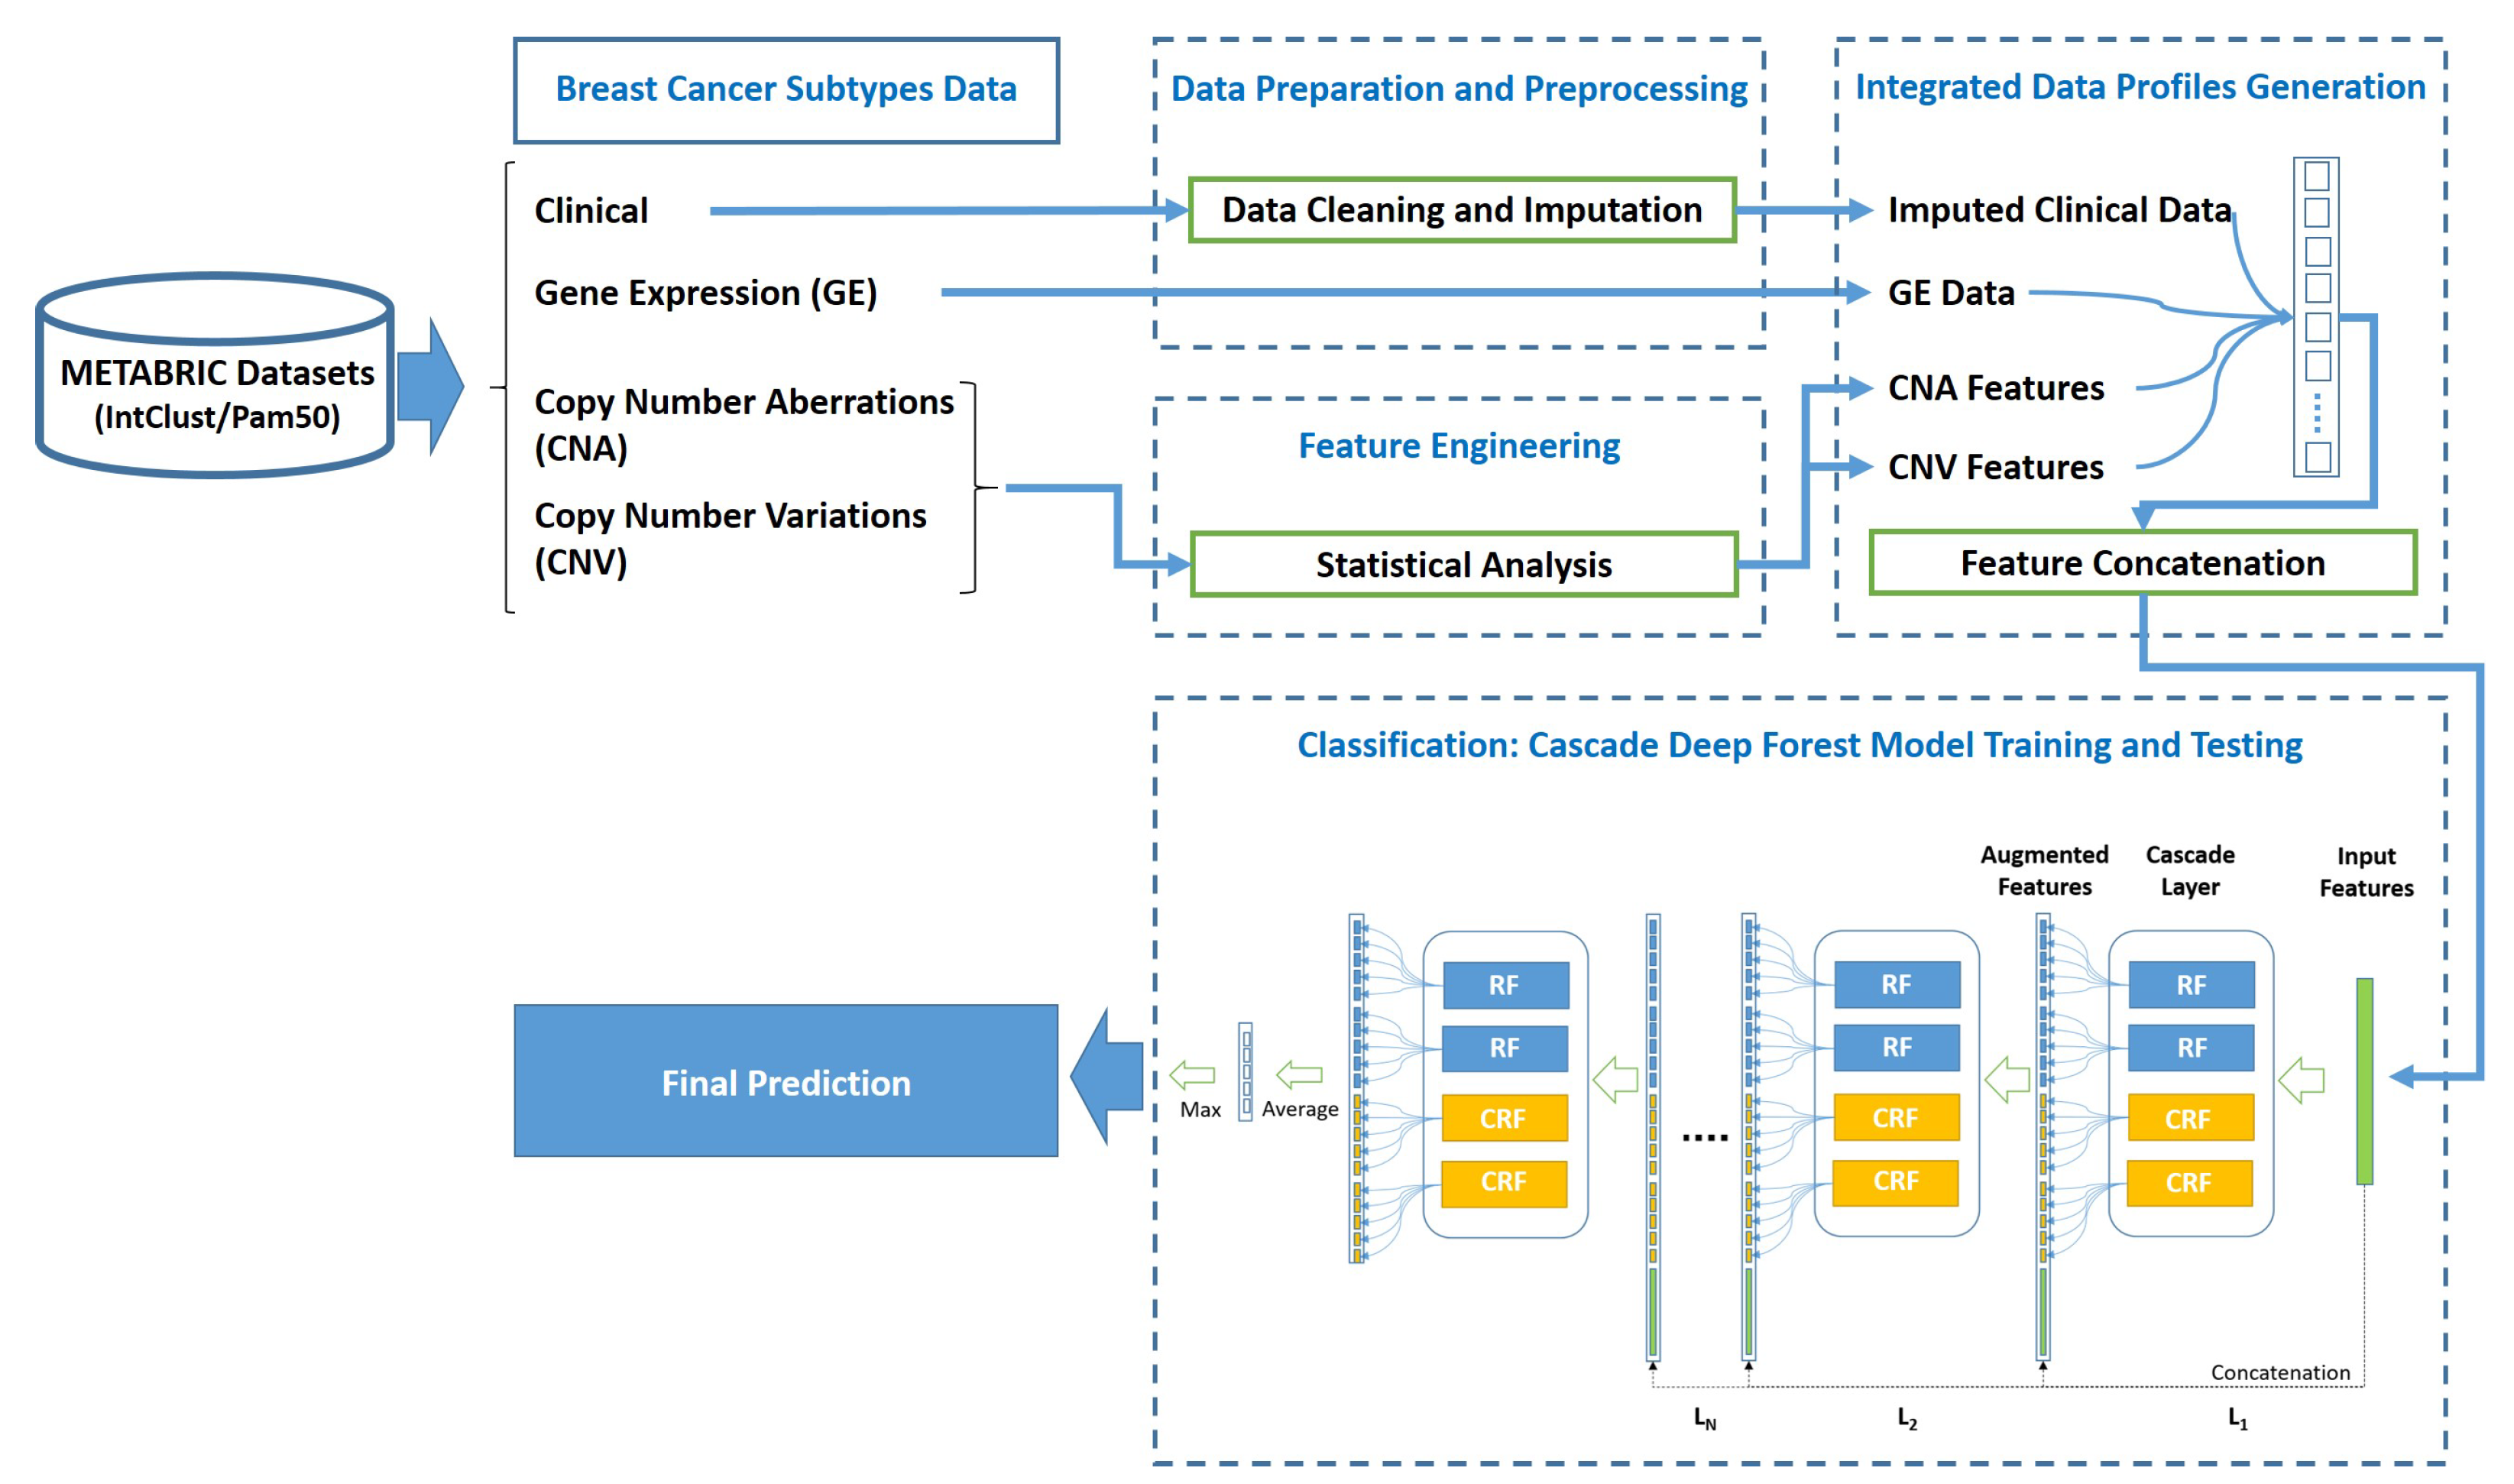
Figure 1, the proposed approach is composed of 4 phases; namely (1) Data acquisition of METABRIC breast cancer subtypes datasets, (2) Data preparation and preprocessing, (3) Integrated data profiles generation, and (4) Cascade Deep Forest-based classification.
After the first phase of four breast cancer subtypes datasets acquisition, the proposed system moves to the second phase of data preparation and preprocessing with only three sub-datasets; namely the clinical data, the features of Copy Number Aberrations (CNA) and Copy Number Variations (CNV) data types, as the fourth sub-dataset of gene expression is submitted as it is without any preprocessing to the third phase of integrated data profiles generation. In the second phase, data cleaning and imputation preprocessing are applied to the clinical data, whereas statistical analysis is applied to the CNA and CNV features. Subsequently, in phase three, the data profiles are generated by concatenating the genomics and clinical features to obtain the integrated data profiles. Finally, the stages of classification process are employed in the fourth phase for training and teasing the proposed system through using the cascade Deep Forest model. The following subsections explain each phase in more details.
2.1. Data Acquisition
In this phase the breast cancer subtypes dataset used in the conducted experiments is the METABRIC dataset that contains several sub-datasets. The datasets considered for the research conducted in this manuscript are: clinical dataset, gene expression dataset, Copy Number Aberrations (CNA) dataset, and Copy Number Variations (CNV) dataset. The source of the gene expression, CNA and CNV data are the European Genome-phenome Archive (EGA) platform with the accession number, DAC ID, EGAC00001000484 [
28]. However, the clinical data are obtained from the Synapse platform [
29]. The datasets obtained contain datasets for validation and discovery.
The clinical data available is categorized into four main categories of 27 features. First, personal, which contains only the age at diagnosis. Second, the clinical pathology data, which is data about the tumor, including, size, lymph nodes data, grade, histological type, different hormonal levels, and other features. Third, the treatment category, which indicates the type of treatment received by the patient. Fourth, survival features, which are the status and time.
The Copy Number Aberration (CNA) dataset contains a total of 13 features describing chromosome regions, namely information in somatic tissues about the markers count and mutation type. The dataset also contains information about location, including five features. In addition to, information about the number of genes in each segment and mutation type described in seven features. Similarly, the Copy Number Variation (CNV) dataset contains 13 features describing chromosome regions in germline tissues about the markers number, mutation type, location, and genes count.
The gene expression dataset contains 48,803 genes expressed using Illumina Sequenced HT 12 array v3.
At the end of breast cancer subtypes data acquisition phase, each obtained dataset is submitted to a data preparation and preprocessing module in phase 2.
2.2. Data Preparation and Preprocessing
This section presents a discussion for the datasets preparation and preprocessing.
2.2.1. Data Preparation
The METABRIC dataset was obtained as explained earlier, and the discovery part was extracted with its labels to include the clinical dataset, gene expression, CNA, and CNV sets. Each of the resulting datasets was prepared according to the following steps:
Submitting the CNA and CNV feature files to the statistical analysis feature engineering stage in the data preprocessing stage.
Submitting the clinical dataset to the preprocessing stage for data cleaning and imputation.
Transposing the gene expression data using Equation (
1), then submitting it without any preprocessing to the third phase of the proposed system, where
represents the matrix of the original gene expression data and
represents the resulted transposed matrix.
2.2.2. Data Preprocessing
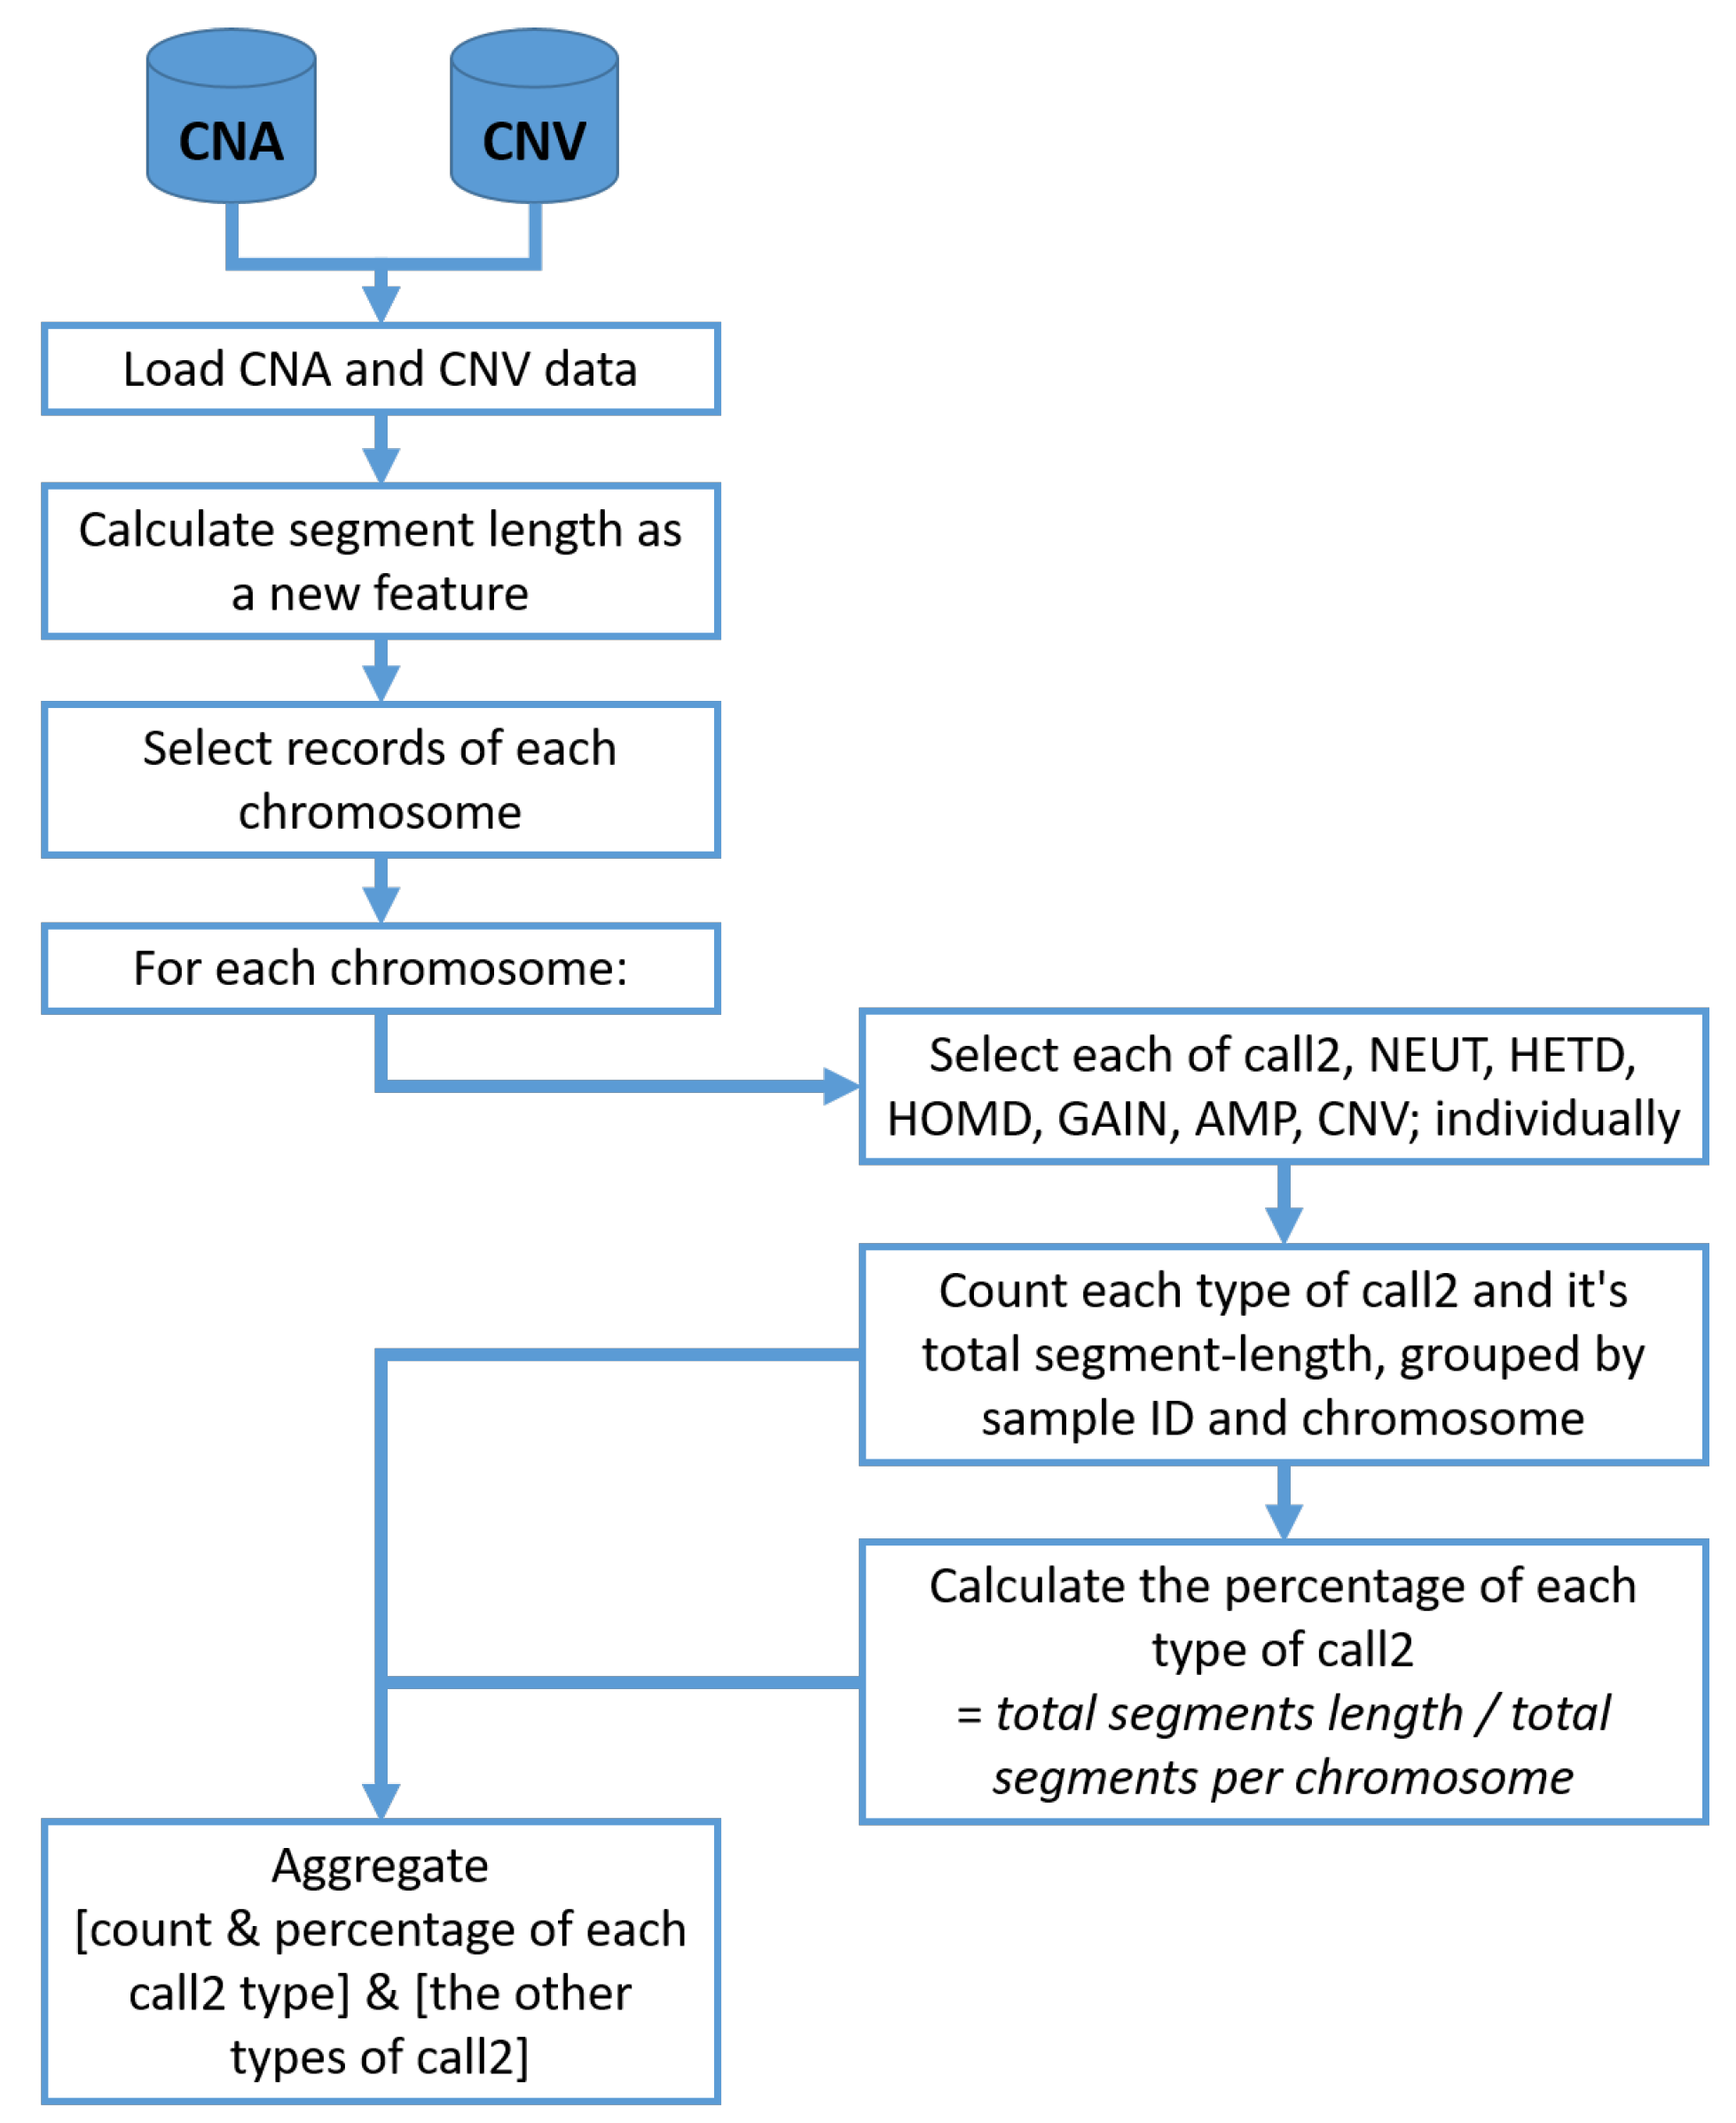
Following the preparation of data, the clinical dataset is submitted to the preprocessing stage for data cleaning and imputation. In this stage, a statistical analysis feature engineering scheme is applied to the CNA and CNV datasets. For that scheme, the frequency and the actual segment percentages Amplification (AMP), Insertions (GAIN), Homozygous Deletion (HOMD), Heterozygous Deletion (HETD) and Neutral (NEUT) were calculated for each chromosome.
Figure 2 shows the detailed steps for statistical feature engineering of CNA and CNV data.
The clinical dataset features are encoded using textual categorical encoding. First, features with missing values more than 50% (like NOT_IN_OSLOVAL_P53_mutation_type), and features with 90% blank values (like NOT_IN_OSLOVAL_P53_mutation_details) are deleted. Data imputation [
30] is performed on other features missing values with lower ratios. On the other hand, the gene expression dataset is submitted to the integrated data profiles generation phase as it is, without any preprocessing.
2.3. Integrated Data Profiles Generation
At the end of phase 2, the resulted CNA and CNV statistical feature sets, imputed clinical, and the features of gene expression datasets are submitted to phase 3 of integrated data profiles generation, to be concatenated and then generate the output set of integrated data profiles.
2.4. Cascade Deep Forest Based Classification
During phase 4 of the proposed system and after generating integrated data profiles through feature concatenation of imputed clinical data, GE data, and statistically engineered CNA and CNV data, a cascade Deep Forest model is applied for cancer subtype classification.As a preparatory step before the classification phase, the features obtained in phase 3 are split into subsets of 2/3 for training and 1/3 for testing.
The motivation for considering cascade Deep Forest model in the proposed breast cancer subtype classification approach is that conventional supervised machine learning classifiers typically work with labeled data as well as neglecting a considerable amount of data with insufficient information. Consequently, small sample size of training data limits the progress in designing appropriate classifiers. Moreover, several challenges may limit the application of common conventional machine leaning models, such as Support Vector Machine (SVM) and Random Forests, to the task of cancer subtype classification. The sounding challenge is strengthening the risk of overfitting in training, which is characterized by using small sample size and high dimensionality of biology multi-omics data. Additionally, class-imbalance is a very common situation in multi-omics data, which augments the difficulties of model learning with the risk of weakening the ability of model estimation for large sequencing bias. Although several approaches have been recently developed to address the stated challenges [
31,
32], limited alternatives are proposed with validated methods for small-scale multi-omics data. Additionally, more accurate and robust methods still need further developments for achieving accurate of breast cancer subtype classification.
On the other hand, compared to the typical architecture of convolutional deep neural networks (DNNs) with several convolutional layers and fully connected layers, the DNNs are also highly prone to overfitting, with more chances for convergence to local optimums, when providing imbalanced or relatively small-size training data. However, dropout and regularization methods are widely applied to alleviate that problem, overfitting is still an inescapable problem for DNNs. Thus, the state-of-the-art recommended the cascade Deep Forest model as an efficient alternative to DNNs for learning hyper-level representations in more optimized way.
The cascade Deep Forest model fully uses the characteristics of both deep neural networks and ensemble models. The cascade Deep Forest learn features of class distribution by assembling decision tree-based forests while supervising the input, rather than the overhead of applying forward and backward propagation algorithms to learn hidden variables as in deep neural networks [
33].
The cascade forest follows a supervised learning scheme based on layers, which employs ensemble Random Forests to obtain a class distribution of features that results in more precise classification [
20,
34]. The feature importance in the cascade Deep Forest model is not taken into account among multiple layers during the feature representation training. Accordingly, the prediction accuracy obtained is highly affected by the number of decision trees in each forest, especially with small-scale or imbalanced data, as it is critical in the construction of decision trees, where the discriminative features are used to decide splitting nodes.
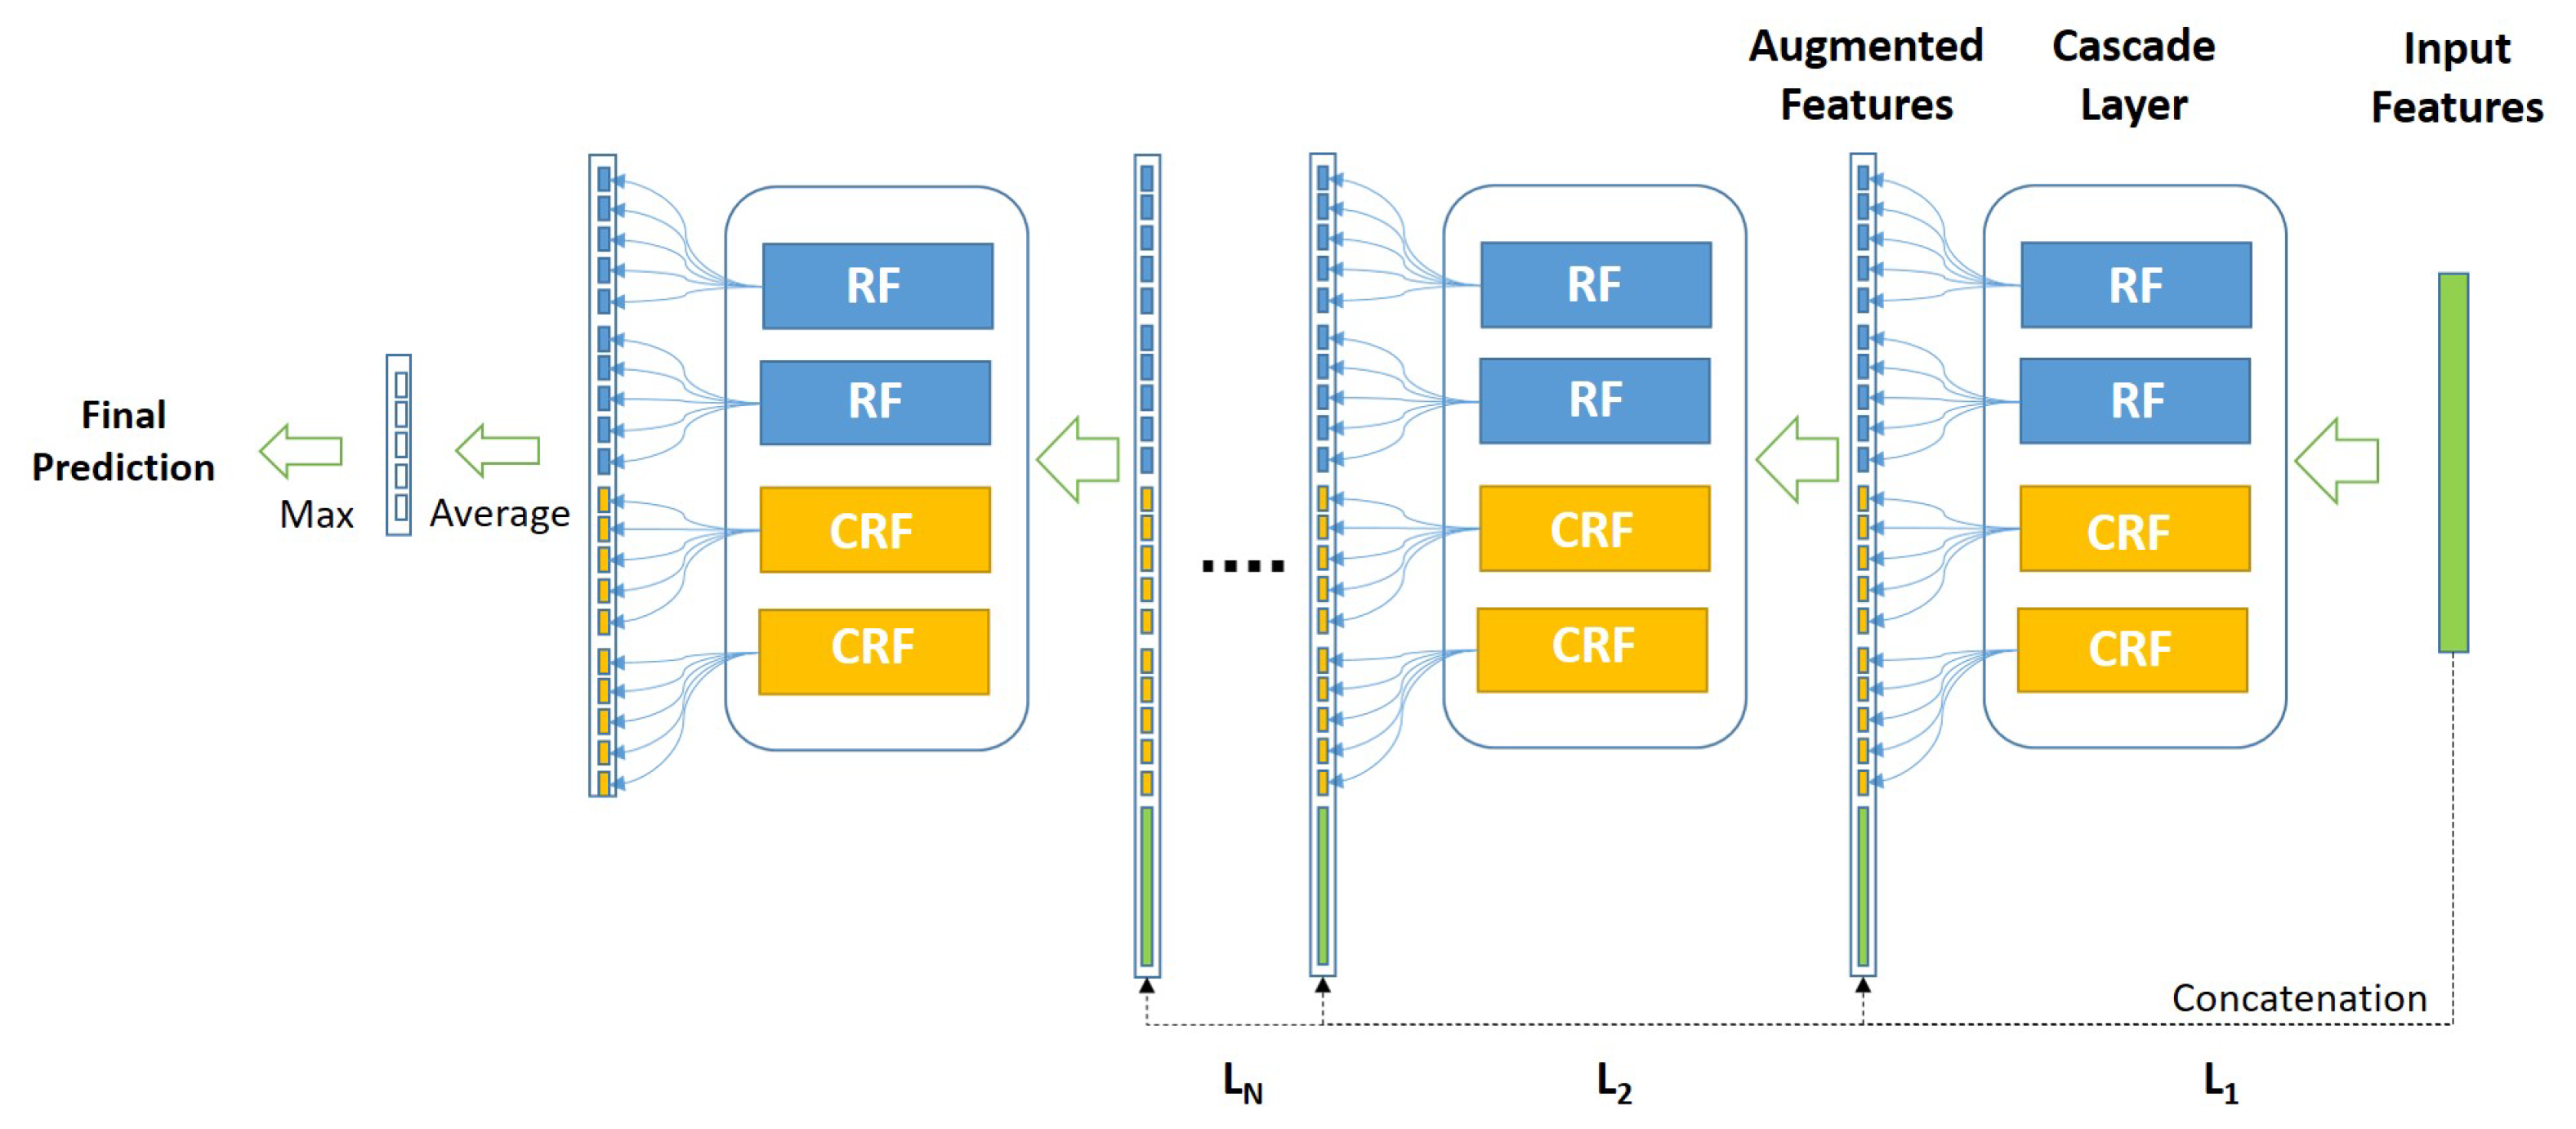
Figure 3 shows the architecture of the employed cascade forest.
As illustrated in
Figure 3, considering the used cascade Deep Forest model, each level of the cascade consists of two Random Forests (RF) (the blue blocks) and two Completely Random Forests (CRF) (the yellow blocks). Therefore, suppose there are
n subclasses to predict, then each forest should output an
n-dimensional class vector, which is then concatenated for representing the original input.
3. Results
This section shows the results for different Deep Forest configurations against the 10 subtypes (IntClust) and the 5 subtypes (Pam50). The results in this paper are obtained using the full dimension dataset of the gene expression. The experiments use the whole 48,803 features set. Initially, the Deep Forest configuration was used with the dimensionally reduced gene expression data and the accuracy results were as low as 27%. This led to using the whole gene expression dataset of 48,803 features and the performance obtained showed promising results with high configurations. The performance is shown relative to the time taken per each run. Different Deep Forest configurations were used against the 10 and 5 subtypes. The number of estimators is increased to 900 to make sure that there is no increase in the accuracy. It is not easy to decide the most fitting configuration. For the 10 subtypes, the accuracy reached is 77.55% for the gene expression dataset using 100 trees in each forest, 100 estimators, 5 layers, and 10 k-folds. with time 5:08 s. For the 5 subtypes, the highest accuracy is achieved for the gene expression data and relatively for the CNV and CNA, using 300 trees in each forest, 300 estimators, 5 layers, and 5 k-folds. This accuracy is 83.45% for gene expression, with approximately 55% of accuracy for CNV and CNA, which is comparable to other configurations regarding time. However, performance was not the highest for the clinical data. The time achieved is 7:53 s.
Both experiments were performed using different number of trees per forest and different number of estimators. Specifically, 100, 300, 500, 700 for trees and estimators, using also 900 for the 5 subtypes. Those numbers were used once with 10 layers with 10 k-fold and once with 5 layers with 5 k-fold. To be more confident about the most fitting architecture, another run using 5 layers with 10 K-fold and 10 layers with 5 k-folds was performed. An extra experiment for gene expression data was performed using another combination of layers and k-fold to confirm the results, using 5 layers with 5 k-fold and 10 layers with 10 k-fold.
3.1. Results for Breast Cancer 10 Subtypes
Table 1,
Table 2,
Table 3 and
Table 4, show the results for 10 subtypes using all datasets, except images, since the number of samples in the images dataset is much lower than other datasets. The tables show that for gene expression, the highest accuracy achieved is 77.55%, with 100 trees, 100 estimators, 5 layers, and 10 k-folds, with time of 5:08 s. For clinical data, the highest accuracy achieved is 44.22%, with 100 trees, 100 estimators, 5 layers, and 5 k-folds, with time of 0:41 s. For CNV and CNA, the accuracy achieved is 55.78% and 53.40%, respectively, with 500 trees, 500 estimators, 10 layers, 10 k-folds, with a time of 23:01 and 22:40 s, respectively.
Table 5 and
Table 6, show results of different integrated data profiles for the IntClust (10 subtypes). The highest accuracy achieved for the 10 subtypes is 75.85%, for integrating clinical data with gene expression; however, gene expression alone still achieves a higher accuracy, as reported earlier. Please note that the accuracy reported in
Table 6 is the overall accuracy, while the accuracy in the other tables is the reached max layer accuracy. This is the reason for the slight variation in the accuracy values. Moreover, the precision, recall, specificity, F1-measure, Jaccard, Hamming loss, and Dice are 0.822, 0.774, 0.961, 0.772, 0.640, 0.225, 0.709, respectively. The results of the obtained performance and statistical measures confirm the superiority of employing only gene expression.
3.2. Results for Breast Cancer 5 Subtypes
For the 5 subtypes,
Table 7,
Table 8,
Table 9 and
Table 10 show results of different datasets. For gene expression, the highest accuracy achieved is 83.45%, with 300 trees, 300 estimators, 5 layers, and 5 k-folds, with time of 7:53 s. For clinical data, the highest accuracy achieved is 76.35%, with 700 trees, 700 estimators, 10 layers, and 10 k-folds, with time of 16:28 s. For CNV, the accuracy achieved is 56.76%, with 500 trees, 500 estimators, 10 layers, 10 k-folds, with a time of 12:04 s. For CNA, the accuracy achieved is 56.42%, with 700 trees, 700 estimators, 5 layers, 5 k-folds, with a time of 3:54 s.
Table 11 and
Table 12 show results of different integrated data profiles for the Pam50 (5 subtypes) subtyping. The highest accuracy achieved for the 5 subtypes is 80.41%, for CNA, CNV, gene expression, and clinical data. Still, gene expression alone achieves a higher prediction accuracy. The slight variation in accuracy reported in
Table 6 and
Table 12 is that it is the overall accuracy, while the accuracy in the other tables is the reached max layer accuracy. In addition to the obtained accuracy, precision, recall, specificity, F1-measure, Jaccard, Hamming loss, and Dice are 0.8421, 0.833, 0.904, 0.820, 0.711, 0.166, and 0.852, respectively. The precision and Dice measures are slightly higher for the integrated profile gene expression, clinical, CNA, and CNV. However, the remaining measures are in favor of the gene expression profile, which confirm the outperformance of the suggested data profile.
4. Discussion
In this work, the experiments first make use of different Deep Forest configurations on each dataset solely. Gene expression alone significantly gave the best performance, where the accuracy was 83.45% for 5 subtypes using 300 estimators, 5 layers, 5 k-folds, and the accuracy was 77.55% for 10 subtypes using 100 estimators, 5 layers, and 10 k-folds. This was concluded after experimenting 100,300,500,700 and 900 estimators across 5, 10 layers and 5, 10 k-folds. The integration of datasets was performed by concatenating the datasets and applying the best configuration of Deep Forest to classify it. The results reached did not give any improvement over the highest accuracy reached using gene expression. However, for the 5 subtypes, the integrated profile CNA + CNV achieved 56.7%, while CNA alone achieved 55.74%, and CNV alone achieved 55.41%. For the 10 subtypes, the clinical data alone achieved 43.5%, CNV alone achieved 53.06%, and the CNA alone achieved 51.70%. The integrated clinical data with the CNA achieved 60.20%, the integrated clinical data with CNV achieved 57.82%, and the integrated clinical data with both CNA and CNV achieved 61.56%.
In the research [
7], an accuracy of 88.36% was achieved for IntClust (10 subtypes) subtyping using Linear-SVM. The accuracy achieved was using the data profile of clinical, gene expression, CNA, and CNV datasets. For the Pam50 subtyping (5 subtypes), the accuracy was 97.1% using Linear-SVM and E-SVM classifiers, with all data including histopathological images features. However, the images data are not comprehensive, as they are only available for 208 samples, unlike other data, which are extensively available for all patients in the dataset. Moreover, the time taken to obtain the above-mentioned accuracy is extensive. hence, the Deep Forest used in this paper, makes use of the gene expression data alone to achieve comparable results without using any sampling techniques. In [
7], the highest accuracy achieved used SMOTE sampling. The highest accuracy achieved among all different data profiles was 71.35% for IntClust, which was outperformed by the Deep Forest configuration in this paper, achieving 77.55%, and a running time of 5:08 s, which is extensively less than the model proposed in [
7]. For the gene expression data alone in [
7], the accuracy only reached 46.08%. Similarly, for Pam50 (5 subtypes), gene expression alone achieved 78.85%, while the highest recorded accuracy was 80.66%, without images, for the gene expression and clinical data profiles. However, the proposed Deep Forest configuration achieved up to 83.45% of accuracy and 7:53 s run time.
The current study could be further expanded by examining the technique on more datasets for breast cancer subtyping. Additionally, other deep learning methods could be employed to verify the robustness of using gene expression data.


