
Graph Theory for Primary School Students with High Skills in Mathematics


Abstract
:1. Introduction
2. Materials and Methods
2.1. Description of the Settings
- Initial challenge (Adaptation): Activity posed as a challenge aimed to create curiosity in the students so that they want to learn about the subject.
- Practice of the new concept (Structuring): We use graphs to represent routes or pathways under certain conditions.
- Abstraction (Abstraction): Graphs are used to solve a problem of greater difficulty than previous ones, where more abstract mathematical processes appear, in this case induction and generalization.
- Closing activities (Reasoning): The objective is to relate the graphs that were studied with other mathematical concepts.
2.2. Description of the Participants
3. Results
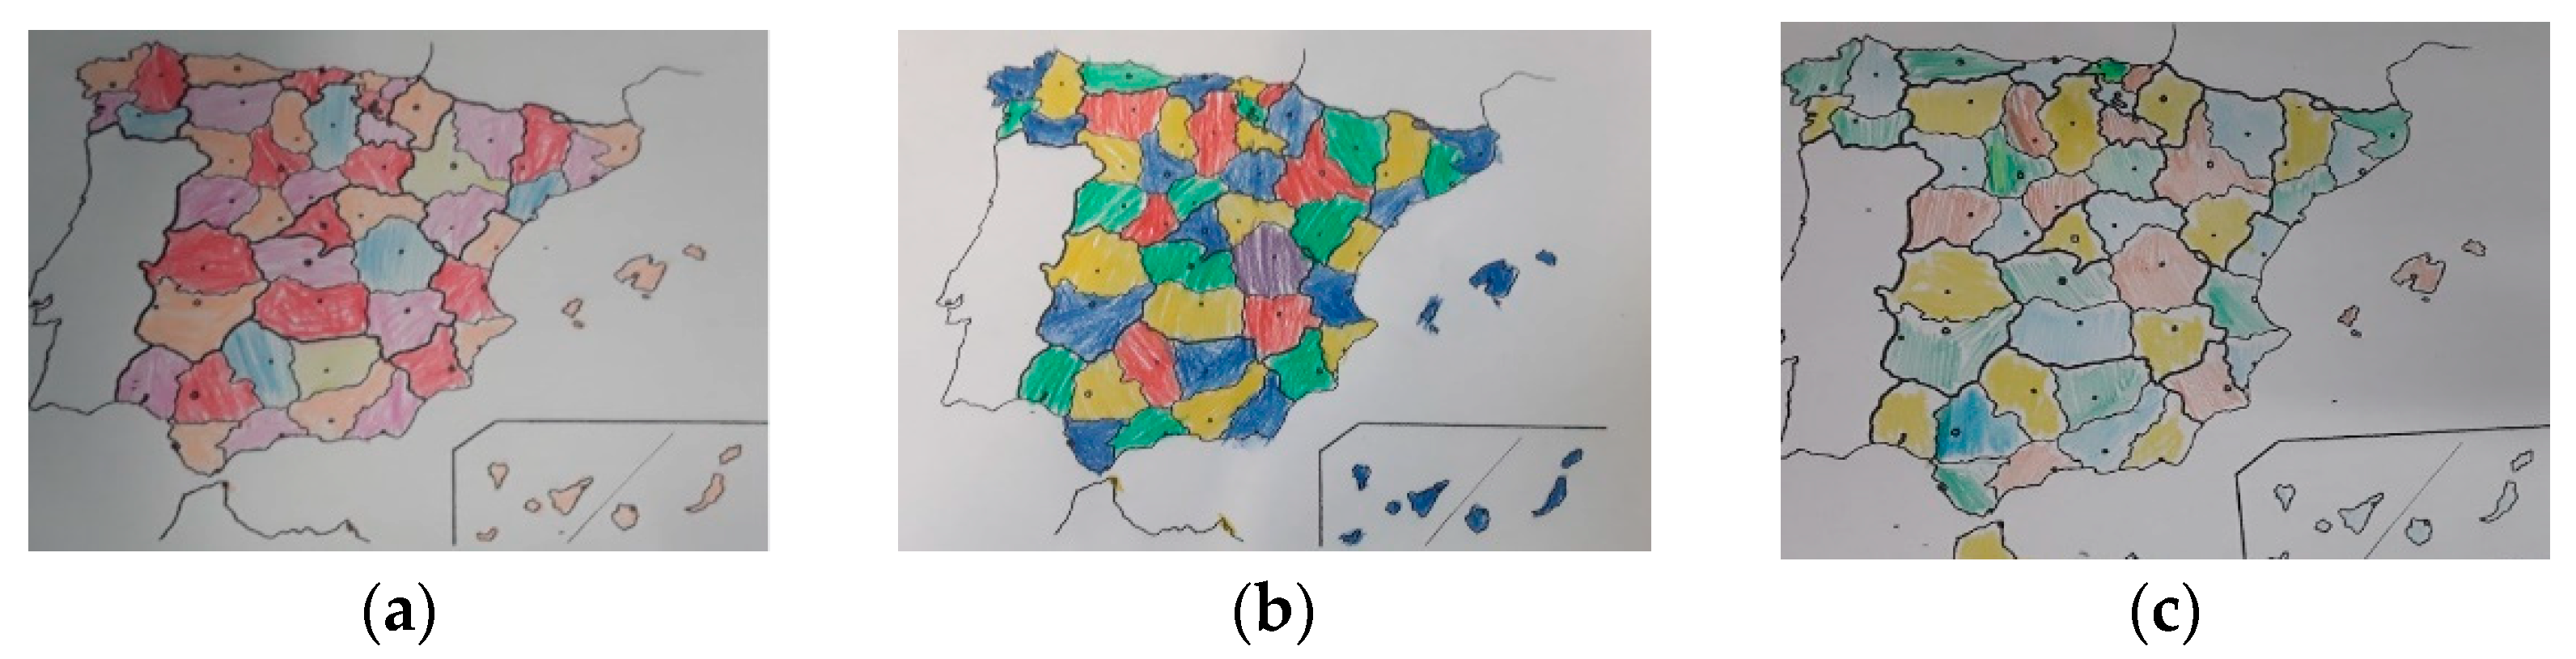
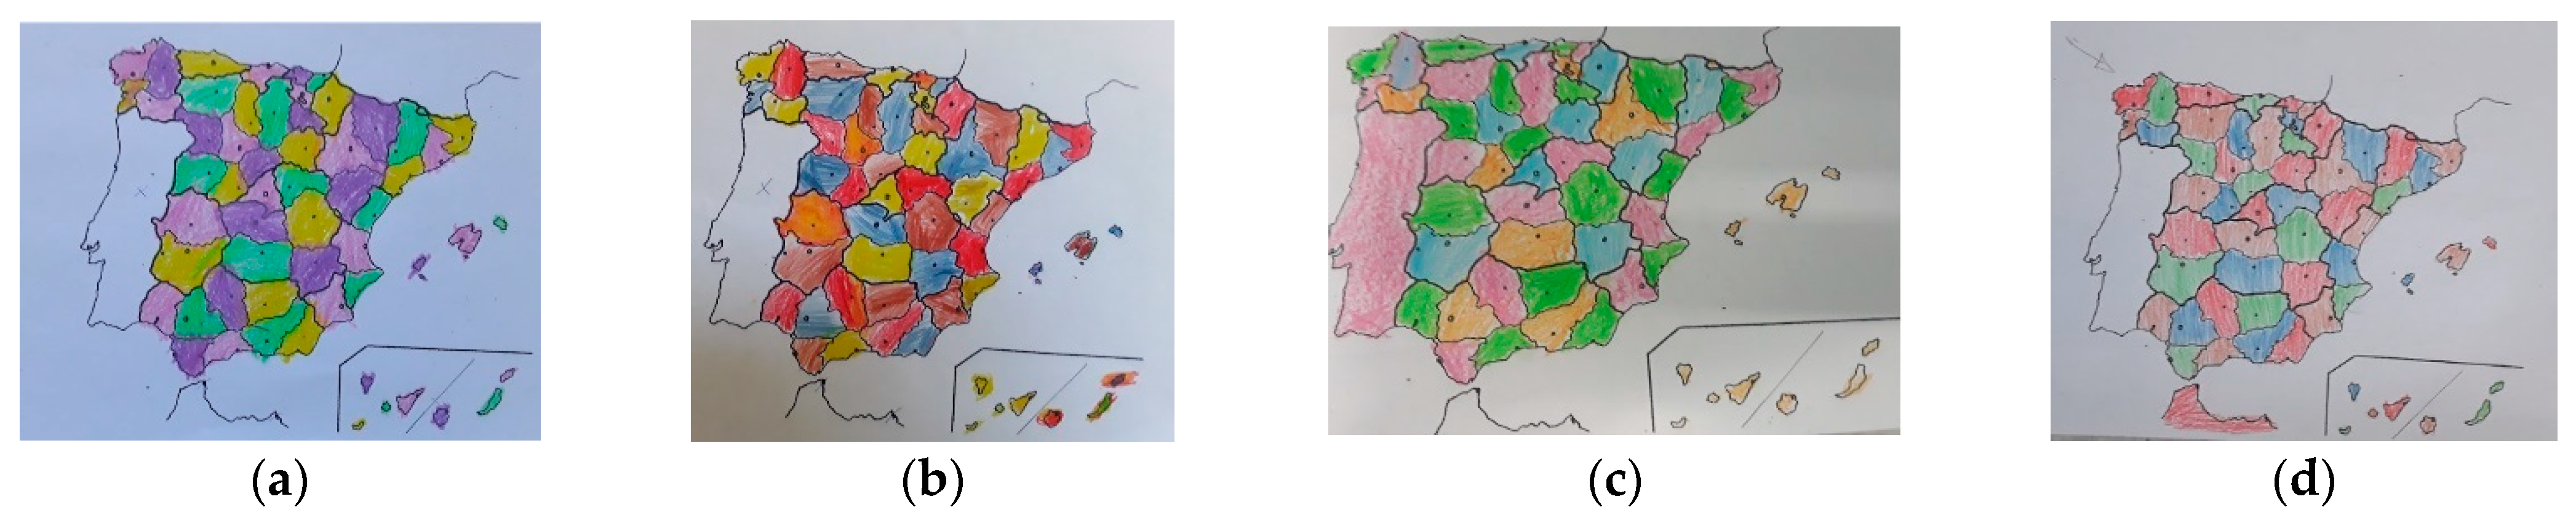
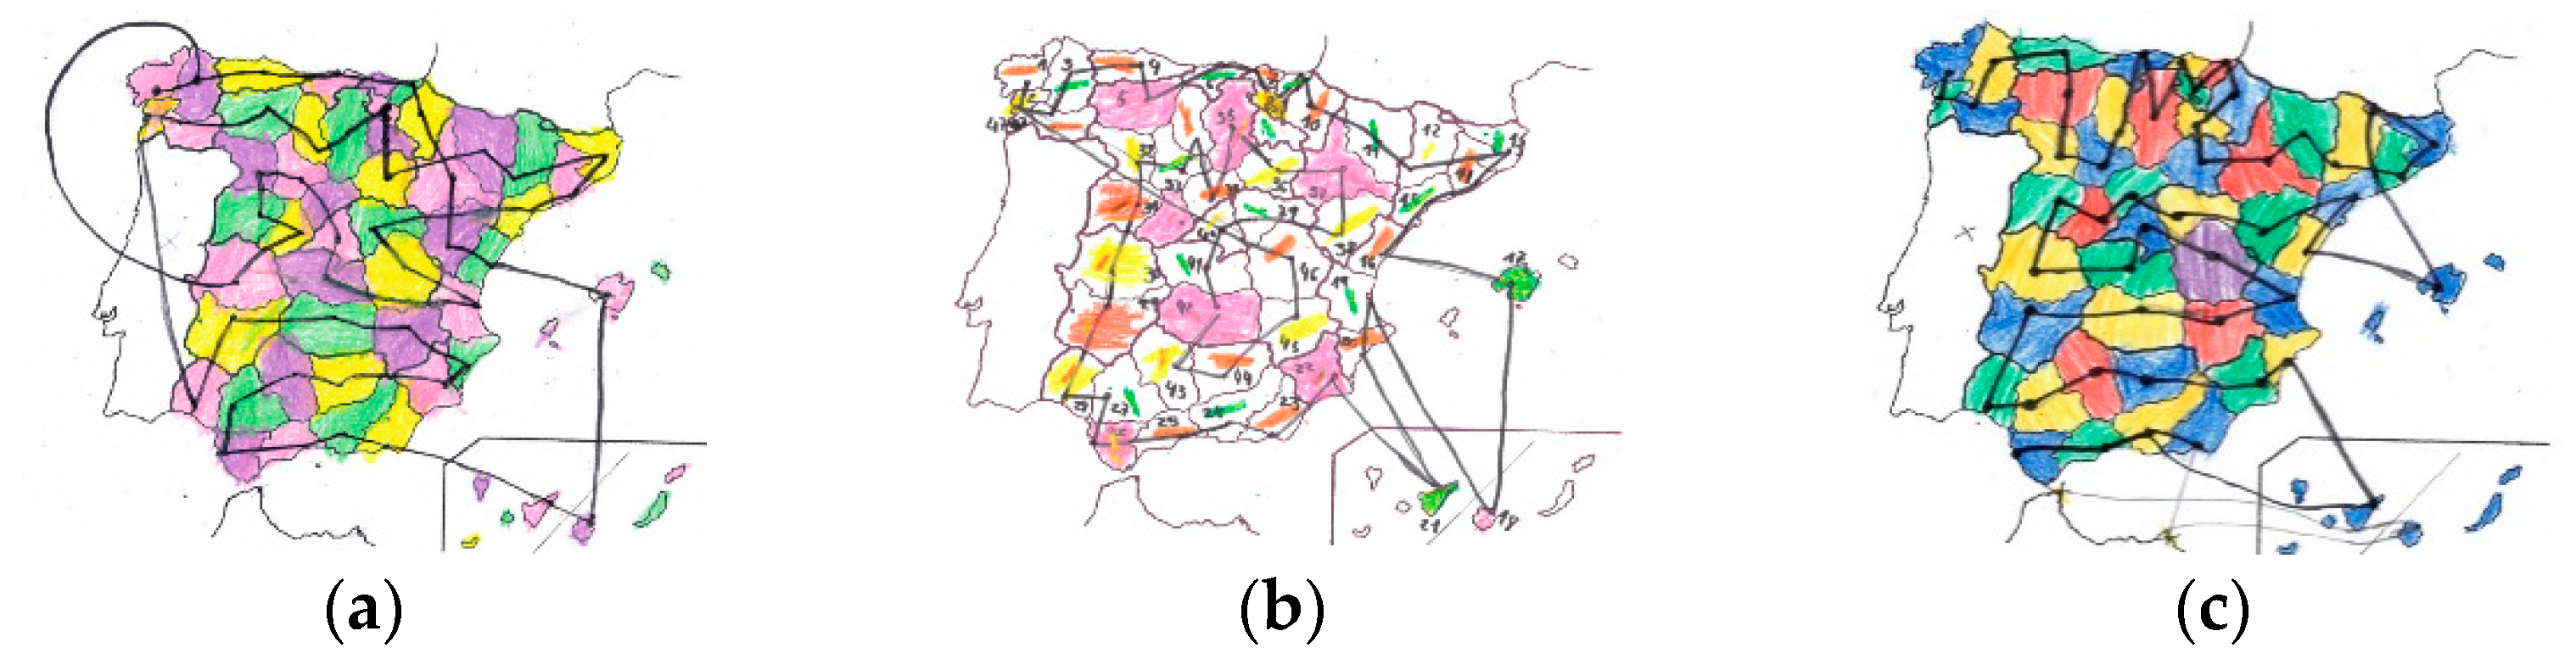
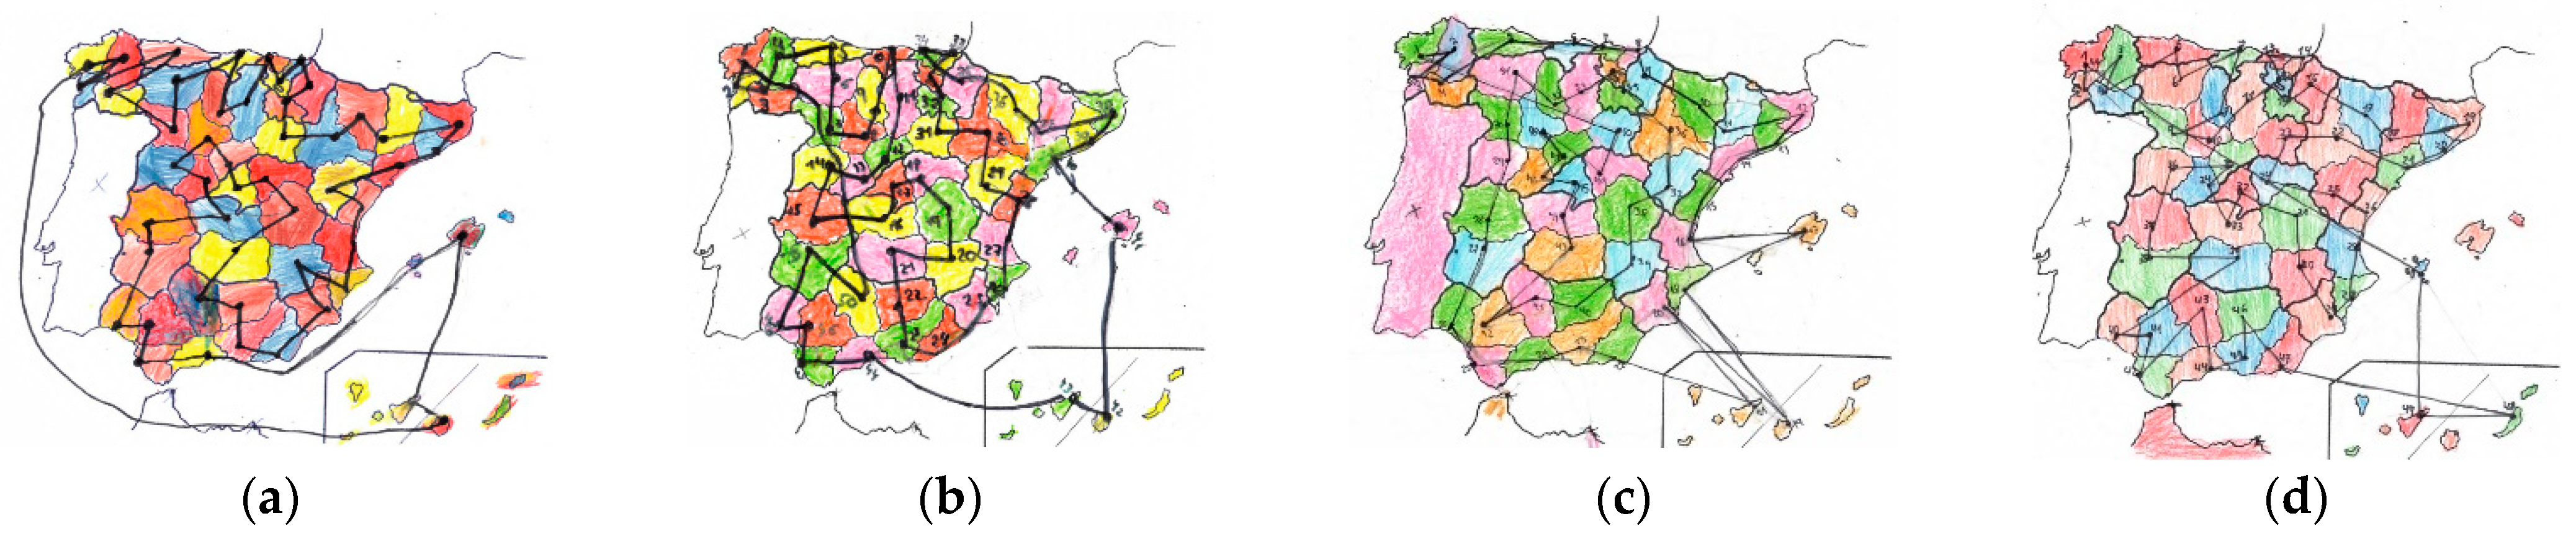
3.1. Map Coloring
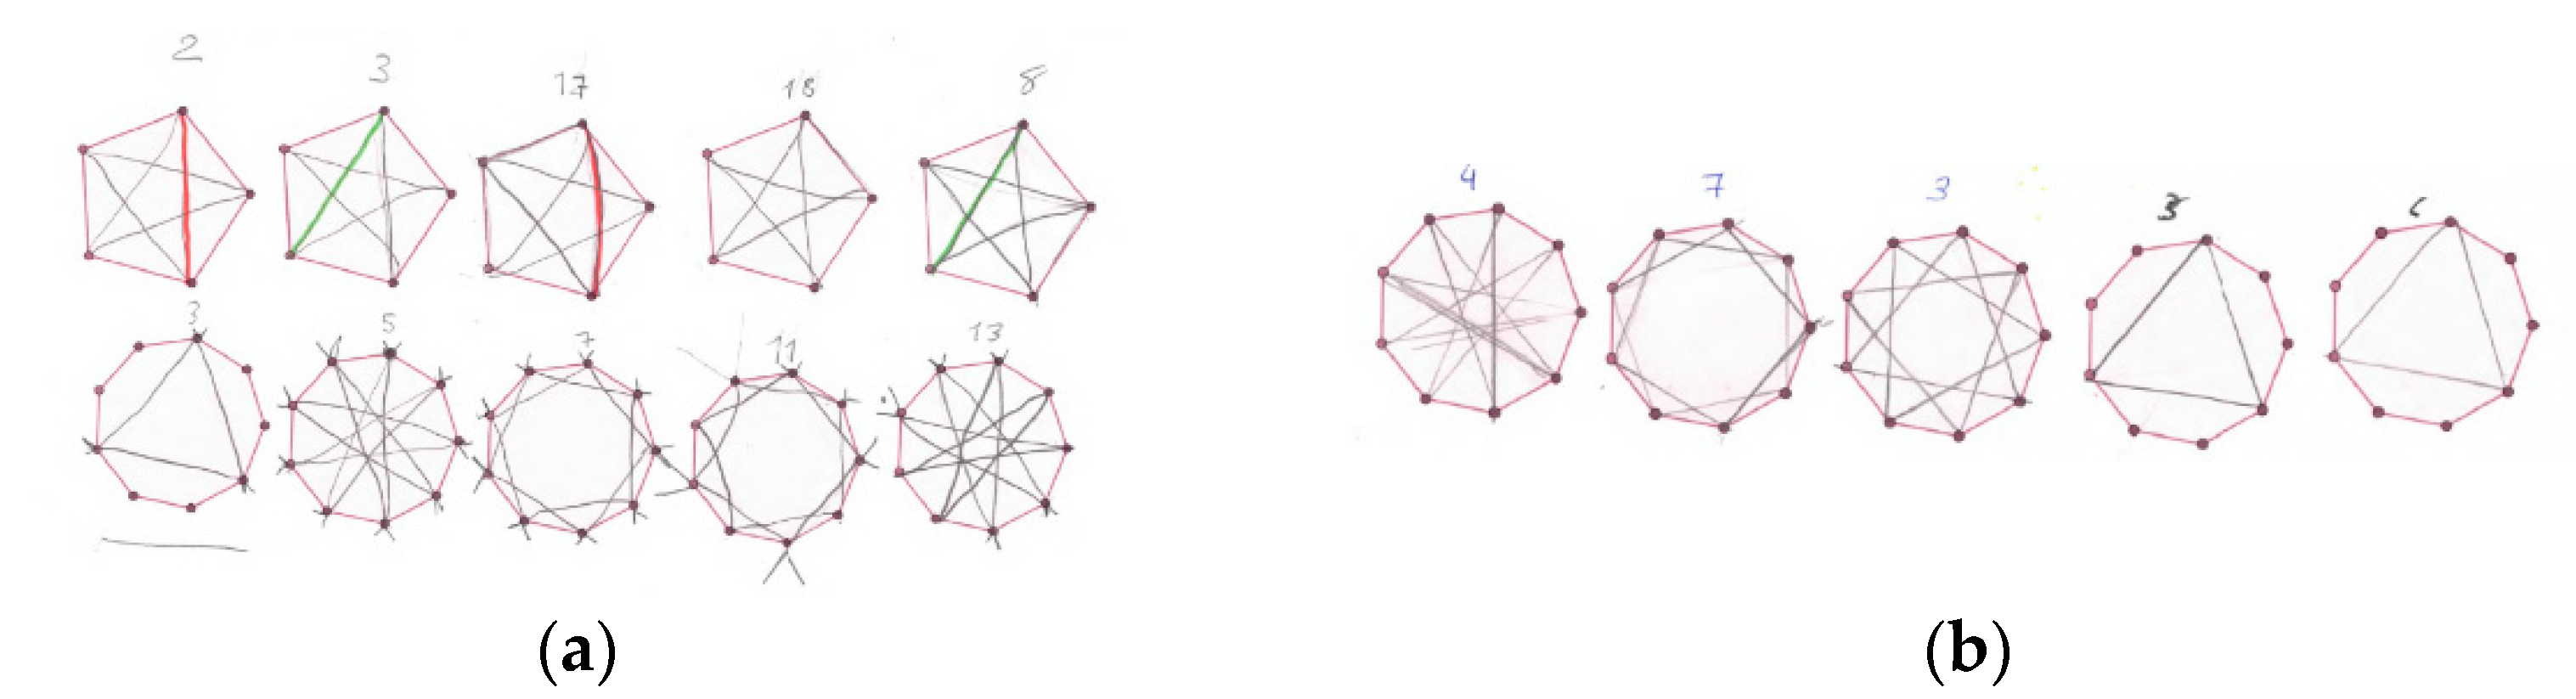
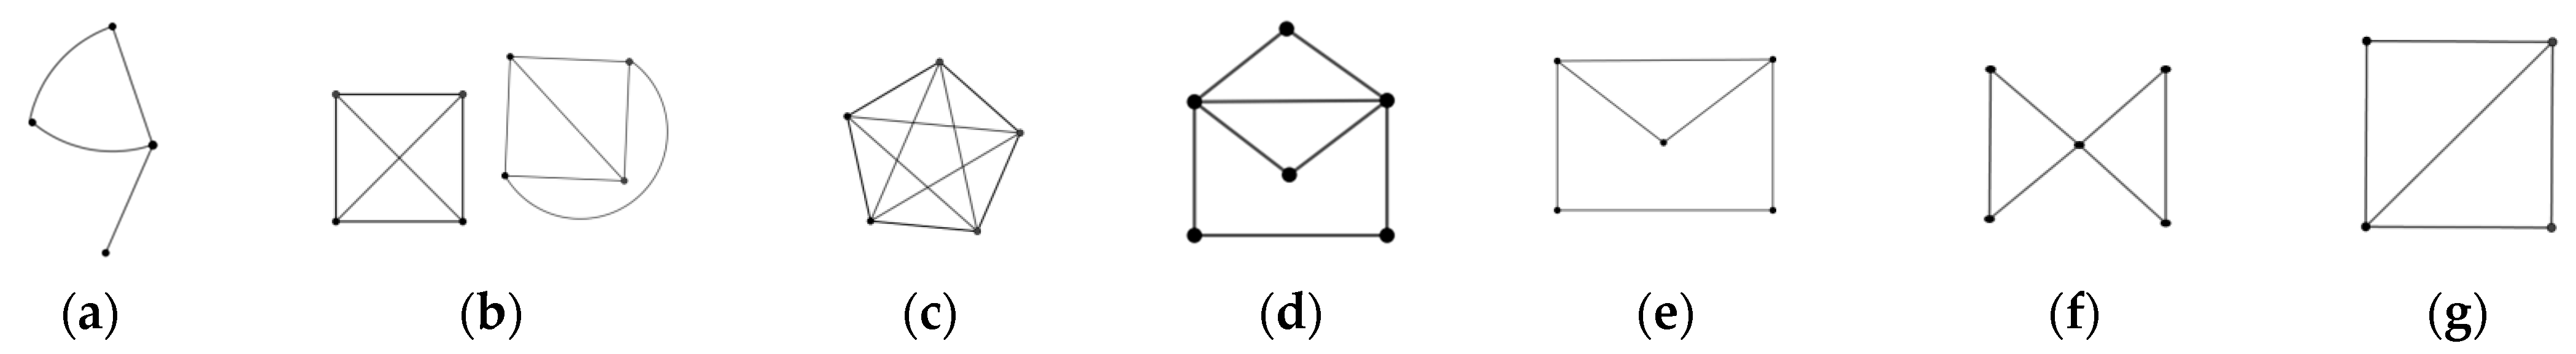
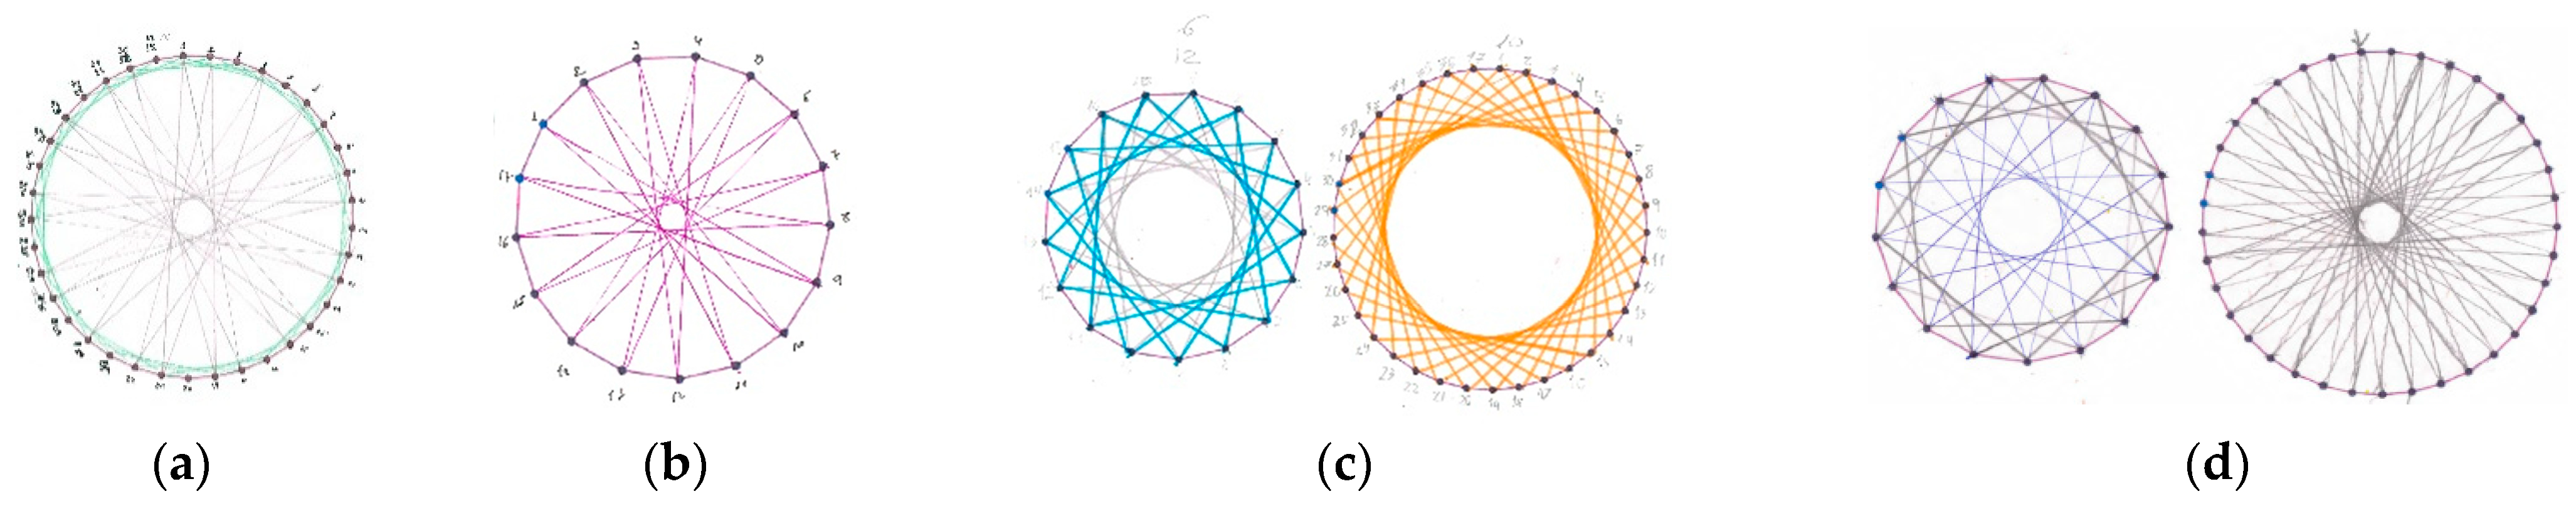
3.2. Star Polygons
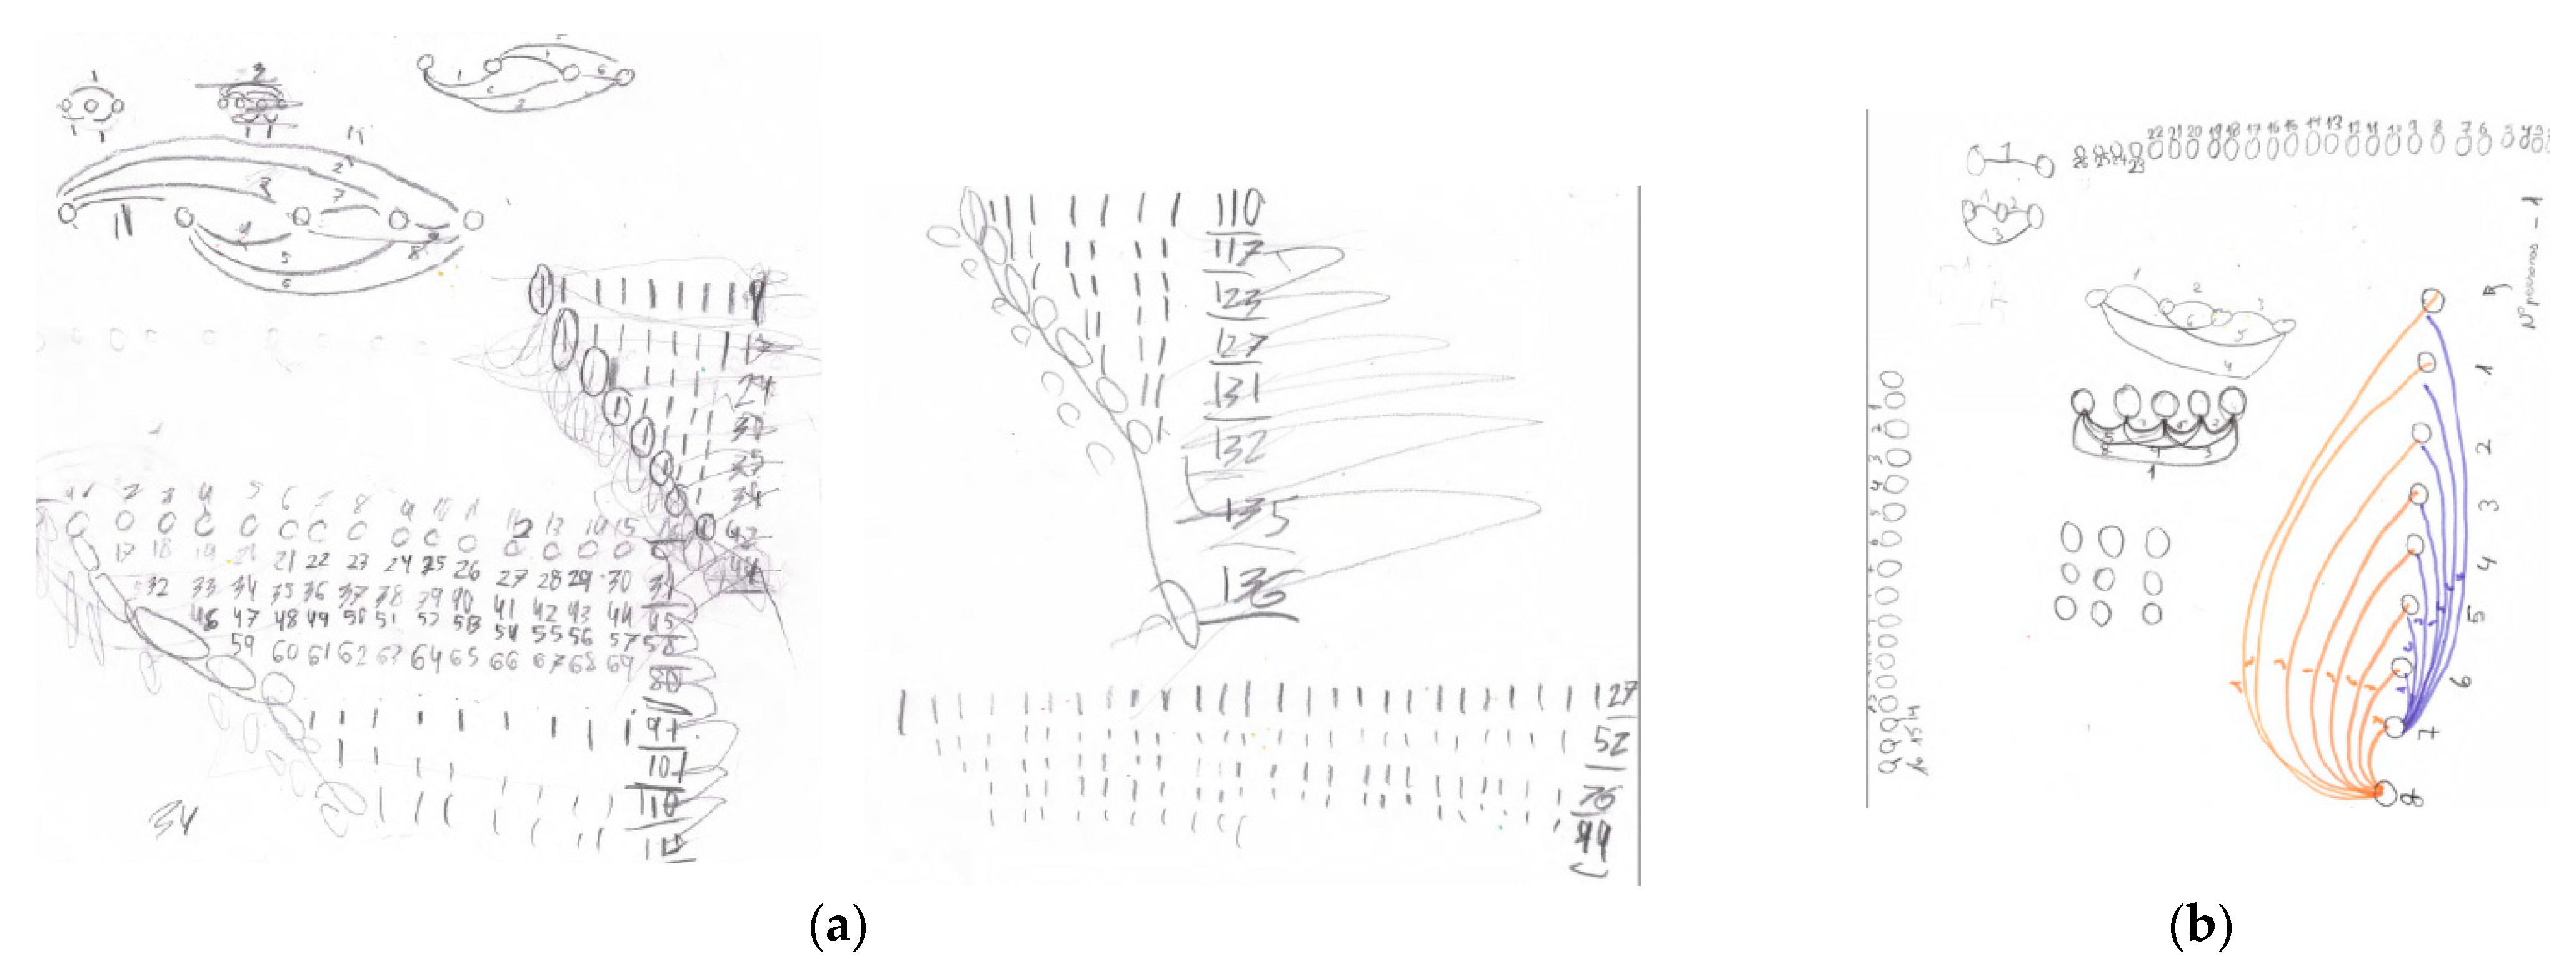
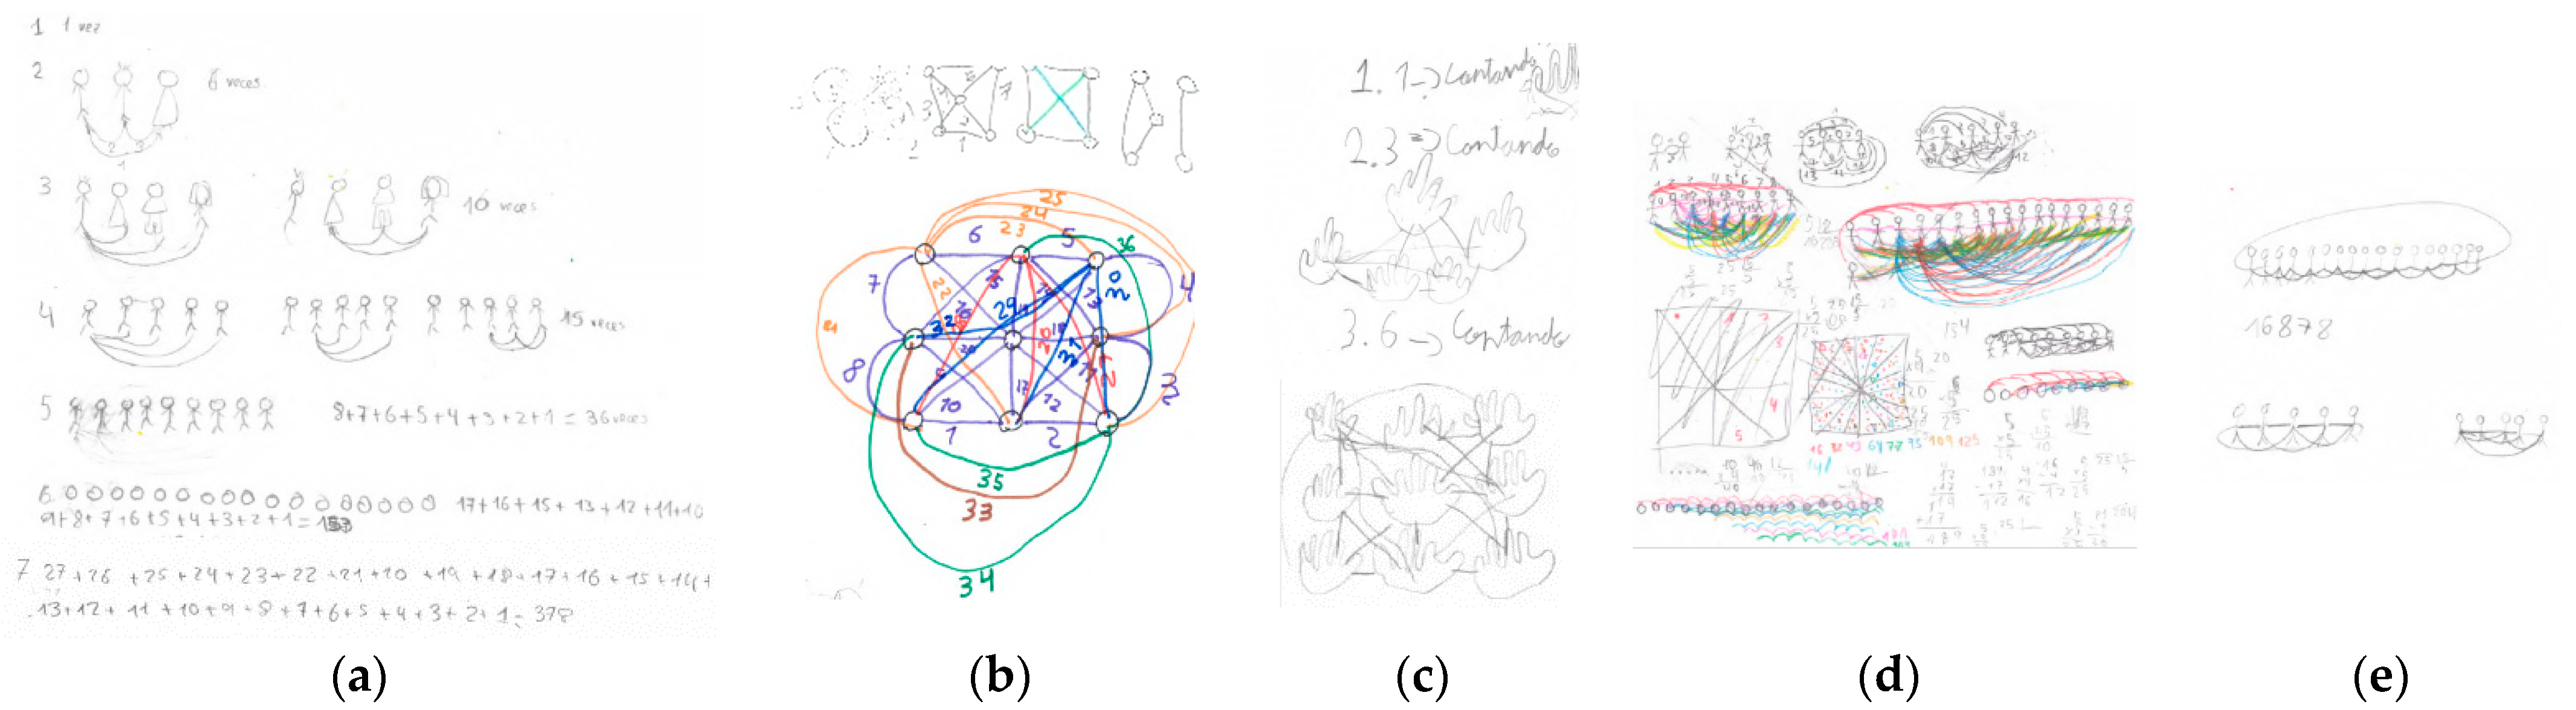
3.3. Give Me Five
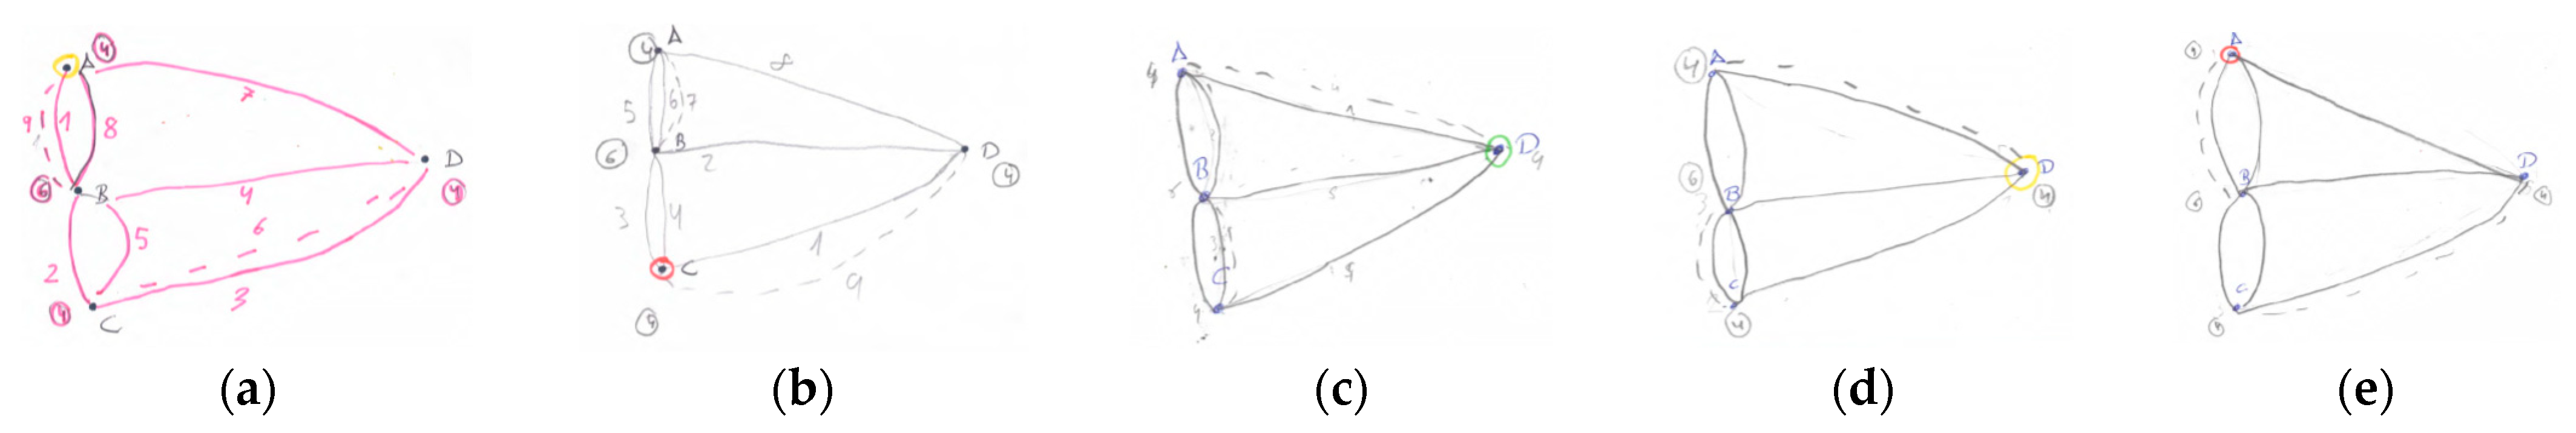
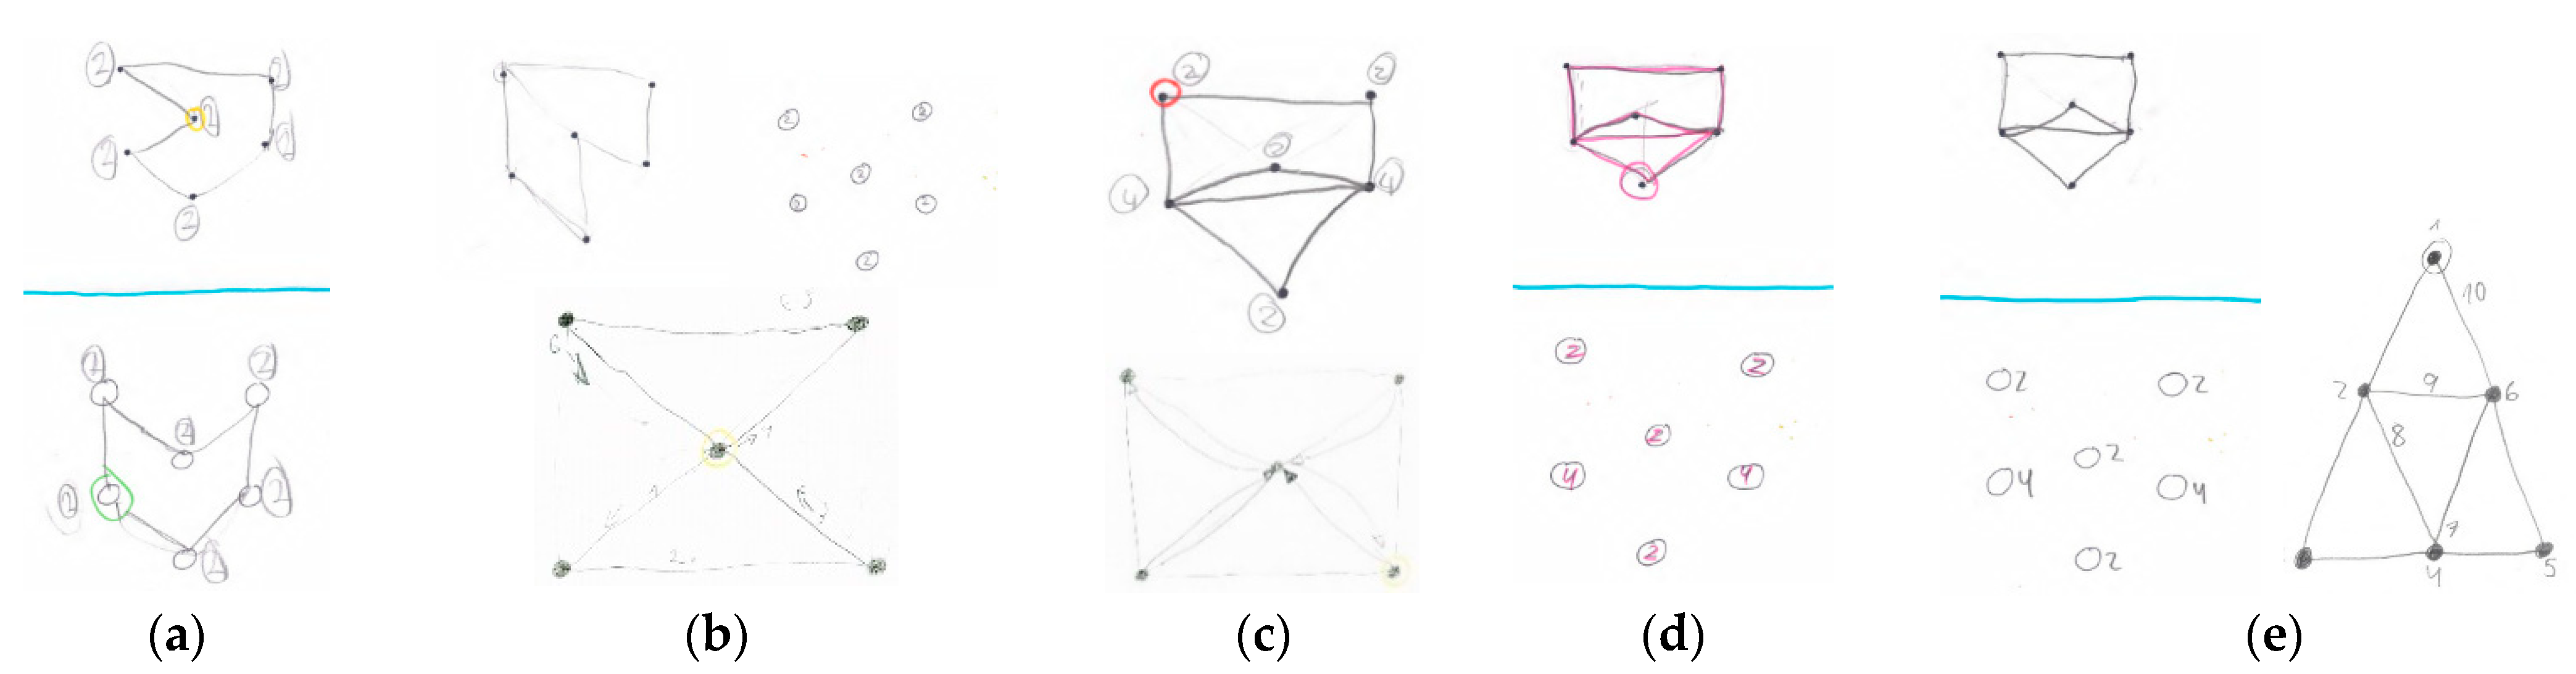
3.4. Path Tracing/Eulerian Cycles
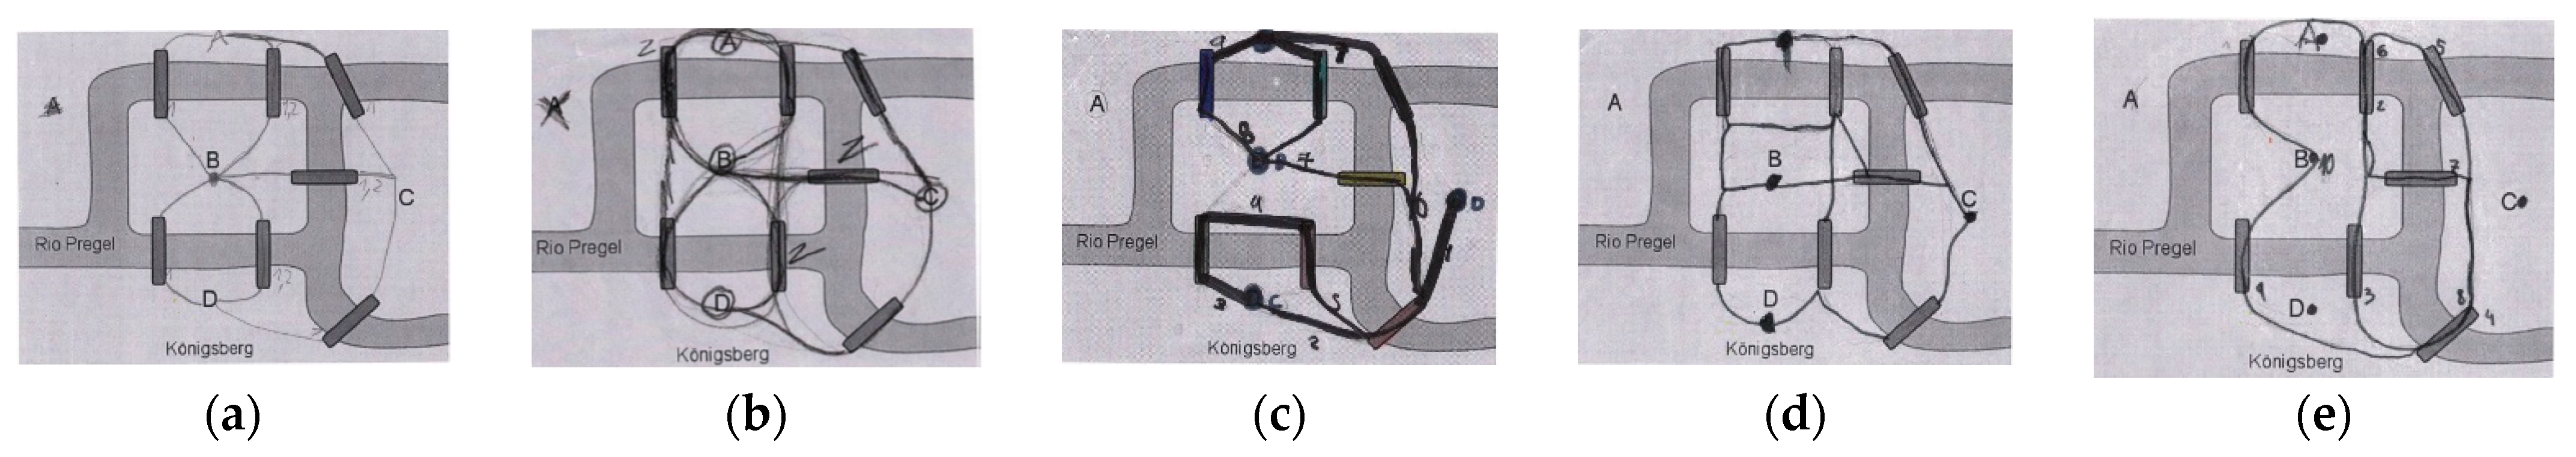
3.5. Seven Bridges of Köningsberg
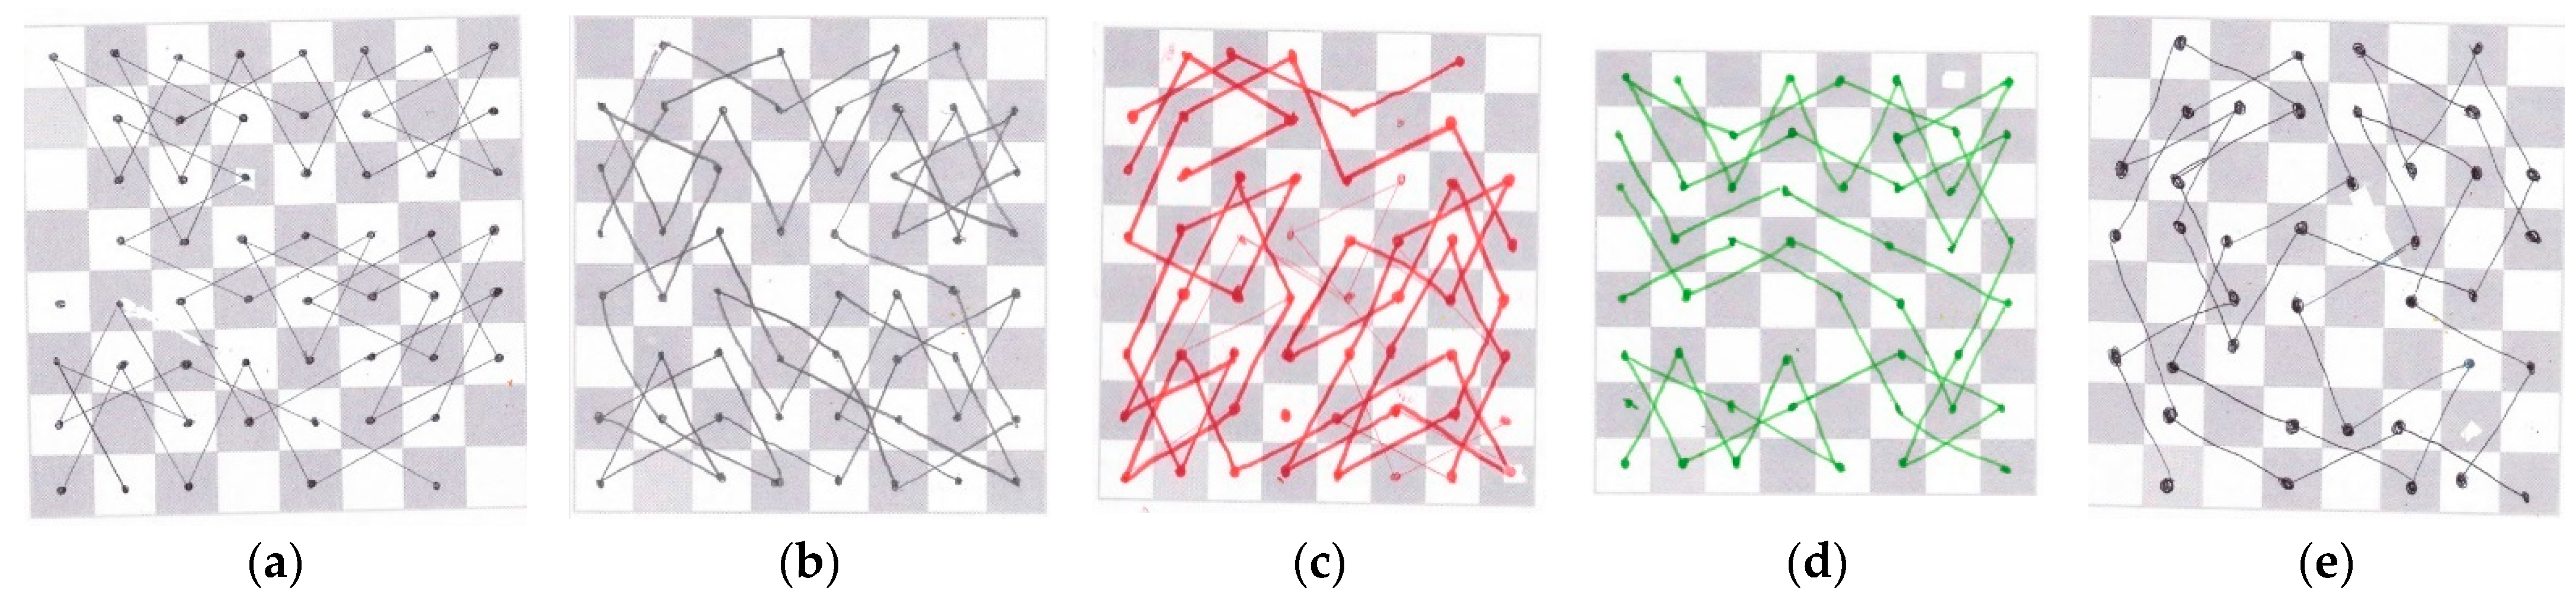
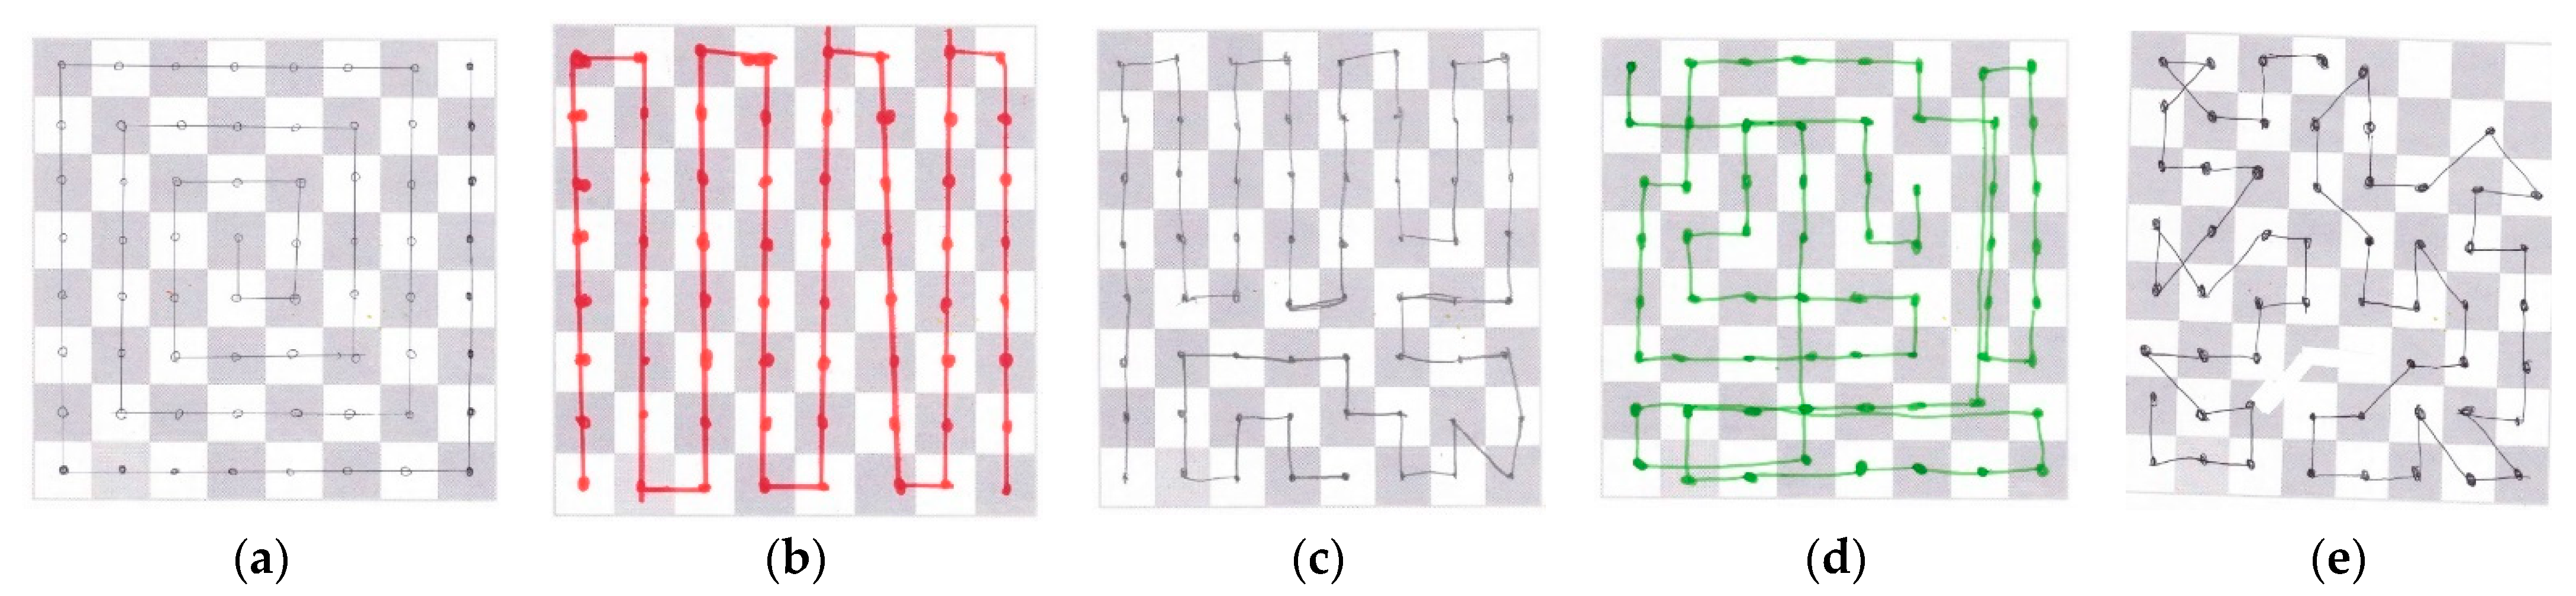
3.6. Chess Routes
3.7. Mathematical Challenges
4. Discussion
5. Conclusions
Author Contributions
Funding
Institutional Review Board Statement
Informed Consent Statement
Data Availability Statement
Acknowledgments
Conflicts of Interest
Appendix A
- How many times 2 people high-five when they meet?
- How many times 3 people high-five when they meet?
- How many times 4 people high-five when they meet?
- How many times 5 people high-five when they meet?
- How many times 9 people high-five when they meet?
- How many times 17 people high-five when they meet?
- How many times 27 people high-five when they meet?
- How did you get the answers?
- Can you find a way walking through the 4 areas of the city, crossing each bridge only once and going back to the starting point?
- Can you see any difference between the starting point and the other ones?
- Count the number of edges leaving out or arriving at each vertex.
- How many times would it be necessary to cross every bridge to complete a closed path going through all the bridges (at least once).
- Can the knight go through all the squares, passing only once through each one? Can you prove it?
- Now choose the chess piece you prefer and try again.
- These ways described by chess pieces are Hamiltonian paths. A Hamiltonian path is a path (nonclosed path) passing only once for every vertex.
References
- Blanco, R.; García-Moya, M. Actividades con grafos para estudiantes con AACC. Edma 0-6 2019, 8, 92–108. [Google Scholar]
- Wilson, R.J. Introduction to Graph Theory; Longman Group Ltd.: Essex, UK, 1996. [Google Scholar]
- BOE (03/01/2014). Real Decreto 126/2014, del 28 de Febrero, por el que se Establece el Currículo Básico de la Educación Primaria. Available online: https://www.boe.es/eli/es/rd/2014/02/28/126/con (accessed on 2 July 2021).
- BOE (03/01/2015). Real Decreto 1105/2014, de 26 de Diciembre, por el que se Establece el Currículo Básico de la Educación Secundaria Obligatoria y del Bachillerato. Available online: https://www.boe.es/eli/es/rd/2014/12/26/1105/con (accessed on 2 July 2021).
- Rosentein, J.; Franzblau, D.; Roberts, F. (Eds). Discrete Mathematics in the Schools; DIMACS Series in Discrete Mathematics Computer Science; American Mathematical Society (AMS): Providence, RI, USA, 1997; Volume 36. [Google Scholar]
- National Council of Teachers of Mathematics. Curriculum and Evaluation Standards for School Mathematics; The Council: Reston, VA, USA, 1989; Available online: http://www.standards.nctm.org/index.htm (accessed on 1 April 2021).
- National Council of Teachers of Mathematics. Principles and Standards for School Mathematics; The Council: Reston, VA, USA, 2000; Available online: http://www.standards.nctm.org/index.htm (accessed on 1 April 2021).
- Alsina, C. Mapas del Metro y Redes Neuronales: La Teoría de Grafos; RBA Coleccionables, S.A.: Barcelona, Spain, 2010. [Google Scholar]
- Coriat, M.; Sancho, J.; Marín, A.; Gonzalvo, P. Nudos y Nexos. Redes en la Escuela; Síntesis: Madrid, Spain, 1989. [Google Scholar]
- Niman, J. Graph Theory in the Elementary School. Educ. Stud. Math. 1975, 6, 351–373. [Google Scholar] [CrossRef]
- Braicovich, T.; Cognigni, R. Coloreando la geografía desde el plano al toroide. Números 2011, 76, 135–148. [Google Scholar]
- Ferrarello, D. Graphs in primary school: Playing with technology. In Mathematics and technology, Advances in Mathematics Education; Aldon, G., Hitt, F., Bazzini, L., Gellert, U., Eds.; Springer: Cham, Switzerland, 2017; pp. 143–169. [Google Scholar] [CrossRef]
- Ferrarello, D.; Mammana, M.F. Graph Theory in Primary, Middle, and High School. In Teaching and Learning Discrete Mathematics Worldwide: Curriculum and Research; Hart, E., Sandefur, J., Eds.; ICME-13 Monographs; Springer: Cham, Switzerland, 2018; pp. 183–200. [Google Scholar] [CrossRef]
- Gaio, A.; Branchetti, L.; Capone, R. Learning Math Outdoors: Graph Theory using Maps. In Research on Outdoor STEM Education in the Digital Age, Proceedings of the ROSETA Online Conference in June 2020; Ludwig, M., Jablonski, S., Caldeira, A., Moura, A., Eds.; Ludwig, M., Jablonski, S., Caldeira, A., Moura, A., Eds.; WTM: Münster, Germany, 2020; pp. 95–102. [Google Scholar] [CrossRef]
- D’Angelo, J.P.; West, D.B. Mathematical Thinking: Problem-Solving and Proofs; Prentice-Hall: Upper Saddle River, NJ, USA, 2000. [Google Scholar]
- Dienes, Z.P. Las Seis Etapas del Aprendizaje de Matemáticas; Teide: Barcelona, Spain, 1977. [Google Scholar]
- Pólya, G. How to Solve It: A New Aspect of Mathematical Method; Princeton University Press: Princeton, NJ, USA, 1957. [Google Scholar]
- Blanco, R.; García-Moya, M. Propuesta didáctica para introducir la teoría de grafos en educación primaria. In Proceedings of the 8th International Congress of Educational Sciences and Development, Pontevedra, Spain, 28–30 October 2020; Bermúdez, M.P., Ed.; Asociación Española de Psicología Conductual (AEPC): Granada, Spain; p. 58. ISBN 978-84-09-19786-6.
- García-Moya, M.; Blanco, R.; Fernández-Cézar, R. Matemáticas manipulativas y alto rendimiento. In Inclusión, Tecnología y Sociedad: Investigación e Innovación en Educación; Marín Marín, J.A., Gómez García, G., Ramos Navas-Parejo, M., Campos Soto, M.N., Eds.; Editorial Dykinson: Madrid, Spain, 2019; pp. 2264–2277. ISBN 978-84-1324-491-4. [Google Scholar]
- Martínez Torres, M. Características del alumnado con altas capacidades. In Altas Capacidades Intelectuales. Pautas de Actuación, Orientación, Intervención y Evaluación en El Periodo Escolar; Torres Martínez, M., Guirado, Á., Eds.; Graó: Barcelona, Spain, 2012; pp. 71–118. [Google Scholar]
- Renzulli, J.S. El concepto de los tres anillos de la superdotación: Un modelo de desarrollo para una productividad creativa. In Intervención e Investigación Psicoeducativa en Alumnos Superdotados; Benito, Y., Ed.; Amarú Ediciones: Salamanca, Spain, 1994; pp. 41–78. [Google Scholar]
- Pinterest. Available online: https://www.pinterest.es/pin/785737466221794150/ (accessed on 22 May 2021).
- Grupo Alquerque. Available online: http://www.grupoalquerque.es/ferias/2016/archivos/puentes/puentes_h1.pdf (accessed on 22 May 2021).
- FreePrintable. Available online: https://www.freeprintable.com/free-printables/blank-chess-board (accessed on 22 May 2021).
- Dibujos. Available online: https://geografia-espanola.dibujos.net/castilla-la-mancha.html (accessed on 22 May 2021).
- Fernández, I.; Reyes, E. Geometría con El Hexágono y El Octógono: Papiroflexia, Proporciones, Disecciones, Cuadraturas, Mosaicos, Geometría Sagrada; Proyecto Sur, D.L.: Armilla, Spain, 2003. [Google Scholar]


| Stage | Activities | Topics | Session |
|---|---|---|---|
| Adaptation | Coloring of maps | Four color theorem | 1 |
| Idea of graph and cycle | |||
| Structuring | Köningsberg bridges problem | Graph associated, degree of a vertex, closed path | 2 |
| Eulerian cycles | 3 | ||
| Abstraction | Give me five | Complete graphs | 4 |
| Induction | |||
| Reasoning | Star polygons | Drawing star polygons | 5 |
| Stage | Activities | Topics | Session |
|---|---|---|---|
| Adaptation | Coloring of maps | Four color theorem | 1 |
| Idea of graph and cycle | |||
| Structuring | Star polygons | Drawing star polygons | 2 |
| Abstraction | Give me five | Complete graphs | 3 |
| Induction | |||
| Path tracing | Eulerian cycle, degree of a vertex | 4 | |
| Reasoning | Köningsberg bridges problem | Closed path, graph associated | 5 |
| Degree of a vertex | |||
| Chess routes | Hamiltonian path | 6 |
| Student | Age | Gender | Group |
|---|---|---|---|
| A1, A2 | 6 | Female | G1 |
| A3 | 9 | Male | G2 |
| A4, A5 | 10 | Female | G2 |
| A6, A7 | 11 | Female | G3 |
| Challenge | Group | Problem | Strategy | |
|---|---|---|---|---|
| 1 | G1 | Set the minimum number of colors needed to color Castilla-La Mancha [25], such that neighboring regions do not have the same color | 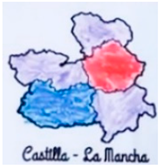 | Simplification Simpler problem |
| G2 | Inside a regular pentagon, draw a five-pointed star without lifting the pencil from the paper | 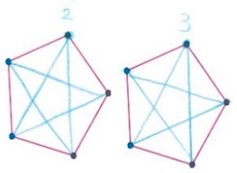 | Simpler problem | |
| G3 | Draw two different star polygons inside a regular polygon of 17 edges | 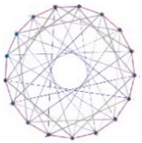 | Simpler problem | |
| 2 | G1 | Draw a cycle in a set of 20 nonaligned points, joining all points | 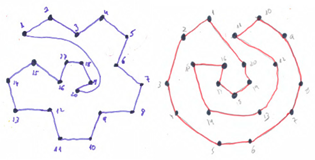 | Simpler problem |
| G2 | Inside an enneagon draw as many star polygons as you can |  | Simpler problem | |
| G3 | Find the Cartesian coordinates of 5 points (they pose some computations). Afterward, draw a star polygon and find all of their symmetry axes | 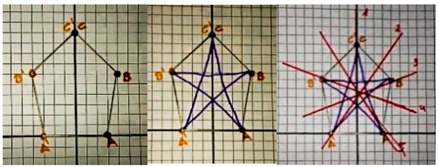 | Related problem | |
| 3 | G1 | We are 15 friends playing with the ball, but we cannot pass the ball twice to the same classmate. How many times did we pass the ball? (They solve it by counting.) | 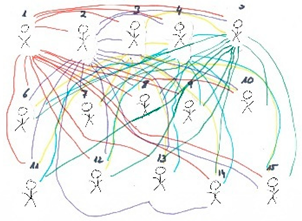 | Variation of the problem |
| G2 | Plan a trip through several places without passing twice by the same path |  | Variation of the problem | |
| G3 | Plan a trip by bus through several places in Toledo city, meeting some relatives | 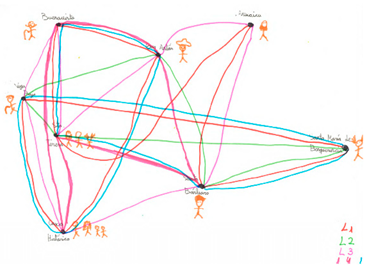 | Variation of the problem | |
| 4 | G1 | Draw three different star polygons inside a regular polygon of 37 edges |  | Variation of the problem |
| G2 | Draw a Eulerian cycle in a set of 5 points | 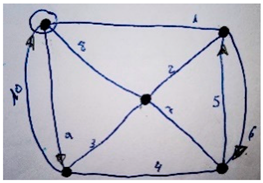 | Same problem already invented | |
| G3 | Draw a Eulerian cycle in this set of points using straight lines | 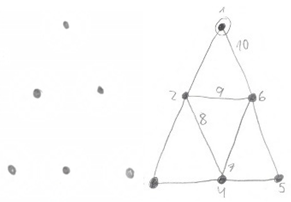 | Same problem already invented | |
Publisher’s Note: MDPI stays neutral with regard to jurisdictional claims in published maps and institutional affiliations. |
© 2021 by the authors. Licensee MDPI, Basel, Switzerland. This article is an open access article distributed under the terms and conditions of the Creative Commons Attribution (CC BY) license (https://creativecommons.org/licenses/by/4.0/).
Share and Cite
Blanco, R.; García-Moya, M. Graph Theory for Primary School Students with High Skills in Mathematics. Mathematics 2021, 9, 1567. https://doi.org/10.3390/math9131567
Blanco R, García-Moya M. Graph Theory for Primary School Students with High Skills in Mathematics. Mathematics. 2021; 9(13):1567. https://doi.org/10.3390/math9131567
Chicago/Turabian StyleBlanco, Rocío, and Melody García-Moya. 2021. "Graph Theory for Primary School Students with High Skills in Mathematics" Mathematics 9, no. 13: 1567. https://doi.org/10.3390/math9131567
APA StyleBlanco, R., & García-Moya, M. (2021). Graph Theory for Primary School Students with High Skills in Mathematics. Mathematics, 9(13), 1567. https://doi.org/10.3390/math9131567