Abstract
Our main objective was to analyze which paths can lead to the adoption of environmental practices (PRAC) in firms, for which we developed three original alternative research models. Model 1 involves five sources for the adoption of environmental practices: human resource costs, organizational learning capability, firm size, manager educational level and manager experience. Model 2 adopts five sources for PRAC: human resource costs, information technology support, firm size, manager educational level and manager experience. Finally, Model 3 adopts six sources for PRAC: human resource costs, organizational learning capability, information technology support, firm size, manager educational level and manager experience. Therefore, Model 1 uses the organizational learning capability for PRAC, Model 2 uses the information technology support for PRAC and Model 3 uses both organizational learning capability and information technology support for PRAC. We used a fuzzy set qualitative comparative analysis on 349 small- and medium-sized Portuguese firms in twelve industrial sectors. The results show that organizational learning capability (OLC) and information technology support (ITS) are important sources for the development of PRAC. In this line, the three research models show that there are different pathways that lead to PRAC. These research models also show pathways that lead to the absence of PRAC. Therefore, the qualitative findings show the relevancy of OLC and ITS to PRAC. In addition, our findings indicate that, by focusing on variables such as OLC, a firm can find more paths that lead to PRAC. Additionally, with the combination of OLC and ITS, it must be taken into account that only developing ITS without OLC is riskier when obtaining PRAC.
1. Introduction
The aim of this study was to answer four research questions: (i) Can organizational learning capability (OLC) help to implement the adoption of environmental practices in SMEs? (ii) Can the increased use of ITS in SMEs improve the adoption of environmental practices? (iii) What exactly are the pathways and components of human resources and technology that lead to the adoption of environmental practices by SMEs? (iv) What characteristics of managers and types of firm according to size help to take paths towards the adoption of environmental practices in SMEs?
Since the 2005 World Summit on Social Development, organizations have been expected to design their strategies in accordance with the three main sustainable development goals—that is, economic development, social inclusion and environmental protection—which reflect the three pillars of the triple bottom line approach [1,2]. Therefore, sustainable management models are needed for the application of environmental practices that also help manage the other two pillars, namely economic and social.
Consequently, the adoption of environmental practices represents a means through which organizations can promote full sustainable development [3]. At the same time, current sustainability challenges can become a source of inspiration for the adoption and improvement of new practices in firms and with it improve competitiveness and contribute to building a better society [4,5]. However, this triple bottom line approach is not a dominant business model in the world [6,7] as firms focus their efforts mainly on obtaining economic benefits.
Our study presents three comparative and integrative research models for PRAC. In addition, our research examines differences in PRAC between SMEs with OLC and SMEs with ITS. Our research models also analyze other characteristics of firms (size) and managers (educational level and experience) for PRAC. Therefore, our study aims to find the paths that lead firms to PRAC or its absence, supported by a triple bottom line approach.
In this study, we used a qualitative method, fuzzy set qualitative comparative analysis (fsQCA), to identify the pathways and alternative configurations for PRAC or its absence. We used fsQCA instead of other methodologies because we aimed to identify the essential and necessary conditions of the configurations that lead to the result variable or its absence [8]—that is, to PRAC or its absence. Therefore, this study completely covers the PRAC pathways and applies the most appropriate qualitative methodology to meet the research objectives.
This study focuses its attention on sustainability in SMEs because they constitute more than 95% of firms worldwide. That is why conducting a study of this type and taking into account the size of the firms is very important, because PRAC, ITS and OLC can be very different between firms depending on their sizes. Therefore, this study also addressed sustainable pathways for three types of SMEs (SMEs with OLC, SMEs with ITS and SMEs with OLC and ITS) and several managers (educational level and experience) and firm characteristics (size).
This study shows that OLC and ITS are beneficial for PRAC and to boost the competitive advantage of SMEs. A firm that adopts new practices of learning for its employees and new technologies with a culture of sustainability can obtain several pathways for PRAC or its absence.
This study makes several contributions.
First, the findings significantly extend the knowledge of the adoption of environmental practices.
Second, there are seven alternative causal configurations that lead to PRAC with OLC and only three for its absence.
Third, there are six alternative causal configurations that lead to PRAC with ITS and only four for its absence.
Fourth, there are eight alternative causal configurations that lead to PRAC with OLC and ITS and seven for its absence. Therefore, there are more alternative causal configurations that lead to PRAC than to its absence in the three research models.
Finally, the factor of human resource variables as OLC is very important for PRAC, because with OLC, there are seven pathways for PRAC, and with ITS, there are six pathways for PRAC.
The article is structured as follows: Section 2 shows the theory and the constructs. In Section 3, the formulation of the hypotheses, the methodology, the sample and the measures are shown. Section 4 shows the main results of the investigation and the paths for PRAC and its absence. Finally, Section 5 shows the discussion and the conclusions.
2. Three Research Models to Explore the Adoption of Environmental Practices in SMEs
In light of the global crisis caused by COVID-19, one of the most important future challenges that can help improve the lives of people, firms and society as a whole is to find a real balance between the implementation of new technological systems and the care, improvement and learning of human capacities. For this, firms must make a significant investment in the management and maintenance of the factors derived from two key pillars, namely social and economic factors, both fundamental for the adoption of environmental practices and the development of business sustainability supported by the triple bottom line approach [2,9].
In this sense, our research model raises human factors such as OLC, the characteristics of the manager as social factors and technological and business factors as economic factors to achieve the adoption of environmental practices.
Therefore, it is necessary to continue advancing in research that helps to provide new mechanisms and pathways that interrelate human resource management, new technologies and business sustainability.
In addition, this is justified through the triple bottom line approach, where sustainability and the adoption of environmental practices should be sought through three approaches: economic, social and environmental. Here, we rely on this approach to assess which variables or factors can lead to the adoption of environmental practices [2,10].
We thus propose the following research questions:
- Can organizational learning capability (OLC) help to implement the adoption of environmental practices in SMEs?
- Can increased use of ITS in SMEs improve the adoption of environmental practices?
- What exactly are the pathways and components of human resources and technology that lead to the adoption of environmental practices by SMEs?
- What characteristics of managers and types of firm according to size help to take paths towards the adoption of environmental practices in SMEs?
In this sense, our research models try to be comprehensive and comparative research models for the adoption of environmental practices via the contributing factors or variables of the three pillars of the triple bottom line approach. Therefore, the OLC and human factors of managers comprise social factors, and technology and business variables, such as company size, comprise the most economical factors of the approach [2,10].
2.1. Triple Bottom Line Approach
The triple bottom line approach is a term related to sustainable business that refers to the impact that the activity of a firm has in three dimensions: social, economic and environmental. The concept was coined by John Elkington in 1994 and further developed in his book The Triple Bottom Line: Does it All Add Up, published in 2004 [11]. The evidence of performance in relation to the triple bottom line is manifested in the reports of sustainability or corporate social responsibility. Until 2009, their preparation and publication continued to be voluntary and evolving throughout the world.
Ideally, an organization with good performance in triple bottom line terms would be able to maximize its economic benefit and environmental responsibility, as well as minimizing or eliminating its negative externalities and emphasizing the social responsibility of the organization towards groups of interest, not just to shareholders. In this case, a stakeholder refers to anyone who is influenced, directly or indirectly, by the firm’s actions. Therefore, the triple bottom line approach facilitates the performance of a business entity as a vehicle for coordinating sustainable interests.
2.2. Economic Development
Economic development is a dimension that deals with the outcomes and flow of money. It may involve looking at income or expenses, business climate factors, employment and business diversity factors and investing in technology. Specific examples include personal income, human resource costs, rotation of establishments, job growth, percentage of firms in each sector, technology, etc.
In this article, we propose two internal dimensions of a firm for economic development: human resource costs and information technology support.
2.2.1. Human Resource Costs
A firm must invest in the management of its human resources, which will help to improve the performance of its employees and will more easily build a culture of values [12].
The literature has distinguished three main dimensions of human resources: intellectual, emotional and social. These are linked and interrelated to the improvement of organizational capacities [13]. Continued investment in employee job improvements can help firms implement PRAC [14]. Additionally, each dimension of human resources can enhance a firm’s resources. For example, within the intellectual dimension, the firm can invest in improving knowledge; within the emotional dimension, the firm can invest in improving motivation; and within the social dimension, the firm can invest in improving employee relationships. All of these resources together are a source of PRAC [15,16].
2.2.2. Information Technology Support
This concept refers to the application of technology to introduce and implement PRAC [17]. Technology is a key element for the development of new knowledge and the implementation of new practices [18] by facilitating the rapid collection, storage and exchange of knowledge [19,20,21,22]. Well-developed technology integrates new mechanisms and practices [17] that can eliminate barriers to communication among departments in an organization [23,24]. Firms that are at the forefront of ITS have more mechanisms to adopt new sustainable practices. Therefore, ITS is a fundamental component in highly sustainable firms since they can reduce costs throughout their production [25].
ITS has non-reproducibility, non-substitutability and appropriability factors that help firms to obtain a competitive advantage [26]. The literature indicates that firms that have a high investment in ITS tend to have a good PRAC [27,28], as technology provides the necessary mechanisms to convert inputs into sustainable outputs [25,29]. Therefore, this study presents ITS as a significant component of PRAC. Previous studies indicated that ITS must be evaluated at the organizational level to determine its effects [27]. Therefore, ITS is considered a clear precedent for the creation and implementation of PRAC in firms [28,30].
2.3. Social Development
Social development refers to the social dimensions of a firm, community or region and can include measures of education, learning, equity and access to social resources, health and well-being, quality of life and social capital. The following list provides some examples of possible variables: female participation rate in the labor force, median income, relative poverty, percentage of employees with a post-secondary degree or certificate, organizational learning ability, interorganizational awareness share, etc. In this article, we propose an internal dimension of firms: organizational learning capacity. Organizational learning capacity is a relevant tool for SMEs because it grants access to social resources. In this way, SMEs with a high level of organizational learning ability can collect and report information on what is happening inside and outside the firm.
Organizational Learning Capability
Learning capability refers to those factors that facilitate organizational learning [29,30]. This is a concept related to the renewal of dynamic and continuous knowledge. Knowledge renewal is undoubtedly the greatest source of ability to learn and explore new knowledge while exploiting already known knowledge [31]. Organizational learning is a broad concept and occurs both within and outside of the organization itself [32].
Lichtenthaler [33] classified organizational learning into three processes: exploratory, exploitative and transformative. All three processes have positive effects on PRAC. Organizational learning requires organizations to plan, visualize and transact. According to Chiva et al. [34], OLC was born from experimentation, risk-taking, interaction with the external environment, dialogue and participatory decision-making.
Experimentation is the search for new ideas by firms, whereby they are curious to know or make changes in work processes. Risk-taking shows tolerance for ambiguity, uncertainty and mistakes that lead to organizational learning. Interaction with the environment shows the breadth of the firm’s relationships with its environment. Dialogue is the collective search for assumptions, processes and certainties. Finally, decision making relates to the collaboration and participation that employees have in the process [35]
2.4. Environment Development
Environmental dimensions represent the adoption of natural resources and reflect the potential influences on their viability. They could incorporate air and water quality, energy consumption, natural resources, solid and toxic waste and land use/land cover. Ideally, organizations should track long-term trends for each of the environmental dimensions to help identify the impacts that a project, policy or product will have in an area, market or community. In this context, we focus on the complete concept of the adoption of environmental practices.
Adoption of Environmental Practices
The reinforcement of environmental regulations worldwide in recent years and the COVID-19 crisis have motivated countries and firms to seek the adoption of environmental management practices [35,36]. Investment in human resources, organizational learning and technology are essential for economic and social development [37]. In addition, a business and social culture that leads to PRAC is relevant, which can be promoted and driven by suppliers, employees, clients and other public and private stakeholders [38].
PRAC can be an important advancement for organizations as they can introduce more efficient consumption and recycling methods and even help to reduce total costs [39]. Aragon-Correa et al. [40] showed that an active environmental strategy requires changes in operational routines and methods. Chan and Hawkins [41] indicated that the adoption of environmental practices helps to improve safety standards and working conditions. In addition, firms that enforce PRAC will have greater economic and fiscal advantages because they can benefit from public aid [42].
2.5. Firm Size and Managers’ Characteristics
2.5.1. Firm Size
According to the European Union, the definition of SMEs is shown in Annex I of Commission Regulation (EU) No. 651/2014 of June 17, 2014. The document shows the types of firms based on the number of employees (small: <50 employees; medium: >50 employees) [43]. A large or medium size can help with the PRAC because there is the possibility of obtaining economies of scale, lower risk and the possibility of better and higher performance. Therefore, SMEs can have access to a larger battery of information and capabilities that allow PRAC more easily [44]. In contrast, small firms may be able to facilitate PRAC quickly by having fewer intermediaries or hierarchies. There could be better communication and coordination for PRAC. Furthermore, a smaller firm usually has more informal links to support the adoption of PRAC [44].
2.5.2. Manager Education Level
This paper distinguishes the educational competencies of managers as they could play an essential role in PRAC (secondary, undergraduate and graduate). Vila et al. [45] indicated that there are significant effects of these competencies on the possibility that managers act as drivers in PRAC. These competencies are directly related to the level of education as they are based on being alert to new opportunities and the ability to present ideas or reports, mobilize the skills of others and propose new ideas and solutions as well as the ability to use computers and the Internet. Therefore, the high technological level of a firm is directly linked to the education of the manager and his level of awareness about investing in ITS and PRAC. The technological level creates effects of power in the PRAC and reduces the risk of resistance of the administrators to the new systems [46]. Ultimately, introducing a business process system without a supportive learning environment could have drastic consequences [47].
However, it is important to test this in our research models because, in turn, a higher level of manager education can mean that the manager has a greater knowledge of certain environmental issues related to ethics when it comes to doing things well or not achieving the adoption of environmental practices in the firm. For example, a manager may be educated on how to implement a certain quota for pollution in his firm, but this knowledge can also be used to circumvent the ethical mechanisms to comply with said quota if using the black market to buy and sell pollution quotas. Therefore, our research models aim to show whether a manager’s level of education is a factor that leads to the adoption of environmental practices or their absence [48].
Both the size of a firm and the characteristics of the manager (level of education and experience) are relevant factors included in our research models and, therefore, in our qualitative analyses, because they are factors that, a priori, can affect the adoption of environmental practices in firms in a predefined way. In this sense, large firms are expected to adopt environmental practices in a very different way than small ones do, and the same is expected in the case of manager characteristics—that is, a manager with a high level of education and experience will apply environmental practices to his firm in a very different way than a manager with a lower level of education and experience would.
2.5.3. Manager Experience
The willingness of firms to adopt new ideas or practices can be analyzed through the manager’s experience (junior: <2 years; intermediate: 2 to 5 years; senior: >5 years). A manager’s experience shows their intentions according to their knowledge and know-how when introducing new tools that improve the environment and culture of their organization. For example, the manager can contribute to an improvement in communication and creativity that translates into the adoption of new practices within the firm [48]. Kumar and Saqib [49] found a positive relationship between experience, measured through age, and the performance of research and development (R and D) and the adoption of new practices. Kuemmerle [48] analyzed the relationship between the innovative results of R&D laboratories, measured through interviews with their managers and by obtaining patents, and their experience, showing a positive relationship. Gumbau [50] found that the length of time that a manager has been with a firm has a positive influence on the level of resources invested in new practices.
However, other studies such as those by Molero and Buesa [51] revealed that firms with less experienced and younger managers have a more active attitude in the implementation of new technologies and environmental management practices.
3. Hypotheses and Methods
3.1. Hypotheses: Alternative Configurations
The theory of configuration indicates the sufficient and necessary conditions to lead to a result (PRAC). Here, there is equifinality if more than one pathway leads to the same result (PRAC). These configurations are important because through various asymmetric paths, we are able to reach a result and we do not remain in simple traditional bivariate interactions.
Therefore, given the complexity of the involved phenomena, we propose that parallel nonlinear configurations of conditions lead to PRAC (and its absence) in several ways [52].
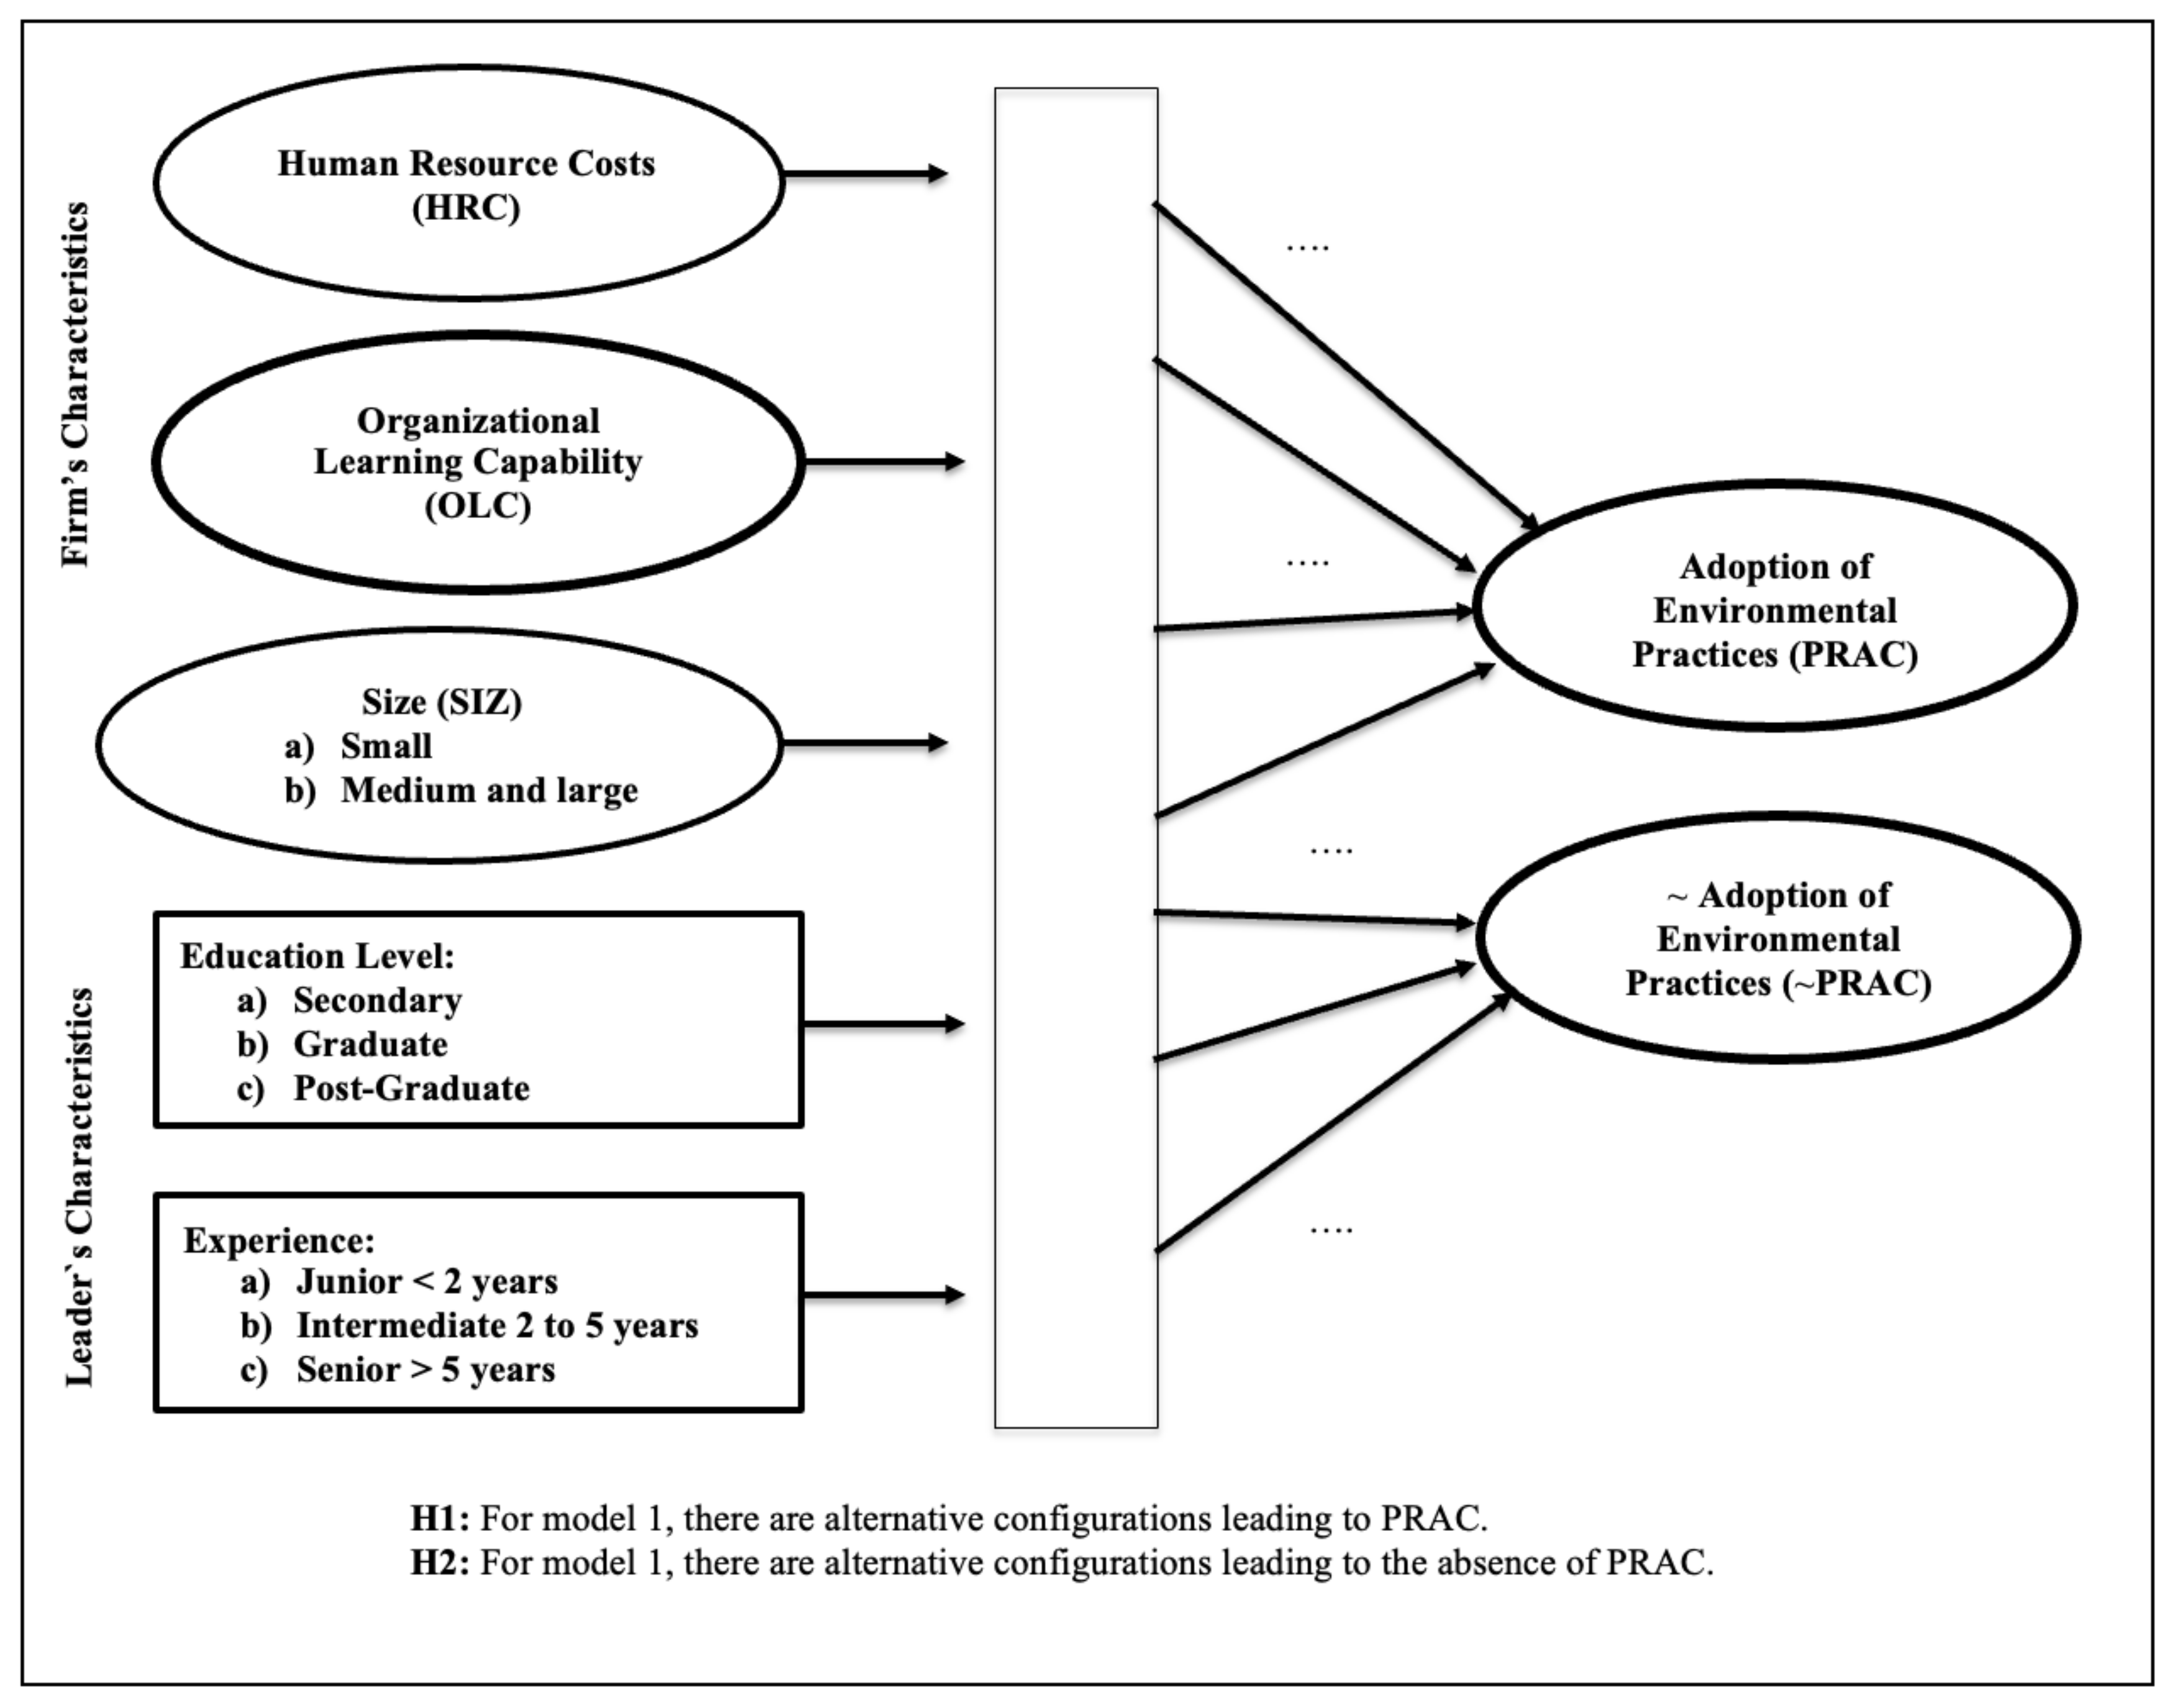
For Model 1:
Hypotheses 1 (H1).
There are alternative configurations leading to PRAC considering the contribution of HRC.
Hypotheses 2 (H2).
There are alternative configurations leading to the absence of PRAC considering the contribution of HRC.
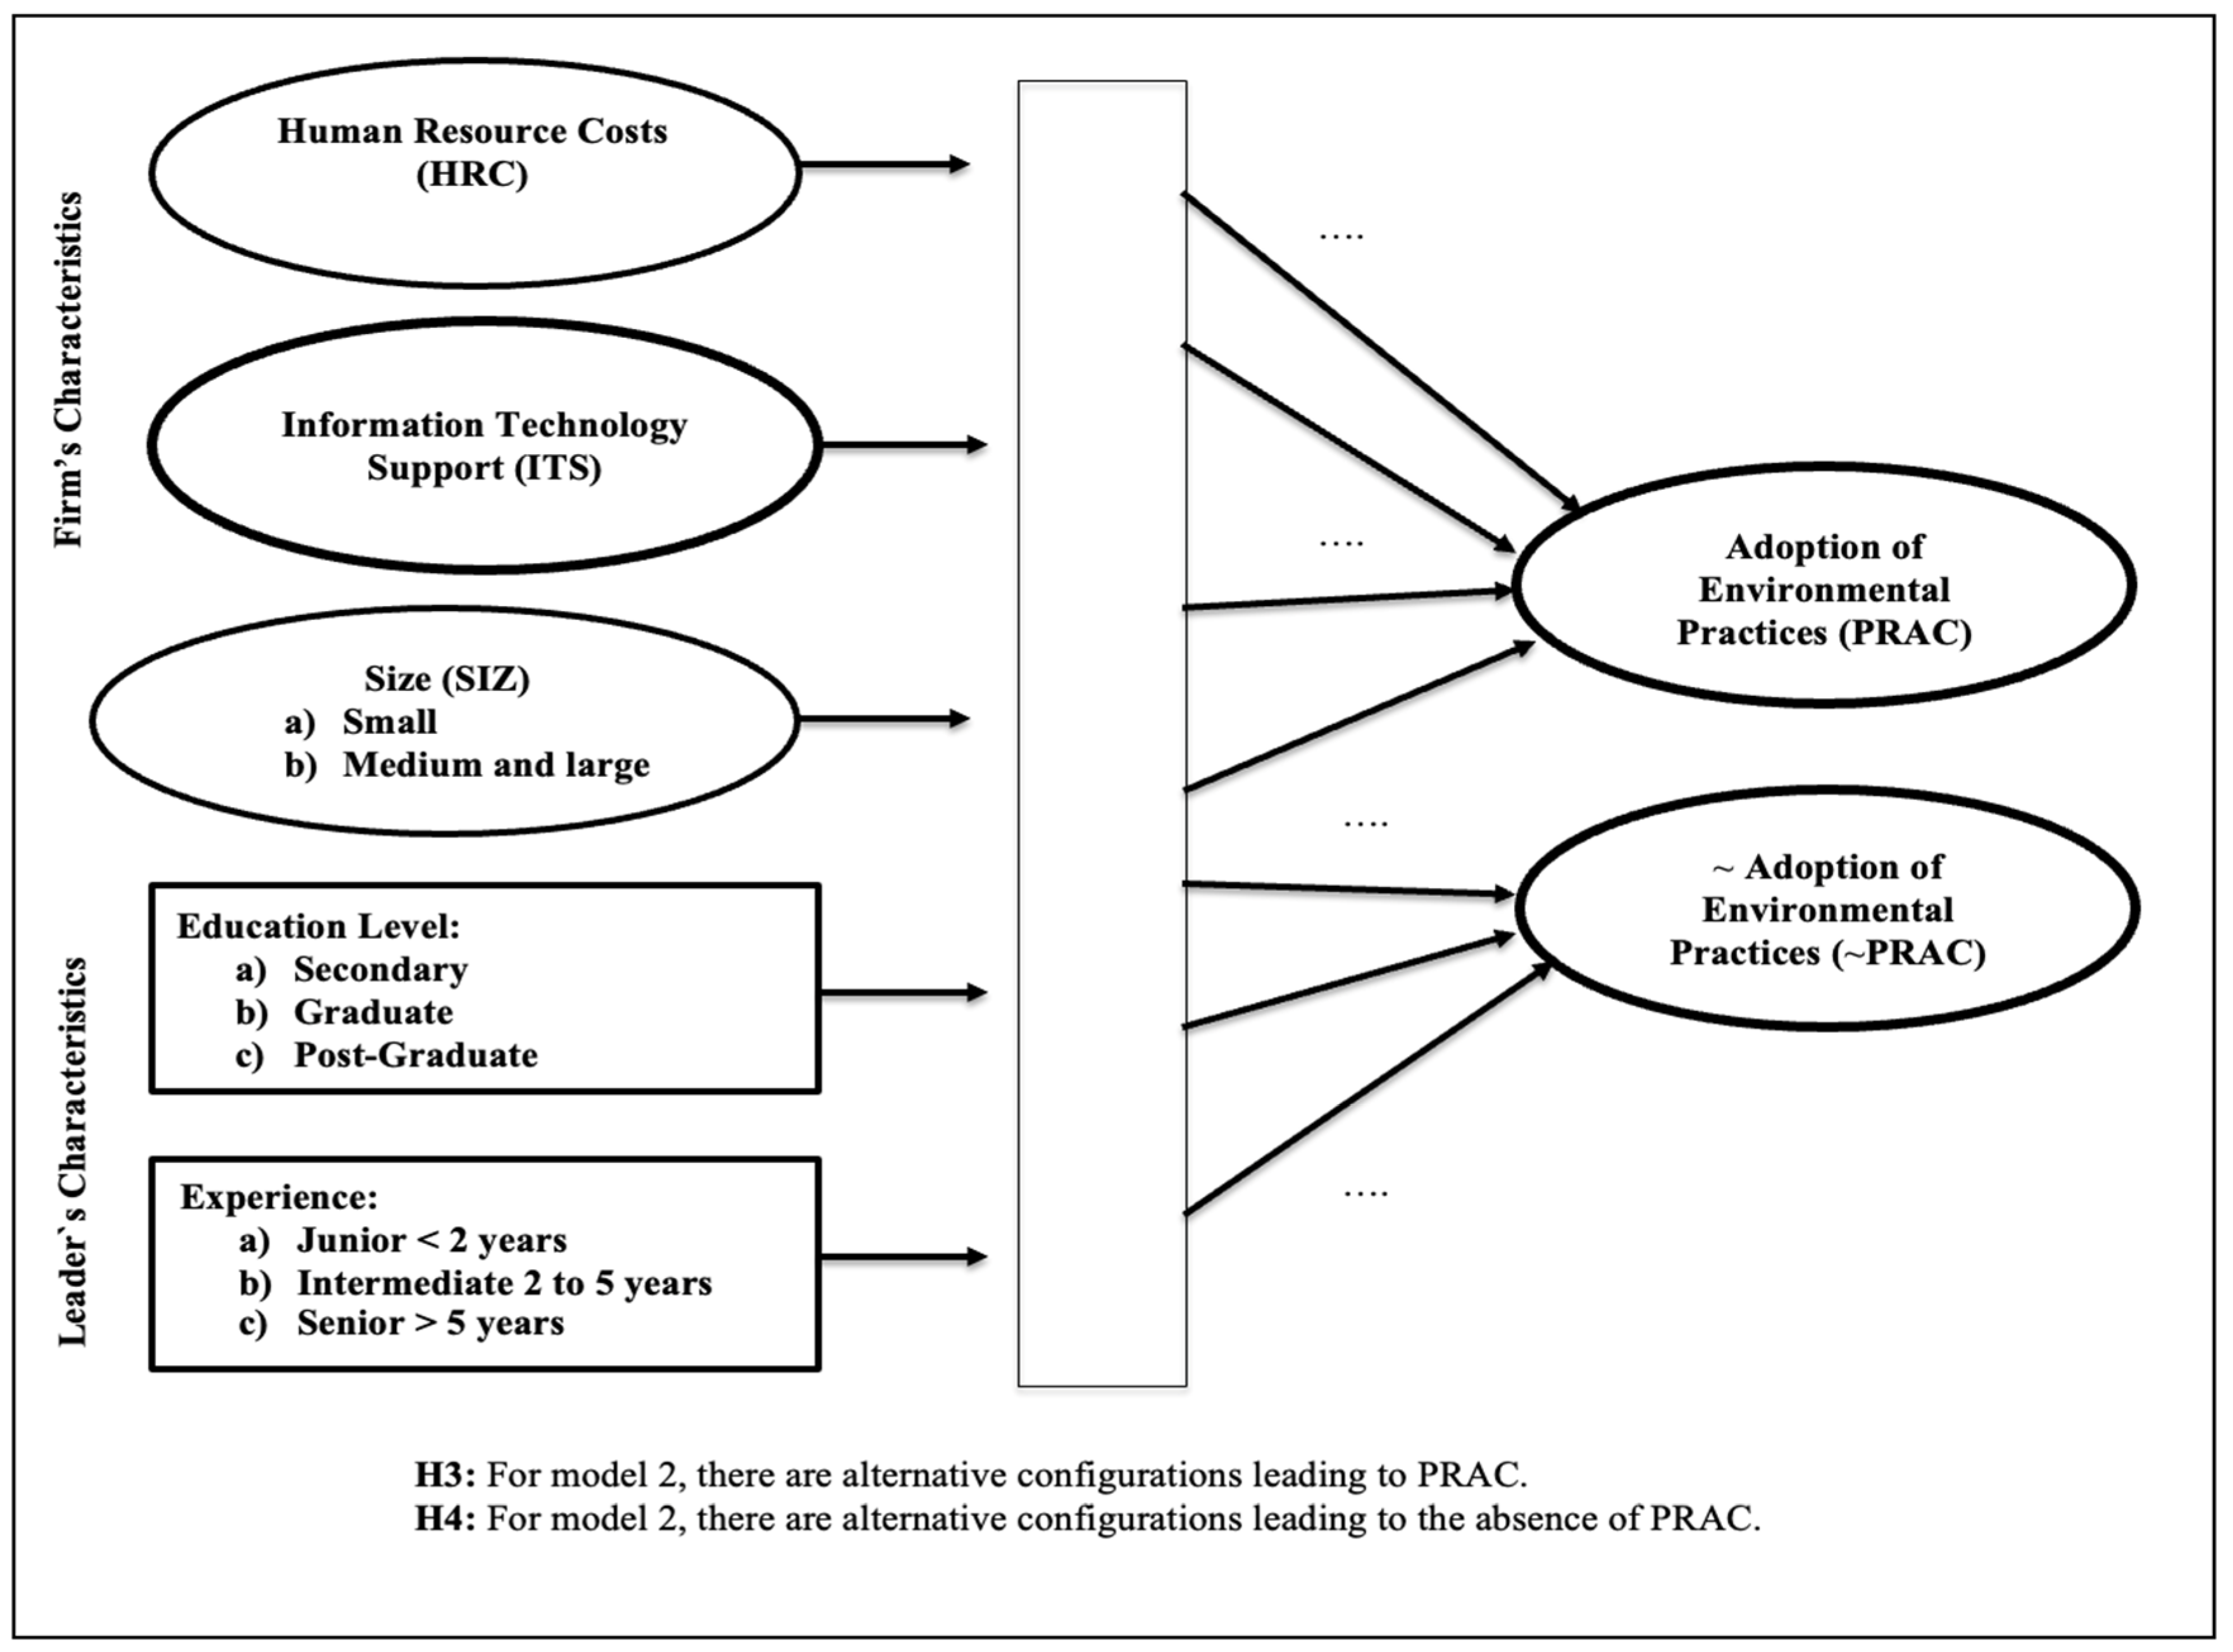
For Model 2:
Hypotheses 3 (H3).
There are alternative configurations leading to PRAC considering the contribution of ITS.
Hypotheses 4 (H4).
There are alternative configurations leading to the absence of PRAC considering the contribution of ITS.
For Model 3:
Hypotheses 5 (H5).
There are alternative configurations leading to PRAC considering the contribution of HRC and ITS.
Hypotheses 6 (H6).
There are alternative configurations leading to the absence of PRAC considering the contribution of HRC and ITS.
Our paper shows the configurations that managers and firms must select to achieve PRAC. In this way, different pathways constituting the related paths between HRC, OLC, ITS and PRAC can be found. Furthermore, the paper includes managerial experience and educational level together with the size of the firm as factors that can also facilitate PRAC [53].

Figure 1.
Research Model 1 for adoption of environmental practices (with OLC).
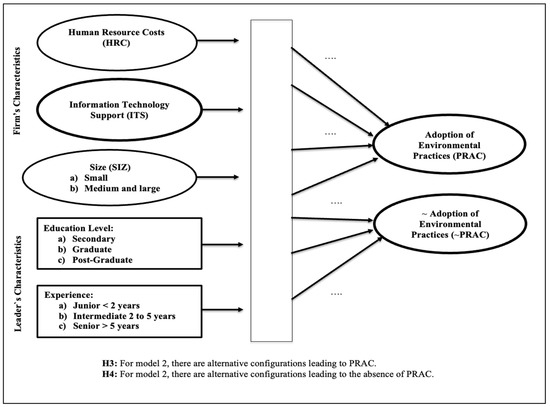
Figure 2.
Research Model 2 for adoption of environmental practices (with ITS).
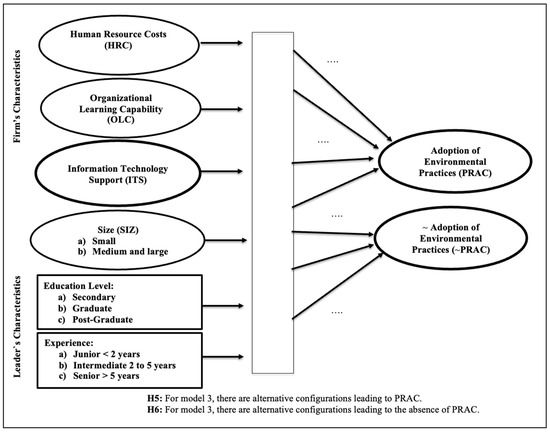
Figure 3.
Research integrative Model 3 for adoption of environmental practices.
3.2. Methodology: Qualitative Methods
We used a qualitative method to test PRAC (hypotheses H1 and H2 in Model 1; hypotheses H3 and H4 in Model 2; hypotheses H5 and H6 in Model 3). Osabutey and Jin [54] showed that traditional quantitative methods have limitations when it comes to explaining complex interactions between variables. In addition, other recent studies applied qualitative methods. For example, Oyemomi et al. [55] used fsQCA. FsQCA is a qualitative method that identifies the essential and necessary conditions of the configurations that will lead to the outcome variable or its absence [56]. Therefore, this study completely covers all pathways for PRAC.
In this paper, we used fuzzy set QCA (fsQCA) from [57] to evaluate these hypotheses. There are many applications of quantitative methods in management and business [37] but few applications of qualitative methods and mixed methods.
In similar fields to management, fsQCA has been applied instead of quantitative methods (PLS, SEM and others) and also as a complementary method to quantitative methods [58,59]. Any correlational method in general assumes symmetrical relations between variables and measures the net effect of each variable on the assessed output. On the other hand, fsQCA allows discovery of the combinatorial effects of variables on the output as well as accepting that these interactions could be asymmetrical [58].
Therefore, in this paper, we applied fsQCA and found the logical implication that combining the presence/absence of input variables provides better output results. Consequently, consistency and coverage measures inform the relevance of the discovered logical implications.
3.3. Sample and Measurement Assessment
An online survey was conducted in Qualtrics® and sent to 6846 innovative SMEs in Portugal within twelve industrial sectors: manufacturing, energy supply and gas; water supply and pollution; edifice; trade and repair of vehicles; transportation and storage; catering; information and communication; accommodation; scientific activities; administrative activities; health activities; and other services. In total, 385 responses were obtained. After applying a rigorous cleaning process [60], the final sample constituted 349 firms. Therefore, the response rate was 5.1%. The sample included firms from the twelve industrial sectors existing in the population.
The questionnaire was originally written in English and was later translated into Portuguese by an expert translator for sending to firms. It was then back-translated into English. In this way, errors related to language interpretation were minimized. In addition, to carry out the questionnaire, five academics and managers who are experts in the field were contacted to show them a pilot questionnaire and subsequently launch the final questionnaire. Finally, the firms were called by telephone to inform them of the study and the questionnaires were then sent to them. It is a simple and quick survey to answer that takes an average of 20 min to answer, and the people surveyed were the CEOs in each firm. Our goal was for CEOs to respond to the questionnaire because they are the top decision-makers and know all the tools and information necessary to try to achieve economic and environmental development in the firm [61].
The characteristics of the sample are detailed below. The majority of CEOs surveyed were women (56.4%), and more than 76.5% had undergraduate or graduate degrees. Their average age was 43.6 years and more than 77.4% had more than five years of seniority in their firms. In relation to the characteristics of the firm, more than 92.4% had more than 10 years of experience and the majority (65.9%) had 50 employees or fewer. Of them, 63.6% were public limited companies and 36.4% were collective firms. On the other hand, to test the non-response bias, a trend extrapolation test was used to compare the responses that took the longest to arrive with those that arrived first. Our study considers that the responses that took the longest to arrive are those that arrived in the second phase of the study and after carrying out a reminder. These responses may be very similar to those of those firms that never responded since, had it not been for the reminder, they might never have responded [62]. After conducting a one-way analysis of variance (ANOVA), we could see that there were no significant differences between CEOs who responded early and those who responded late in terms of company size (number of employees in the firm) and age.
Therefore, the sample was representative of the population.
3.4. Variables and Measurements
HRC measures the total expenditure on human resources per year as a proportion of the firm’s total invoicing [63].
All other measurements used Likert-type scales [64]. The ranges were from 7 (strongly agree) to 1 (strongly disagree). To measure OLC, we used a scale validated by Alegre and Chiva [65]. This scale has five dimensions: risk-taking, experimentation, participatory decision-making, interaction with the external environment and dialogue. To measure ITS, a validated scale by Lee and Choi [18] was used, and finally, PRAC was measured with the scale by Molina-Azorín et al. [66]. Therefore, we had the construct OLC with five dimensions and the two constructs ITS and PRAC with one dimension.
The level of education of the manager (EL) was measured taking into account what type of education they have: high school, undergraduate and graduate. The experience (EXP) of the manager was measured according to the number of years in the firm: junior, <2 years; intermediate, 2 to 5 years; senior, >5 years. Finally, the size of the firm (SIZ) was measured according to the number of employees: small: <50 employees; medium: >50 employees [67,68].
A confirmatory factor analysis (CFA) was used in AMOS® to study the validity of the measurement. All of the items showed good levels; therefore, there is a good validity in the measurement.
Table 1 summarizes the variables’ descriptions and the CFA.

Table 1.
Variables’ descriptions and CFA.
The survey was designed to reduce common method bias (CMB) [69]. We used Harman’s single factor test to evaluate the existence of CMB. No evidence of CMB existed.
3.5. Fuzzy Set Qualitative Comparative Analysis (fsQCA)
As demonstrated in this study, by using fsQCA [52], we can obtain more than one configuration or causal pathway that leads to PRAC. In this way, we can find a set of alternative causal configurations that a firm can use to arrive at PRAC. In our study, the causal pathways in fsQCA that could lead to PRAC corresponded to combinations of the following variables: HRC, OLC, ITS, EL, EXP and SIZ. Since OLC has five dimensions (OLC-E, OLC-R, OLC-I, OLC-D and OLC-P), it was measured using the fsQCA “fuzzyand” function. This function corresponds to the mathematical logical operation in Boolean algebra called “intercept.” Therefore, when OLC appears in a causal configuration, it means that this condition is a five-dimensional cumulative condition. The end result will be PRAC.
Calibration
FsQCA is a methodological tool that uses calibrated data to transform categorical, demographic and Likert scale variables into transformed conditions with values ranging from zero to one. The process of ranking conditions from full membership to non-membership is known as calibration. In order to transform the variables measured with the Likert scale (OLC, ITS and PRAC) into a fuzzy set, the mean values of the items must be calculated [70]. Our measurement scale was a seven-point scale, and so we identified total non-membership, the crossover point and total membership as two, four and six, respectively. According to Woodside et al. [71] the cut-off values were adjusted according to the number of elements of each variable and their statistics. EXP and EL are categorical variables that we calibrated at three levels (1, 0.5, 0), and SIZ is a binary variable that did not need calibration (it adopts the value of zero or one) (Table 2).
Table 2.
Descriptive statistics and calibrations of outcome and causal conditions.
4. Results
4.1. fsQCA
The present study used fsQCA [52,55,72] to assess the conditions of need and sufficiency. The need for a condition was based on seeing the impact on the achievement of PRAC (a consistency score greater than 0.90) [73]. The sufficiency of a condition was based on seeing the extent of its relationship with PRAC (configurations of various conditions that lead to PRAC). Acceptable solutions must respect the coverage level within the range of limits from 0.25 to 0.90 [72] and the coherence threshold of 0.75 [52,72].
In Model 1 (PRAC = f(HRC, OLC, EL, EXP, SIZ)), seven alternative causal configurations exist that lead to PRAC, and three alternative causal configurations exist for the absence of PRAC. Therefore, in Model 1, both H1 and H2 are supported.
In Model 2 (PRAC = f(HRC, ITS, EL, EXP, SIZ)), six alternative causal configurations exist that lead to PRAC, and four alternative causal configurations exist for the absence of PRAC. Therefore, in Model 2, both H3 and H4 are supported.
Finally, in Model 3 (PRAC = f(HRC, ITS, OLC, EL, EXP, SIZ)), eight alternative causal configurations exist that lead to PRAC, and seven alternative causal configurations exist for the absence of PRAC. Therefore, in Model 3, both H5 and H6 are supported.
Therefore, these results offer managers seven different options to reach PRAC for Model 1, six different options to reach PRAC adoption for Model 2 and eight different options to reach PRAC for Model 3. In short, all the hypotheses proposed in our research models are supported.
The results show that firms that invest heavily in establishing learning systems for their employees and achieve a high OLC are more likely to be able to perform PRAC because they will have more alternative paths that lead to it. Specifically, seven causal configurations lead to PRAC compared to only three that lead to its absence according to Model 1. This is a clear sign that PRAC in firms can be achieved through the implementation of a culture of learning where firms implement mechanisms that contribute to the development of knowledge and ethical values to obtain good adoption and implementation of PRAC. On the other hand, from the results obtained from Model 2, it is clear that technology is also a very necessary tool in firms for PRAC. In this case, Model 2 shows that there are six paths that lead to PRAC with technology, versus only four that lead to its absence.
If we interpret the results of both models separately, we can indicate that technology is important for PRAC in firms, but the factors derived from the learning capacity are essential, since with OLC, we can find more ways that lead to achieving PRAC (seven in Model 1) and less in its absence (three in Model 1) than with a model in which there is only a strong investment in technological and non-human factors, where we see that there is one less path that leads to PRAC (six in Model 2) and one more path than in Model 1 that can lead to its absence (four in Model 2). This means that only with the implementation of technology can firms achieve PRAC through different, alternative routes, but there are also a high number of ways that can lead to its absence—that is, there is a probability that the expected result can be achieved as much as other results that are not expected. However, with investment in OLC, it can occur because there are also causal configurations that lead us to the absence of PRAC. The probability of this being the case is lower because in this scenario, there are more paths that lead us to the expected result—that is, to the adoption of PRAC.
Finally, it should be noted that the results show that joint investment in OLC and ITS is optimal for the PRAC, since by integrating factors of both types, we add one more path that leads to the desired result with respect to Model 1. However, it is important to point out that Model 3, where OLC and ITS are included together to reach PRAC, is also the research model that presents more paths towards PRAC absence. From this, it can be interpreted that technology is an adequate tool to achieve the result, but always with adequate human control so as to not incur precisely the opposite effect.
4.2. Causal Configurations
Table 3 shows the reported intermediate solution related to Model 1. This solution shows the seven causal configurations that lead to PRAC. It can be seen that there are four causal configurations with four conditions and three configurations of three conditions. Table 3 shows that HRC, OLC and SIZ are the three relevant core conditions for PRAC. HRC is present in one causal configuration that leads to PRAC, whereas OLC is present in three and SIZ in two. Model 1 also shows that there are three causal configurations for the absence of PRAC (Table 4). Here, HRC, EL, EXP and SIZ are the core conditions for the absence of PRAC. However, OLC is not present in these solutions.
Table 3.
Intermediate solutions for PRAC with OLC. Model 1(a): PRAC = f(HRC, OLC, EL, EXP, SIZ). Overall solution coverage: 0.641398. Overall solution consistency: 0.770815.
Table 4.
Intermediate solutions for~PRAC with OLC. Model 1(b): ~PRAC = f(HRC, OLC, EL, EXP, SIZ). Overall solution coverage: 0.393352. Overall solution consistency: 0.806792.
The intermediate solution in Model 2 (Table 5) shows six configurations that lead to PRAC. ITS and SIZ are the core conditions for PRAC. ITS is present in five causal configurations and SIZ in one. Model 2 also shows four causal configurations for the absence of PRAC (Table 6). Here, HCR, EL and SIZ are the core conditions for the absence of PRAC. However, ITS is not present in these solutions. The literature indicates that firms that have a high investment in ITS tend to have a good PRAC [27,28], since technology provides the necessary mechanisms to convert inputs into sustainable outputs [25,29].
Table 5.
Intermediate solutions for PRAC with ITS. Model 2(a): PRAC = f(HRC, ITS, EL, EXP, SIZ). Overall solution coverage: 0.786787. Overall solution consistency: 0.737200.
Table 6.
Intermediate solutions for~PRAC with ITS. Model 2(b): ~PRAC = f(HRC, ITS, EL, EXP, SIZ). Overall solution coverage: 0.634377. Overall solution consistency: 0.797445.
Finally, the intermediate solution in Model 3 (Table 7) shows eight configurations that lead to PRAC. Here, ITS, OLC and SIZ are the core conditions. ITS is present in five causal configurations, OLC in three and SIZ in one. In addition, there are seven causal configurations for the absence of PRAC (Table 8). Here, HRC, OLC, EL and SIZ are the core conditions. However, ITS is not present in these solutions.
Table 7.
Intermediate solutions for PRAC with OLC and ITS. Model 3(a): PRAC = f(HRC, ITS, OLC, EL, EXP, SIZ). Overall solution coverage: 0.721535. Overall solution consistency: 0.771006.
Table 8.
Intermediate solutions for~PRAC with OLC and ITS. Model 3(b): ~PRAC = f(HRC, ITS, OLC, EL, EXP, SIZ). Overall solution coverage: 0.631863. Overall solution consistency: 0.796658.
Therefore, the results show that the assumptions of fsQCA [53] are fulfilled. It can be seen how more than one configuration of causal conditions leads to PRAC, and thus, the existence of alternative combinations of causal conditions leading to PRAC is confirmed. Furthermore, since these alternative causal configurations can produce the same result, the principle of equifinality is confirmed. The solutions present coverage and coherence values that respect the limits set by the literature [72].
Furthermore, our research models show that there are no pathways leading to PRAC when ITS or OLC are not included in the model as a causal condition. In this way, our work reveals the key role that technology and human resources management have in achieving PRAC. The increasing introduction, improvement and application of new technologies in firms help, in a clear and simple way, to improve and apply more environmental practices within firms. New technologies, greater investment in human resources, a culture of organizational learning and other firm and manager characteristics such as education, experience or firm size can actually encourage the adoption of environmental practices [2].
5. Discussion and Conclusions
Few empirical studies have shown the different pathways for PRAC [8,37,53]. This paper contributes to the theoretical and empirical research with a relevant and original qualitative method, fsQCA. The fsQCA in our research models shows new relations, pathways and alternative configurations for PRAC that other quantitative tools do not discover. Therefore, fsQCA offers alternative complex configurations of conditions for PRAC. Our research models show that both sources are relevant: technological- and human-resources-based. Contrary to quantitative approaches that only show single linear models of PRAC in SMEs [73], our results show several pathways for PRAC and its absence. They are relevant findings: the former points SMEs towards the ways to reach PRAC and the latter warns SMEs about the pathways that do not lead to PRAC.
Given the results from our research models, all hypotheses are supported. In Model 1(a), OLC is a core condition for PRAC in three pathways. It is the main core condition in this model for PRAC. However, in Model 1(b), the absence of OLC is a core condition in two of three pathways for the absence of PRAC. Similar considerations can be made about ITS in Model 2(a and b). In Model 2(a), ITS is a core condition for PRAC in five pathways of six. However, in Model 2(b), the absence of ITS is a core condition in all pathways for the absence of PRAC, totaling four pathways.
It is notable that OLC and ITS are complete substitutes (configuration 1 in Table 3 and configuration 5 in Table 5). Such results reveal similar substitutable contributions of the technological- and human-resources-based sources to PRAC. Yet, SMEs have other options that lead them to PRAC. Regarding Table 4 and Table 6, the evidence shows that the absence of either OLC or ITS is associated with not adopting environmental practices.
Finally, in the full and integrative Model 3(a), ITS is a core condition for PRAC. ITS is present in five pathways for PRAC, and OLC is present in three pathways for PRAC, for eight total pathways. It is a relevant finding because technology is the most important factor leading to PRAC. Model 3(b) also shows that the absence of ITS is a core condition in six pathways for the absence of PRAC.
Therefore, our separate research models show that there are more ways to reach PRAC if we take into account human learning factors within the organization, such as OLC, than if we only adopt technological factors, such as ITS. In this sense, with Model 1 (OLC), seven paths lead us to PRAC, and with Model 2 (ITS), six paths lead us to PRAC. It is also relevant to note that the model that incorporates OLC without ITS (Model 1) offers firms fewer avenues in which they face the absence of PRAC, as there are only three. On the other hand, the model that incorporates ITS without OLC (Model 2) offers firms one more way to avoid PRAC; that is to say, in this case, four routes can condition the absence of PRAC, one more than in the previous case. Therefore, if we analyze these results separately, we could advise firms that, mainly, the optimum component that can shape and be present in different combinations to arrive at PRAC is the OLC. Additionally, we may interpret it such that depending on technology involves a higher risk of not achieving PRAC.
On the other hand, the main conclusions drawn from the complete and integrative research model shown in this paper to obtain PRAC show that it is desirable for firms to dedicate their efforts to joint investment in personnel management practices and the adoption of new technologies for obtaining PRAC. As can be seen in Model 3, when the two sources (OLC and ITS) are integrated, more paths are obtained to reach PRAC than when a firm decides to focus more on one source than on another to obtain PRAC. Our third model makes it clear that the adoption of information technologies such as key training, storage and communication can help firms to be more efficient when implementing PRAC. Regarding the lack of PRAC (Table 8), it is worth noting that all the configurations present the lack of OLC or ITS or both. Such findings seem to validate a contrario the relevancy of such conditions to achieve PRAC.
Finally, there seems to be a special contribution of ITS to PRAC, since there is no configuration leading to PRAC in the absence of ITS (Table 5 and Table 7). On the contrary, it is possible to reach PRAC with the absence of OLC (configurations 3, 4 and 5 in Table 3, and configurations 2, 3 and 4 in Table 7). Such findings give strong support to arguments in the literature on the technological basis of PRAC [74].
In addition, in the three research models, other conditions such as EL, EXP and SIZ are relevant for obtaining PRAC. For example, in Model 1, SIZ is a central condition to reach PRAC in two causal alternatives. EL and EXP are important as well, but they are not central conditions. In addition, it must also be taken into account that the conditions related to the manager and the size of the firm, if not managed properly, can lead to other combinations or paths heading towards the absence of PRAC. In Model 2, SIZ is also a central condition for obtaining PRAC in at least one path. The same happens in Model 3.
In summary, our findings indicate that by focusing on variables such as OLC, a firm can find more paths that lead to PRAC. Additionally, with a joint focus on OLC and ITS, it must be taken into account that only investing in ITS and not in OLC is riskier when trying to implement PRAC.
The main goal of this paper was to find complementary pathways and conclusions about PRAC by applying fsQCA [73,74,75]. Our study shows that fsQCA is a strong tool that allows discernment of how factors are combined to generate (or not) PRAC. Moreover, fsQCA allows the important roles of OLC and ITS in inducing PRAC to be checked. Likewise, fsQCA discovers asymmetrical relations between conditions.
For managers, the findings indicate that to adopt PRAC in firms, it is necessary to consider a TBL approach and factors derived from it. States should focus on new formulas and regulations that help firms to be able to adopt PRAC through a clear commitment to their human resources and technology. In addition, several practical recommendations can be derived from our study:
- 1.
- Investment in human resources for the adoption of PRAC:
- ∗
- Training in sustainability for the application of PRAC.
- ∗
- Management of motivation and values of employees oriented towards PRAC.
- ∗
- Foster a corporate culture of sustainability.
- ∗
- Creation of internal rules for correct application of PRAC.
- 2.
- Organizational learning capacity for PRAC:
- ∗
- Foster a culture of trial and error—that is, of experimentation.
- ∗
- Possibility of taking risks when implementing new sustainable practices.
- ∗
- Promotion of teamwork and communication.
- ∗
- Let employees give ideas and make decisions regarding PRAC.
- 3.
- Information technology support for the adoption of PRAC:
- ∗
- Implementation of environmental information collection systems to determine the needs internal and external to the firm.
- 4.
- Adoption of environmental practices:
- ∗
- Code of ethics for all members of the firm that facilitates the adoption of PRAC.
- ∗
- Implementation of energy-saving practices.
- ∗
- Implementation of reverse logistics practices.
- ∗
- Diversification of products towards economic products.
- ∗
- Training on social and environmental needs.
We are aware that this study has some limitations. This paper focused on a limited population segment: 349 Portuguese SMEs certified as innovative in various industry categories (manufacturing, power and gas supply; water supply and pollution; building; vehicle trade and repair; transport and storage; catering; information and communication; housing; scientific activities; administrative activities; health activities; other services). Future studies should focus on other segments but also on other economic agents (large businesses, transnational corporations, etc.). Although our study to analyze the representativeness of the sample in the population was based on an analysis of variance (ANOVA) between firms that responded early and those that responded late, future studies could perform further analyses of representativeness, for example, between how the firms of one industrial sector and another behave among the twelve that were represented in this study to ensure that there are no significant differences between the responses of the different industrial sectors. In addition, our study focused only on three factors that can affect the adoption of environmental practices in firms: company size and the level of education and experience of the manager. Future studies may include more business factors such as the type of firm according to its legal and commercial form and more characteristics of the manager, such as political ideology, among others, that may affect the adoption of environmental practices. Another constraint is that this research is confined to Portugal. The conclusions may have been slightly different if the survey had a wider geographical extension or if it were answered in another country, so the use of an international database may allow improvement of the conclusions that we have extracted in this work. Although the response rate was representative, it can be considered slightly low (5.1%). Another issue that could be addressed in future research is the sustainability of ITS. It is certain that ITS leads to PRAC, but the development of technology can also affect PRAC negatively. Technology requires intensive computation resources with large energy consumption. Therefore, the findings of this research should be interpreted with the above considerations and new studies. Finally, let us point out that the use of alternative analytical tools to fsQCA based on fuzzy sets, such as fuzzy correlation indexes and fuzzy multiple criteria decision-making, and other quantitative methods, such as SEM, etc., should be considered in future research.
Author Contributions
Conceptualization, L.M.-P., J.G., and C.C.; methodology, L.M.-P., J.G., and C.C.; software, L.M.-P.; validation, L.M.-P., J.G., and C.C.; formal analysis, L.M.-P.; investigation, L.M.-P., J.G., and C.C.; data curation, L.M.-P.; writing—original draft preparation, L.M.-P.; writing— review and editing, L.M.-P., J.G., and C.C.; visualization, L.M.-P., J.G., and C.C.; supervision, J.G. and C.C.; project administration, J.G. and C.C.; funding acquisition, L.M.-P., J.G., and C.C. All authors have read and agreed to the published version of the manuscript.
Funding
The authors are grateful for the economic support provided by FCT (Fundação para a Ciência e Tecnologia Portugal) grant number UIDB/04521/2020, by “Agencia Estatal de Investigación” (AEI) of the Ministerio de Ciencia e Innovación del Gobierno de España grant number PID2019-107546GA-I00, by Consejería de Educación of the Junta de Castilla y León and the “Fondo Europeo de Desarrollo Regional” (FEDER) grant number SA106P20, and by Junta de Castilla y León and the European Regional Development Fund for the financial support to the Research Unit of Excellence “Economic Management for Sustainability” (GECOS) grant number CLU-2019-03.
Institutional Review Board Statement
Not applicable.
Informed Consent Statement
Not applicable.
Data Availability Statement
Not applicable.
Acknowledgments
Authors acknowledge helpful comments of anonymous reviewers.
Conflicts of Interest
The authors declare no conflict of interest.
References
- Cohen, B.; Smith, B.; Mitchell, R. Toward a sustainable conceptualization of dependent variables in entrepreneurship research. Bus. Strategy Environ. 2008, 17, 107–119. [Google Scholar] [CrossRef]
- Glavas, A.; Mish, J. Resources and Capabilities of Triple Bottom Line Firms: Going Over Old or Breaking New Ground? J. Bus. Ethics 2015, 127, 623–642. [Google Scholar] [CrossRef]
- Kennedy, E.B.; Marting, T.A. Biomimicry: Streamlining the Front End of Innovation for Environmentally Sustainable Products. Res. Technol. Manag. 2016, 59, 40–47. [Google Scholar] [CrossRef] [Green Version]
- Wagner, M. Innovation and competitive advantages from the integration of strategic aspects with social and environmental management in European firms. Bus. Strategy Environ. 2009, 18, 291–306. [Google Scholar] [CrossRef]
- Hall, J.; Wagner, M. Integrating Sustainability into Firms’ Processes: Performance Effects and the Moderating Role of Business Models and Innovation. Bus. Strategy Environ. 2012, 21, 183–196. [Google Scholar] [CrossRef]
- Gasbarro, F.; Annunziata, E.; Rizzi, F.; Frey, M. The Interplay between Sustainable Entrepreneurs and Public Authorities: Evidence from Sustainable Energy Transitions. Organ. Environ. 2017, 30, 226–252. [Google Scholar] [CrossRef]
- Vollenbroek, F.A. Sustainable development and the challenge of innovation. J. Clean. Prod. 2002, 10, 215–223. [Google Scholar] [CrossRef]
- Muñoz-Pascual, L.; Curado, C.; Galende, J. The Triple Bottom Line on Sustainable Product Innovation Performance in SMEs: A Mixed Methods Approach. Sustainability 2019, 11, 1689. [Google Scholar] [CrossRef] [Green Version]
- Argote, L. Organizational Learning: Creating, Retaining and Transferring Knowledge, 2nd ed.; Springer: Media, PA, USA, 2013. [Google Scholar]
- Lichtenthaler, U. Absorptive Capacity, Environmental Turbulence, and the Complementarity of Organizational Learning Processes. Acad. Manag. J. 2009, 52, 822–846. [Google Scholar] [CrossRef]
- Henriques, A.; Richardson, J. The Triple Bottom Line, Does It All Add Up?: Assessing the Sustainability of Business and CSR; Earthscan Publications Ltd.: London, UK, 2004; ISBN 9781844070152. [Google Scholar]
- Roig-Tierno, N.; Kraus, S.; Cruz, S. The relation between coopetition and innovation/entrepreneurship. Rev. Manag. Sci. 2018, 12, 379–383. [Google Scholar] [CrossRef] [Green Version]
- Celma, D.; Martínez-Garcia, E.; Coenders, G. Corporate Social Responsibility in Human Resource Management: An analysis of common practices and their determinants in Spain. Corp. Soc. Responsib. Environ. Manag. 2014, 21, 82–99. [Google Scholar] [CrossRef]
- Gratton, L.; Ghoshal, S. Managing Personal Human Capital: New Ethos for the ‘Volunteer’employee. Eur. Manag. J. 2003, 21, 1–10. [Google Scholar] [CrossRef]
- Barney, J.B. Looking inside for competitive advantage. Acad. Manag. Perspect. 1995, 9, 49–61. [Google Scholar] [CrossRef] [Green Version]
- Davidescu, A.A.; Apostu, S.-A.; Paul, A.; Casuneanu, I. Work Flexibility, Job Satisfaction, and Job Performance among Romanian Employees—Implications for Sustainable Human Resource Management. Sustainability 2020, 12, 6086. [Google Scholar] [CrossRef]
- Gold, A.H.; Malhotra, A.; Segars, A.H. Knowledge Management: An Organizational Capabilities Perspective. J. Manag. Inf. Syst. 2001, 18, 185–214. [Google Scholar] [CrossRef]
- Lee, H.; Choi, B. Knowledge Management Enablers, Processes, and Organizational Performance: An Integrative View and Empirical Examination. J. Manag. Inf. Syst. 2003, 20, 179–228. [Google Scholar] [CrossRef]
- Roberts, J. From Know-how to Show-how? Questioning the Role of Information and Communication Technologies in Knowledge Transfer. Technol. Anal. Strateg. Manag. 2000, 12, 429–443. [Google Scholar] [CrossRef]
- Eggers, F.; Hatak, I.; Kraus, S.; Niemand, T. Technologies That Support Marketing and Market Development in SMEs-Evidence from Social Networks. J. Small Bus. Manag. 2017, 55, 270–302. [Google Scholar] [CrossRef]
- Richter, C.; Kraus, S.; Brem, A.; Durst, S.; Giselbrecht, C. Digital entrepreneurship: Innovative business models for the sharing economy. Creat. Innov. Manag. 2017, 26, 300–310. [Google Scholar] [CrossRef]
- Kraus, S.; Roig-Tierno, N.; Bouncken, R.B. Digital innovation and venturing: An introduction into the digitalization of entrepreneurship. Rev. Manag. Sci. 2019, 13, 519–528. [Google Scholar] [CrossRef]
- Riggins, F.J.; Rhee, H. Developing the leaming network using extranets. Int. J. Electron. Commer. 1999, 4, 65–83. [Google Scholar] [CrossRef]
- Medina-Molina, C.; Rey-Moreno, M.; Felício, J.A.; Romano Paguillo, I. Participation in crowdfunding among users of collaborative platforms: The role of innovativeness and social capital. Rev. Manag. Sci. 2019, 13, 529–543. [Google Scholar] [CrossRef]
- Song, W.; Wang, G.Z.; Ma, X. Environmental innovation practices and green product innovation performance: A perspective from organizational climate. Sustain. Dev. 2020, 28, 224–234. [Google Scholar] [CrossRef]
- Wade, M.; Hulland, J. Review: The Resource-Based View and Information Systems Research: Review, Extension, and Suggestions for Future Research. MIS Q. 2004, 28, 107. [Google Scholar] [CrossRef]
- Kohli, R.; Grover, V. Business value of IT: An essay on expanding research directions to keep up with the times. J. Assoc. Inf. Syst. 2008, 9, 22–39. [Google Scholar] [CrossRef]
- Kim, G.; Shin, B.; Kim, K.K.; Lee, H.G. IT capabilities, process-oriented dynamic capabilities, and firm financial performance. J. Assoc. Inf. Syst. 2011, 12, 487–587. [Google Scholar] [CrossRef] [Green Version]
- Orlikowski, W.J.; Iacono, C.S. Research commentary: Desperately seeking the “IT” in IT research—A call to theorizing the IT artifact. Inf. Syst. Res. 2001, 12, 121–134. [Google Scholar] [CrossRef] [Green Version]
- Vrchota, J.; Řehoř, P.; Maříková, M.; Pech, M. Critical Success Factors of the Project Management in Relation to Industry 4.0 for Sustainability of Projects. Sustainability 2020, 13, 281. [Google Scholar] [CrossRef]
- Jaw, B.-S.; Liu, W. Promoting organizational learning and self-renewal in Taiwanese companies: The role of HRM. Hum. Resour. Manag. 2003, 42, 223–241. [Google Scholar] [CrossRef]
- Argote, L.; Ingram, P.; Levine, J.M.; Moreland, R.L. Knowledge Transfer in Organizations: Learning from the Experience of Others. Organ. Behav. Hum. Decis. Processes. 2000, 82, 1–8. [Google Scholar] [CrossRef]
- Lichtenthaler, U. Determinants of absorptive capacity: The value of technology and market orientation for external knowledge acquisition. J. Bus. Ind. Mark. 2016, 31, 600–610. [Google Scholar] [CrossRef]
- Chiva, R.; Alegre, J.; Lapiedra, R. Measuring Organizational Learning Capability among the Workforce. Int. J. Manpow. 2007, 28, 224–242. [Google Scholar] [CrossRef]
- Saitua-Iribar, A.; Corral-Lage, J.; Peña-Miguel, N. Improving Knowledge about the Sustainable Development Goals through a Collaborative Learning Methodology and Serious Game. Sustainability 2020, 12, 6169. [Google Scholar] [CrossRef]
- Gavronski, I.; Ferrer, G.; Paiva, E.L. ISO 14001 certification in Brazil: Motivations and benefits. J. Clean. Prod. 2008, 16, 87–94. [Google Scholar] [CrossRef] [Green Version]
- Kraus, S.; Ribeiro-Soriano, D.; Schussler, M. Fuzzy-set Qualitative Comparative Analysis (fsQCA) in Entrepreneurship and Innovation Research—The Rise of a Method. Int. Entrep. Manag. J. 2018, 14, 15–33. [Google Scholar] [CrossRef]
- Fernández-Viñé, M.B.; Gómez-Navarro, T.; Capuz-Rizo, S.F. Eco-efficiency in the SMEs of Venezuela. Current status and future perspectives. J. Clean. Prod. 2010, 18, 736–746. [Google Scholar] [CrossRef]
- Ramanathan, R.; Black, A.; Nath, P.; Muyldermans, L. Impact of environmental regulations on innovation and performance in the UK industrial sector. Manag. Decis. 2010, 48, 1493–1513. [Google Scholar] [CrossRef]
- Aragón-Correa, J.A.; Hurtado-Torres, N.; Sharma, S.; García-Morales, V.J. Environmental strategy and performance in small firms: A resource-based perspective. J. Environ. Manag. 2008, 86, 88–103. [Google Scholar] [CrossRef]
- Chan, E.S.W.; Hawkins, R. Attitude towards EMSs in an international hotel: An exploratory case study. Int. J. Hosp. Manag. 2010, 29, 641–651. [Google Scholar] [CrossRef]
- Mohamed, S.T. The impact of ISO 14000 on developing world businesses. Renew. Energy 2001, 23, 579–584. [Google Scholar] [CrossRef]
- Camisón-Zornoza, C.; Lapiedra-Alcamí, R.; Segarra-Ciprés, M.; Boronat-Navarro, M. A Meta-analysis of Innovation and Organizational Size. Organ. Stud. 2004, 25, 331–361. [Google Scholar] [CrossRef]
- Rothwell, R.; Dodgson, M. Innovation and Size of Firm. In The Handbook of Industrial Innovation; Dodgson, M., Rothwell, R., Eds.; Edward Elgar Publishing: Cheltenham, UK, 1994; pp. 310–324. [Google Scholar]
- Vila, L.E.; Pérez, P.J.; Coll-Serrano, V. Innovation at the workplace: Do profesional competencies matter? J. Bus. Res. 2014, 67, 752–757. [Google Scholar] [CrossRef]
- Wang, M.H.; Yang, T.Y.; Liu, P.C. The impact of knowledge sharing and projects complexity on team creativity: An example of information systems development. J. Bus. Res. 2010, 12, 73–102. [Google Scholar]
- Bassellier, G.; Benbasat, I.; Reich, B.H. The Influence of Business Managers’ IT Competence on Championing IT. Inf. Syst. Res. 2003, 14, 317–336. [Google Scholar] [CrossRef]
- Kuemmerle, W. Optimal scale for research and development in foreign environments—An investigation into size and performance of research and development laboratories abroad. Res. Policy 1998, 27, 111–126. [Google Scholar] [CrossRef]
- Kumar, N.; Saqib, M. Firm size, opportunities for adaptation and in-house R & D activity in developing countries: The case of Indian manufacturing. Res. Policy 1996, 25, 713–722. [Google Scholar] [CrossRef]
- Gumbau, M. Análisis microeconómico de los determinantes de la innovación: Aplicación a las empresas industriales españolas. Rev. Española Econ. 1997, 14, 41–66. [Google Scholar]
- Molero, J.; Buesa, M. Patterns of technological change among Spanish innovative firms: The case of the Madrid region. Res. Policy 1996, 25, 647–663. [Google Scholar] [CrossRef]
- Fiss, P.C. Building Better Causal Theories: A Fuzzy Set Approach to Typologies in Organization Research. Acad. Manag. J. 2011, 54, 393–420. [Google Scholar] [CrossRef] [Green Version]
- Drummond, S.; O’Driscoll, M.P.; Brough, P.; Kalliath, T.; Siu, O.L.; Timms, C.; Riley, D.; Sit, C.; Lo, D. The relationship of social support with well-being outcomes via work–family conflict: Moderating effects of gender, dependants and nationality. Hum. Relat. 2017, 70, 544–565. [Google Scholar] [CrossRef]
- Osabutey, E.L.C.; Jin, Z. Factors influencing technology and knowledge transfer: Configurational recipes for Sub-Saharan Africa. J. Bus. Res. 2016, 69, 5390–5395. [Google Scholar] [CrossRef] [Green Version]
- Oyemomi, O.; Liu, S.; Neaga, I.; Alkhuraiji, A. How knowledge sharing and business process contribute to organizational performance: Using the fsQCA approach. J. Bus. Res. 2016, 69, 5222–5227. [Google Scholar] [CrossRef] [Green Version]
- Curado, C.; Muñoz-Pascual, L.; Galende, J. Antecedents to innovation performance in SMEs: A mixed methods approach. J. Bus. Res. 2018, 89, 206–215. [Google Scholar] [CrossRef]
- Ragin, C.C. Using qualitative comparative analysis to study causal complexity. Health Serv. Res. 1999, 34, 1225–1239. [Google Scholar]
- Leischnig, A.; Henneberg, S.C.; Thornton, S.C. Net versus combinatory effects of firm and industry antecedents of sales growth. J. Bus. Res. 2016, 69, 3576–3583. [Google Scholar] [CrossRef] [Green Version]
- Kaya, B.; Abubakar, A.M.; Behravesh, E.; Yildiz, H.; Mert, I.S. Antecedents of innovative performance: Findings from PLS-SEM and fuzzy sets (fsQCA). J. Bus. Res. 2020, 114, 278–289. [Google Scholar] [CrossRef]
- Hair, J.; Anderson, R.; Tatham, R.; Black, W. Multivariate Data Analysis; Prentice-Hall: Saddle River, NJ, USA, 2005. [Google Scholar]
- Muñoz-Pascual, L.; Galende, J. The impact of knowledge and motivation management on creativity: Employees of innovative Spanish companies. Empl. Relat. 2017, 39, 732–752. [Google Scholar] [CrossRef]
- Armstrong, J.S.; Overton, T.S. Estimating nonresponse bias in mail surveys. J. Mark Res. 1977, 14, 396–402. [Google Scholar] [CrossRef] [Green Version]
- Celma, D.; Martínez-Garcia, E.; Raya, J.M. Socially responsable HR practices and their effects on employees’ wellbeing: Empirical evidence from Catalonia, Spain. Eur. Res. Manag. Bus. Econ. 2018, 24, 82–89. [Google Scholar] [CrossRef]
- Westland, J.C. Data collection, control, and sample size. In Structural Equation Models: From Paths to Networks; Springer: Cham, Switzerland, 2015; pp. 83–115. [Google Scholar]
- Alegre, J.; Chiva, R. Assessing the impact of organizational learning capability on product innovation performance: An empirical test. Technovation 2008, 28, 315–326. [Google Scholar] [CrossRef]
- Molina-Azorín, J.F.; Claver-Cortés, E.; Pereira-Moliner, J.; Tarí, J.J. Environmental practices and firm performance: An empirical analysis in the Spanish hotel industry. J. Clean. Prod. 2009, 17, 516–524. [Google Scholar] [CrossRef]
- Blau, J.R.; McKinley, W. Ideas, Complexity, and Innovation. Adm. Sci. Q. 1979, 24, 200. [Google Scholar] [CrossRef]
- Graves, S.B.; Langowitz, N.S. Innovative productivity and returns to scale in the pharmaceutical industry. Strateg. Manag. J. 1993, 14, 593–605. [Google Scholar] [CrossRef]
- Podsakoff, P.M.; MacKenzie, S.B.; Lee, Y.; Podsakoff, N.P. Common method biases in behavioral research: A critical review of the literature and recommended remedies. J. Appl. Psychol. 2003, 88, 879–903. [Google Scholar] [CrossRef]
- Woodside, A.; Hsu, S.-Y.; Marshall, R. General theory of cultures’ consequences on international tourism behavior. J. Bus. Res. 2011, 64, 785–799. [Google Scholar] [CrossRef]
- Woodside, A.; Prentice, C.; Larsen, A. Revisiting Problem Gamblers’ Harsh Gaze on Casino Services: Applying Complexity Theory to Identify Exceptional Customers. Psychol. Mark. 2015, 32, 65–77. [Google Scholar] [CrossRef] [Green Version]
- Ragin, C. Redesigning Social Inquiry: Fuzzy Sets and Beyond; University of Chicago Press: Chicago, IL, USA, 2008. [Google Scholar]
- Arias-Oliva, M.; de Andrés-Sánchez, J.; Pelegrín-Borondo, J. Fuzzy Set Qualitative Comparative Analysis of Factors In-fluencing the Use of Cryptocurrencies in Spanish Households. Mathematics 2021, 9, 324. [Google Scholar] [CrossRef]
- Barcellos-Paula, L.; De la Vega, I.; Gil-Lafuente, A.M. The Quintuple Helix of Innovation Model and the SDGs: Lat-in-American Countries’ Case and Its Forgotten Effects. Mathematics 2021, 9, 416. [Google Scholar] [CrossRef]
- Flores-Romero, M.B.; Pérez-Romero, M.E.; Álvarez-García, J.; del Río-Rama, M.d.l.C. Fuzzy Techniques Applied to the Analysis of the Causes and Effects of Tourism Competitiveness. Mathematics 2021, 9, 777. [Google Scholar] [CrossRef]

Publisher’s Note: MDPI stays neutral with regard to jurisdictional claims in published maps and institutional affiliations. |
© 2021 by the authors. Licensee MDPI, Basel, Switzerland. This article is an open access article distributed under the terms and conditions of the Creative Commons Attribution (CC BY) license (https://creativecommons.org/licenses/by/4.0/).