Abstract
The main purpose of the current study is the generalization and further development of the Modigliani–Miller theory taking into account one of the conditions of the real functioning of companies for the case of paying income tax with an arbitrary frequency (monthly, quarterly, semi-annual or annual payments). While a return is not required more than once a year, businesses may be responsible for filing estimated taxes based on profits earned. This requirement is dependent on showing a profit. For example, sole proprietors must file estimated taxes on profits quarterly, on the 15th day of April, June, September and January. In Russia, tax on profit payments could be made annually, quarterly, or monthly. We suppose, that more frequent payment of income tax impacts on all main financial indicators of the company and leads to some important consequences. We use analytical and numerical methods: we derive all main formulas of the modified Modigliani–Miller theory theoretically and then use them to obtain all main financial indicators of company and their dependences on different parameters by MS Excel. We show that: (1) all Modigliani–Miller theorems, statements and formulas change; (2) all main financial indicators, such as the weighted average cost of capital (WACC), company value, V, and equity cost, ke, depend on the frequency of tax on profit payments; (3) in the case of income tax payments more than once per year (at ), as takes place in practice, the WACC, company value, V and equity cost, and ke start depend on debt cost, kd, while in ordinary (classical) Modigliani–Miller theory all these values do not depend on kd; (4) obtained results allow a company to choose the number of payments of tax on profit per year (of course, within actual tax legislation): more frequent payments of income tax are beneficial for both parties, for the company and for the tax regulator.
1. Introduction
1.1. Literature Review
Modigliani and Miller in their first paper [1] in 1958 considered the impact of financial leverage on main financial indicators for perpetuity companies without any taxes. Later [2,3], Modigliani and Miller accounted for taxation of corporate profits, but did not take into account the individual taxes of investors. Merton Miller [4] in 1977 developed a model showing the influence of financial leverage on the capitalization of the company accounting the corporate and individual taxes. We will use the following definitions: TS—the tax rate on individual investor income (from his ownership by stock of corporation), TC—tax on corporate profits rate, TD—tax rate on interest income from the provision of investor–individuals of credits to other companies and/or investors. Income from shares could come in the form of a dividend and, as well, as capital profits, so that TS is a weighted average value of effective rates of tax on dividends and capital profits on shares, while the income from the provision of loans usually comes in the form of the interest. The latter are usually taxed at a higher rate. Accounting for the individual taxes, the capitalization of the financially independent company is equal to:
A term accounts the individual taxes. The numerator in (1) shows the operating company’s profit part, which remains at the investors, after the company paid taxes on their profits. After this shareholders pay individual taxes on income from ownership by stock. The individual taxes reduce profits for remaining investors, which also reduce an overall assessment of the capitalization of the financially independent company.
In 1969 Hamada [5] united CAPM (Capital Asset Pricing Model) and Modigliani–Miller theory with taxes. For the equity cost of a financially dependent company the following formula has been derived, which includes financial and business risk of the company:
here bU is the β–coefficient of the company of the same group of business risk, that the company under consideration, but with zero financial leverage. Formula (2) represents the desired profitability of equity capital ke as a sum of three components: risk–free profitability kF, compensating to shareholders a temporary value of their money, premium for business risk , and premium for financial risk .
If the company does not have borrowing (D = 0), the financial risk factor will be equal to zero (the third term is drawn to zero), and its owners will only receive the premium for business risk.
As a more general formula for the WACC, the famous Modigliani–Miller (MM) has been derived and discussed by a few authors (Farber, A., R. Gillet, and A. Szafarz, 2006, Fernandez, P., 2007, Harris, R., and J. Pringle, Miles, J.A., and J.R. Ezzel, Peter MDeMarzo et al.) [6,7,8]. It takes the following form (Equation (18) in FGS, 2006 [6])
where WACC is the weighted average cost of capital, where k0 is the expected return on a financially independent company, kd is the expected return on the debt and kTS is the expected return on the tax shield, V is the capitalization of the financially dependent company, VTS is the value of the tax shield, D is the debt value and TC is the corporate tax rate.
This formula is derived from the definition of the weighted average cost of capital and the balance sheet identity (for a similar presentation, see [9]). At any point in time it should, therefore, be verified what returns are annually or continuously compounded.
Practical applicability of Equation (15) (while it is fully general) requires additional conditions. Indeed, when the WACC is constant over time, the value of a financially dependent company can be computed by discounting with the WACC of the unlevered free cash-flows. Therefore, it is interesting to consider the special cases when WACC is constant. The resulting particular formulas can also be found in textbooks [10,11,12].
It was assumed by Modigliani and Miller in 1963 [2] that the debt value D is constant. As the expected after–tax cash-flow of the financially independent company is fixed, V0 is also constant. It is assumed that kTS = kD and the value of the tax shield is TS = tD. Therefore, the capitalization of the financially dependent company V is a constant and the general WACC Formula (15) simplifies to a constant WACC:
Here k0 is the equity cost of the financially independent (the unlevered) company (equity cost at leverage level L = 0).
But our opinion is that “classical” Modigliani–Miller (MM) theory, which comes from the suggestion that the expected returns on the debt kd and the tax shield kTS are equal (because both of them have debt nature), is much more reasonable and in our paper we modify the “classical” MM theory, which is still widely used in practice.
The world famous trade-off theory has been considered the cornerstone in the solution of the problem of optimal capital structure for a company for many decades and is still used today for decision analysis on capital structure. Below we give two examples.
Frank, M., and Goyal, V. paper [13] “consider the importance of different factors under the capital structure decisions on example of publicly traded American firms from 1950 to 2003. They found that the most important factors for explaining the market leverage level are: median industry leverage (+ effect on leverage), market-to-book assets ratio (−), profits (−), tangibility (+), log of assets (+), and expected inflation (+)”. As well, authors have found that “dividend-paying firms tend to have lower leverage level. Under considering book leverage level they have found somewhat similar effects. But for book leverage, the influence of company size, the market-to-book ratio, and the effect of inflation are not reliable”. The empirical evidence seems to authors reasonably consistent with some versions of the trade-off theory of capital structure.
Serrasqueiro, Z., and Caetano, A. in 2015 [9] analyzed “to what extent decisions on the capital structure of small and medium-sized enterprises (SMEs) are closer to the assumptions of trade-off theory or to the assumptions of hierarchy theory. They used a sample of small and medium-sized enterprises located in the Portuguese hinterland, using dynamic LSDVC as the valuation method, and the empirical evidence suggests that the most profitable and oldest SMEs are less leveraged, confirming pecking order theory’s forecasts. Larger SMEs are leveraging more borrowing, confirming the predictions of trade-off theory and hierarchy theory. In addition, SMEs are significantly adjusting their current debt levels towards the optimal debt ratio, which confirms the predictions of the compromise theory. It was concluded that theories of compromise and hierarchy are not mutually exclusive in explaining decisions about the capital structure of small and medium-sized enterprises.
However, the bankruptcy of trade-off theory has been proven by Brusov et al. in 2013 [14] within the Brusov–Filatova–Orekhova (BFO) theory [15,16,17,18,19,20,21]. They have shown that the suggestion of risky debt financing (and growing credit rate near the bankruptcy) surprisingly does not lead to growing of weighted average cost of capital (WACC), with leverage level: WACC still decreases with leverage level. This means that the minimum in the dependence of WACC on leverage level is absent as well as the maximum in the dependence of company capitalization on leverage level. Thus, the well-known trade-off theory lacks an optimal capital structure. The explanation for this fact was made by Brusov et al. in 2013 [14] by analyzing the dependence of the cost of equity capital on the leverage level on the assumption that debt capital is risky.
Modigliani–Miller have considered tax shields from the interest on debt in the capital structure increase the capitalization of the company. In 1980, De Angelo and Masulis [22] moved further in the theoretical examination of tax shields. They have noted that there are tax deductibles for companies other than debt to reduce their corporate tax burden and debt and non–debt tax shields should be accounted. Depreciation, investment tax credits, or net–loss carry forwards could represents examples of such kind of non–debt tax shields. The first to test for these tax effects suggested by DeAngelo and Masulis in 1980 [22] has been carried out by Bradley, Jarrell and Kim in 1984 [23]. In contrast to the prediction in De Angelo and Masulis [22], they have shown by regressing company-specific debt-to-value ratios on non-debt tax shields, that debt is positively related to non-debt tax shields as measured by depreciation and investment tax credits. Titman and Wessels in 1988 [24] found that their “results do not provide support for an effect on debt ratios arising from non-debt tax shields….” It was pointed out in 2003 by Graham [25] that if a company invests heavily and uses debt financing to invest, a positive relation between such proxies for non-debt tax shield and debt may result. A mechanical positive relation of this type overwhelms and renders unobservable any substitution effects between debt and non–debt tax shields.
One of the most serious limitations of the Modigliani–Miller theory is the suggestion about perpetuity of the companies. In 2008, Brusov–Filatova–Orekhova [15] lifted up this limitation and they have shown that the accounting of the finite lifetime (or finite age) of the company leads to drastic changes of all the results by Modigliani–Miller [1,2,3,4]: all financial indicators of the company such as the equity cost, ke, the weighted average cost of capital, WACC, the capitalization of the company etc. (in the presence of corporative taxes). As was shown, a lot of qualitatively new effects in corporate finance, obtained within Brusov–Filatova–Orekhova theory [14,15,16,17,18,19,20,21], are absent in Modigliani–Miller theory [1,2,3,4]. The Brusov–Filatova–Orekhova formula for WACC has the following form:
We use the following definitions:
| D | value of debt capital of the company |
| S | value of equity capital of the company |
| cost and fraction of debt capital of the company | |
| cost and fraction of equity capital of the company | |
WACC | financial leverage weighted average cost of capital |
| k0 is the equity cost for financially independent company. T is tax on profit. |
BFO theory has destroyed some main existing principles of financial management: among them trade off theory, which was considered a keystone of formation of optimal capital structure of the company during many decades and the bankruptcy of which has been proven by Brusov–Filatova–Orekhova [14].
1.2. Focus and Objective of the Article
The tax shield plays a crucial role in both main capital structure theories: BFO theory and its perpetuity limit Modigliani–Miller theory. How it is formed influences the results of both theories. Both of them describe the case of annual payments of tax of profit, but in practice these payments are made more frequent: semi-annually, quarterly, monthly. While a return is not required more than once a year, businesses may be responsible for filing estimated taxes based on profits earned. This requirement is dependent on showing a profit. For example, sole proprietors must file estimated taxes on profits quarterly, on the 15th day of April, June, September and January. In Russia tax on profit payments could be made annually, quarterly, monthly. In the current paper we show that the account of frequency of payment of tax on profit within the Modigliani–Miller theory turns out to be very important and leads to significant consequences.
To study this problem we modify the Modigliani–Miller theory for the case of arbitrary frequency of payment of tax on profit and show that:
- all Modigliani–Miller theorems, statements and all formulas change;
- all main financial indicators, such as the weighted average cost of capital, WACC, company value, V and equity cost, ke, depend on the frequency of tax on profit payments. This allows the company to manage WACC, V, ke etc. by choosing the number of payments of tax of profit p per year;
- increase the number of payments of tax of profit per year leads to decrease of the cost of attracting capital and increase of the company value;
- obtained results allow the company to choose the number of payments of tax of profit per year, as many, as it is profitable to it (of course, within actual tax legislation);
- in case of income tax payments more than once per year (at ), as take place in practice, the weighted average cost of capital, WACC, company value, V and equity cost, ke start depend on kd, while in ordinary (classical) Modigliani–Miller theory all these values do not depend on kd.
- the tilt angle of the curve of equity cost, ke (L), decreases with the number of payments of tax of profit p, this modifies the dividend policy of the company, because the economically justified value of dividends is equal to equity cost.
The structure of the paper is as follows:
- (1)
- We give an introduction to traditional approach, Modigliani–Miller theory and to its modifications.
- (2)
- We modify the Modigliani–Miller theory for the case of arbitrary frequency of payments of tax on profit and obtain modified Modigliani–Miller theorems as well as new formulas for the weighted average cost of capital, WACC, for the equity cost, ke, and for the capitalization of the company, V.
- (3)
- Within the modified Modigliani–Miller theory (MMM theory) we study numerically within Microsoft Excel the dependence of the main financial indicators of the company (WACC, ke, V) on leverage level L and on debt cost kd at arbitrary frequency of payments of tax on profit.
- (4)
- Based on the results obtained we come to some very important conclusions and give recommendations to companies about how frequently they should pay tax on profit in order to decrease the cost of attracting capital and to increase the capitalization of the company.
2. Modification of the Modigliani–Miller Theory for the Case of Arbitrary Frequency of Payments of Tax on Profit
For investigation we use analytical and numerical methods: in Section 2 we derive all main formulas of the modified Modigliani–Miller theory theoretically and then use them in Section 3 to obtain all main financial indicators of company and their dependences on different parameters by MS Excel. All analytical and numerical results are obtained here for the first time.
2.1. Tax Shield
Let us calculate first the tax shield, TS, in the Modigliani–Miller theory for the case of p payments of tax on profit per year:
Here D is debt value, kd is debt cost, p is the number of payments of tax on profit per year.
TS represents a geometric progression with denominator .
Summing the progression, one obtains:
Note, that in case of classical Modigliani–Miller theory:
It is easy to obtain this result from (7), putting the frequency of payments of tax on profit p = 1.
2.2. The Weighted Average Cost of Capital (WACC)
Let us now calculate the WACC in the Modigliani–Miller theory for the case of p payments of tax on profit per year.
From the Modigliani–Miller theorem we have for the company value V:
Here V0 is the value of unlevered company.
Putting Expression (7) for TS, we obtain:
Substituting , one obtains:
Accounting, that,
we have:
Here CF is the company’s income for one period. From here we arrive to the expression for the WACC for the case of p payments of tax on profit per year.
Note, that in the case of classical Modigliani–Miller theory:
It is easy to obtain this result from (14), putting the frequency of payments of tax on profit per year p = 1.
2.3. Company Value, V
Let us now calculate the company value, V, in the Modigliani–Miller theory for the case of p payments of tax on profit per year.
Putting WACC value into first formula of (12) one gets for company value, V:
In case of “classical” Modigliani–Miller theory one has:
It is easy to obtain this result from (16), putting the frequency of payments of tax on profit per year p = 1.
2.4. Equity Cost, ke
Let us now calculate the equity cost, ke, in the Modigliani–Miller theory for the case of p payments of tax on profit per year.
General expression for the weighted average cost of capital, WACC, upon definition has the following form:
We obtain from (18) the following formula for the equity cost, ke,
Accounting from (14) the expression for the weighted average cost of capital, WACC,
one obtains:
Thus, we have the following formula for the equity cost, ke, in the case of arbitrary frequency of payment of tax on profit:
From this formula it is easy to obtain the “classical” Modigliani–Miller expression for the equity cost, ke, in case of annual payment of tax on profit, putting p = 1:
Thus, from Section 2.1, Section 2.2, Section 2.3 and Section 2.4 we come to the conclusion that in the case of income tax payments more than once per year (at ), as it takes place in practice, the weighted average cost of capital, WACC, company value, V and equity cost, ke, depend on kd, while in ordinary (classical) Modigliani–Miller theory all these values do not depend on kd.
In subsequent paragraphs we study numerically with the use of Microsoft Excel the dependence of the main financial indicators of the company (the weighted average cost of capital, WACC, the company value, V, the cost of equity, kd, on leverage level L for cases of practical interest with respect to equity and debt costs and frequency of payment of tax on profit p.
3. Results and Discussion
3.1. Dependence of the Weighted Average Cost of Capital (WACC) on Leverage Level L
3.1.1. Dependence of the WACC on Leverage Level L at Different Frequency of Payment of Tax on Profit p and Fixed Debt Cost kd
Let us start from the study numerically with use of Microsoft Excel of the dependence of the WACC on leverage level L at different frequency of payment of tax on profit p and fixed kd, using Formula (14):
The results of numerical calculations within Microsoft Excel are shown in Table A1 (see Appendix A) and in Figure 1 and Figure 2 below.
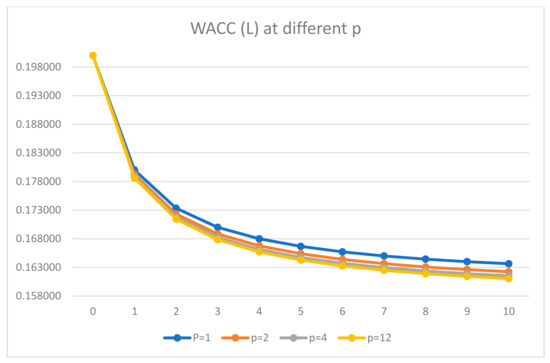
Figure 1.
Dependence of the weighted average cost of capital (WACC) on leverage level L at different frequency of payment of tax on profit p and fixed kd = 0.16.
Let us show these dependencies in a larger scale.
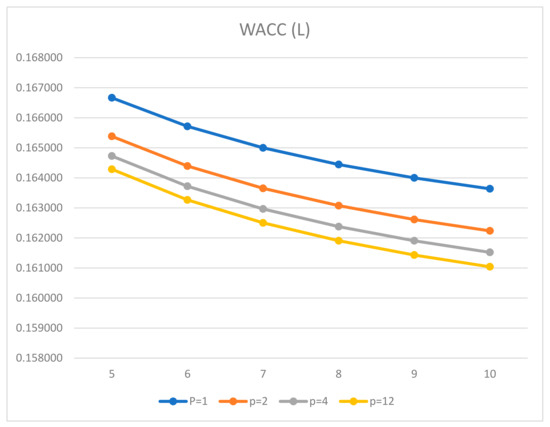
Figure 2.
Dependence of the weighted average cost of capital (WACC), on leverage level L at different frequency of payment of tax on profit p and fixed kd = 0.16 (larger scale).
From Table A1 (see Appendix A) and Figure 1 and Figure 2 it is seen that (1) the WACC decreases with leverage level L at all values of frequency of payments of tax on profit p; (2) with increase of p WACC decreases. As we will see below, this will lead to the increase of company value, V, with p.
To demonstrate that the above conclusion takes place for all values of equity cost (at zero leverage level L) k0, we consider one more example: k0 = 0.22 and different frequencies of payment of tax on profit p = 2; 4; 12. The results are presented in Table A2 (see Appendix A) and in Figure 3 below.
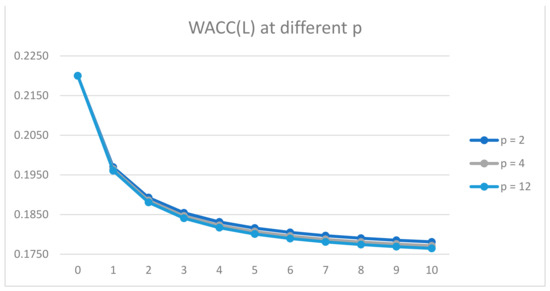
Figure 3.
Dependence of the weighted average cost of capital (WACC) on leverage level L at different p and fixed k0 = 0.22.
It is seen from Table A2 (see Appendix A) and Figure 3 that like the case of k0 = 0.2 in case of k0 = 0.22 (1) the WACC decreases with leverage level L at all values of frequency of payments of tax on profit p; (2) with the increase of p WACC decreases. As we will see below, this will lead to the increase of company value, V, with p. Thus, these conclusions take place for all values of equity cost (at zero leverage level L) k0.
3.1.2. Dependence of the Weighted Average Cost of Capital (WACC) on Leverage Level L at Different Debt Cost kd and Fixed Frequency of Payments of Tax on Profit p
In this paragraph we investigate the dependence of the WACC on leverage level L at different values of debt cost kd and fixed frequency of payments of tax on profit p.
Results of the numerical calculations within Microsoft Excel of the dependence of the WACC on leverage level L at different debt cost kd (12%; 14%; 16%; 18%) and fixed frequency of payments of tax on profit p = 12 are shown in Table A3 (see Appendix A) and in Figure 4 and Figure 5 below.
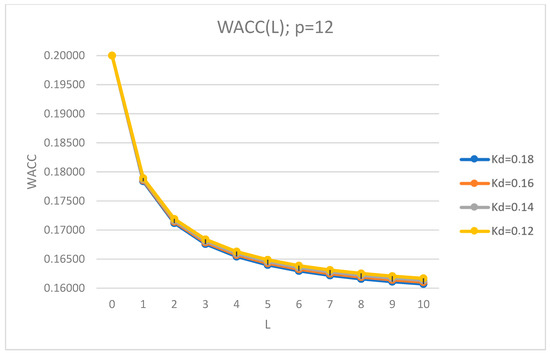
Figure 4.
Dependence of the weighted average cost of capital (WACC) on leverage level L at different debt cost kd (12%; 14%; 16%; 18%) and fixed frequency of payments of tax on profit p = 12.
Let us show these dependencies in a larger scale.
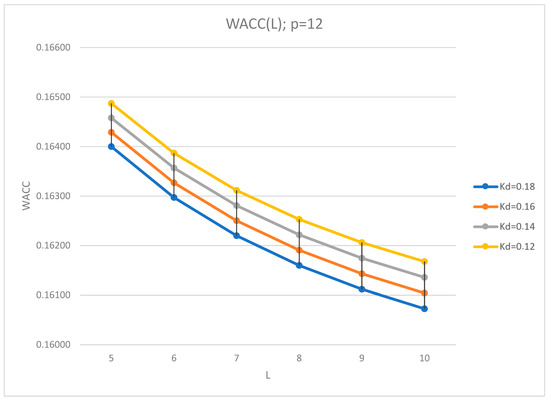
Figure 5.
Dependence of the weighted average cost of capital (WACC) on leverage level L at different debt cost kd (12%; 14%; 16%; 18%) and fixed frequency of payments of tax on profit p = 12 (larger scale).
Results of the numerical calculations within Microsoft Excel of the dependence of the WACC on leverage level L at different kd (12%; 14%; 16%; 18%) and fixed frequency of payments of tax on profit p = 4 are shown in Table A4 (see Appendix A) and in Figure 6 and Figure 7 below.
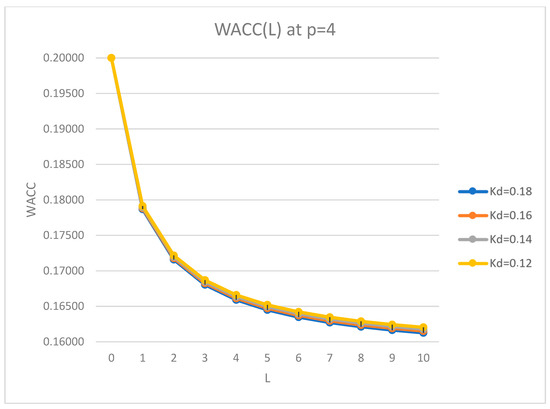
Figure 6.
Dependence of the weighted average cost of capital (WACC) on leverage level L at different debt cost kd (12%; 14%; 16%; 18%) and fixed frequency of payments of tax on profit p = 4.
Let us show these dependencies in a larger scale.
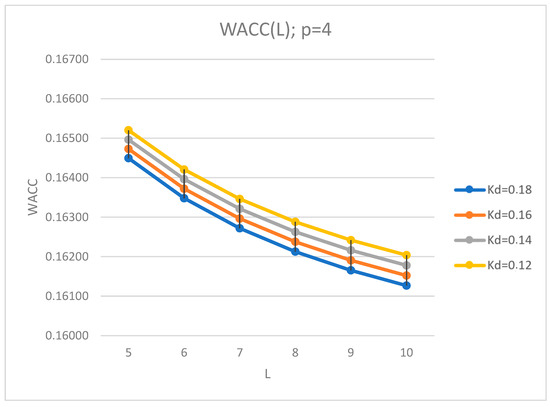
Figure 7.
Dependence of the weighted average cost of capital (WACC) on leverage level L at different kd (12%; 14%; 16%; 18%) and fixed frequency of payments of tax on profit p = 4 (larger scale).
From Table A3 and Table A4 (see Appendix A) and Figure 4, Figure 5, Figure 6 and Figure 7 it is seen that in the case of income tax payments more than once per year (at ), as takes place in practice, the WACC (and as we will see below, company value, V and equity cost, ke, depend on debt cost, kd, while in ordinary (classical) Modigliani–Miller theory all these values do not depend on debt cost, kd). The WACC decreases with leverage level L at all values of debt cost kd and at fixed frequency of payments of tax on profit p. With increase of kd WACC decreases. This is connected to the fact that the increase of kd increases the value of tax shield in case of income tax payments more than once per year (at ). Note, that in “classical” Modigliani–Miller theory with one income tax payment per year all financial indicators including tax shield don’t depend on debt cost, kd.
Thus, our modification of “classical” Modigliani–Miller theory in the case of the arbitrary frequency of payments of tax on profit p in addition to discovery of this new effect (all financial indicators including tax shield depend on debt cost, kd) allows us to study the impact of debt cost, kd on all financial indicators.
3.2. Dependence of the Company Capitalization, V, on Leverage Level L
In this section we study the dependence of the company capitalization, V, on leverage level L for the following situations: (1) at different frequency of payments of tax on profit p = 1; 2; 4; 12 and fixed debt cost kd = 0.16; (2) for fixed frequency of payments of tax on profit p and at different values of debt cost kd = 0.18; 0.16; 0.14; 012.
3.2.1. Dependence of the Company Capitalization, V, on Leverage Level L at Different Frequency of Payments of Tax on Profit p and Fixed Debt Cost kd
Let us start from the study of the dependence of the company capitalization, V, on leverage level L at different frequency of payments of tax on profit p and fixed debt cost kd.
The obtained results on the dependence of the company capitalization, V, on leverage level L at different p = 1; 2; 4; 12 and fixed kd = 0.16 are shown in Table A5 (in Appendix A) and in Figure 8 and Figure 9 below.
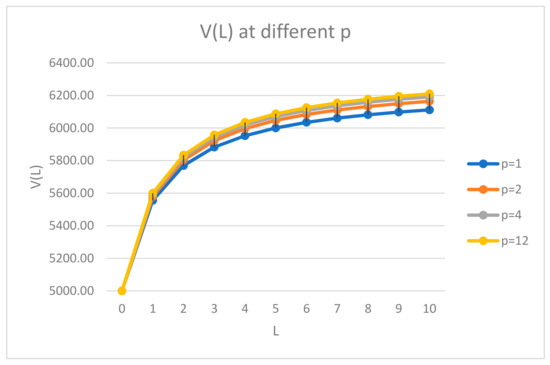
Figure 8.
Dependence of the company capitalization, V, on leverage level L at difference frequency of payments of tax on profit p (1; 2; 4; 12) and fixed debt cost kd = 0.16.
Let us show these dependencies in larger scale.
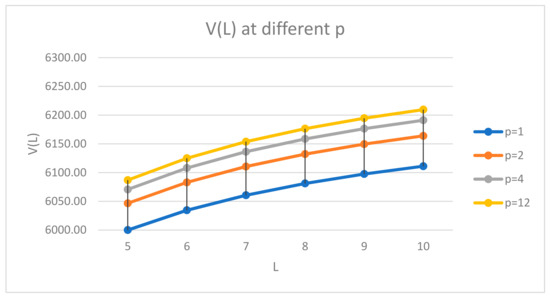
Figure 9.
Dependence of the company capitalization, V, on leverage level L at difference p (1; 2; 4; 12) and fixed kd = 0.16 (larger scale).
Results obtained on the dependence of the company capitalization, V, on leverage level L at different frequency of payments of tax on profit p = 1; 2; 4; 12 and fixed debt cost kd = 0.16 (Table A5 (see Appendix A) and Figure 8 and Figure 9) show that (1) the company capitalization, V, increases with leverage level L at all values of frequency of payment of tax on profit p; (2) the company capitalization, V, increases with p and reach maximum at p = 12. This means, that for the company it is more profitable to pay tax on profit as frequently as tax legislation allows.
3.2.2. Dependence of the Company Capitalization, V, on Leverage Level L at Different kd and Fixed p
Let us now study the dependence of the company capitalization, V, on leverage level L for fixed frequency of payments of tax on profit p and at different values of debt cost kd = 0.12; 0.14; 0.16; 018.
Results obtained on the dependence of the company capitalization, V, on leverage level L at fixed p (but for p = 2; 4 and 12) and different kd = 12%; 14%; 16%; 18% are shown in Table A6, Table A7 and Table A8 (see Appendix A) and in Figure 10, Figure 11, Figure 12, Figure 13, Figure 14 and Figure 15 below.
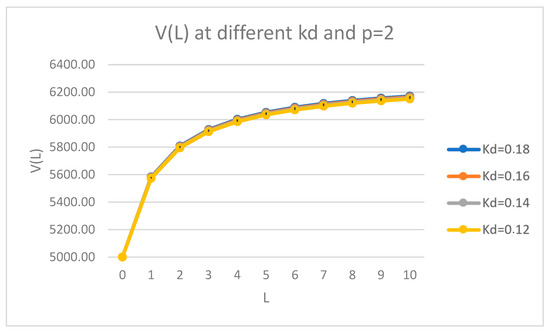
Figure 10.
Dependence of the company capitalization, V, on leverage level L at different debt cost. kd (12%; 14%; 16%; 18%) and fixed frequency of payments of tax on profit p = 2.
Let us show these dependencies in larger scale.
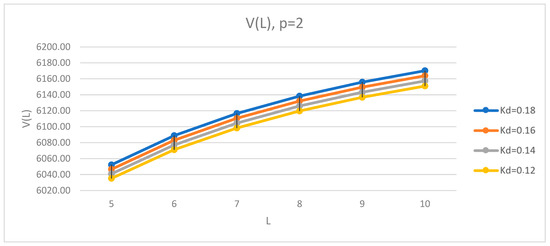
Figure 11.
Dependence of the company capitalization, V, on leverage level L different debt cost kd (12%; 14%; 16%; 18%) and fixed frequency of payments of tax on profit p = 2 (larger scale).
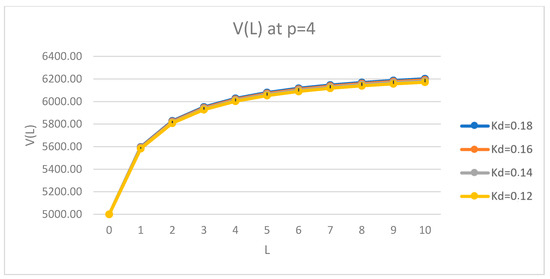
Figure 12.
Dependence of the company capitalization, V, on leverage level L at different debt cost kd (12%; 14%; 16%; 18%) and fixed frequency of payments of tax on profit p = 4.
Let us show these dependencies in larger scale.
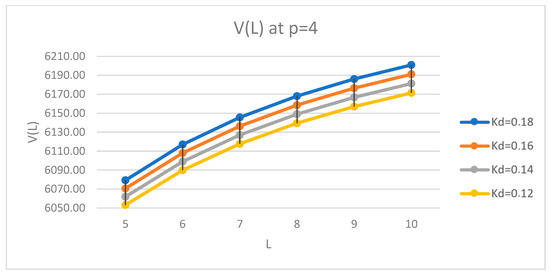
Figure 13.
Dependence of the company capitalization, V, on leverage level L at different debt cost kd (12%; 14%; 16%; 18%) and fixed frequency of payments of tax on profit p = 4 (larger scale).
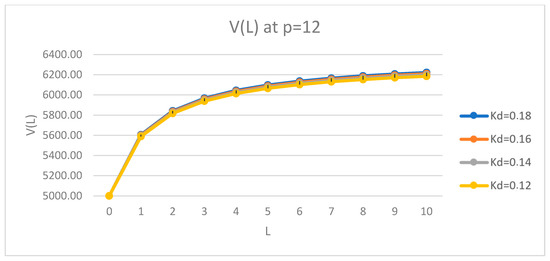
Figure 14.
Dependence of the company capitalization, V, on leverage level L at different debt cost kd (12%; 14%; 16%; 18%) and fixed frequency of payments of tax on profit p = 12.
Let us show these dependencies in larger scale.
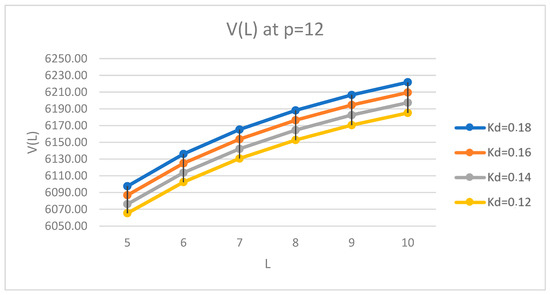
Figure 15.
Dependence of the company capitalization, V, on leverage level L at different debt cost kd (12%; 14%; 16%; 18%) and fixed frequency of payments of tax on profit p = 12 (larger scale).
Obtained results on the dependence of the company capitalization, V, on leverage level L at fixed p (but for p = 1;2;4;12) and different debt cost kd = 12%; 14%; 16%; 18% (Table A6, Table A7 and Table A8 in Appendix A and in Figure 10, Figure 11, Figure 12, Figure 13, Figure 14 and Figure 15) show that the company capitalization, V, increases with kd at each value of fixed frequency of payments of tax on profit p and reach maximum at debt cost kd = 18%. This corresponds to the decrease of the WACC with debt cost kd at fixed p, obtained by us in Section 3.1. This is connected to the fact that the increase of kd increases the value of tax shield in case of income tax payments more than once per year (at ). Note, that in “classical” Modigliani–Miller theory with one income tax payment per year all financial indicators, including company capitalization, V, do not depend on debt cost, kd.
3.3. Dependence of the Equity Cost, ke, on Leverage Level L
Knowing the cost of equity is very important because the economically justified cost of dividends is equal to the cost of equity. This could change the company’s dividend policy. In this section, we study the dependence of the equity cost, ke, on leverage level L for the following situations: (1) at different frequency of payments of tax on profit p = 1; 2; 4; 12 and fixed debt cost kd = 0.16; (2) for fixed frequency of payments of tax on profit p and at different values of debt cost kd = 0.12; 0.14; 0.16; 018.
3.3.1. Dependence of the Equity Cost, ke, on Leverage Level L at Different p and Fixed Kd = 0.16
Let us start from the study of the dependence of the equity cost, ke, on leverage level L at different p and fixed kd = 0.16. Results obtained on the dependence of the equity cost, ke, on leverage level L at fixed kd = 16% and different p = 1; 2; 4; 12 are shown in Table A9 (see Appendix A) and in Figure 16 and Figure 17 below.
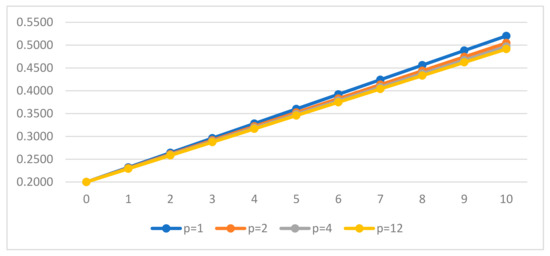
Figure 16.
Dependence of the equity cost, ke, on leverage level L at different frequency of payments of tax on profit p (1; 2; 4; 12) and fixed debt cost kd = 0.16.
Let us show these dependencies in a larger scale.
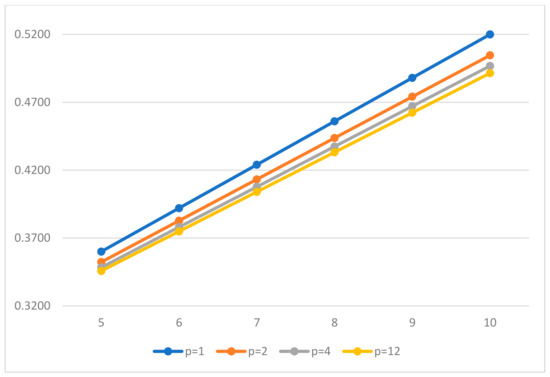
Figure 17.
Dependence of the equity cost, ke, on leverage level L at different p (1; 2; 4; 12) and fixed kd = 0.16 (lager scale).
Results obtained on the dependence of the equity cost, ke, on leverage level L at fixed debt cost kd = 16% and different frequency of payments of tax on profit p = 1; 2; 4; 12 (Table A9 in Appendix A and Figure 16 and Figure 17) show that: (1) the equity cost, ke, increases linearly with leverage level L at different p (1; 2; 4; 12) and at fixed kd; (2) the tilt angle of the curve of equity cost, ke (L), decreases with the number of payments of tax of profit p; this modifies the dividend policy of the company, because the economically justified value of dividends is equal to equity cost. Shareholders can claim a lower return on their shares when the frequency of payments of tax on profit p increases. Note, that in “classical” Modigliani–Miller theory with one income tax payment per year all financial indicators, including the equity cost, ke, do not depend on debt cost, kd, at all.
3.3.2. Dependence of the Equity Cost, ke, on Leverage Level L at Different kd and Fixed p = 2
In this section we study the dependence of the equity cost, ke, on leverage level L at different kd = 18%; 16%; 14%; 12% and fixed but different number of income tax payments per year p = 2; 4; 12. Obtained results are shown in Table A10, Table A11 and Table A12 (see Appendix A) and in Figure 18, Figure 19 and Figure 20 below.
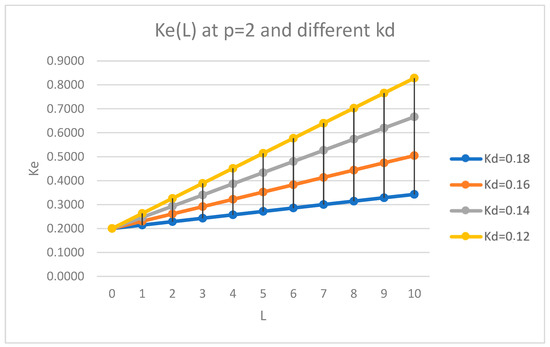
Figure 18.
Dependence of the equity cost, ke, on leverage level L at different debt cost kd (12%; 14%; 16%; 18%) and fixed frequency of payments of tax on profit p = 2.
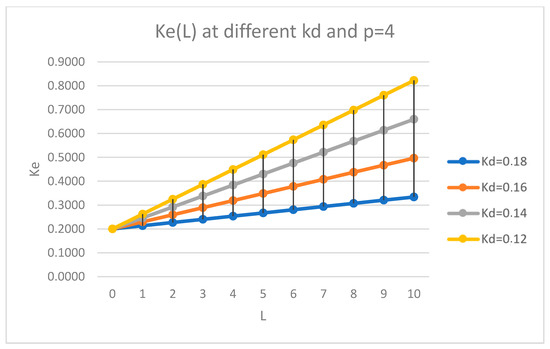
Figure 19.
Dependence of the equity cost, ke, on leverage level L at different debt cost kd (12%; 14%; 16%; 18%) and fixed frequency of payments of tax on profit p = 4.
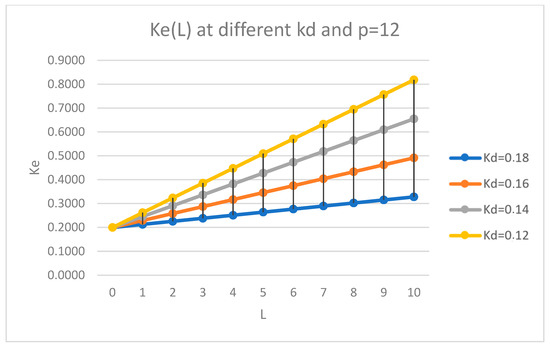
Figure 20.
Dependence of the equity cost, ke, on leverage level L at different debt cost kd (12%; 14%; 16%; 18%) and fixed frequency of payments of tax on profit p = 12.
Results obtained on the dependence of the equity cost, ke, on leverage level L at fixed but different frequency of payments of tax on profit p = 1; 2; 4; 12 and different values of debt cost kd (Table A10, Table A11 and Table A12 in Appendix A and Figure 18, Figure 19 and Figure 20) show that: (1) the equity cost, ke, increases with leverage level L at all debt cost kd (12%; 14%; 16%; 18%) and fixed frequency of payments of tax on profit p; (2) the tilt angle of the curve of equity cost, ke (L), decreases with the increase of values of debt cost, kd: this modifies the dividend policy of the company, because the economically justified value of dividends is equal to equity cost. Note, that in “classical” Modigliani–Miller theory with one income tax payment per year, all financial indicators, including the equity cost, ke, do not depend on debt cost, kd.
4. Conclusions
Both main capital structure theories: Brusov–Filatova–Orekhova (BFO theory) and its perpetuity limit Modigliani–Miller theory describe the case of annual payments of tax of profit, but in practice these payments are made more frequently: semiannually, quarterly, and monthly. The main purpose of current study was the generalization and further development of the Modigliani–Miller theory taking into account one of the conditions of the real functioning of companies: for the case of paying income tax with an arbitrary frequency (monthly, quarterly, semi-annual or annual payments). While a return is not required more than once a year, businesses may be responsible for filing estimated taxes based on profits earned. This requirement is dependent on showing a profit. For example, sole proprietors must file estimated taxes on profits quarterly, on the 15th day of April, June, September and January. In Russia, tax on profit payments could be made annually, quarterly, monthly. We suppose that more frequent payment of income tax impacts on all main financial indicators of the company and leads to some important consequences. We used analytical and numerical methods: we derived all main formulas of the modified Modigliani–Miller theory, and then used them to obtain all main financial indicators of company and their dependences on different parameters by MS Excel. All analytical and numerical results were obtained here for the first time. We show that in the modified theory:
- all Modigliani–Miller statements and all formulas change;
- all main financial indicators of the company (the weighted average cost of capital, WACC, company value, V and equity cost, ke) depend on the frequency of payments of tax on profit p. These results allow to company This allows the company to manage WACC, V, ke etc. by choosing the number of payments of tax of profit p: the company could choose the number of payments of tax of profit per year (of course, within actual tax legislation);
- in the case of income tax payments more than once per year (at ), as takes place in practice, the weighted average cost of capital (WACC), company value, V and equity cost, ke depend on debt cost kd, while in ordinary (classical) Modigliani–Miller theory all these values do not depend on debt cost kd. This allows us to study the impact of debt cost kd on the main financial indicators of the company and account for this effect in the management of the company;
- the tilt angle of the curve of equity cost, ke(L), decreases with p, this modifies the dividend policy of the company, because the economically justified value of dividends is equal to equity cost. Shareholders can claim a lower return on their shares when the frequency of payments of tax on profit p increases. Note, that in “classical” Modigliani–Miller theory with one income tax payment per year all financial indicators, including the equity cost, ke, do not depend on debt cost, kd at all.
It turns out that an increase the number of payments of tax of profit per year leads to a decrease of the cost of attracting capital and an increase of the company value. More frequent payments of income tax are beneficial for both parties: for the company and for the tax regulator; for the company, this leads to an increase in the value of the company, and for the tax regulator, earlier payments are beneficial due to the time value of money.
The cause of the observed results is the dependence of a tax shield on the frequency of payments of tax on profit. This effect is studied here for the first time.
Limitations of the research are connected with the main known limitations the Modigliani–Miller theory: perpetuity of the companies etc. This determines future research directions: generalization of the BFO theory, which is valid for arbitrary age of the company, in the case of arbitrary frequency of payments of tax on profit.
We have discovered that the effects could and should be used in corporate finance and corporate management, in investments, business valuation, taxation, ratings etc. for more correct assessments and more qualified management decisions.
Moreover, a tax regulator should use the results obtained for modification and improvement of tax legislation in the country: it could make tax legislation system more flexible with respect to frequency of tax on profit payments, which could depend on income value of the company and other parameters.
Author Contributions
Authors P.B. and T.F. contributed with conceptualization of the article; P.B. contributed with theoretical consideration, wrote the draft and manuscript preparation; T.F. and P.B. contributed with numerical calculations within MS Excel. Both authors have read and agreed to the published version of the manuscript.
Funding
Not applicable.
Institutional Review Board Statement
Not applicable.
Informed Consent Statement
Not applicable.
Conflicts of Interest
The authors declare no conflict of interest.
Appendix A

Table A1.
Dependence of WACC on leverage level L at k0 = 0.2, kd = 0.16 and p = 1; 2; 4; 12.
Table A1.
Dependence of WACC on leverage level L at k0 = 0.2, kd = 0.16 and p = 1; 2; 4; 12.
| L | T | k0 | kd | p = 1 | p = 2 | p = 4 | p = 12 |
|---|---|---|---|---|---|---|---|
| 0 | 0.2 | 0.2 | 0.16 | 0.200000 | 0.200000 | 0.200000 | 0.200000 |
| 1 | 0.2 | 0.2 | 0.16 | 0.180000 | 0.179230 | 0.178837 | 0.178573 |
| 2 | 0.2 | 0.2 | 0.16 | 0.173333 | 0.172306 | 0.171783 | 0.171430 |
| 3 | 0.2 | 0.2 | 0.16 | 0.170000 | 0.168845 | 0.168256 | 0.167859 |
| 4 | 0.2 | 0.2 | 0.16 | 0.168000 | 0.166767 | 0.166139 | 0.165716 |
| 5 | 0.2 | 0.2 | 0.16 | 0.166667 | 0.165383 | 0.164728 | 0.164288 |
| 6 | 0.2 | 0.2 | 0.16 | 0.165714 | 0.164394 | 0.163721 | 0.163267 |
| 7 | 0.2 | 0.2 | 0.16 | 0.165000 | 0.163652 | 0.162965 | 0.162502 |
| 8 | 0.2 | 0.2 | 0.16 | 0.164444 | 0.163075 | 0.162377 | 0.161907 |
| 9 | 0.2 | 0.2 | 0.16 | 0.164000 | 0.162613 | 0.161907 | 0.161431 |
| 10 | 0.2 | 0.2 | 0.16 | 0.163636 | 0.162236 | 0.161522 | 0.161041 |

Table A2.
Dependence of WACC on leverage level L at k0 = 0.22 and different p = 2; 4; 12.
Table A2.
Dependence of WACC on leverage level L at k0 = 0.22 and different p = 2; 4; 12.
| L | WACC | ||
|---|---|---|---|
| p = 2 | p = 4 | p = 12 | |
| 0 | 0.2200 | 0.2200 | 0.2200 |
| 1 | 0.1970 | 0.1964 | 0.1960 |
| 2 | 0.1893 | 0.1886 | 0.1881 |
| 3 | 0.1854 | 0.1846 | 0.1841 |
| 4 | 0.1831 | 0.1823 | 0.1817 |
| 5 | 0.1816 | 0.1807 | 0.1801 |
| 6 | 0.1805 | 0.1796 | 0.1789 |
| 7 | 0.1797 | 0.1787 | 0.1781 |
| 8 | 0.1790 | 0.1781 | 0.1774 |
| 9 | 0.1785 | 0.1775 | 0.1769 |
| 10 | 0.1781 | 0.1771 | 0.1765 |

Table A3.
Dependence of WACC on leverage level L at k0 = 0.2, p = 12 and different kd = 0.18; 0.16; 0.14; 0.12.
Table A3.
Dependence of WACC on leverage level L at k0 = 0.2, p = 12 and different kd = 0.18; 0.16; 0.14; 0.12.
| L | T | k0 | kd = 0.18 | kd = 0.16 | kd = 0.14 | kd = 0.12 |
|---|---|---|---|---|---|---|
| 0 | 0.2 | 0.2 | 0.20000 | 0.20000 | 0.20000 | 0.20000 |
| 1 | 0.2 | 0.2 | 0.17840 | 0.17857 | 0.17875 | 0.17892 |
| 2 | 0.2 | 0.2 | 0.17120 | 0.17143 | 0.17166 | 0.17190 |
| 3 | 0.2 | 0.2 | 0.16760 | 0.16786 | 0.16812 | 0.16838 |
| 4 | 0.2 | 0.2 | 0.16544 | 0.16572 | 0.16600 | 0.16628 |
| 5 | 0.2 | 0.2 | 0.16400 | 0.16429 | 0.16458 | 0.16487 |
| 6 | 0.2 | 0.2 | 0.16297 | 0.16327 | 0.16357 | 0.16387 |
| 7 | 0.2 | 0.2 | 0.16220 | 0.16250 | 0.16281 | 0.16311 |
| 8 | 0.2 | 0.2 | 0.16160 | 0.16191 | 0.16222 | 0.16253 |
| 9 | 0.2 | 0.2 | 0.16112 | 0.16143 | 0.16174 | 0.16206 |
| 10 | 0.2 | 0.2 | 0.16073 | 0.16104 | 0.16136 | 0.16168 |

Table A4.
Dependence of WACC on leverage level L at k0 = 0.2, p = 4 and different kd = 0.18; 0.16; 0.14; 0.12.
Table A4.
Dependence of WACC on leverage level L at k0 = 0.2, p = 4 and different kd = 0.18; 0.16; 0.14; 0.12.
| L | T | k0 | kd = 0.18 | kd = 0.16 | kd = 0.14 | kd = 0.12 |
|---|---|---|---|---|---|---|
| 0 | 0.2 | 0.2 | 0.20000 | 0.20000 | 0.20000 | 0.20000 |
| 1 | 0.2 | 0.2 | 0.17870 | 0.17884 | 0.17898 | 0.17912 |
| 2 | 0.2 | 0.2 | 0.17160 | 0.17178 | 0.17197 | 0.17216 |
| 3 | 0.2 | 0.2 | 0.16804 | 0.16826 | 0.16847 | 0.16868 |
| 4 | 0.2 | 0.2 | 0.16591 | 0.16614 | 0.16637 | 0.16659 |
| 5 | 0.2 | 0.2 | 0.16449 | 0.16473 | 0.16496 | 0.16520 |
| 6 | 0.2 | 0.2 | 0.16348 | 0.16372 | 0.16396 | 0.16421 |
| 7 | 0.2 | 0.2 | 0.16272 | 0.16296 | 0.16321 | 0.16346 |
| 8 | 0.2 | 0.2 | 0.16213 | 0.16238 | 0.16263 | 0.16288 |
| 9 | 0.2 | 0.2 | 0.16165 | 0.16191 | 0.16216 | 0.16242 |
| 10 | 0.2 | 0.2 | 0.16127 | 0.16152 | 0.16178 | 0.16204 |

Table A5.
Dependence of the company capitalization, V, on leverage level L at kd = 0.16 and different p = 1; 2; 4; 12.
Table A5.
Dependence of the company capitalization, V, on leverage level L at kd = 0.16 and different p = 1; 2; 4; 12.
| L | T | k0 | kd | CF | p = 1 | p = 2 | p = 4 | p = 12 |
|---|---|---|---|---|---|---|---|---|
| 0 | 0.2 | 0.2 | 0.16 | 1000 | 5000.00 | 5000.00 | 5000.00 | 5000.00 |
| 1 | 0.2 | 0.2 | 0.16 | 1000 | 5555.56 | 5579.43 | 5591.68 | 5599.96 |
| 2 | 0.2 | 0.2 | 0.16 | 1000 | 5769.23 | 5803.62 | 5821.31 | 5833.28 |
| 3 | 0.2 | 0.2 | 0.16 | 1000 | 5882.35 | 5922.61 | 5943.34 | 5957.38 |
| 4 | 0.2 | 0.2 | 0.16 | 1000 | 5952.38 | 5996.37 | 6019.04 | 6034.41 |
| 5 | 0.2 | 0.2 | 0.16 | 1000 | 6000.00 | 6046.58 | 6070.60 | 6086.88 |
| 6 | 0.2 | 0.2 | 0.16 | 1000 | 6034.48 | 6082.96 | 6107.96 | 6124.92 |
| 7 | 0.2 | 0.2 | 0.16 | 1000 | 6060.61 | 6110.53 | 6136.29 | 6153.77 |
| 8 | 0.2 | 0.2 | 0.16 | 1000 | 6081.08 | 6132.15 | 6158.51 | 6176.39 |
| 9 | 0.2 | 0.2 | 0.16 | 1000 | 6097.56 | 6149.55 | 6176.39 | 6194.61 |
| 10 | 0.2 | 0.2 | 0.16 | 1000 | 6111.11 | 6163.87 | 6191.11 | 6209.59 |

Table A6.
Dependence of the company capitalization, V, on leverage level L at p = 2 and different kd = 0.18; 0.16; 0.14; 0.12.
Table A6.
Dependence of the company capitalization, V, on leverage level L at p = 2 and different kd = 0.18; 0.16; 0.14; 0.12.
| L | T | k0 | CF | kd = 0.18 | kd = 0.16 | kd = 0.14 | kd = 0.12 |
|---|---|---|---|---|---|---|---|
| 0 | 0.2 | 0.2 | 1000 | 5000.00 | 5000.00 | 5000.00 | 5000.00 |
| 1 | 0.2 | 0.2 | 1000 | 5582.31 | 5579.43 | 5576.53 | 5573.61 |
| 2 | 0.2 | 0.2 | 1000 | 5807.78 | 5803.62 | 5799.44 | 5795.22 |
| 3 | 0.2 | 0.2 | 1000 | 5927.48 | 5922.61 | 5917.71 | 5912.77 |
| 4 | 0.2 | 0.2 | 1000 | 6001.70 | 5996.37 | 5991.01 | 5985.62 |
| 5 | 0.2 | 0.2 | 1000 | 6052.22 | 6046.58 | 6040.90 | 6035.19 |
| 6 | 0.2 | 0.2 | 1000 | 6088.83 | 6082.96 | 6077.05 | 6071.10 |
| 7 | 0.2 | 0.2 | 1000 | 6116.58 | 6110.53 | 6104.44 | 6098.31 |
| 8 | 0.2 | 0.2 | 1000 | 6138.34 | 6132.15 | 6125.92 | 6119.65 |
| 9 | 0.2 | 0.2 | 1000 | 6155.85 | 6149.55 | 6143.21 | 6136.83 |
| 10 | 0.2 | 0.2 | 1000 | 6170.26 | 6163.87 | 6157.43 | 6150.96 |

Table A7.
Dependence of the company capitalization, V, on leverage level L at p = 4 and different kd = 0.18; 0.16; 0.14; 0.12.
Table A7.
Dependence of the company capitalization, V, on leverage level L at p = 4 and different kd = 0.18; 0.16; 0.14; 0.12.
| L | T | k0 | CF | kd = 0.18 | kd = 0.16 | kd = 0.14 | kd = 0.12 |
|---|---|---|---|---|---|---|---|
| 0 | 0.2 | 0.2 | 1000 | 5000.00 | 5000.00 | 5000.00 | 5000.00 |
| 1 | 0.2 | 0.2 | 1000 | 5596.08 | 5591.68 | 5587.26 | 5582.81 |
| 2 | 0.2 | 0.2 | 1000 | 5827.66 | 5821.31 | 5814.92 | 5808.49 |
| 3 | 0.2 | 0.2 | 1000 | 5950.79 | 5943.34 | 5935.85 | 5928.32 |
| 4 | 0.2 | 0.2 | 1000 | 6027.20 | 6019.04 | 6010.85 | 6002.62 |
| 5 | 0.2 | 0.2 | 1000 | 6079.24 | 6070.60 | 6061.91 | 6053.19 |
| 6 | 0.2 | 0.2 | 1000 | 6116.97 | 6107.96 | 6098.92 | 6089.84 |
| 7 | 0.2 | 0.2 | 1000 | 6145.57 | 6136.29 | 6126.98 | 6117.62 |
| 8 | 0.2 | 0.2 | 1000 | 6168.00 | 6158.51 | 6148.98 | 6139.41 |
| 9 | 0.2 | 0.2 | 1000 | 6186.06 | 6176.39 | 6166.69 | 6156.94 |
| 10 | 0.2 | 0.2 | 1000 | 6200.92 | 6191.11 | 6181.26 | 6171.37 |

Table A8.
Dependence of the company capitalization, V, on leverage level L at p = 12 and different kd = 0.18; 0.16; 0.14; 0.12.
Table A8.
Dependence of the company capitalization, V, on leverage level L at p = 12 and different kd = 0.18; 0.16; 0.14; 0.12.
| L | T | k0 | CF | kd = 0.18 | kd = 0.16 | kd = 0.14 | kd = 0.12 |
|---|---|---|---|---|---|---|---|
| 0 | 0.2 | 0.2 | 1000 | 5000.00 | 5000.00 | 5000.00 | 5000.00 |
| 1 | 0.2 | 0.2 | 1000 | 5605.40 | 5599.96 | 5594.50 | 5589.01 |
| 2 | 0.2 | 0.2 | 1000 | 5841.15 | 5833.28 | 5825.38 | 5817.45 |
| 3 | 0.2 | 0.2 | 1000 | 5966.63 | 5957.38 | 5948.11 | 5938.82 |
| 4 | 0.2 | 0.2 | 1000 | 6044.53 | 6034.41 | 6024.27 | 6014.10 |
| 5 | 0.2 | 0.2 | 1000 | 6097.61 | 6086.88 | 6076.13 | 6065.35 |
| 6 | 0.2 | 0.2 | 1000 | 6136.09 | 6124.92 | 6113.73 | 6102.50 |
| 7 | 0.2 | 0.2 | 1000 | 6165.28 | 6153.77 | 6142.23 | 6130.67 |
| 8 | 0.2 | 0.2 | 1000 | 6188.17 | 6176.39 | 6164.58 | 6152.75 |
| 9 | 0.2 | 0.2 | 1000 | 6206.60 | 6194.61 | 6182.59 | 6170.53 |
| 10 | 0.2 | 0.2 | 1000 | 6221.77 | 6209.59 | 6197.39 | 6185.16 |

Table A9.
Dependence of the equity cost, ke, on leverage level L at fixed kd = 0.16 and at different p = 1; 2; 4; 12.
Table A9.
Dependence of the equity cost, ke, on leverage level L at fixed kd = 0.16 and at different p = 1; 2; 4; 12.
| L | T | k0 | kd | p = 1 | p = 2 | p = 4 | p = 12 |
|---|---|---|---|---|---|---|---|
| 0 | 0.2 | 0.2 | 0.16 | 0.2000 | 0.2000 | 0.2000 | 0.2000 |
| 1 | 0.2 | 0.2 | 0.16 | 0.2320 | 0.2305 | 0.2297 | 0.2291 |
| 2 | 0.2 | 0.2 | 0.16 | 0.2640 | 0.2609 | 0.2593 | 0.2583 |
| 3 | 0.2 | 0.2 | 0.16 | 0.2960 | 0.2914 | 0.2890 | 0.2874 |
| 4 | 0.2 | 0.2 | 0.16 | 0.3280 | 0.3218 | 0.3187 | 0.3166 |
| 5 | 0.2 | 0.2 | 0.16 | 0.3600 | 0.3523 | 0.3484 | 0.3457 |
| 6 | 0.2 | 0.2 | 0.16 | 0.3920 | 0.3828 | 0.3780 | 0.3749 |
| 7 | 0.2 | 0.2 | 0.16 | 0.4240 | 0.4132 | 0.4077 | 0.4040 |
| 8 | 0.2 | 0.2 | 0.16 | 0.4560 | 0.4437 | 0.4374 | 0.4332 |
| 9 | 0.2 | 0.2 | 0.16 | 0.4880 | 0.4741 | 0.4671 | 0.4623 |
| 10 | 0.2 | 0.2 | 0.16 | 0.5200 | 0.5046 | 0.4967 | 0.4915 |

Table A10.
Dependence of the equity cost, ke, on leverage level L at p = 2 and fixed kd = 0.18 at different kd = 0.18; 0.16; 0.14; 0.12.
Table A10.
Dependence of the equity cost, ke, on leverage level L at p = 2 and fixed kd = 0.18 at different kd = 0.18; 0.16; 0.14; 0.12.
| L | T | k0 | kd = 0.18 | kd = 0.16 | kd = 0.14 | kd = 0.12 |
|---|---|---|---|---|---|---|
| 0 | 0.2 | 0.2 | 0.2000 | 0.2000 | 0.2000 | 0.2000 |
| 1 | 0.2 | 0.2 | 0.2143 | 0.2305 | 0.2466 | 0.2628 |
| 2 | 0.2 | 0.2 | 0.2285 | 0.2609 | 0.2933 | 0.3257 |
| 3 | 0.2 | 0.2 | 0.2428 | 0.2914 | 0.3399 | 0.3885 |
| 4 | 0.2 | 0.2 | 0.2571 | 0.3218 | 0.3866 | 0.4513 |
| 5 | 0.2 | 0.2 | 0.2714 | 0.3523 | 0.4332 | 0.5142 |
| 6 | 0.2 | 0.2 | 0.2856 | 0.3828 | 0.4799 | 0.5770 |
| 7 | 0.2 | 0.2 | 0.2999 | 0.4132 | 0.5265 | 0.6398 |
| 8 | 0.2 | 0.2 | 0.3142 | 0.4437 | 0.5732 | 0.7027 |
| 9 | 0.2 | 0.2 | 0.3285 | 0.4741 | 0.6198 | 0.7655 |
| 10 | 0.2 | 0.2 | 0.3427 | 0.5046 | 0.6665 | 0.8283 |

Table A11.
Dependence of the equity cost, ke, on leverage level L at p = 4 and at different kd = 0.18; 0.16; 0.14; 0.12.
Table A11.
Dependence of the equity cost, ke, on leverage level L at p = 4 and at different kd = 0.18; 0.16; 0.14; 0.12.
| L | T | k0 | kd = 0.18 | kd = 0.16 | kd = 0.14 | kd = 0.12 |
|---|---|---|---|---|---|---|
| 0 | 0.2 | 0.2 | 0.2000 | 0.2000 | 0.2000 | 0.2000 |
| 1 | 0.2 | 0.2 | 0.2134 | 0.2297 | 0.2460 | 0.2622 |
| 2 | 0.2 | 0.2 | 0.2268 | 0.2593 | 0.2919 | 0.3245 |
| 3 | 0.2 | 0.2 | 0.2402 | 0.2890 | 0.3379 | 0.3867 |
| 4 | 0.2 | 0.2 | 0.2536 | 0.3187 | 0.3838 | 0.4490 |
| 5 | 0.2 | 0.2 | 0.2670 | 0.3484 | 0.4298 | 0.5112 |
| 6 | 0.2 | 0.2 | 0.2804 | 0.3780 | 0.4757 | 0.5735 |
| 7 | 0.2 | 0.2 | 0.2938 | 0.4077 | 0.5217 | 0.6357 |
| 8 | 0.2 | 0.2 | 0.3071 | 0.4374 | 0.5677 | 0.6979 |
| 9 | 0.2 | 0.2 | 0.3205 | 0.4671 | 0.6136 | 0.7602 |
| 10 | 0.2 | 0.2 | 0.3339 | 0.4967 | 0.6596 | 0.8224 |

Table A12.
Dependence of the equity cost, ke, on leverage level L at p = 12 and at different kd = 0.18; 0.16; 0.14; 0.12.
Table A12.
Dependence of the equity cost, ke, on leverage level L at p = 12 and at different kd = 0.18; 0.16; 0.14; 0.12.
| L | T | k0 | kd = 0.18 | kd = 0.16 | kd = 0.14 | kd = 0.12 |
|---|---|---|---|---|---|---|
| 0 | 0.2 | 0.2 | 0.2000 | 0.2000 | 0.2000 | 0.2000 |
| 1 | 0.2 | 0.2 | 0.2128 | 0.2291 | 0.2455 | 0.2618 |
| 2 | 0.2 | 0.2 | 0.2256 | 0.2583 | 0.2910 | 0.3237 |
| 3 | 0.2 | 0.2 | 0.2384 | 0.2874 | 0.3365 | 0.3855 |
| 4 | 0.2 | 0.2 | 0.2512 | 0.3166 | 0.3820 | 0.4474 |
| 5 | 0.2 | 0.2 | 0.2640 | 0.3457 | 0.4275 | 0.5092 |
| 6 | 0.2 | 0.2 | 0.2768 | 0.3749 | 0.4730 | 0.5711 |
| 7 | 0.2 | 0.2 | 0.2896 | 0.4040 | 0.5185 | 0.6329 |
| 8 | 0.2 | 0.2 | 0.3024 | 0.4332 | 0.5640 | 0.6948 |
| 9 | 0.2 | 0.2 | 0.3152 | 0.4623 | 0.6094 | 0.7566 |
| 10 | 0.2 | 0.2 | 0.3280 | 0.4915 | 0.6549 | 0.8185 |
References
- Modigliani, F.; Miller, M. The cost of capital, corporate finance, and the theory of investment. Am. Econ. Rev. 1958, 48, 261–297. [Google Scholar]
- Modigliani, F.; Miller, M. Corporate income taxes and the cost of capital: A correction. Am. Econ. Rev. 1963, 53, 147–175. [Google Scholar]
- Modigliani, F.; Miller, M. Some estimates of the cost of capital to the electric utility industry 1954–1957. Am. Econ. Rev. 1966, 56, 333–391. [Google Scholar]
- Miller, M. Debt and taxes. J. Financ. 1977, 32, 261–275. [Google Scholar] [CrossRef]
- Hamada, R. Portfolio Analysis, Market Equilibrium, and Corporate Finance. J. Financ. 1969, 24, 13–31. [Google Scholar] [CrossRef]
- Farber, A.; Gillet, R.; Szafarz, A. A General Formula for the WACC. Int. J. Bus. 2006, 11, 211–218. [Google Scholar]
- Fernandez, P. A General Formula for the WACC: A Comment. Int. J. Bus. 2006, 11, 219. [Google Scholar]
- Harris, R.; Pringle, J. Risk–Adjusted Discount Rates—Extension form the Average–Risk Case. J. Financ. Res. 1985, 8, 237–244. [Google Scholar] [CrossRef]
- Serrasqueiro, Z.; Caetano, A. Trade–Off Theory versus Pecking Order Theory: Capital structure decisions in a peripheral region of Portugal. J. Bus. Econ. Manag. 2015, 16, 445–466. [Google Scholar] [CrossRef]
- Berk, J.; DeMarzo, P. Corporate Finance; Pearson–Addison Wesley: Boston, MA, USA, 2007. [Google Scholar]
- Brealey, R.; Myers, S.; Allen, F. Principle of Corporate Finance, 7th ed.; McGraw Hill: New York, NY, USA, 2005. [Google Scholar]
- Ross, S.; Westerfiel, R.; Jaffee, D. Corporate Finance, 7th ed.; McGraw Hill: New York, NY, USA, 2005. [Google Scholar]
- Frank, M.; Goyal, V. Capital Structure Decisions: Which Factors Are Reliably Important? Financ. Manag. 2009, 38, 1–37. [Google Scholar] [CrossRef]
- Brusov, P.N.; Filatova, T.V.; Orekhova, N.P. Absence of an Optimal Capital Structure in the Famous Tradeoff Theory! J. Rev. Glob. Econ. Lifesci. Glob. 2013, 2, 94–116. [Google Scholar] [CrossRef]
- Filatova, T.V.; Orekhova, N.P.; Brusova, A.P. Weighted average cost of capital in the theory of Modigliani–Miller, modified for a finite life-time company. Appl. Financ. Econ. 2011, 21, 815–824. [Google Scholar]
- Brusov, P.; Filatova, T.; Orehova, N.; Eskindarov, M. Modern Corporate Finance, Investments and Taxation; Springer International Publishing: Cham, Switzerland, 2015; pp. 1–373. Available online: https://www.springer.com/gp/book/9783319147314 (accessed on 19 April 2021).
- Brusov, P.; Filatova, T.; Orehova, N.; Eskindarov, M. Modern Corporate Finance, Investments, Taxation and Ratings, 2nd ed.; Springer Nature Publishing: Cham, Switzerland, 2018; pp. 1–571. [Google Scholar]
- Brusov, P.N.; Filatova, T.V.; Orekhova, N.P.; Kulik, V.L.; Chang, S.-I.; Lin, Y.C.G. Modification of the Modigliani–Miller Theory for the Case of Advance Payments of Tax on Profit. J. Rev. Glob. Econ. 2020, 9, 257–267. [Google Scholar] [CrossRef]
- Brusov, P.; Filatova, T.; Orehova, N. Ratings: Critical Analysis and New Approaches of Quantitative and Qualitative Methodology; Springer Nature Publishing: Cham, Switzerland, 2020; pp. 1–369. Available online: https://www.springer.com/de/book/9783030562427 (accessed on 19 April 2021).
- Brusov, P.N.; Filatova, T.V.; Orekhova, N.P.; Kulik, V.L.; Chang, S.-I.; Lin, Y.C.G. Application of the Modigliani–Miller Theory, Modified for the Case of Advance Payments of Tax on Profit, in Rating Methodologies. J. Rev. Glob. Econ. 2020, 9, 282–292. [Google Scholar]
- Brusov, P.N.; Filatova, T.V.; Orekhova, N.P.; Kulik, V.L.; Weil, I. New meaningful effects in modern capital structure theory. J. Rev. Glob. Econ. 2018, 7, 104–122. [Google Scholar] [CrossRef]
- Harry, D.A.; Masulis, R.W. Optimal Capital Structure under Corporate and Personal Taxation. J. Financ. Econ. 1980, 8, 3–29. [Google Scholar]
- Bradley, M.; Jarrell, G.A.; Kim, E.H. On the Existence of an Optimal Capital Structure: Theory and Evidence. J. Financ. 1984, 39, 857–878. [Google Scholar] [CrossRef]
- Sheridan, T.; Wessels, R. The Determinants of Capital Structure Choice. J. Financ. 1988, 43, 1–19. [Google Scholar]
- Graham, J.R. Taxes and Corporate Finance: A Review. Rev. Financ. Stud. 2003, 16, 1075–1129. [Google Scholar] [CrossRef]
Publisher’s Note: MDPI stays neutral with regard to jurisdictional claims in published maps and institutional affiliations. |
© 2021 by the authors. Licensee MDPI, Basel, Switzerland. This article is an open access article distributed under the terms and conditions of the Creative Commons Attribution (CC BY) license (https://creativecommons.org/licenses/by/4.0/).