1. Introduction
Nowadays, data are available in a productive manner in educational organizations’ databases but are never utilized at a significant level. These data are never used to obtain valuable insights that will benefit students’ career prospects. It can become beneficial to the institutes in improving the quality of training according to industry requirements. During the unprecedented time of the Covid-19 epidemic, several professionals and employees lost their employment. Uncertainty exists everywhere; nobody is assured about future job opportunities after the second wave of the pandemic. In educational institutions, many students are also worrying about their future job prospects. Any college or university deems it a success when their students get placed in well-settled companies or organizations. Every year, college students apply for their campus placements, but only well-prepared students get placements or dream jobs. In this pandemic, when there is cutthroat competition and fewer jobs, one wants to know which skills or characteristics matter to companies. This can be explored by analyzing the previous years’ placement datasets. The well-established and well-nourished institutes consist of many intelligent student records.
A determined student always dreams of working in his/her preferred career sector or industry. Placing the right person in the right job is always the first aim of the industry recruiter, and a challenge for educational institutions to match this choice with available students’ skills. Thus, institutions follow a systematic approach in advance by motivating students to learn desired industry skills by identifying weak areas using advanced AI techniques. Moreover, machine learning is one of these techniques, which can be used in predicting the skills and other requirements that are needed for desired industry recruiters. In prestigious intuitions, placement analysis and forecasting systems always help assess student performance and secure a suitable placement quickly. This might become necessary for other institutions to raise fair participation in job placements and help teaching faculties analyze the most crucial part of the curriculum. It can be an aid for the institution in updating the curriculum according to industry demands. The most tedious part of this system is compiling all past placements’ data from various sources. It becomes challenging when the dataset has multiple fields (columns) and identifies its behavior with essential features. It is also an arduous task to assess their impact and make generalized inferences. The more profound research growth can be witnessed through education data mining articles. An iterative process can attribute data mining to extract a new pattern from existing datasets or from various data sources to enrich the evidence-based decision-making process. The pattern can be related to association, trend or prediction, and so forth [
1]. The disproportionate placement numbers are always reflected in college placement drives. It is often assumed among recruiters that female students might score higher in any competitive test and may be helpful in their academic endeavors [
2]. The present study is also interested in realizing all the factors that lead to students’ success (or failure) at the master’s level in getting a placement and assessing the impact of gender on the placement test.
In this paper, we used secondary data on campus placement from the Kaggle website [
3]. Further, we described the essential properties of samples and features. The study has been done to analyze the impact of gender on students’ offered salary in campus placement. For this study, we have taken an independent
t-test to compare the two groups to the offered salary. To find the significant difference between two unrelated groups, the independent
t-test is a better approach. In this paper, we explored the significant association between specialization, degree-stream and placement status. To explore a significant correlation between two nominal variables, a chi-square (
) test of independence (non-parametric) is appropriate. The present paper also used contemporary predictive algorithms to identify the placement status and the gender of placed students in campus placement. For this, we used RF, XGBoost (XGB), SVM, and Logistic regression (LR) classification algorithms. We also used the intrinsic feature ranking algorithm of RF and XGB to extract essential features on which prediction is based. Placement depends on many combinations of factors. RF can be used to find the best combination of features, and it will not allow over-fitting trees in the model if there are more decision trees. SVM is popular due to the linear separable feature in high dimensional space (many features). The XGB works well with datasets containing numerical and categorical features and data with only numerical features.
2. Related Work
A study was conducted on the South Asian Universities dataset in 2014–2016 with the help of statistical tools. It was found that the used statistical methods improved the placement process accuracy with good glaring performance. Overall, the academic rate as a determinant in predicting placement played a better role [
4]. As a classifier, the decision tree model helped the coordinators identify weak students who will face upcoming placement drives and guide them in improving the students’ learning patterns. Further, it was also predicted which student will join which type of company with an accuracy of 62.3% and also predicted the company name for which he/she will recruit with accuracy (45.78%) using a naïve bayes classifier [
5]. A technical college’s placement data was analyzed with academicians predicting which engineering branch or stream would be full with admission accuracy (80%) and with a random forest classifier [
6]. Moreover, the study also found that placed students’ offered salary was predicted in two phases of the dataset with the k-nearest neighbor (94.5%) and XGB regression [
7]. One of the studies [
8] also favored the RF model for predicting student placement (99.9%). It also extracted the UG degree percentage (
p < 0.05) as an important core feature in obtaining a dream placement. One high school was inspired and predicted part-time jobs for needy students through past placement data analysis. They trained them accordingly for upcoming opportunities. They observed [
9] that RF outperformed LR, SVM, K-Nearest Neighbors (KNN) and Decision tree with a high accuracy and F1-score (93%). As observed, most cited studies preferred the RF model for prediction due to its ensemble learning approach. In the continuation of study in the education sector, performance prediction was done in degree students [
10] and revealed thirty-eight (38) courses taken by average students. It was found that course choice selection diversity exists among them, and the KNN-classifier was the worst. The statistical non-parametric test
analyzed an online learning discussion forum dataset [
11]. It found an association between gender and ethnicity. The students’ major and international status was significantly associated with gender (
p < 0.05). The online learning participation was also not directly associated with its major
p > 0.05). An association between English language and a student’s demographic features was strongly associated with birth-place and also with gender (
p < 0.05) [
12]. Differences in learning results in the dataset were due to gender, social and solidarity approach (
p < 0.05) using the independent
t-test [
13]. Further, it was also found with the
t-test that gender impacts technology awareness [
14]. The students’ academic percentage rose by adopting game-oriented approach programming (
p < 0.05) [
15]. Sports, Science and Education faculties are directly impacted by social appearance anxiety (
p < 0.05), but gender was not statistically significantly related to social anxiety (
p > 0.05) [
16]. The students’ gender played a big role in physical activity participation (
p < 0.05), [
17] concluded.
Table 1 displays the extant research that used predictive and differential study on placement or related datasets to forecast employability chances and to assess the impact of different variables. It also contrasts and compares all related studies with the present research scheme. A. Ojha et al. (2017) utilized the Decision Tree (DT) and Random Forest (RF) model and predicted placement chances for a student with his academic background. Moreover, the result from K.Pruthi et al. (2015) used forecasting employability for a student in campus placement with Naïve Bayes (NB). T.Arvind et al. (2019) used regression for forecasting placed student salary with Linear Regression (LNR), Extreme Gradient Boosting (XGB), Gradient Boosting (GB), and Random Forest (RF) regression. Gabor Kiss et al. (2013) and C.Verma (2016) assessed the significant impact of gender on different variables. The associativity also verified two nominal variables, English language and gender (T.Sevindi et al. (2020)) and proved the relationship exists among them. The present study used differential, inferential and predictive analysis with Determinant Feature Detection (DFD) research on a placement dataset and tried to assess the impact of gender and specialty in masters on placement chances, and the offered salary. It also tried to forecast student employability and placement gender in campus placement using supervised machine learning algorithms such as Support Vector Machine (SVM), Logistic Regression (LR), RF and XGB.
On the same dataset, Jumana Nagaria et al. [
18] have carried out exploratory data analysis and found more than 70% of secondary school students earned a grade of 60 or higher. The vast majority of MBA students with a score of more than 60% have found work. A vast majority of students with an employability test scoring more than 50% have a salary range from 200,000 to 400,000. Males make up most students who scored over 60% in high school and on their degrees, and whose salaries range from 200,000 to 400,000. Shawni Dutta et al. [
19] have also studied the same dataset to find placement status and concluded that the gradient boosting (GB) classifier outperformed the others in the performance evaluation metric with 76.74% accuracy and 71% F1-Score and the second classifier, the Extra tree classifier produced a better result. The authors also used Multilayer Perceptron (MLP), Multinomial Naïve Bayes (NB), Decision Tree (DT), k-Nearest Neighbor classifier (k-NN), Stochastic Gradient (SGD), Random Forest (RF) and Adaboost (ADB) classifiers.
3. Problem Statement
Earlier work used either predictive or statistical analyses of the data patterns belonging to student placements. Using identical samples, researchers did not explore the impact of gender on specialization towards students’ offered salary in campus placement. They did not even identify the placement status or the gender of placed students [
18,
19]. Other literature encouraged authors to fill the research gap by developing hybrid automated models. Further, the previous studies need to be improved to support maximum human communities. It is found that there is a lack of prominent issues in the existing studies, such as impact of salary of placed student on the course specialization and gender, effect of placement test percentage on gender, association between placement status and course specialization and stream of a degree program, and placement identification with gender and status. However, the present study has overcome the these issues with significant results.
In this job-seeking competitive environment, many things matter for campus placement and, therefore, it becomes mandatory to identify which skillsets and what academic criteria are required for predicting placement [
4,
8,
9,
10]. Moreover, the role of demographic features’ (gender, course specialization) impacts cannot be ignored in the hiring process [
11,
13,
14,
15]. There can also be a relationship among features that are significantly correlated [
11,
12].
Further, nobody has yet provided the concept of impact identification with gender, MBA Specialization, and placement test percentage. Earlier investigators also did not predict gender [
18,
19], and the status of a student’s placement was identified with an accuracy of 76.74% without presenting features [
19]. Therefore, the present study outlined the placement prediction with student’s demography impact and real-time programs in a Python environment focused on a hybrid application of inferential, differential and predictive techniques with feature detection. We have enhanced the accuracy of placement status using the SVM by 13.26%, and presented the 10 most prominent features.
This paper assessed the impact of gender, MBA specialization towards offered salary, and placement test percentage. It also discovered an association between specialization and degree of stream towards placement status. Apart from these statistics, the present work also predicted the placement status with the gender of placement with prominent feature detection.
4. Contribution and Significance
The present research could be a hands-on aid to the academic stakeholder of management institutions. The students and placement coordinators identify any biases during placement and determine the placement’s impact on academic criteria. The results of this paper could help students identify the features that need to be focused on in the job hiring process. This paper presents state-of-the-art statistical computations supporting machine learning algorithms to extract and explore significant academic and industrial stakeholders’ essential features. This paper proposes a hybrid automated placement recognition system to support the academic and industry stakeholders belonging to the student’s placement. The authors have designed the research objectives and outcomes for the sake of ‘Humanity Benefits’; the educational stakeholders or communities (students, teachers, employers, parents, and institutions). The key contributions of the present work are summarized below:
Supporting with significant statistical models. The current research presents a demographic impact identification system for placement salary and placement test. It may explore gender biases based on the placed student’s offered salary. This approach is beneficial for students, the placement coordinator, and the company’s human resource department. As the requirements (job timing, shifts, maternity leaves, etc.) of an employee in a company are dynamic and affected by gender. The management and financial policymakers might be aware in advance of the gender impact on the placement. This demographic impact identification mirrors the students’ and teachers’ ability to acquire high placement test percentages based on gender. Accordingly, they must need to develop strategies and plan to perform best in the placement test.
An association identification system identified students’ placement with MBA specialization, but it has no relation to students’ bachelor degree streams. These results are critical benefits to students, institutions and parents. On the one hand, a student’s parents should provide wisdom for choosing bachelor degree streams, and on the other hand, the student should focus on specialization of Mkt&Fin during an MBA program. The institution could also be aware of the industry trend, and the admission seats can be enhanced. Therefore, a placement company can have direct contact with an institution that has a mass number of candidates with MBA specialization of Mkt&Fin.
The study also presents an automated prediction of the placement status in line with gender, with prominent features that would support students themselves and the institution. A hands-on prosperous machine learning technique is applied, and the results would support creating awareness about a placement’s existence or show the probability of a student’s gender with significant accuracy. Accordingly, its recommended features must be emphasized by the institution and students themselves before appearing in the placement test.
5. Organization
The rest of the paper is divided into five major sections.
Section 6 emphasizes the research design and methodology. It briefs the primary objectives and related hypotheses, data collection and variables, tools, descriptive analysis and data prepossessing (statistical computation and machine learning techniques).
Section 7 performs seven experiments with result analysis.
Section 8 explains experimental results with significant discussions.
Section 9 briefs the strength and weaknesses of the study.
Section 10 concludes the findings of the study with future work.
6. Research and Design Methodology
This study proposed and developed a hybrid Python program to automate the inferential, differential and predictive analysis of placement data patterns. The presented model, named Placement Prediction with Demographic Impact Identification (PPDI), can be used to analyze past placement data and will work as assistance for placement prediction. It can be used to identify the impact of demographic features on placement variables.
The pictorial view of the PPDI is depicted in
Figure 1. The PPDI model can confirm the impact of the student’s gender, MBA specialization and placement test percentage on the offered salary using a
t-test (parametric test). It can also find an association between MBA specialization and degree stream and Placement Status using
(non-parametric test). Further, it can predict the Placement-Status (Y/N) and Placement-Gender based on academic features. For this, various machine learning algorithms are implemented and compared in terms of several performance measures. The PPDI model used the essential process model technique for strengthening the placement pattern mining.
6.1. Objectives and Hypotheses
This paper examined seven significant objectives and five of these objectives have their respective hypotheses. The various statistical and computational methods were applied to achieve these objectives. The next two objectives were proposed to develop significant predictive models with machine learning techniques.
6.2. Dataset Description and Tool
The present study used the secondary data samples data set from the Kaggle website [
3]. The data set includes 215 observations with 14 features (Nominal-8, Scale-6). The acceptable reliability of the used instrument is 0.61 given by the Cronbach’s alpha test. Equation (
1) computed the reliability
of samples, where N is number of features,
is average co-variance between feature pair,
is average variance.
Equations (
2) and (
3) show the mean
and standard deviation (
) of features respectively.
A detailed description of features and corresponding statistical description can be seen in
Table 2.
The dataset was subjected to a variety of statistical operations, including finding each attribute’s minimum (∧) and maximum ∨ values, average (mean) value, and their standard deviation (). The offered salary (Salary) has a minimum value of zero, indicating that some students are not placed in the company; therefore, their salary is represented with zero value. High school percentage (HSC_P) ranges between 37 and 97.70 with a standard deviation of 10.90. Students passed high school from central and other boards and high schooling streams included Commerce/Sci./Arts, available for students in their high school study. Students’ degree percentages (Degree_P) were 50% to 91%, with a mean value of 66.37% for all students. Two specializations were available for MBA students: Mkt&Fin and Mkt&HR in their MBA study. Students achieved 51.21% to 77.89% with a mean value of 62.28 in their MBA study. The offered salary (Salary) was used as a target variable for finding the significant differences between gender and MBA specialization (Specialization). Placement Test Percentage (E_Test_P) was also used as a target variable w.r.t gender in finding significant differences between the two.The placement status (Status) and gender have two classes, (Yes/No) and (M/F), respectively, and are represented with 0 and 1. Further, in this paper, Status and Gender are used as target variable classification experiments.
Table 3 shows a significant sample adequacy test model of the Bartlett test of sphericity with the Kaiser-Mayer-Olkin (KMO). The KMO is also used to determine the degree of correlation and partial correlation between variables ranging from 0 to 1. The Bartlett test is often used to determine the association between variables in the correlation matrix [
20]. With a statistically significant
p-value < 0.05 and an approximate
of 1012.51 with 91 degrees of freedom, (
df = 91,
p < 0.05). The KMO test yielded a value of 0.66, indicating a suitable relationship between the variables. The sampling adequacy measure had a range of values between 0.6 and 0.7, which is higher than the 0.5 threshold value [
21].
Figure 2 shows the sample distribution of numeric features of the dataset. It exhibited pairwise bivariate distribution for displaying relationships among dataset features. It is clear that there is a somewhat linear relationship between HSC and degree percentage with SSC percentage, but Etest (Placement-test) percentage has a somewhat non-linear relationship with SSC percentage. Salary is not generally distributed as opposed to other diagonal univariate plots distribution.
This article used contemporary statistical and predictive analytic tools to identify the patterns and make predictions with various machine learning algorithms using the Python programming environment. Considering visualization plots helped us draw and understand the pattern, correlation and data trends. Python 2D plots visualization—the Matplotlib library is a multiplatform library built on top of the NumPy array. It has a rich library with line, scatter, histogram and bar plots, and so forth. Another popular visualization library for drawing attractive and informative statistical graphics is integrated with the panda’s data structure and is built on the Matplotlib library. Line, bar and Pair plots and Heatmaps are the popular tools used frequently from the seaborn library [
22,
23].
6.3. Descriptive Analysis
There are 139 samples of Male and 76 samples of Female candidates’ offered salaries in the given dataset. There are also students of Mkt&Fin and Mkt&HR of MBA specialization streams consisting of 120 and 95 observations of the offered salaries. From the demographic data, male students are achieving more placements than female students, and the scenario is the same for unplaced status. Male students also achieve the majority of un-placement status as evident in
Figure 3. Secondly, the Secondary Education schooling board (other and central) did not make any difference as compared to the higher secondary board where education from the other board has an impact on placement status. It can also be observed that more students took Comm&Mgmt and Sci&Tech as compares to art students in higher secondary subjects. Therefore, their majority can be observed in the placement scenarios. The majority of Comm&Mgmt degree students can also be observed in a placement role in a 2:1 ratio of comm to science. Future work experience having no impact on placements can be observed.
Figure 3 shows the sample distribution of the categorical features of the dataset. The dataset consists of many categorical features such as gender (M/F), degree_t (Sci&Tech, Comm&Mgmt, Others) and specialization (Mkt&Fin, Mkt&HR). Their distribution can be seen as follows: Male (M-139), Female (F-76), Placed (148), Not-placed (67), Mkt&Fin (120), Mkt&HR (95), Comm&Mgmt (145), Others (11), and Sci&Tech (59). From the barplot, it is very clear that a strong imbalance exists among features like gender and status and so forth.
The offered salary for placed students’ demographic pattern salso plays a significant role in
Figure 3. As per
Figure 3a, Male students are offered salary hikes compared to female students. Even though SSC education boards are not playing a role in placement status after placement, a salary hike can be observed with the education board. The central education board impacts salary in SSC, but the HSC board is not playing any role in offered salary hike as evident from
Figure 3b,c. In the above figures, It is clear that future work experience is not playing any role in getting a placement. Still, after getting the placement, a salary hike can be observed, with work experience and Mkt&Fin specialization also impacting salary as reflected in
Figure 3e,f. The senior secondary education percentages also play a prominent role in placement, as evident from
Figure 4a, where more than 90% are getting a certain placement and students who have not achieved marks below 40% are unable to get placements. The placement is also impacted by higher education percentage and undergraduate percentage; more than 90% getting a placement but less than 40% not getting a placement as reflected in
Figure 4b, in higher education percentage. The undergraduate percentage also affects placements, with 85% or more getting a placement but less than 50% not getting a placement at all as exhibited in
Figure 4c. However, the placement test is not playing a role as can be seen in
Figure 4d.
6.4. Preprocessing
6.4.1. Statistical Computation
This section elaborates both the differential and the inferential statistics to achieve the relative objectives. According to objective-1, the present work evaluated a significant difference between male and female students in terms of the offered salary. To fulfill objective-2, this work investigated a significant difference between MBA specialization (Mkt&Fin and Mkt&HR) in terms of offered salary. In objective-3, the authors also enquired about the impact of placement test percentage on students’ placements. From the experiment’s perspective, a total of variance samples taken for clinical trial and samples were compliant to normality and variances. For the differential investigation, this paper used a
t-test at 95% confidence level. In statistical hypothesis studies, a Student’s
t-test was designed by William Sealy Gosset (1908) to know whether there is a difference between two independent samples’ means. It can also be used for whether both samples come from the same population with insignificant output. This study also takes care of all assumptions (normality, equal variance) while performing the parametric tests. The normality was tested by the Shapiro-Wilk test in Equation (
4) and the equal variance was checked with the Levene’s test in Equation (
5).
Equation (
4) of the Shapiro-Wilk test, where
W is the Wilk value,
are the ordered random sample values, and
are constants generated from the variances (
) and mean (
) of the sample size n. The results of the Shapiro-Wilk test regarding normality can be seen in
Table 4. It was found that all variables have normality (
p > 0.05). To achieve variance homogeneity across the given samples, Levene’s test analysis was used to validate the assumption and is considered an alternative to Bartlett’s test due to less sensitivity. The given samples or groups were assumed to have equal variance in the null hypothesis [
24].
In Equation (
5), the
group means calculated on the
(deviation calculated from mean or median) and
(overall mean of the
).
Table 5 shows that all variables have identical variances that mean it conforms to homogeneous variance (
p > 0.05). The
t-test is a parametric test that assumes that the extracted samples satisfy the condition of normality, variance equality, and test of independence [
24,
25]. The
p-value is computed on
t-distribution probability with a calculated degree of freedom (
+
− 2) where
is the number of samples in group
A, and
is the number of samples in group
B.
In Equation (
6), where
is a sample mean of a male student,
is a mean of a female student, and
is the variance of the gender sample.
To explore the association of placement status with the specialization in objective-4 and the placement status with the stream of degree in objective-5, the
test and association strength were computed with Cramér’s V test. The
test was used to determine the relationship between two categorical variables in the population. The association is assessed by comparing two categorical features’ observed values’ pattern to the pattern of expected variables to determine whether they were truly independent or not, as evident in the below equation. It uses cross-tabulation (contingency table), displaying the two categorical features’ distribution by using their intersection in the cells. For establishing the independence
test statistics approach, it uses the
p-value for a significance test [
26,
27,
28,
29].
Equation (
7) shows that
is the observed value and
is the expected value of the variables under investigation.
6.4.2. Machine Learning Computation
This section interprets four supervised machine learning algorithms. To achieve the last two objectives of the study, objective-6 and objective-7, the machine learning algorithms such as SVM, RF, XGB, LR, and GB, were are employed. The supervised learning consists of the target (dependent) features with input (independent) features. It tries to map the relationship between input features and output features. Essentially, the target feature can be discrete or continuous. In the case of discrete, it is called classification, and others are called a regression problem. For the classification, the dataset under consideration is partitioned into a train-test with a ratio of 80:20. To justify the superiority of one model over the other, some classification performance metrics (Precision, Recall, F1-score, confusion matrix, Receiver Operating Characteristics (ROC)) were used.
During classification, imbalanced data causes the results to be biased in favor of the majority class in binary classification. This problem becomes large when dealing with high-dimensional data with class-imbalance critically exceeding samples. Under-Sampling or Over-Sampling are both prevalent approaches to deal with this problem to make balanced class data. The Synthetic Minority Oversampling Technique (SMOTE) is a prevalent approach to improve random over-sampling. To avoid the biasing problem, observations are resampled around the majority class to make balanced class data using the Synthetic minority oversampling technique (SMOTE). The class-imbalance is where placed students are represented by 1 and not-placed students with 0 and there are more placed students compared to unplaced students. The initial data samples are unbalanced and are depicted in
Figure 5a and
Figure 6a. After implementing the SMOTE, the balanced class can be observed in
Figure 5b and
Figure 6b.
Hyperparameter tuning is a popular technique to boost the performance or accuracy of any machine learning model. This technique usually affects the learning of the classifier model and, moreover, its construction and evaluation. Its main motive is to find out the best classifier model using the hyper-parameters tuning technique [
30]. In the the present work, SVM, RF, GB and XGB used different parameters, and LR used the default parameters.
Random Forest
According to Breiman L, the bootstrap method uses a combined classification of base classifiers and the Random forest use bagging algorithm [
31]. It is a popular ensemble learning approach that generates many trees instead of a single tree. Classification is made by using sample input fed into each given tree that results (vote) in each classified tree’s final classification results, inclined to the majority. If the similarity between trees grows, it only tends to the rate of forest error, and a lower rate of error becomes the choice for the strong classifier [
32]. As a machine learning model is always trained before deploying into real-world applications, RF classifier training also depends on two key parameters—number of decision trees and selected attributes used for evaluation [
33]. It is also characterized by overcoming the overfitting problem and has flexibility towards outlier and noise. It is sampled by the bootstrap method and decision tree classifiers constructed to the forest that are used for further analysis [
34]. For predicting the placement gender and placement status, RF is used with the criterion Gini as a measure of impurity, maximum features set as 7 for the best split, a minimum number of the sample at the leaf is set with a minimum sample leaf as 2, a number of trees in the forest is set with n_estimators as 50 and for the estimation of accuracy generalization an out of bag sample is set as accurate for the score.
Extreme Gradient Boosting
Most data science state-of-the-art challenges are solved by a widely known XGBoost machine learning classifier due to its flexibility, efficiency and portability characteristics. It uses a boosting method to construct a strong classifier that combines a series of weak classifiers. Gradient boosting machines work on the principle of gradient direction to the loss function for weak learners. Model tuning is performed for obtaining higher accuracy while setting the appropriate value to core training parameters and with adding regularization to the objective function [
35,
36]. The objective function (obj(q,w)) with
ith iteration is given below in Equation (
8).
Equation (
9) shows the counting of leaf nodes,
, and
are the regularization parameters. The XGB is also used here for predicting placement gender prediction and placement status with the gamma parameter as 0, which sets the minimum as a loss reduction leaf node partition of the tree, the learning rate is set as 0.1 for step-size shrinking to avoid overfitting, the maximum tree depth is set as 6 and the number of trees is set with n_estimators as 200 for achieving higher accuracy.
Support Vector Machine
The SVM kernel-based model was inferred by Vapnik, and can be used for classification and regression tasks. It is popular due to its power of discrimination and strange capability of generalization. It also provides precise results with optimality. A separation technique directly determines its decision methods, called a marginal line, which are used between the border (decision lines) or margin maximization (generalization) of given classes. SVM always tries to maximize the training data performance in the classification of patterns other than the conventional classification model, which tends to classify only input–output pairs within the belonging class [
37,
38]. However, there could be an infinite hyperplane to separate similar input data points from other datapoint classes. Still, SVM always believes hyperplane which could achieve more generalization when a maximum margin among them can be specified Equation (
10).
Equation (
10) is divided by
and Equation (
11) is derived.
Indicating that the projection of any point on the plane onto the vector is always , that is, is the normal direction of the plane and is the distance from the origin to the plane. Note that the equation of the hyper plane is not unique. represents the same plane for any c. The n-D space is partitioned into two regions by the plane. Specifically, the mapping function is defined as ,
In Equation (
12), any point
on the positive side of the plane is mapped to 1, while any point
on the negative side is mapped to −1. A point
of unknown class will be classified to P if
, or N if
.
Further, this paper used hyper parameter tuning by considering C = 0.01, kernel = linear, gamma = auto.
Gradient Boosting
This paper used Gradient Boosting (GB) for the classification task. This robust classifier works on the boosting technique by combining many weak learning models and uses prevalent real-world applications due to its effectiveness in solving and classifying the problem on very complex datasets. It works on loss function, and in a classification logarithm, a loss method is used; consequently, the GB does not have to derive a new loss function on the addition of a new boosting algorithm. It uses a decision tree as weak learners. In this sample, least-squares are calculated at each iteration and minimize the loss function at given nodes. To enhance the accuracy differential loss function with gradient, a descent procedure is used [
39,
40]. The GB is trained with 100 decision trees with the max depth set as 5 and the learning rate set as 0.2 with the loss value set as deviance, that is, LR with a probabilistic output.
Logistic Regression
The LR is placed under the inductive learning algorithm and is different from linear regression based on the target variable; discrete instead of continuous. The binary target variable is analyzed by a distribution function in which a regression conditional mean is bounded between 0 and 1. Below, Equation (
13) is used for the binary LR to recognize the placement status.
In the LR, the S shape can be observed through which many properties can be extracted. Some threshold is decided, and a value less than the threshold is conceived as one type of classification (Zero) and above the threshold for the other (One) in binary classification [
41,
42]. For predicting placement status, the solver is set as
lbfgs for binary classification, the penalty is set as l2 for use in penalization.
7. Experiments and Results
7.1. Experiment-1
This experiment explores the impact of Students’ gender on their offered salaries. The student’s t-test at a confidence interval of 95% ( = 0.05) was used to test the first null hypothesis “H01”. It explored the impact of gender on salary offered to the students. Gender is an independent variable, and the offered salary is considered the dependant variable. The important assumption the t-test explored was a statistically significant difference between the Male (M) and Female (F) MBA student in terms of offered salary.
Table 6 shows that there is a not statistically significant difference in the offered salaries for male and female participants on all three random sample assessment tests. Despite male groups’ higher offered salaries findings, the results suggest that a difference between offered salaries did not exist, that is, there was no bias in salary offerings to placed students based on gender. It is clear from the results that there is insufficient evidence to reject the null hypothesis (
t(88) = 0.25,
p > 0.05). The rest of the two random samples (T2 and T3) have identical insignificant
p values (
p > 0.05). Therefore, the insignificant
p value proves no statistically significant difference between male and female students in terms of salary offered to them.
7.2. Experiment-2
This experiment infers a significant impact of MBA Specialization on the student’s offered salary. For this, we tested the second null hypothesis “” with t-test at a confidence interval of 95% ( = 0.05). This experiment explored the impact of MBA specialization (Mkt&Fin and Mkt&HR) on the salaries offered to the students. Here, the independent variable is Specialization, and the offered salary is a dependant variable.
Table 7 displays the statistical experimental outcomes of the mean offered salaries of Mkt&HR and Mkt&Fin specialization students on each random sample’s assessments. As is clear from the results, there is not a significant difference between Mkt&HR and Mkt&Fin specialization offered salaries. These results suggest that there is no discrimination made in offered salaries to the Mkt&HR and Mkt&Fin specialization students. Despite Mkt&Fin specialization students, test1 results (
= 108.43,
= 94.57) and Mkt&HR students (
= 108.37,
= 76.85) difference is greater;
t(118) = 0.04, (
p > 0.05), other tests’ data exhibits the same scenarios, but there is no statistical evidence to reject the null hypothesis.
7.3. Experiment-3
This experiment tested the hypothesis that there is significant impact of students’ gender in terms of their placement test marks. Therefore, the student t-test is used at a confidence interval of 95% ( = 0.05) to test the third the null hypothesis “”. It is assumed that there is an impact of gender on placement test percentage of the students. In this experiment, gender is assumed to be an independent variable, and placement-test-percentage is considered the dependent variable. The important assumption the t-test explored is the statistically significant difference between Male (M) and Female (F) MBA students in terms of placement test percentage.
Table 8 reflects the outcomes of the mean score of the male and female groups on each assessment made from the random sample sizes. As the results exhibited, there is no significant difference between the test percentage score on all three assessments. Therefore, insignificant
p value (
p > 0.05) proves no statistically significant differences between male (M) and female (F) students in terms of placement test percentage.
7.4. Experiment-4
This experiment explores the association between MBA specialization and placement status. For this, the
test is applied to determine whether there is a significant difference between MBA Specialization (Mkt&Fin, Mkt&HR) Placement-Status (Placed or Not-Placed) to test the fourth null hypothesis “
, which assumed no significant association between MBA specialization and Placement-Test. There is a statistically significant association found for Placement-Status
(1, N = 215) = 13.51,
p = 0.00 in
Table 9.
The actual association ( = 0.25) between specialization and status is small, calculated with the crammer’s V-Test, indicating that a weak positive relationship exists. The reason for the weak positive relationship can be explored with a large value from the cell parenthesis being 5.19 in the “Not-Placed” column, which signifies the high value of specialization. The larger value for this cell can be attributed to a higher number of observed values (42), while fewer high values are expected by chance (29.60). Moreover, a greater value of 2.35 in the placement status column “Placed” reflects a relationship between the high value of specialization and the subject Mkt&Fin.
7.5. Experiment-5
This experiment is conducted to evaluate an association between the degree of stream and placement status. To test the fifth null hypothesis “
”, this experiment used the
test to explore the association between the degree of the stream (Comm&Mgmt, Sci&Tech and Other) and placement status (Placed or Not-Placed) of students. It is observed that there is no statistically significant association between degree of stream and placement status
(2,
N = 215) = 2.97,
p = 0.56 depicted in
Table 10.
The exact insignificant p value (p > 0.05) signifies a failure to reject the null hypothesis, that is, there is not a significant association between the two variables (degree and status). The actual association ( = 0.12) between degree stream and status is small, calculated with the crammer’s V-Test, indicating that no positive relationship exists. The reason for this can be explored with an immense value from table cell parenthesis being 0.87 in the Placed column signifiying an association of the high value of another stream degree in terms of placement. The more considerable value for this cell can be attributed to a lower number of observed values (5), also to a lower number than expected by chance (7.57). Moreover, a lower value of 1.93 in the not placed status reflects a relationship between the low value of degree and a subject belonging to another degree. Further, the fisherman exact test can be used and the expected value for the “Other” class can be found (3.43 < 5).
7.6. Experiment-6
This section of this paper discusses the experimental results of various contemporary classification algorithms to identify the future students’ placement status with their predictive features. At first, all used classification models, that is, RF, XGboost, SVM and LR, along with full feature space, are evaluated. After that, three feature selection algorithms: RF feature selector, XGBoost feature Selector, SVM crucial feature selector are applied to select prominent and high variant features from feature space. The experimental results showed that the SVM classification has been reasonably successful compared with the other classification in terms of all performance assessment measurements. SVM achieved a precision of 90%, sensitivity of 92%, precision of 85%, and an F1 score of 88% at C = 0.01, gamma set as auto with linear kernel. In the LR classification model, this model has displayed better performance with 88% accuracy, 84% precision, 88% recall rate, and 86% F1-score with lbfs solver and class weight set as balanced. Similarly, the RF classifier has achieved an accuracy of 83%, 83% recall, 77% precision, and 80% F1-Score at the gini criterion with 7 maximum features, 2 minimum sample leaves with a 200 number of estimators. XGBoost classifier has achieved 83% accuracy as similar to RF,82% precision, 75% sensitivity with 78% F1-score at learning rate set as 0.1 with 6 maximum delta step, minimum child weight set as 6.
Table 11 displays the four important performance matrices (Precision, Recall, F1-Score, and Accuracies) related to the four proposed model classification. F1-Score is a collective term for Precision, and Recall is also known as weighted harmonic mean. F1-Score is computed using Equations (
14) and (
15) calculated the Recall, and Equation (
16) measured the Precision [
43].
The SVM classifier weighted harmonic mean (88%) is recorded as the highest followed by LR (86%). Its F1-Score can judge any classifier’s predictive power, the SVM F1 Score proving significant among the classifiers because it balances recall and precision. SVM predictive power (precision) can be verified by its highest value, which is 0.85. The right prediction (Recall) out of actual true positive is 0.92 can be observed as highest among all classifiers. It shows all proposed machine learning algorithms’ vital performance metrics working on binary classification for predicting Placement-status (Placed/Not-Placed). The performance measures compared with all mentioned predictive algorithms reflect the SVM perfect model w.r.t F1-Score (88%) and accuracy (90%).
Figure 7 shows the confusion matrices of all proposed classifiers. An accurate prediction can be observed with diagonal values in cream and red color. The black color shows the misclassification. The SVM Classifier’s confusion matrix displays the highest prediction, followed by LR with the highest accuracy (90%, 86%).
Figure 8 visualizes the combined ROC curve for comparing each classifier’s strength (LR, RF, SVM, and XGB) with precision. It can be observed with each placement status prediction model that the classifiers perform better than the benchmark. At a very high level of precision, the LR classifier performs well with the AUC (95.7%), followed by the RF classifier (AUC-94.9%). At the early stage, XGB sensitivity (0.5) at 0.0 cutoff goes high, but after 0.5 sensitivity, the LR classifier gains momentum rapidly with maximum sensitivity. The SVM classifier was found to be unstable in the prediction of placement status.
Figure 9 shows the accurate prediction from the diagonal values of confusion matrices. The RF misclassification ratio (4:3–12.5%) is very low among other models with accuracy (88%) as compared to both models’ misclassification (17.9%).
Extracting essential features from a given dataset is a contribution and focused duty of researchers. It enables students to improve their efficiencies on given parameters that are needed for the placement. The applied supervised machine learning algorithms used a required feature extractor method. Other models (RF, XGB) placed more emphasis on SSC and degree percentage,
Figure 10 and
Figure 11 showing the critical, relevant features for this placement prediction problem extracted with an SVM classifier’s help. Future work experience, MBA, and SSC percentage are the most demanding features for upcoming placement drives. The common perception that can be made from the below essential feature extraction is that high percentages in overall degrees play a pivotal role in extracting placements and gender plays a small role in comprehensive extraction.
7.7. Experiment-7
This experiment identified the future placed student’s gender based on their relevant predictive features (SSC_P, HSC_P, Degree_P, Etest_P, SSC_B, HSC_B, HSC_S, Degree_T, Specialization, Status, Salary). We trained and tested three machine learning algorithms: RF, XGB and GB. According to
Table 12, the RF classifier achieved the best performance among all specified classifier with 88% accuracy, 90% sensitivity and a precision of 87% with maximum features of 7, minimum sample leaf of 2 with a number of estimators of 50 and the RF used the gini criterion. The 2nd best classifier, XGB, was trained with gamma as zero, learning rate as 0.1, maximum depth set as 6, maximum delta step as 2 with the number of estimators set as 200, giving an accuracy of 82%, precision of 85% and sensitivity of 79%. The GB algorithm found the third significant classifier conducted with a learning rate of 0.2, with the loss set as deviance with a maximum depth of 5, having 80% accuracy, 85% precision, 76% sensitivity and an F1-Score of 80%.
Further, in
Figure 12, The true positive rate (Y-axis) is plotted against the false positive rate (X-axis) to construct a ROC curve for placement Gender prediction, which is one of the essential tools for diagnostic test evaluation. A classifier’s superiority is measured by its AUC value, which is more significant the better. In this paper, the best GB AUC is 0.883, followed by the AUC for RF is 0.879. The GB ROC appears to be more performing than the other. proposed models.
The important feature extraction plays a lead role in grasping the leading features in predicting any target variable.
Figure 13 visualizes the significant relatively important features. From the above result, it is clear that the RF model and GB play a significant role in predicting with the highest accuracy. It can also be observed that the MBA percentage (25%) followed by SSC percentage (15%) are major contributors in predicting the gender and MBA Specialization (Mkt&Fin, Mkt&HR) and degree streams (commerce, Sci&Tech and other) has nothing contributions. The XGB model underplaying the importance of academic percentage in predicting the placed gender and gives importance to the degree stream (Sci&Tech).
Figure 12 graphs the ROC curve of the placement gender at dynamic thresholds. It is observed that the RF and XGB start sensing at 0.1 and end up at 0.98 but the GB starts sensing at point 0.6. It is visible that the GB area under the curve (89.8%) is the highest among the other models, XGB (85.2%) and RF (87.9%).
8. Discussion
In the statistical tests, the significant p-value is essential for judging the hypothesis. To test the first three null hypotheses, a statistical t-test played a vital role. On the one hand, it explored the impact on offered salary of the student’s gender and MBA specialization. On the other hand, the placement test’s effect on gender was evaluated. Further, an association test was applied to explore the relationship between placement status and degree stream and MBA specialization. Later, this paper used the machine learning algorithms to automate predictive models to recognize the gender of placed students with its status.
It is found that the first null hypothesis, “: No Significant difference between male and female students towards Offered salary” failed to be rejected (p > 0.05). It showed no statistically significant differences in the offered salary based on gender. Hence, this paper explored no impact of the offered salary on student’s gender. Based on this, the authors proposed its alternative hypothesis, “: A Significant difference between male and female students towards Offered salary”, which it failed to accept. The same scenario also happened in the case of the second and third null hypotheses: “H02: No Significant difference between Mkt&Fin and Mkt&HR towards offered salary” and “: No significant difference between male and female students towards placement test percentage”, which also failed to be rejected (p > 0.05). Hence, it is found that the offered salary has no impact on the student’s specialization in their MBA study. Further, the student’s placement test percentage did not affect gender. Therefore, the alternative hypotheses: “: A Significant difference between Mkt&Fin and Mkt&HR towards offered salary” and “: A significant difference between male and female students towards placement test percentage” were failed to be accepted. Based on the first three hypotheses tests, no linear association was observed between student demographic features and offered salary and placement test percentage.
On the contrary, this paper observed strange results from experiments that belonged to the association finding between MBA specialization and placement status. The authors observed that the fourth null hypothesis, “: No association between Mkt&Fin and Mkt&HR specialization towards placement status” failed to be accepted (p < 0.05)”. Therefore, specialization in a master’s degree impacted the placement of students. Alternately, the hypothesis, “: A significant association between Mkt&Fin and Mkt&HR specialization towards placement status” failed to be rejected (p < 0.05). Further, the fifth hypothesis, “: No association between stream of degree and placement status” failed to be rejected (p > 0.05). Thus, the present work found a significant association of degree stream and placement status. For the present work, we proposed the alternative hypothesis, “: A significant association between the stream of degree and placement status” with remarks “failed to accept”, which proved that the bachelor degree of streams (Sci&Tech, Comm&Mgmt, and others) have a correlation with students’ placements. This work can also conclude that the bachelor’s degree streams did not have any impact on placement status.
The finding of the paper is self-evident, that the demographic features of students are not linearly correlated with offered salary and placement test percentage, which did not support [
13]. The result of association between MBA specialization and placement status hypothesis
also supported [
11,
12,
17] but in the case of
, it was not supported. The sixth objective for predicting students’ placement was achieved with the SVM model with the highest accuracy (90%) with features that also play a major role in the placement of students. It was observed that work experience with the highest master’s degree percentage and SSC percentage are necessary for getting a placement (
Figure 11) and the results are supported by [
4,
8]. The seventh objective for predicting the gender of a placed student with an RF model with the highest accuracy (88%) supported [
8,
9]. The present paper unleashed thoughts on a real-time solution to assessing the impact of demographic features on placement and their offered salaries and to helping predict the placement status of given students’ academic percentage and other features with the extraction of important features in getting a placement. It also predicted the gender of placement.
9. Strength and Weakness
The use of statistical computations and machine learning techniques strengthen our presented hybrid automated model PPDI. The hybrid approach can explore the association of course specialization and degree stream with student’s placement status, but also discover the impact of gender, MBA specialization, and placement Test percentage on the salaries offered to them. Additionally, the inline robust accuracy of 88% of the RF algorithm to identify the gender of placed students strengthen the predictive power of the PPDI. Further, the SVM algorithm’s implementation with a significant accuracy of 90% in predicting the status of a placement is a new feather in the cap of PPDI. The dataset has limited observations and a confined number of features. Moreover, it covers only MBA domain students. The placement companies’ names and their interest requirements are missing. A limited number of statistical and machine learning algorithms were used in this study.
10. Conclusions and Future Study
This study proposed and developed a hybrid environment of statistical computations with machine learning algorithms to analyze the student’s placement dataset. The result of the first experiment showed that the offered salary has no impact on the student’s gender with three normal random samples (t(88) = 0.25, (p > 0.05), (t(118) = 0.18, (p > 0.05), (t(138) = 0.27, (p > 0.05). In the second experiments, this paper concluded that offered salary does not have any impact on the MBA specialization (t((118) = 0.10, (p > 0.05), (t(168) = 0.95, (p > 0.05), (t(168) = 0.42, (p > 0.05). The outcome of the third experiment proved that the test score of a student’s placement does not affect the gender in three sample assessments (t(108) = 0.73, (p > 0.05), (t(88) = 0.60, (p > 0.05), (t(138) = 0.41, (p > 0.05). The fourth experiment also proved that the student’s specialization of MBA influenced the student’s placement (p < 0.05). The finding of the fifth experiment showed that the student’s placement status also bonded with the degree stream (p < 0.05). Overall, the differential analysis proved that neither gender made any impact on their offered salaries nor on placement test percentage scores (p > 0.05). The inferential analysis concluded that the MBA-specialization and degree stream are associated with placement status (p > 0.05). On the one hand, the current research found a weak positive relationship (0.25) between MBA specialization and placement test, and on the other hand, MBA specialization did not make any difference to offered salaries (p > 0.05). In the sixth experiment, the SVM model outperformed all proposed models (RF, XGB, LR) in terms of accuracy (90%) and F1-Score (88%) in the prediction of the placement status of MBA students. It suggested the two most prominent work experience and MBA academic percentages to support the placement. The result of the seventh experiment revealed that the RF classifier seems to be the best model out of all the considered models (RF, XGB, GB) in terms of accuracy (88%) and F1-Score (88%), for recognizing the gender of the placed student. The in-built featured extractor of the applied algorithm proved that work-experience, MBA percentage, and SSC percentage are key features according to SVM, but RF and XGB both point to academic percentages (SSC, HSC, MBA) as the main features for estimating the placement status. Additionally, MBA percentage, SSC percentage, and offered salary are the important core features in predicting placement and gender according to RF and GB.
These differential, inferential and predictive models can be used by educational institutions or universities for predicting placements and can also be used for assessing the impact of demographic variables. Future work includes gathering primary samples with a vast number of instances and features from more than one institution and evaluating them with feature engineering and optimization algorithms. Later, a web-based real-time automated placement prediction system will be developed considering significant features. The feature selection and dimension reduction techniques can also yield even better results. For this,
statistics with correspondence analysis based feature selection [
44], gain ratio and info-gain [
45] based dimension reduction approaches can be used.
Author Contributions
R.-A.F. Conceptualization, D.K., C.V., Data curation, D.K., C.V., Methodology, D.K., Formal analysis, D.K., Investigation, D.K, Resources, visualization, D.K., C.V., Validation, C.V., Writing—original draft preparation, D.K., writing—review and editing, D.K., C.V., P.K.S., R.-A.F., M.S.R., K.Z.G., Project Administration, R.-A.F., M.S.R., C.V., Funding acquisition, R.-A.F., M.S.R., K.Z.G. All authors have read and agreed to the published version of the manuscript.
Funding
The work was supported by a grant of the Romanian Ministry of Research and Innovation, CCCDI-UEFISCDI, project number PN-III-P1-1.2-PCCDI-2017-0776/No. 36 PCCDI/15.03.2018, within PNCDI III. Acknowledgments to the National Center for Hydrogen and Fuel Cells (CNHPC)—Installations and Special Objectives of National Interest (IOSIN).
Acknowledgments
The second author’s work related to the project “Talent Management in Autonomous Vehicle Control Technologies (EFOP-3.6.3-VEKOP-16-2017-00001)”. The fourth author’s appurtenance this research to her Doctoral School Polytechnic University of Bucharest.
Conflicts of Interest
The authors declare no conflict of interest.
Abbreviations
The following abbreviations are used in this manuscript:
| PPDI | Placement Prediction with Demographic Impact Identification |
| RF | Random Forest |
| SVM | Support Vector Machine |
| MBA | Master of Business Administration |
| Mkt&HR | Marketing& Human |
| Mkt&Fin | Marketing&Finance |
| Sci&Tech | Science & Technology |
| Comm&Mgmt | Commerce & Management |
| KNN | K-Nearest Neighbors |
| KMO | Kaiser-Meyer-Olkin |
| XGB | eXtreme Gradient Boosting |
| GB | Gradient Boosting |
| LR | Logistic Regression |
| DFD | Determinant Feature Detection |
| LNR | Linear Regression |
| SMOTE | Synthetic minority oversampling technique |
| AUC | Area Under Curve |
References
- Şen, B.; Uçar, E.; Dele, D. Predicting and analyzing secondary education placement-test scores: A data mining approach. Expert Syst. Appl. 2012, 39, 9468–9476. [Google Scholar] [CrossRef]
- Gallagher, A.M.; De Lisi, R. Gender differences in Scholastic Aptitude Test: Mathematics problem solving among high-ability students. J. Educ. Psychol. 1994, 86, 204–211. [Google Scholar] [CrossRef]
- Roshan, D.; Ben, K. Campus Placement. Available online: https://www.kaggle.com/benroshan/factors-affecting-campus-placement (accessed on 19 December 2020).
- Ojha, A.; Pattnaik, U.; Sankar, S.R. Data analytics on placement data in a South Asian University. In Proceedings of the IEEE 2017 International Conference on Energy, Communication, Data Analytics and Soft Computing (ICECDS), Chennai, India, 1–2 August 2017; pp. 2413–2442. [Google Scholar]
- Pruthi, K.A.; Bhatia, P. Application of Data Mining in predicting placement of students. In Proceedings of the IEEE 2015 International Conference on Green Computing and Internet of Things (ICGCIoT), Greater Noida, India, 8–10 October 2015; pp. 53–58. [Google Scholar]
- Elayidom, S.; Idikkula, S.M.; Alexander, J.; Ojha, A. Applying Data Mining Techniques for Placement Chance Prediction. In Proceedings of the IEEE 2009 International Conference on Advances in Computing, Control, and Telecommunication Technologies, Bangalore, India, 28–29 December 2009; pp. 669–671. [Google Scholar]
- Aravind, T.; Reddy, B.S.; Avinash, S.; Jeyakumar, G. A Comparative Study on Machine Learning Algorithms for Predicting the Placement Information of Under Graduate Students. In Proceedings of the IEEE 2019 Third International conference on I-SMAC (IoT in Social, Mobile, Analytics and Cloud) (I-SMAC), Palladam, India, 12–14 December 2019; pp. 542–546. [Google Scholar]
- Sreenivasa Rao, K.; Swapna, N.; Kumar, P. Educational data mining for student placement prediction using machine learning algorithms. Int. J. Eng. Technol. 2018, 7, 204–211. [Google Scholar] [CrossRef]
- Dubey, A.; Mani, M. Using Machine Learning to Predict High School Student Employability—A Case Study. In Proceedings of the IEEE 2019 International Conference on Data Science and Advanced Analytics (DSAA), Washington, DC, USA, 5–8 October 2019; pp. 604–605. [Google Scholar]
- Xu, J.; Moon, K.H.; Van Der Schaar, M. A Machine Learning Approach for Tracking and Predicting Student Performance in Degree Programs. IEEE J. Sel. Top. Signal Process. 2017, 11, 742–753. [Google Scholar] [CrossRef]
- Duan, Y.; Berger, E.; Kandakatla, R.; DeBoer, J.; Stites, N.; Rhoads, J.F. The Relationship Between Demographic Characteristics and Engagement in an Undergraduate Engineering Online Forum. In Proceedings of the IEEE 2018 Frontiers in Education Conference (FIE), San Jose, CA, USA, 3–6 October 2018; pp. 1–8. [Google Scholar]
- Rui, H.; Hu, Y. The statistical research on the influence factors of college students’ English level. In Proceedings of the IEEE 2011 International Conference on Multimedia Technology, Hangzhou, China, 26–28 July 2011; pp. 29–212. [Google Scholar]
- Long, Q.; Hu, Q. Gender difference in learning styles of computer majors: Measurement and analysis. In Proceedings of the IEEE 2010 5th International Conference on Computer Science & Education, Hefei, China, 24–27 August 2010; pp. 62–66. [Google Scholar]
- Verma, C.; Dahiya, S. Gender difference towards information and communication technology awareness in Indian universities. SpringerPlus 2016, 5, 1–7. [Google Scholar] [CrossRef] [PubMed]
- Gabor, K. Teaching Programming in the Higher Education not for Engineering Students. Procedia Soc. Behav. Sci. 2013, 103, 922–927. [Google Scholar]
- Sevindi, T. Investigation of Social Appearance Anxiety of Students of Faculty of Sport Sciences and Faculty of Education in Terms of Some Variables. Asian J. Educ. Train. 2020, 6, 541–545. [Google Scholar] [CrossRef]
- Alemdağ, S.; Öncü, E. The Investigation of Participation Physical Activity and Social Appearance Anxiety at The Preservice Teachers. Int. J. Sport Cult. Sci. 2015, 3, 12–50. [Google Scholar]
- Nagaria, J.; S, V.S. Utilizing Exploratory Data Analysis for the Prediction of Campus Placement for Educational Institutions. In Proceedings of the 2020 11th International Conference on Computing, Communication and Networking Technologies (ICCCNT), Kharagpur, India, 1–3 July 2020; pp. 1–7. [Google Scholar]
- Dutta, S.; Bandyopadhyay, S.K. Forecasting of Campus Placement for Students Using Ensemble Voting Classifier. Asian J. Res. Comput. Sci. 2020, 5, 1–12. [Google Scholar] [CrossRef]
- Macias-Velasque, S.; Baez-Lopez, Y.; Maldonado-Macías, A.; Tlapa, D.; Limon-Romero, J.; Hernández-Arellan, J. Working Hours, Burnout and Musculoskeletal Discomfort in Middle and Senior Management of Mexican Industrial Sector. IEEE Access 2020, 8, 48607–48619. [Google Scholar] [CrossRef]
- Hair, J.F., Jr.; Black, W.C.; Babin, B.J.; Anderson, R.E. Confirmatory Factor analysis. In Multivariate Data Analysis; Pearson: London, UK, 2014. [Google Scholar]
- MATPLOTLIB. Available online: https://matplotlib.org/ (accessed on 25 December 2020).
- Seaborn. Available online: https://seaborn.pydata.org/ (accessed on 25 December 2020).
- Ding, A.A.; Chen, C.; Eisenbarth, T. Simpler, Faster, and More Robust t-test Based Leakage Detection. In Constructive Side-Channel Analysis and Secure Design, Lecture Notes in Computer Science; Standaert, F.X., Oswald, E., Eds.; Springer International Publishing: Klagenfurt, Austria, 2016; pp. 163–183. [Google Scholar]
- Verma, C.; Zoltán, I.; Veronika, S.; Viktória, B. Opinion Prediction of Hungarian Students for Real-Time E-Learning Systems: A Futuristic Sustainable Technology-Based Solution. Sustainability 2020, 12, 6321. [Google Scholar] [CrossRef]
- Li, Y. Applications of Chi-Square Test and Contingency Table Analysis in Customer Satisfaction and Empirical Analyses. In International Conference on Innovation Management; IEEE: Wuhan, China, 2009; pp. 105–107. [Google Scholar]
- Rajput, S.A.; Pandya, A.S.; Saxena, S.; Ostroff, S. Evaluating mobile phone handoff behavior using chi-square statistical test. In Proceedings of the IEEE SoutheastCon 2008, Huntsville, AL, USA, 3–6 April 2008; pp. 372–377. [Google Scholar]
- Vijayabanu, C.; Chandrasekar, V.; Pradheeba, C. Model Fit Using Regression Equation-Personality of Engineering Students and their Academic Performance. In Proceedings of the IEEE 2018 International Conference on Current Trends towards Converging Technologies (ICCTCT), Coimbatore, India, 1–3 March 2018; pp. 1–6. [Google Scholar]
- Verma, C.; Zoltán, I.; Veronika, S.; Singh, P.K. Predicting Attitude of Indian Student’s Towards ICT and Mobile Technology for Real-Time: Preliminary Results. IEEE Access 2020, 8, 178022–178033. [Google Scholar] [CrossRef]
- Khan, F.; Kanwal, S.; Alamri, S.; Mumtaz, B. Hyper-Parameter Optimization of Classifiers, Using an Artificial Immune Network and Its Application to Software Bug Prediction. IEEE Access 2020, 7, 20954–20964. [Google Scholar] [CrossRef]
- Guo, Y.; Zhou, Y.; Hu, X.; Cheng, W. Research on Recommendation of Insurance Products Based on Random Forest. In International Conference on Machine Learning, Big Data and Business Intelligence (MLBDBI); IEEE: Taiyuan, China, 2019; pp. 308–311. [Google Scholar]
- Patel, S.V.; Jokhakar, V.N. A random forest-based machine learning approach for mild steel defect diagnosis. In Proceedings of the IEEE 2018 International Conference on Current Trends towards Converging Technologies (ICCTCT), Chennai, India, 15–17 December 2016; pp. 1–8. [Google Scholar]
- Petkovic, D.; Barlaskar, S.H.; Yang, J.; Todtenhoefer, R. From Explaining How Random Forest Classifier Predicts Learning of Software Engineering Teamwork to Guidance for Educators. In Proceedings of the IEEE 2018 IEEE Frontiers in Education Conference (FIE), San Jose, CA, USA, 3–6 October 2018; pp. 1–7. [Google Scholar]
- Breiman, L. Random Forests. Mach. Learn. 2001, 45, 5–32. [Google Scholar] [CrossRef]
- Dong, X.; Lei, T.; Jin, S.; Hou, Z. Short-Term Traffic Flow Prediction Based on XGBoost. In Proceedings of the IEEE 2018 IEEE 7th Data Driven Control and Learning Systems Conference (DDCLS), Enshi, China, 25–27 May 2018; pp. 854–859. [Google Scholar]
- Chen, M.; Liu, Q.; Chen, S.; Liu, Y.; Zhang, C.; Liu, R. XGBoost-Based Algorithm Interpretation and Application on Post-Fault Transient Stability Status Prediction of Power System. IEEE Access 2019, 7, 13149–13158. [Google Scholar] [CrossRef]
- Cervantes, J.; Garcia-Lamont, F.; Rodríguez-Mazahua, L.; Lopez, A. A comprehensive survey on support vector machine classification:Applications, challenges and trends. Neurocomputing 2020, 408, 189–215. [Google Scholar] [CrossRef]
- Tian, Y.; Shi, Y.; Liu, X. Recent advances on support vector machines research. Technol. Econ. Dev. Econ. 2020, 18, 5–33. [Google Scholar] [CrossRef]
- Priyadarshini, R.K.; Banu, A.B.; Nagamani, T. Gradient Boosted Decision Tree based Classification for Recognizing Human Behavior. In Proceedings of the IEEE 2019 International Conference on Advances in Computing and Communication Engineering (ICACCE), Sathyamangalam, India, 4–6 April 2019; pp. 1–4. [Google Scholar]
- Dutta, S.; Bandyopadhyay, S.K. Early Lung Cancer Prediction Using Neural Network with Cross-validation. Asian J. Res. Infect. Dis. 2020, 4, 15–22. [Google Scholar] [CrossRef]
- Brzezinski, J.R.; Knafl, G.J. Logistic regression modeling for context-based classification. In Proceedings of the Tenth International Workshop on Database and Expert Systems Applications, Florence, Italy, 3 September 1999; pp. 755–759. [Google Scholar]
- Hui-lin, Q.; Feng, G. A research on logistic regression model based corporate credit rating. In Proceedings of the International Conference on E-Business and E-Government (ICEE), Shanghai, China, 6–8 May 2011; pp. 1–4. [Google Scholar]
- Verma, C.; Zoltán, I.; Veronika, S.; Tanwar, S.; Kumar, N. Machine Learning-Based Student’s Native Place Identification for Real-Time. IEEE Access 2020, 8, 130840–130854. [Google Scholar] [CrossRef]
- Verma, C.; Zoltán, I.; Veronika, S.; Viktória, B. Comparative Study of Technology With Student’s Perceptions in Indian and Hungarian Universities for Real-Time: Preliminary Results. IEEE Access 2021, 8, 22824–22843. [Google Scholar] [CrossRef]
- Verma, C.; Zoltán, I.; Veronika, S. Prediction of residence country of student towards information, communication and mobile technology for real-time: Preliminary results. Procedia Comput. Sci. 2020, 167, 224–234. [Google Scholar] [CrossRef]
Figure 1.
Placement Prediction with Demographic Impact Identification (PPDI).
Figure 1.
Placement Prediction with Demographic Impact Identification (PPDI).
Figure 2.
Dataset Numeric Feature’s Relationship.
Figure 2.
Dataset Numeric Feature’s Relationship.
Figure 3.
Dataset Box-plots (a) Salary According to Gender, (b) Salary According to Senior Secondary Board, (c) Salary According to Higher Secondary Board, (d) Salary According to Bachelor degree stream, (e) Salary According to Work Experience, (f) Salary According to MBA Specialization.
Figure 3.
Dataset Box-plots (a) Salary According to Gender, (b) Salary According to Senior Secondary Board, (c) Salary According to Higher Secondary Board, (d) Salary According to Bachelor degree stream, (e) Salary According to Work Experience, (f) Salary According to MBA Specialization.
Figure 4.
Dataset Density Plot (a) Placement according to SSC Percentage, (b) Placement according to HSC Percentage, (c) Placement according to Bachelor degree Percentage, (d) Placement according to Placement Test Percentage.
Figure 4.
Dataset Density Plot (a) Placement according to SSC Percentage, (b) Placement according to HSC Percentage, (c) Placement according to Bachelor degree Percentage, (d) Placement according to Placement Test Percentage.
Figure 5.
Placement Status Balancing: (a) Unbalanced placement, (b) Balanced placement.
Figure 5.
Placement Status Balancing: (a) Unbalanced placement, (b) Balanced placement.
Figure 6.
Gender Balancing: (a) Unbalanced Gender, (b) Balanced Gender.
Figure 6.
Gender Balancing: (a) Unbalanced Gender, (b) Balanced Gender.
Figure 7.
Confusion matrix of Placement Status: (a) LR, (b) SVM, (c) XGB, (d) RF.
Figure 7.
Confusion matrix of Placement Status: (a) LR, (b) SVM, (c) XGB, (d) RF.
Figure 8.
ROC curve of Placement status.
Figure 8.
ROC curve of Placement status.
Figure 9.
Confusion matrix of Placement Gender: (a) GB, (b) XGB, (c) RF.
Figure 9.
Confusion matrix of Placement Gender: (a) GB, (b) XGB, (c) RF.
Figure 10.
Feature Importance of SVM for Placement status.
Figure 10.
Feature Importance of SVM for Placement status.
Figure 11.
Feature Importance for placement status: (a) RF, (b) XGB.
Figure 11.
Feature Importance for placement status: (a) RF, (b) XGB.
Figure 12.
ROC curve of Placement Gender.
Figure 12.
ROC curve of Placement Gender.
Figure 13.
Feature Importance of GB, RF, XGB for Gender placement.
Figure 13.
Feature Importance of GB, RF, XGB for Gender placement.
Table 1.
The extant research with the previous study.
Table 1.
The extant research with the previous study.
| Study | Research | Dataset | Technique | Association | Impact | DFD |
|---|
| A. Ojha et al. (2017) | Predictive | S = 143, F = 26 | DT, RF | × | √ | × |
| K. Pruthi et al. (2015) | Predictive | S = 424, F = 27 | DT, NB | × | × | × |
| S. Elayidom et al. (2009) | Predictive | S = 1063, F = 05 | DT | × | × | × |
| T. Aravind et al. (2019) | Regression | S = 100, F = 09 | LNR,DT,XGB,GB,RF | × | × | × |
| A. Dubey et al. (2019) | Predictive | S = 195, F = 10 | LR,DT,RF,KNN,SVM | × | × | × |
| S. Alemdag et al. (2015) | Differential/
Inferential | S = 2324, F = 05 | One-way ANOVA, t-test,
| √ | √ | × |
| Gabor Kiss et al. (2013) | Differential/
Inferential | S = 74, F = 03 | t-test,
| √ | √ | × |
| C. Verma et al. (2016) | Differential | S = 900, F = 36 | t-test | × | √ | × |
| Q. Long et al. (2010) | Differential | S = 464, F = 08 | t-test | × | √ | × |
| Rui Hua et al. (2011) | Differential | S = 400, F = 06 | | √ | × | × |
| T. Sevindi et al. (2020) | Inferential | S = 448, F = 05 | t-test, One-way ANOVA,
LSD | × | √ | × |
| J. Nagaria et al. (2020) | Descriptive | S = 215, F = 14 | EDA | × | × | × |
| S. Dutta et al. (2020) | Predictive | S = 215, F = 14 | MLP,NB,DT,KNN,
SGD,RF,ADB,ET,GB | × | × | × |
| Present | Differential/
Inferential/
Predictive | S = 215, F = 14 | , t-test,
XGB,SVM,RF,LR | √ | √ | √ |
Table 2.
Dataset Feature Description.
Table 2.
Dataset Feature Description.
| Feature Name | Type | Description | ∧ ∨ | | |
|---|
| Gender | Nominal | Gender (M/F) | 0–1 | 0.65 | 0.48 |
| SSC_P | Scale | SSC Percentage | 40.89–89.40 | 67.30 | 10.83 |
| SSC_B | Nominal | SSC Passing Board (Central/Other) | 0–1 | 0.54 | 0.50 |
| HSC_P | Scale | High School Percentage | 37.9–97.70 | 66.33 | 10.90 |
| HSC_B | Scale | HSC Passing board (Central and Other) | 0–1 | 0.39 | 0.49 |
| HSC_S | Nominal | High Schooling Streams (Commerce/Science/Arts) | 0–2 | 1.37 | 0.58 |
| Degree_P | Scale | Degree Percentage | 50–91 | 66.37 | 7.36 |
| Degree_T | Nominal | Degree Streams (Technology/Commerce& Mgmt/Other) | 0–1 | 0.29 | 0.45 |
| Work_Ex | Nominal | Any Work Experience (Yes/No) | 0–1 | 0.34 | 0.48 |
| E_Test_P | Scale | Placement Test Percentage | 50–98 | 72.10 | 13.27 |
| Specialization | Nominal | MBA Specialization (Mkt&HR and Mkt&Fin) | 0–1 | 0.56 | 0.50 |
| MBA_P | Scale | MBA Percentage | 51.21–77.89 | 62.28 | 5.83 |
| Status | Nominal | Placement Status (Yes/No) | 0–1 | 0.69 | 0.46 |
| Salary | Scale | Offered Salary in Campus Placement | 0–940,000 | 198,702.33 | 154,780.92 |
Table 3.
Sample Adequacy and Correlation.
Table 3.
Sample Adequacy and Correlation.
| KMO | Cumulative Variance | Approximate | df | Sig. p |
|---|
| 0.656 | 71.5% | 1012.5 | 91 | 0.000 |
Table 4.
Shapiro-wilk statistics for normality test.
Table 4.
Shapiro-wilk statistics for normality test.
| Shapiro Significance | Male Offered Salary | Female Offered Salary | Mkt&Fin Offered Salary | Mkt&HR Offered Salary | Male MBA Percentage | Female MBA Percentage |
|---|
| W | 0.10 | 0.99 | 0.98 | 0.97 | 0.99 | 0.99 |
| p | 0.45 | 0.41 | 0.18 | 0.51 | 0.34 | 0.79 |
Table 5.
Levene test of homogeneity in variances.
Table 5.
Levene test of homogeneity in variances.
| Variable | Statistic | p |
|---|
| Gender | 0.06 | 0.81 |
| Specialization | 1.58 | 0.21 |
| Mark Percentage | 0.34 | 0.56 |
Table 6.
Gender Impact on offered salary with t-test at = 0.05.
Table 6.
Gender Impact on offered salary with t-test at = 0.05.
Sample-
Assessment | Gender | N | | | t | df | Sig.
(2-Tailed) | Result |
|---|
| | M | 45 | 111.20 | 92.46 | 1.70 | 88 | 0.25 | p > 0.05 “H0:Fail
to Reject” |
| T1 | F | 45 | 89.44 | 83.81 | | | | |
| | M | 60 | 117.01 | 84.66 | 1.35 | 118 | 0.18 | p > 0.05 “H0:Fail
to Reject” |
| T2 | F | 60 | 95.79 | 88.07 | | | | |
| | M | 70 | 115.06 | 90.48 | 1.11 | 138 | 0.27 | p > 0.05 “H0:Fail
to Reject” |
| T3 | F | 70 | 97.42 | 97.47 | | | | |
Table 7.
Specialization Impact on offered salary with t-test at = 0.05.
Table 7.
Specialization Impact on offered salary with t-test at = 0.05.
Sample-
Assessment | Specialization | N | | | t | | Sig. (2-
Tailed) | Result |
|---|
| | Mkt&HR | 60 | 108.37 | 76.85 | 0.00 | 118 | 0.10 | p > 0.05 “H0:Fail
to Reject” |
| T1 | Mkt&Fin | 60 | 108.43 | 94.57 | | | | |
| | Mkt&HR | 85 | 110.87 | 115.64 | 0.07 | 168 | 0.95 | p > 0.05 “H0:Fail
to Reject” |
| T2 | Mkt&Fin | 85 | 112.05 | 110.84 | | | | |
| | Mkt&HR | 95 | 97.99 | 120.85 | 0.81 | 168 | 0.42 | p > 0.05 “H0:Fail
to Reject” |
| T3 | Mkt&Fin | 95 | 111.43 | 105.81 | | | | |
Table 8.
Gender Impact on placement test score with t-test at = 0.05.
Table 8.
Gender Impact on placement test score with t-test at = 0.05.
| Sample-Assessment | Specialization | N | | | t | df | Sig. (2-Tailed) | Result |
|---|
| | M | 55 | 102.46 | 83.39 | 0.35 | 108 | 0.73 | p > 0.05 “H0:Fail to Reject” |
| T1 | F | 55 | 107.54 | 68.67 | | | | |
| | M | 45 | 110.88 | 77.04 | 0.53 | 88 | 0.60 | p > 0.05 “H0:Fail to Reject” |
| T2 | F | 45 | 118.98 | 67.74 | | | | |
| | M | 70 | 103.33 | 99.46 | 0.83 | 138 | 0.41 | p > 0.05 “H0:Fail to Reject” |
| T3 | F | 70 | 89.43 | 99.07 | | | | |
Table 9.
Specialization Status cross-tabulation.
Table 9.
Specialization Status cross-tabulation.
| Degree | | Status | Total |
|---|
| | | Not Placed | Placed | |
| Mkt&Fin | Count | 95 | 25 | 120 |
| Expected | 82.60 (p = 1.86) | 37.40 (p = 4.11) | 59 |
| Mkt&HR | Count | 53 | 42 | 95 |
| Expected | 65.40 (p = 2.35) | 29.60 (p = 5.19) | 59 |
| Total | Count | 148 | 67 | 215 |
| Expected | 148 | 67 | 215 |
Table 10.
Degree Status cross-tabulation.
Table 10.
Degree Status cross-tabulation.
| Degree | | Status | Total |
|---|
| | | Not Placed | Placed | |
| Comm&Mgmt | Count | 43 | 102 | 145 |
| Expected | 45.19 (p = 0.11) | 99.81 (p = 0.05) | 120 |
| Others | Count | 6 | 5 | 11 |
| Expected | 3.43 (p = 1.93) | 7.57 (0.87) | 11 |
| Sci&Tech | Count | 18 | 41 | 59 |
| Expected | 18.39 (p = 0.01) | 40.61 (p = 0.00) | 59 |
| Total | Count | 67 | 148 | 215 |
| Expected | 67 | 148 | 215 |
Table 11.
Performance Measures of Placement status Models.
Table 11.
Performance Measures of Placement status Models.
| Algorithm | Parameter | Accuracy | Precision | Sensitivity | F1 |
|---|
| RF | Criterion = “gini”, MaxFeatures = 7, MinSampleLeaf = 2,
n_estimators = 50 | 88% | 87% | 90% | 88% |
| XGB | gamma = 0, LearningRate = 0.1, MaxDeltaStep = 2, MaxDepth = 6,
MinChildWeight = 4, n_estimators = 200, RegAlpha = 0,
RegLambda = 8 | 82% | 85% | 79% | 78% |
| GB | LearningRate = 0.2, MaxDepth = 5, Loss = “deviance” | 80% | 85% | 76% | 80% |
| SVM | C = 0.01, degree = 3, gamma = “auto”, kernel = “linear” | 90% | 85% | 92% | 88% |
| LR | Solver = “lbfs”, ClassWeight = “balanced” | 88% | 84% | 88% | 86% |
Table 12.
Performance Measures of Placement Gender Models.
Table 12.
Performance Measures of Placement Gender Models.
| Algorithm | Parameter | Accuracy | Precision | Sensitivity | F1 |
|---|
| RF | Criterion = “gini”, MaxFeatures = 7, MinSampleLeaf = 2,
n_estimators = 50 | 88% | 87% | 90% | 88% |
| XGB | gamma = 0, LearningRate = 0.1, MaxDeltaStep = 2, MaxDepth = 6,
MinChildWeight = 4, n_estimators = 200, RegAlpha = 0,
RegLambda = 8 | 82% | 85% | 79% | 78% |
| GB | LearningRate = 0.2, MaxDepth = 5, Loss = “deviance” | 80% | 85% | 76% | 80% |
| Publisher’s Note: MDPI stays neutral with regard to jurisdictional claims in published maps and institutional affiliations. |
© 2021 by the authors. Licensee MDPI, Basel, Switzerland. This article is an open access article distributed under the terms and conditions of the Creative Commons Attribution (CC BY) license (https://creativecommons.org/licenses/by/4.0/).


 ,
, 


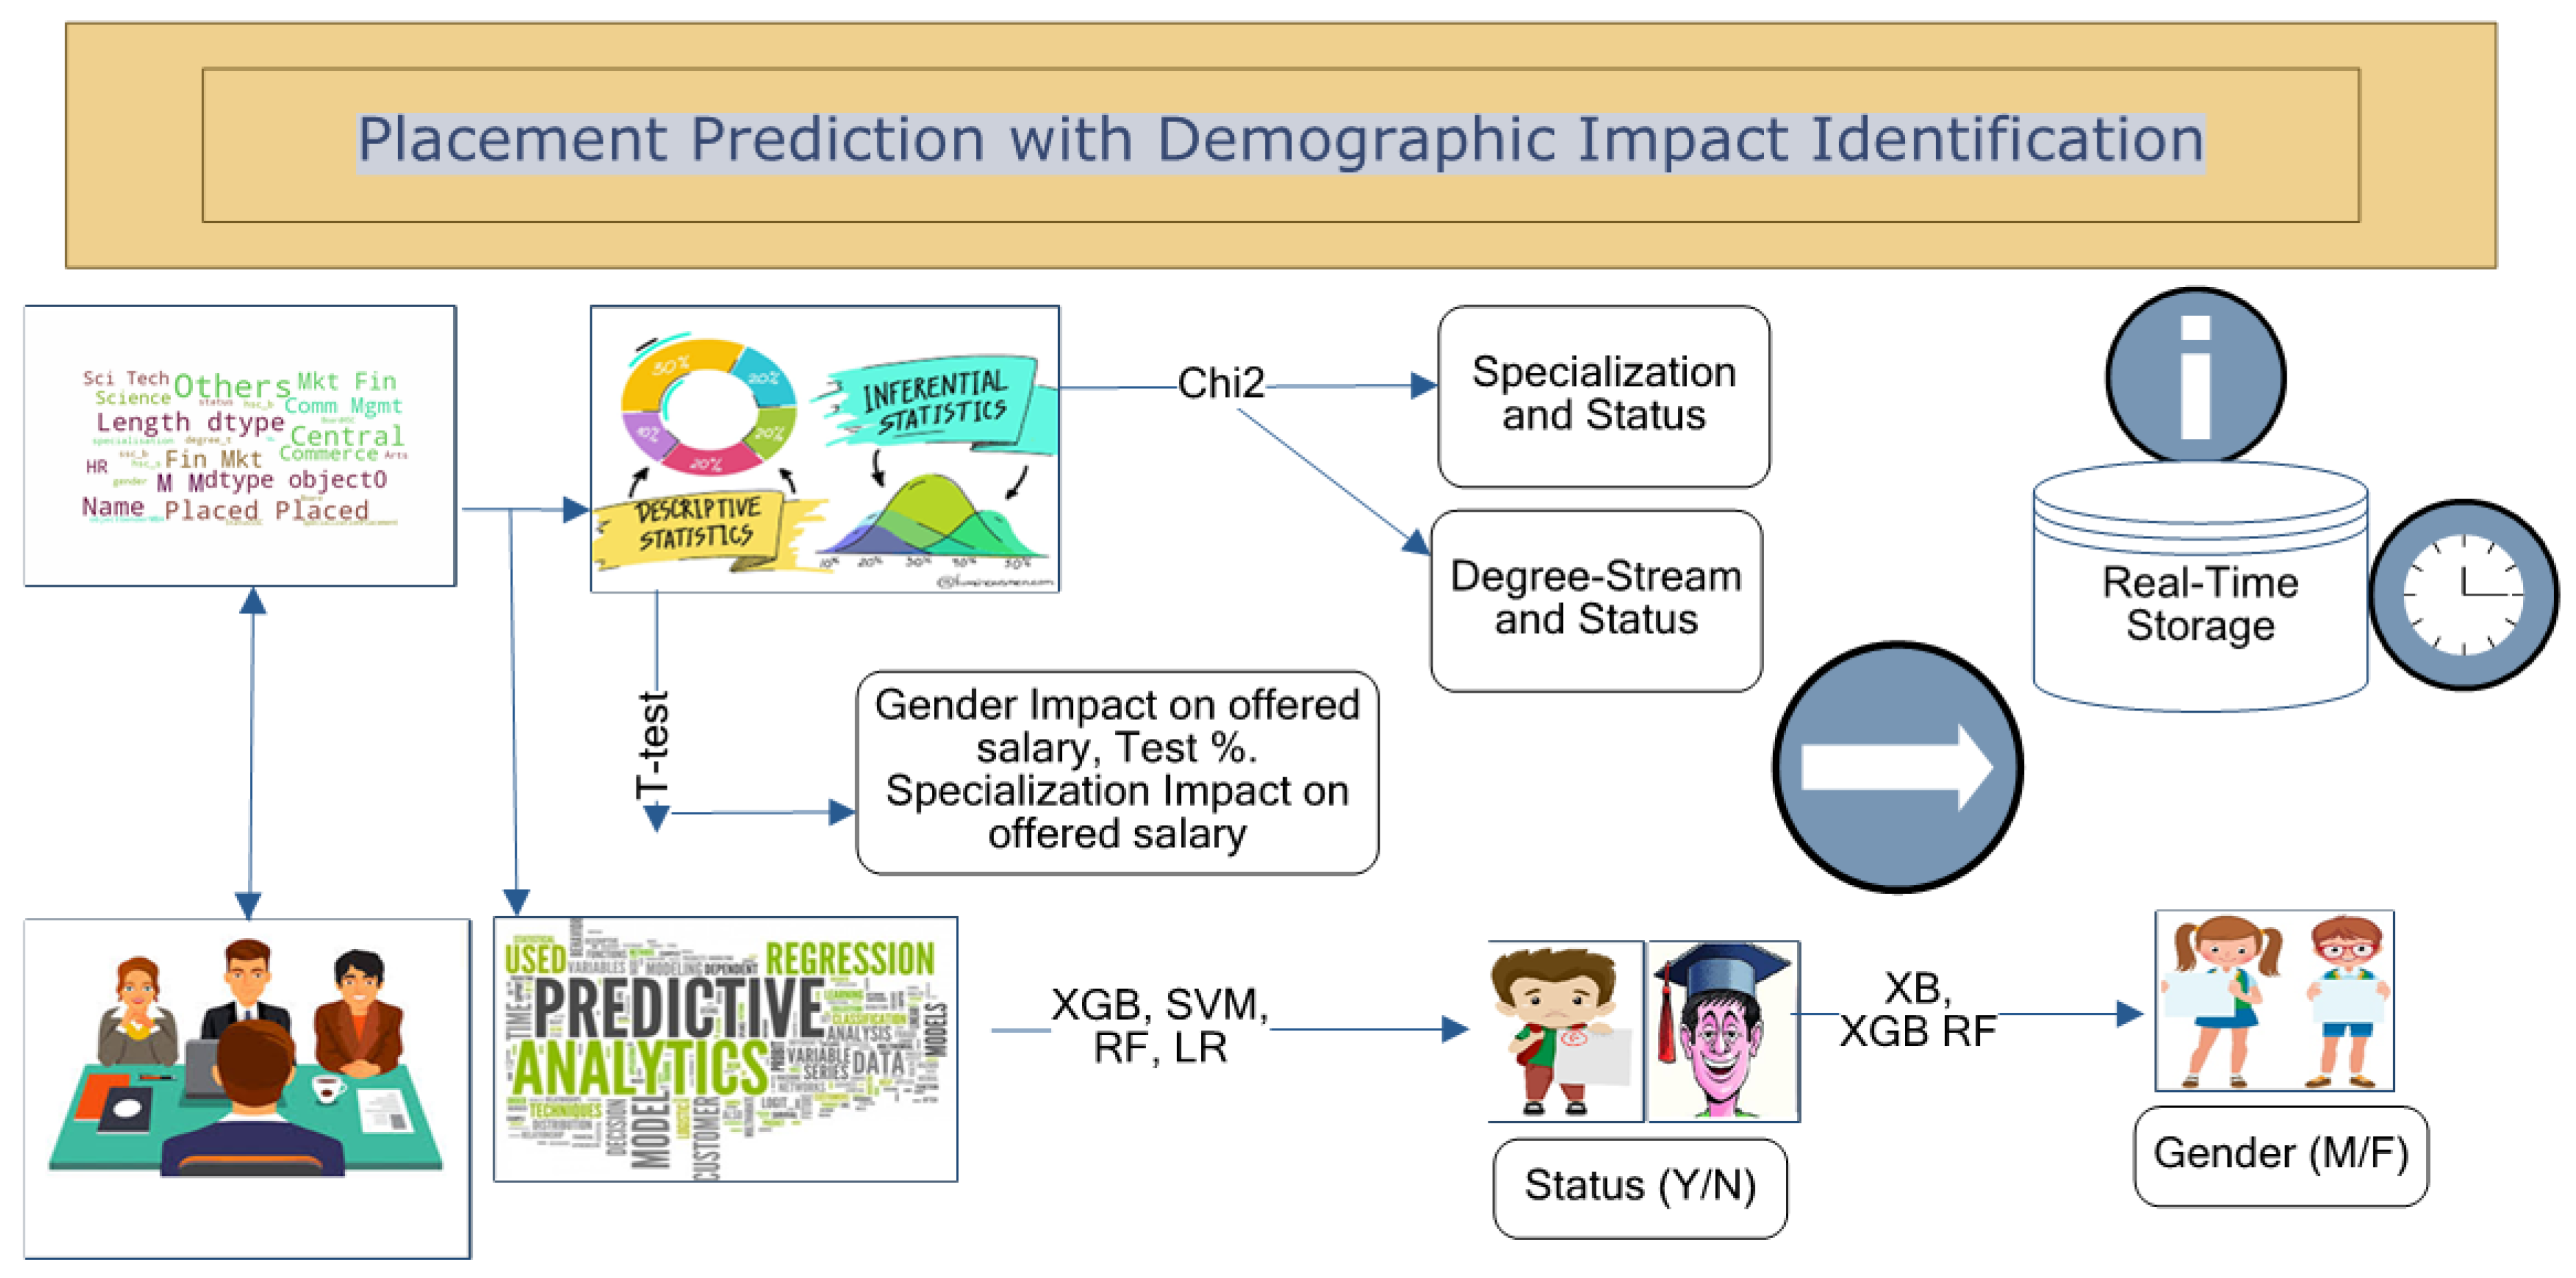
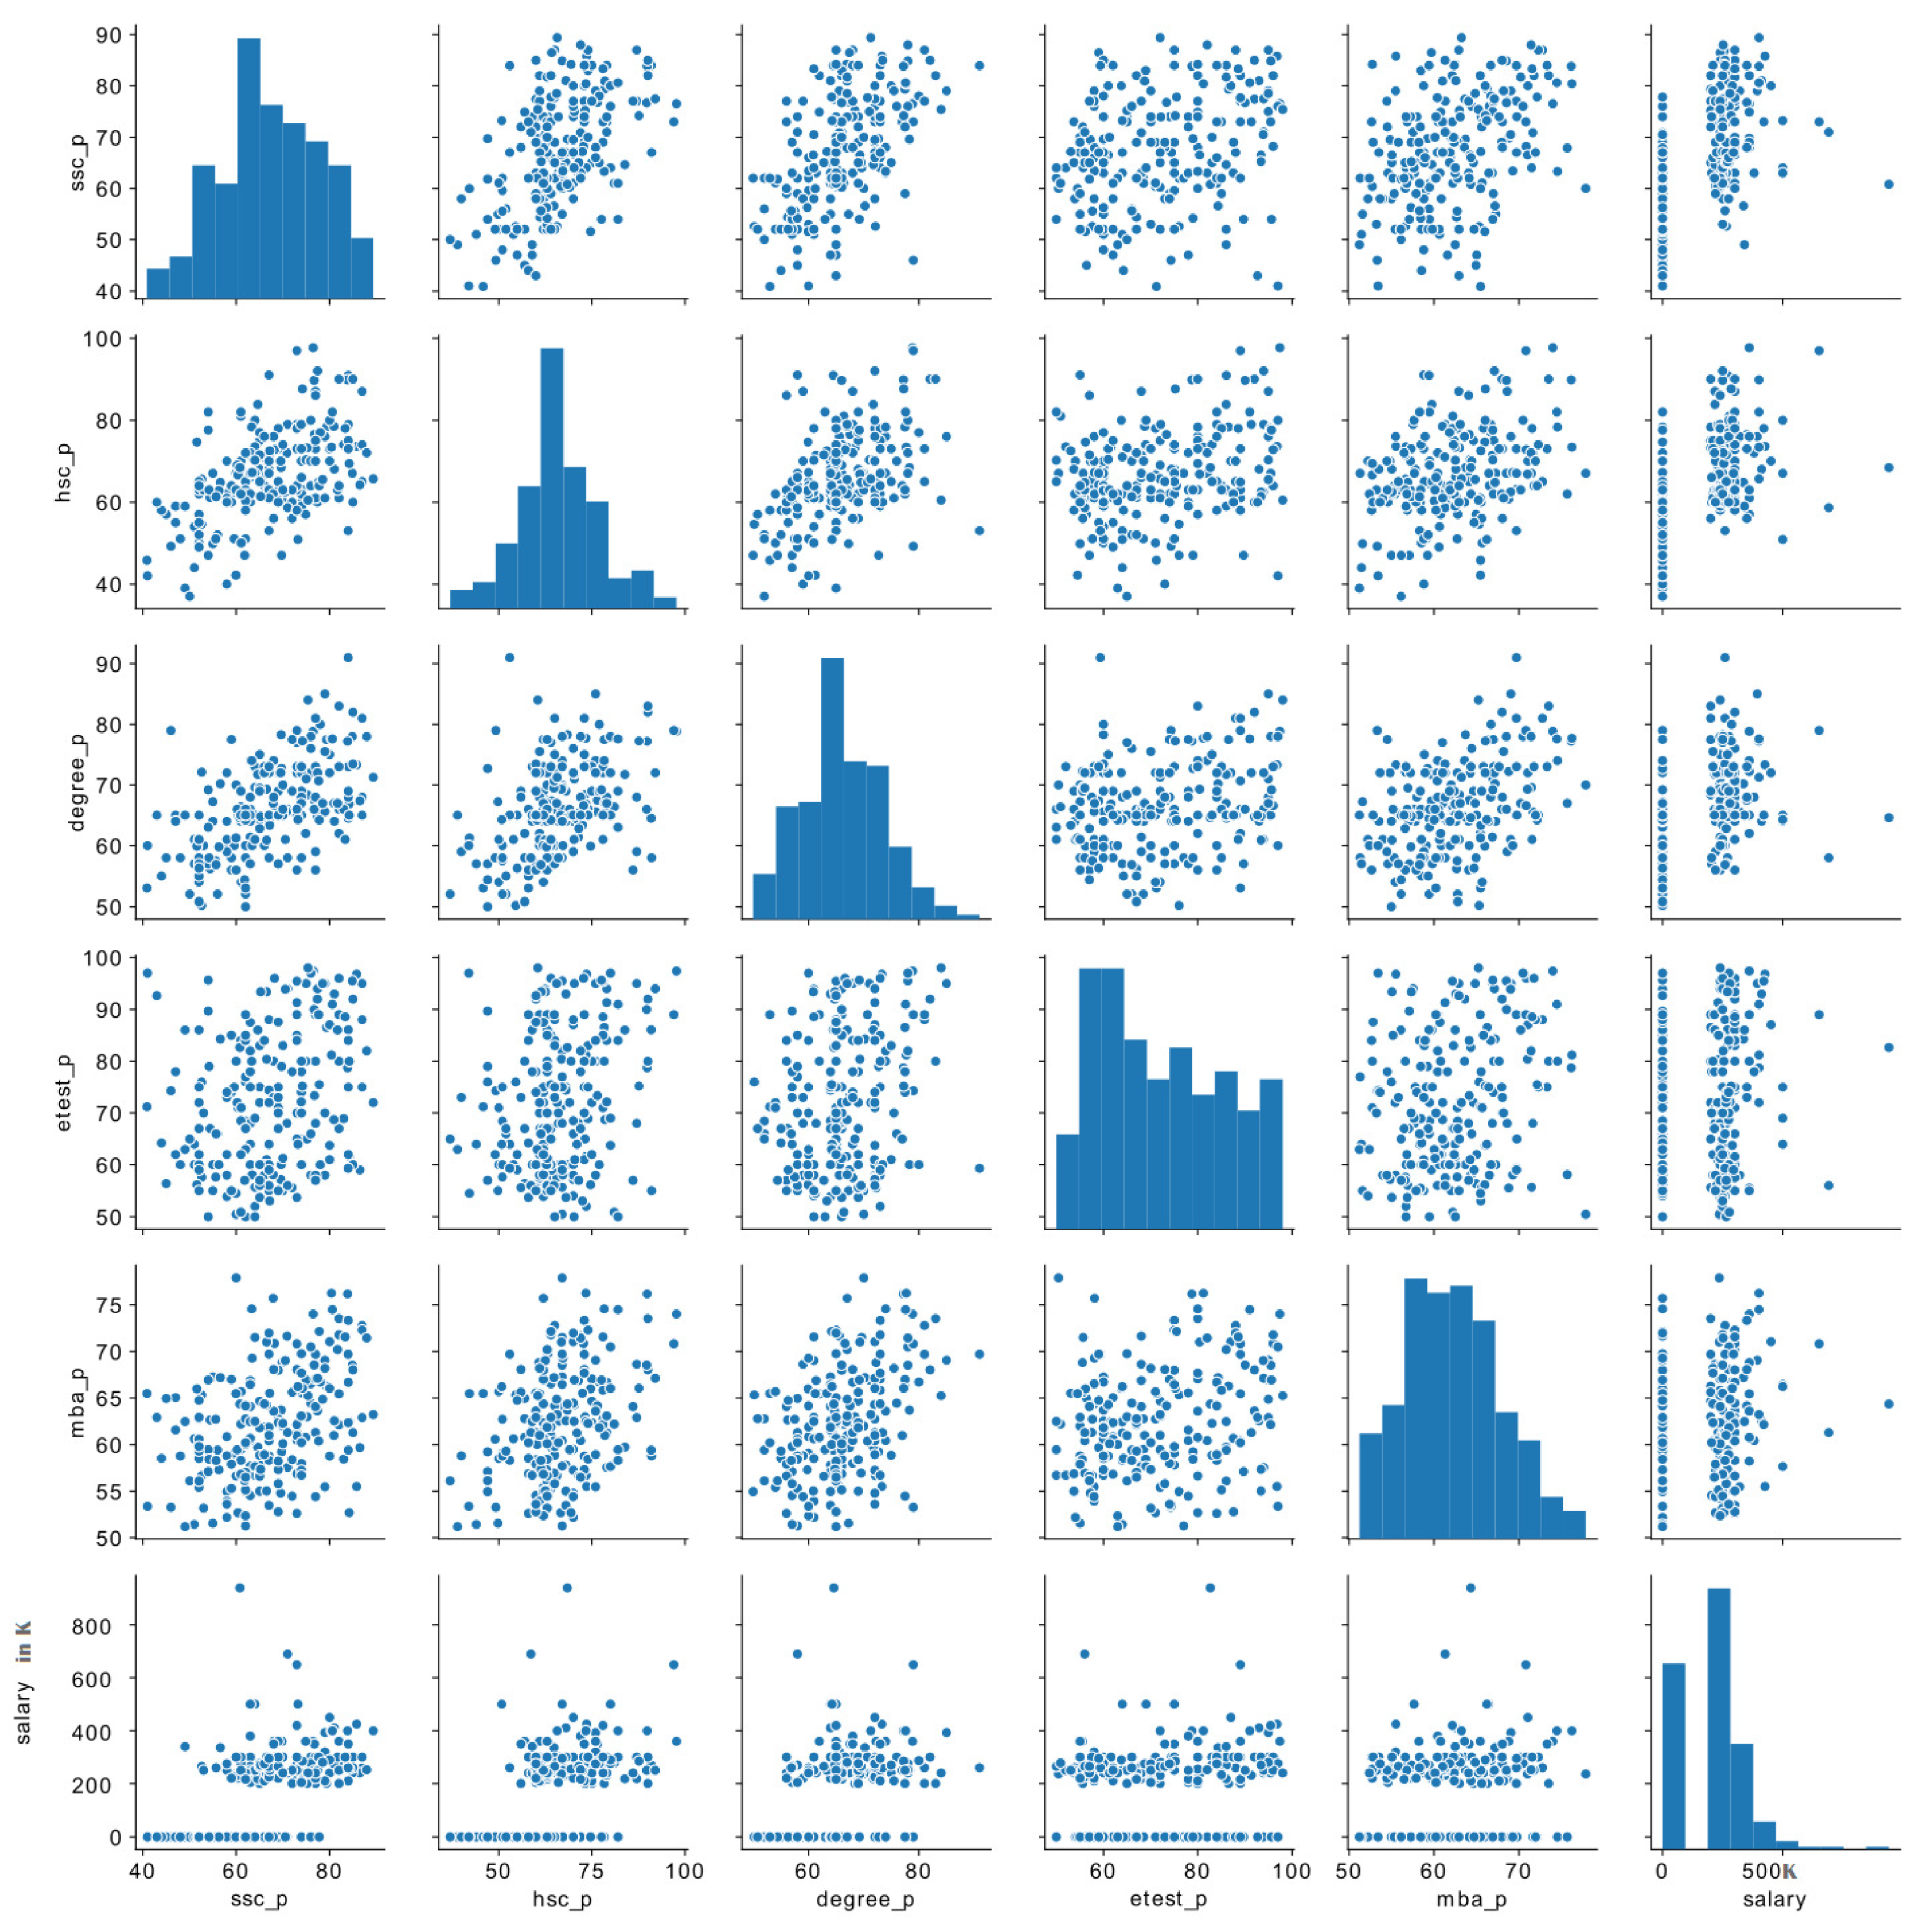
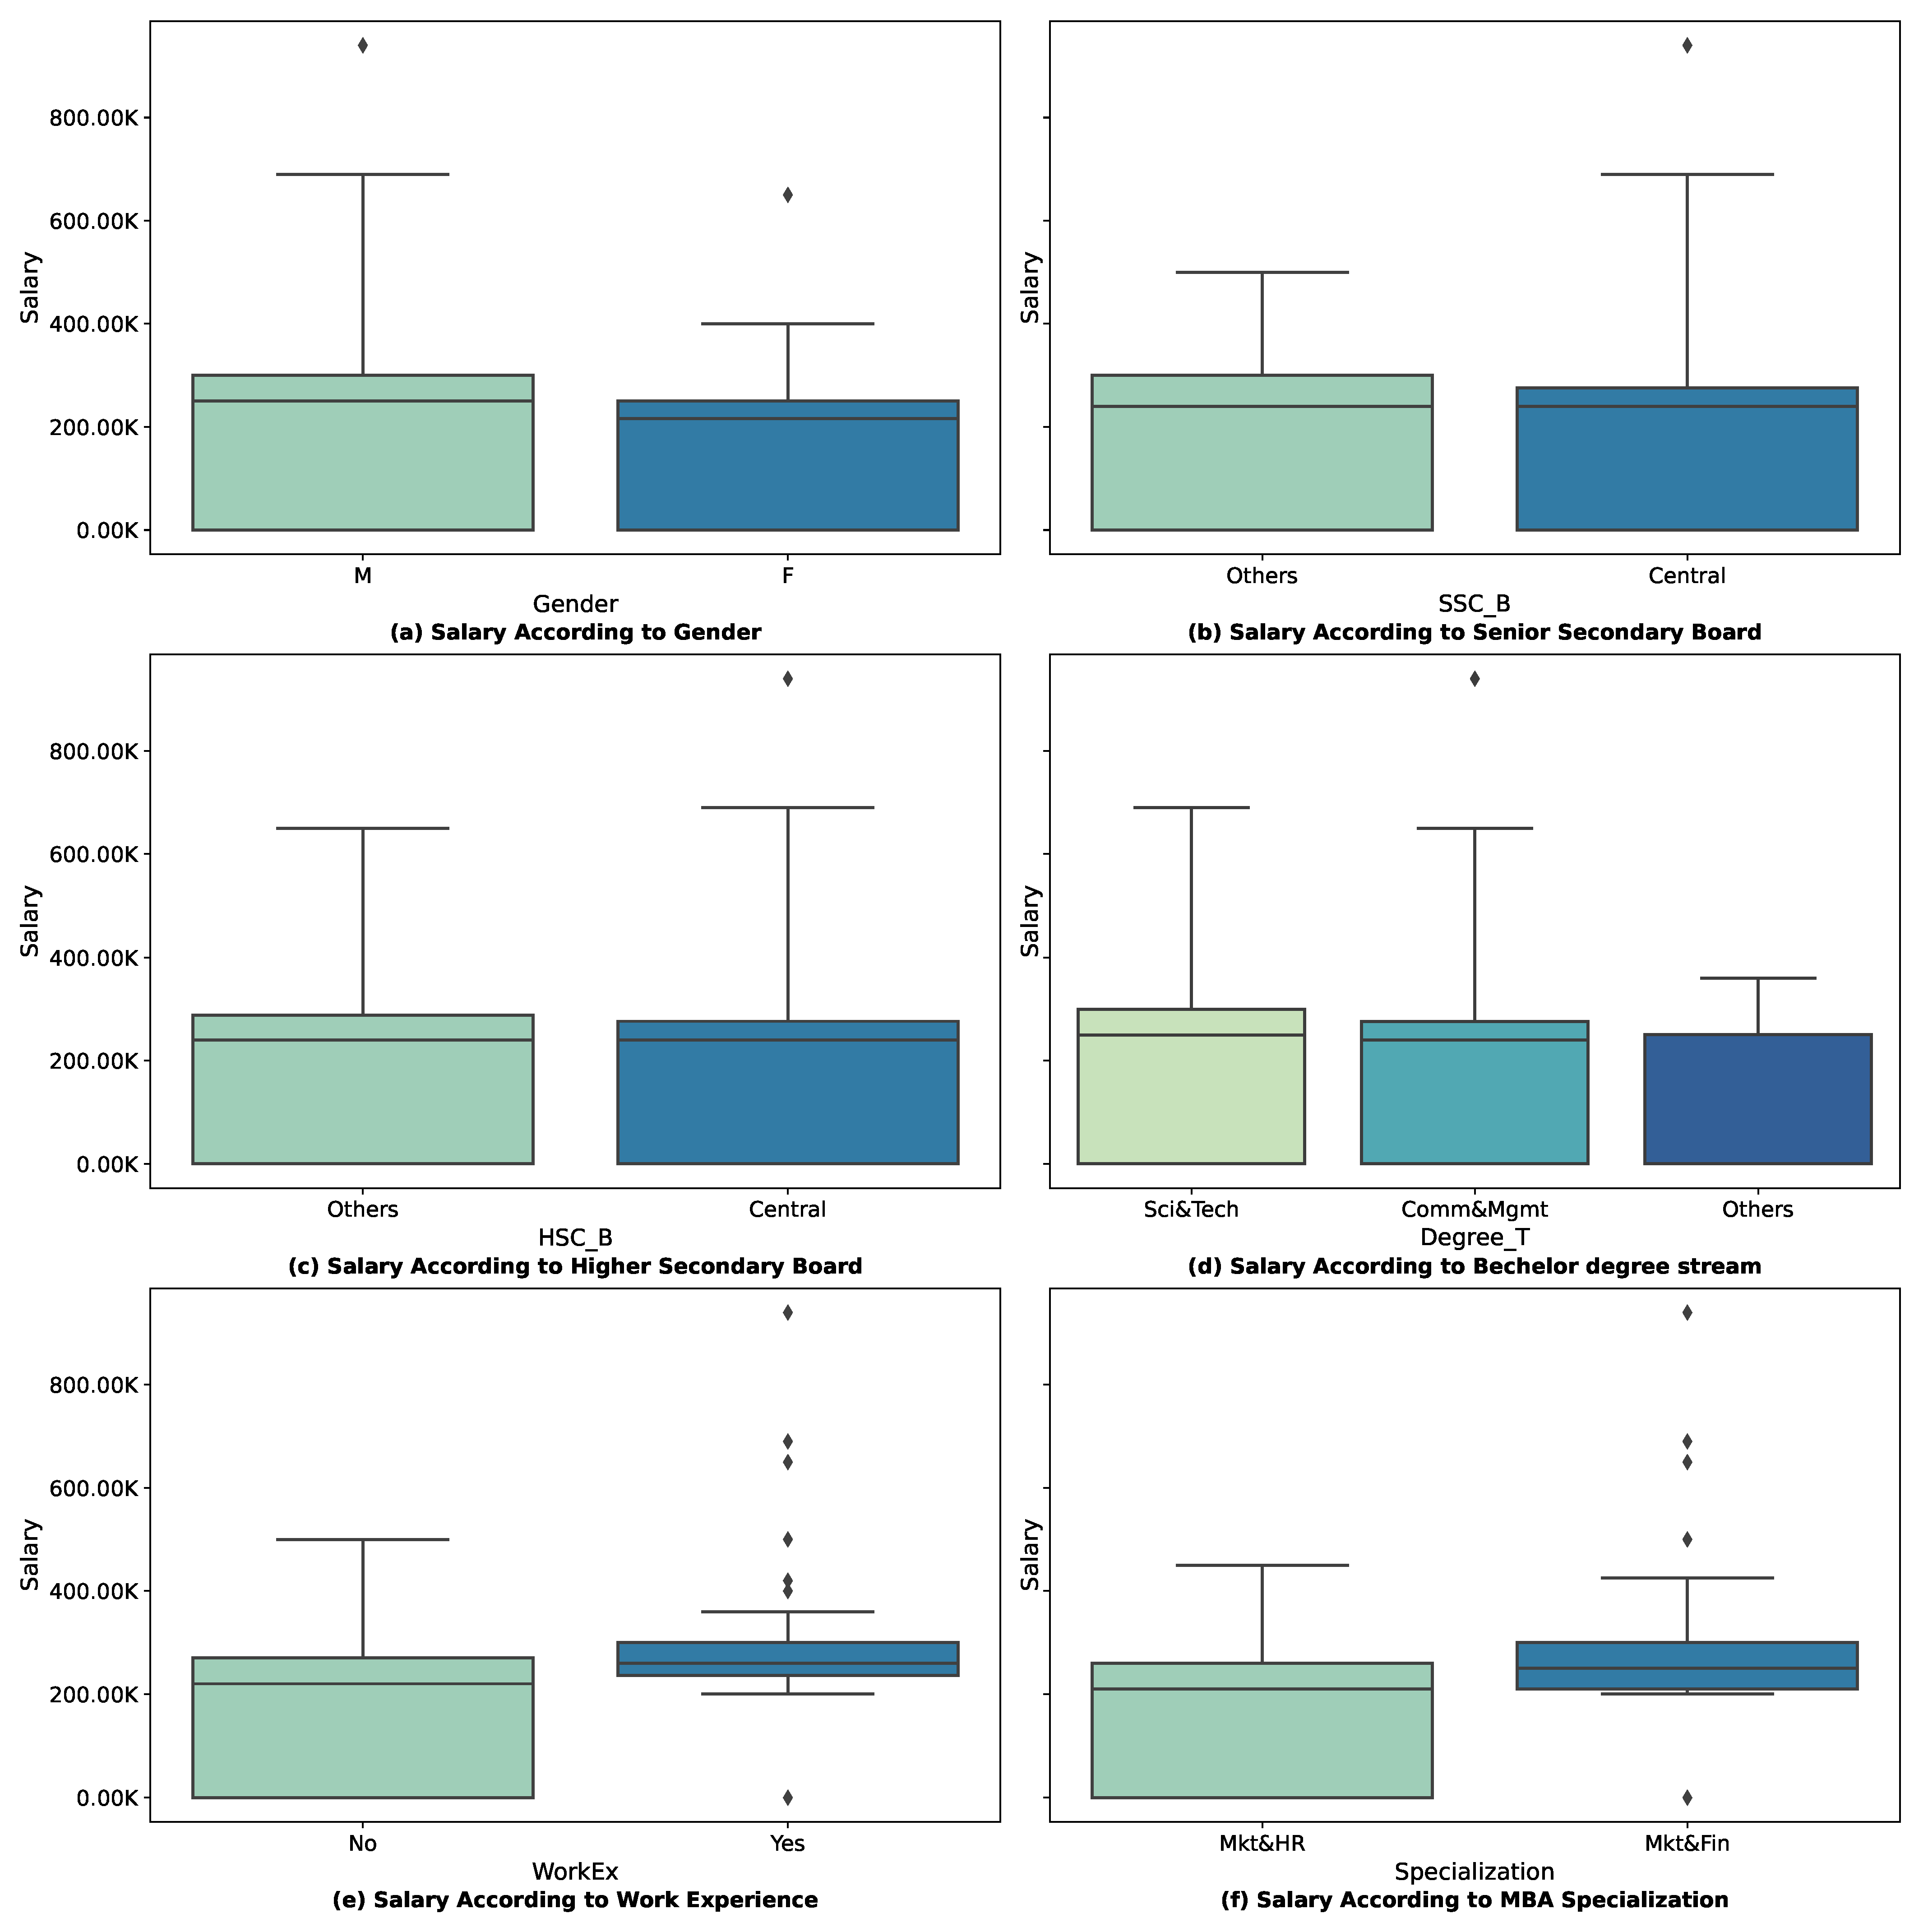
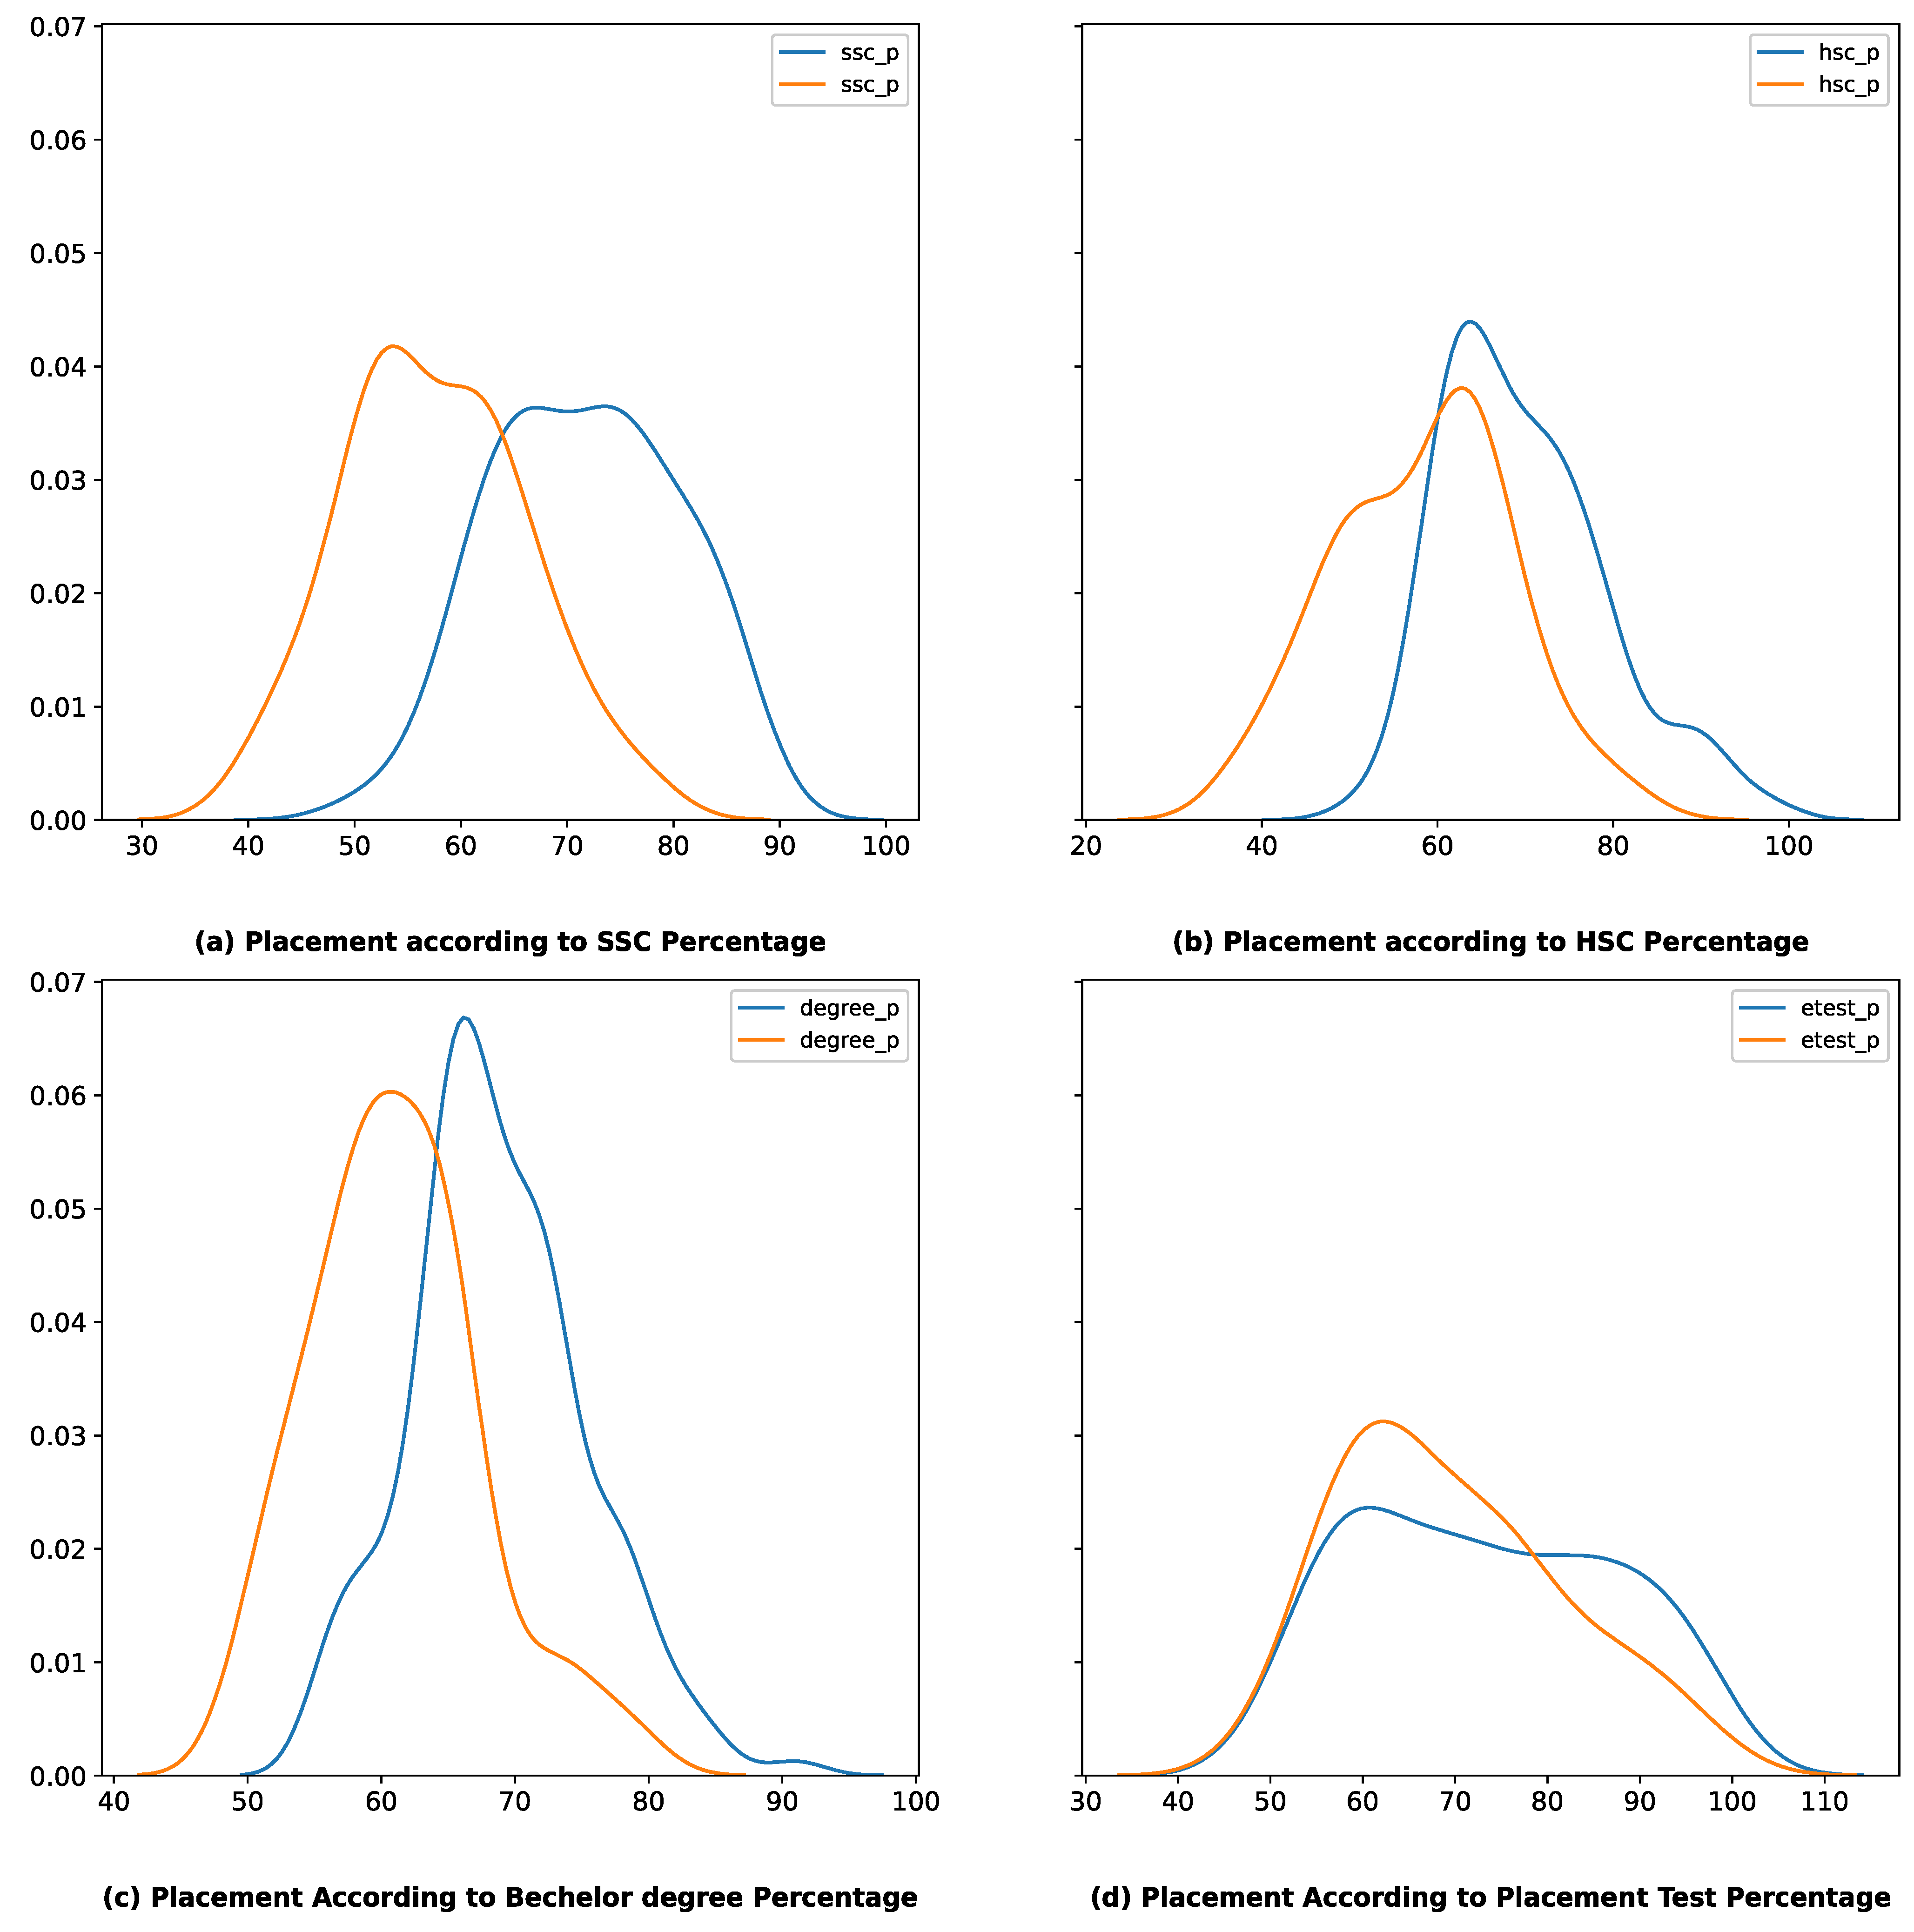
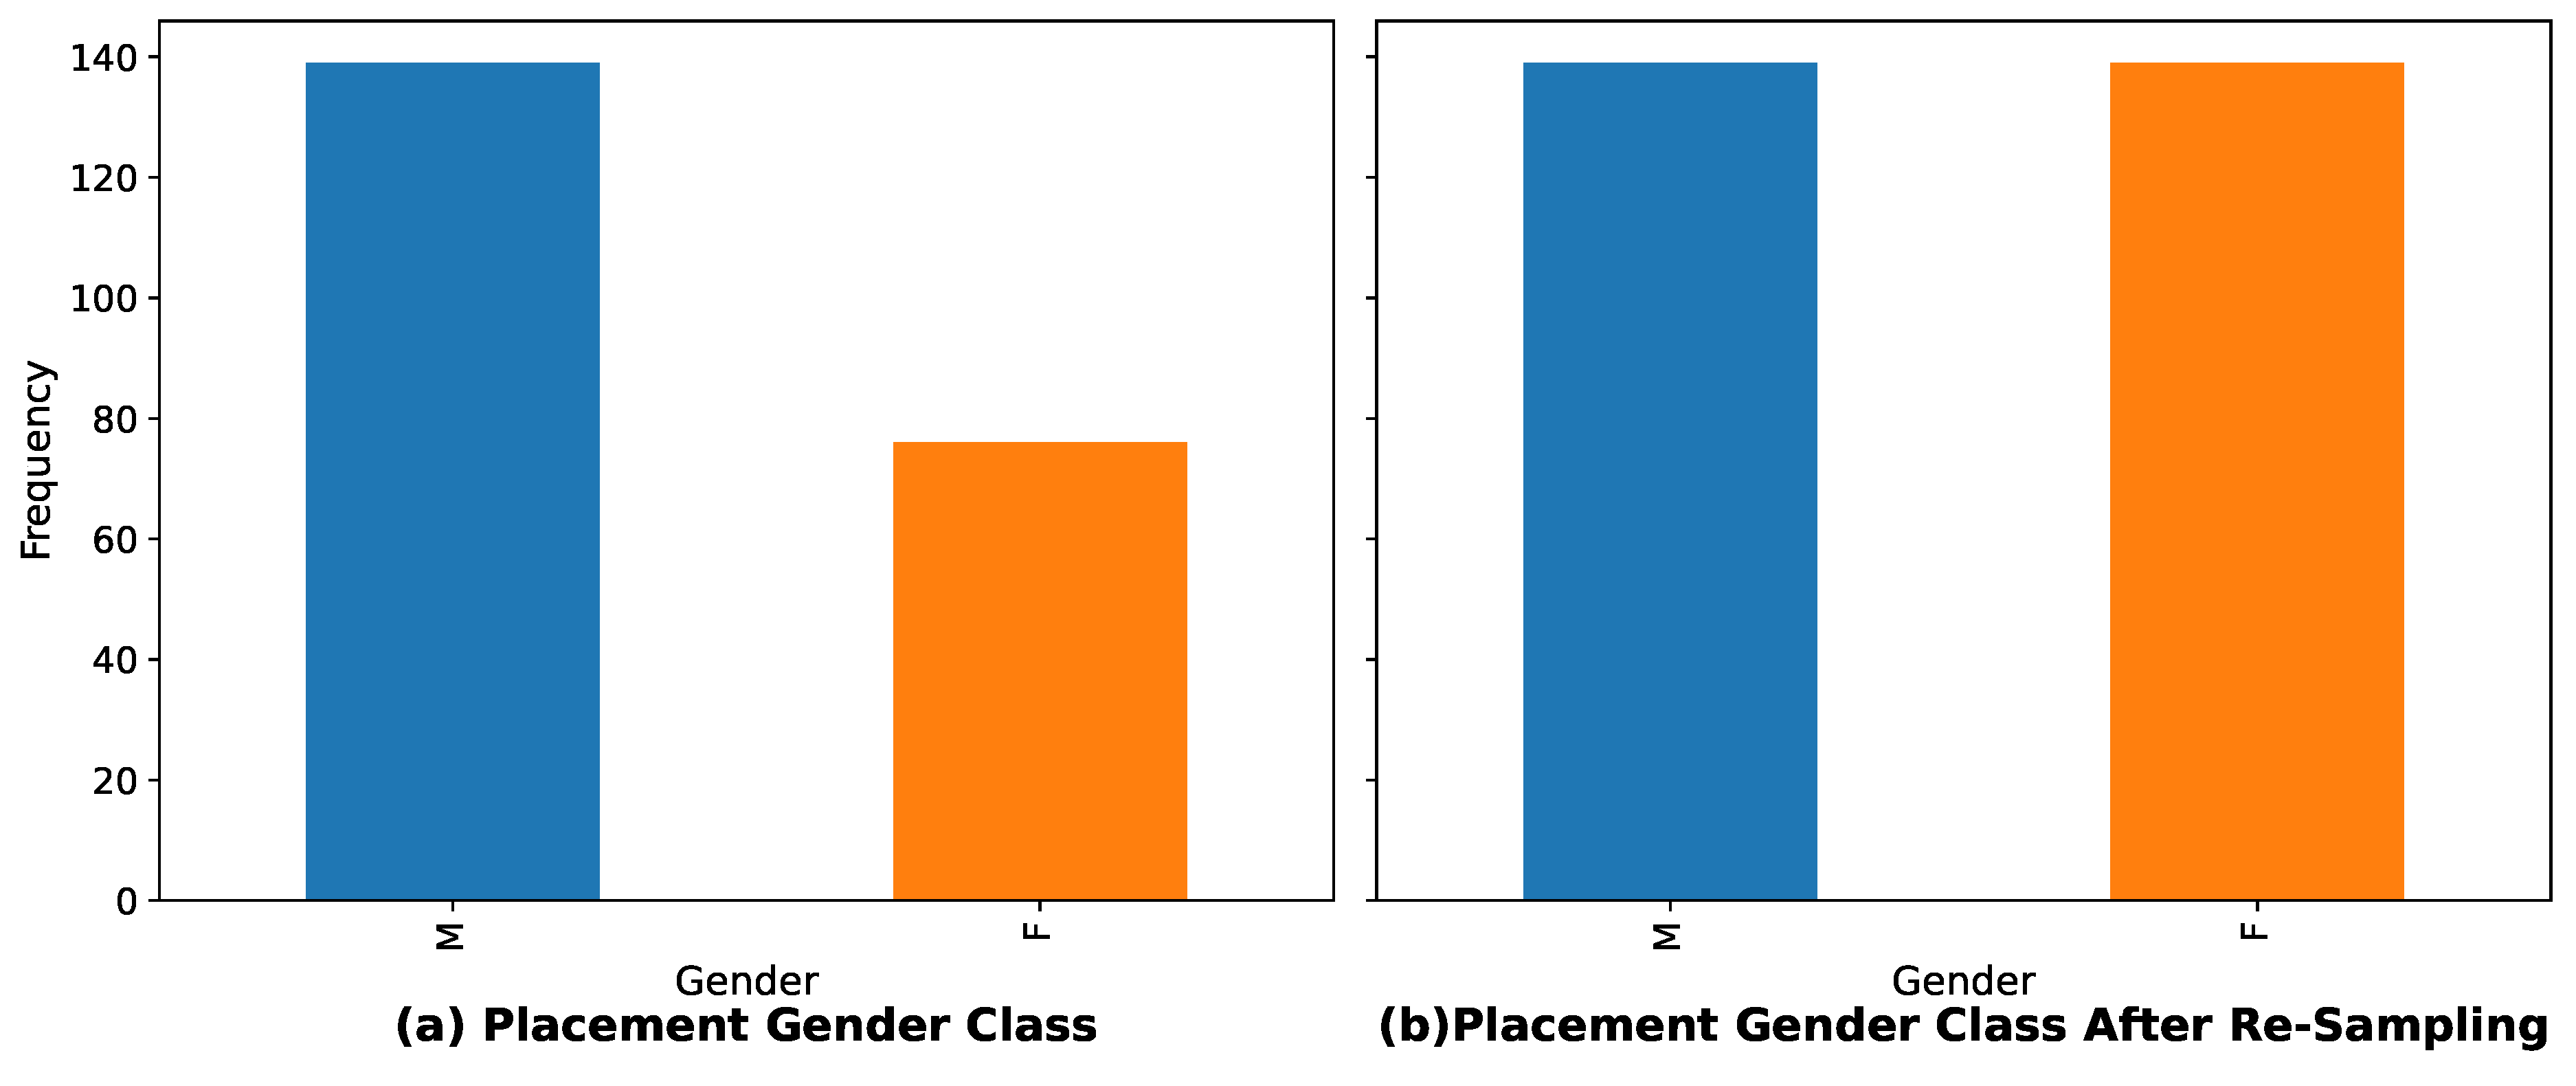
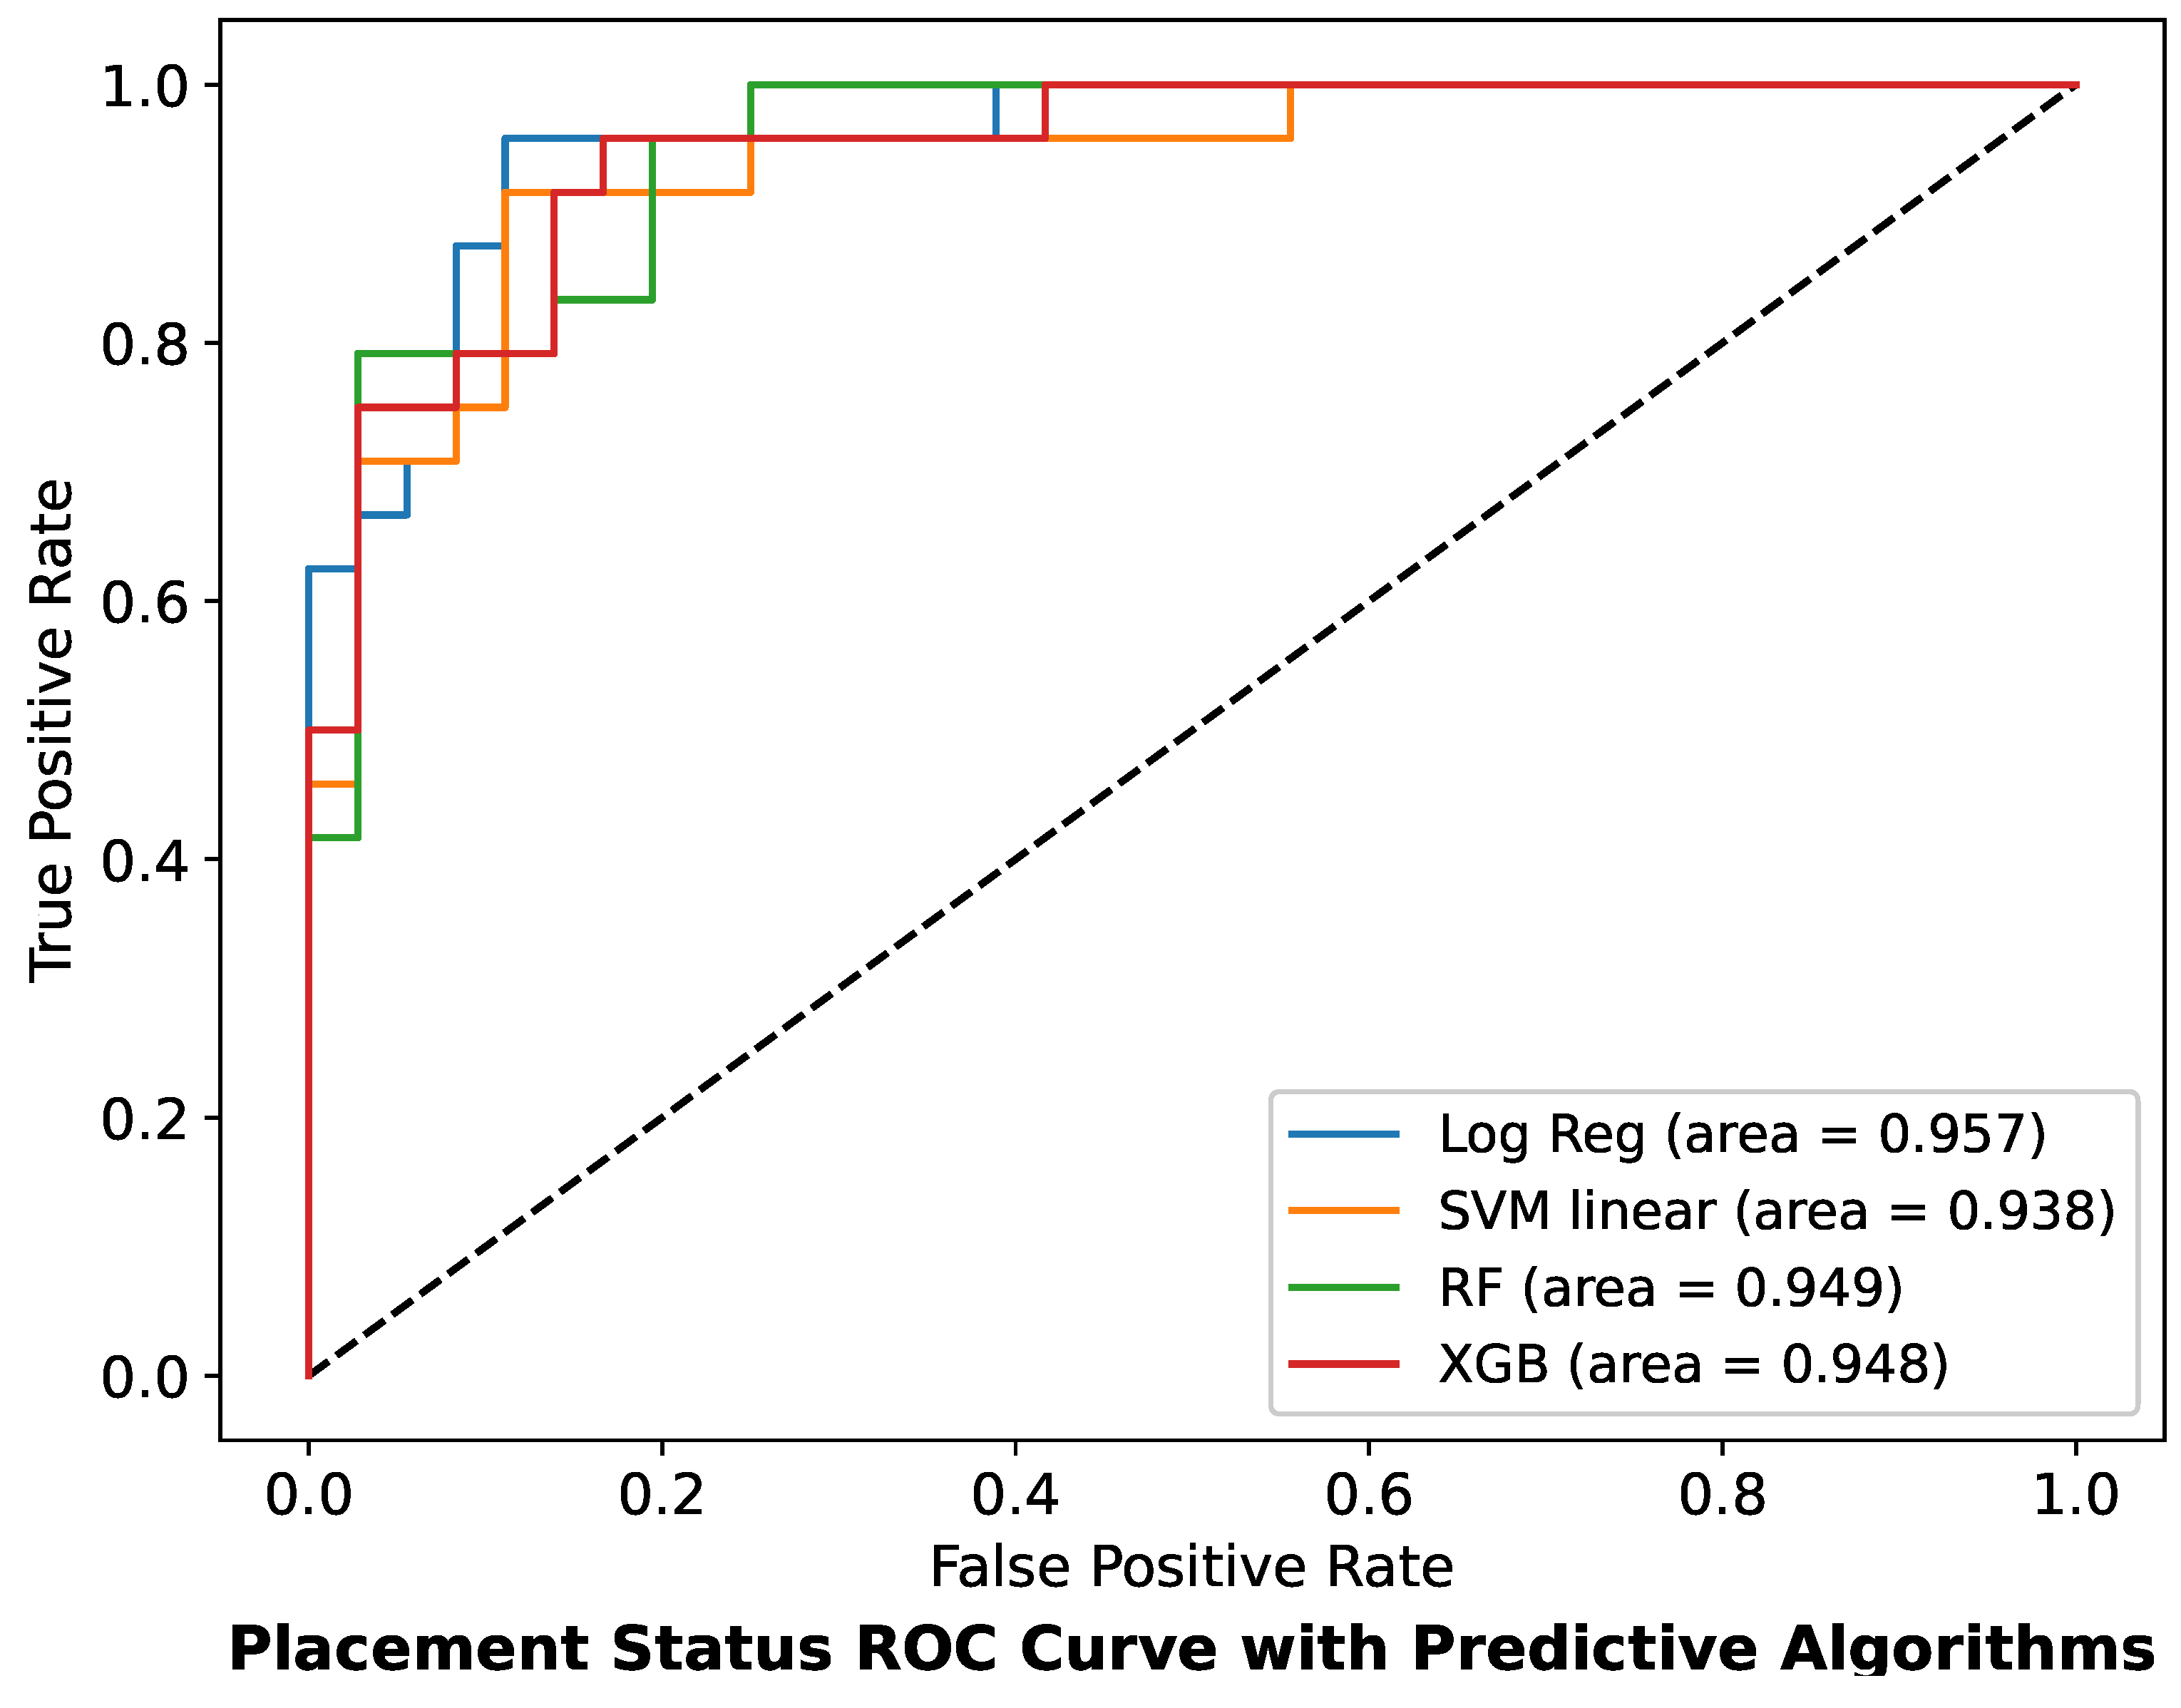
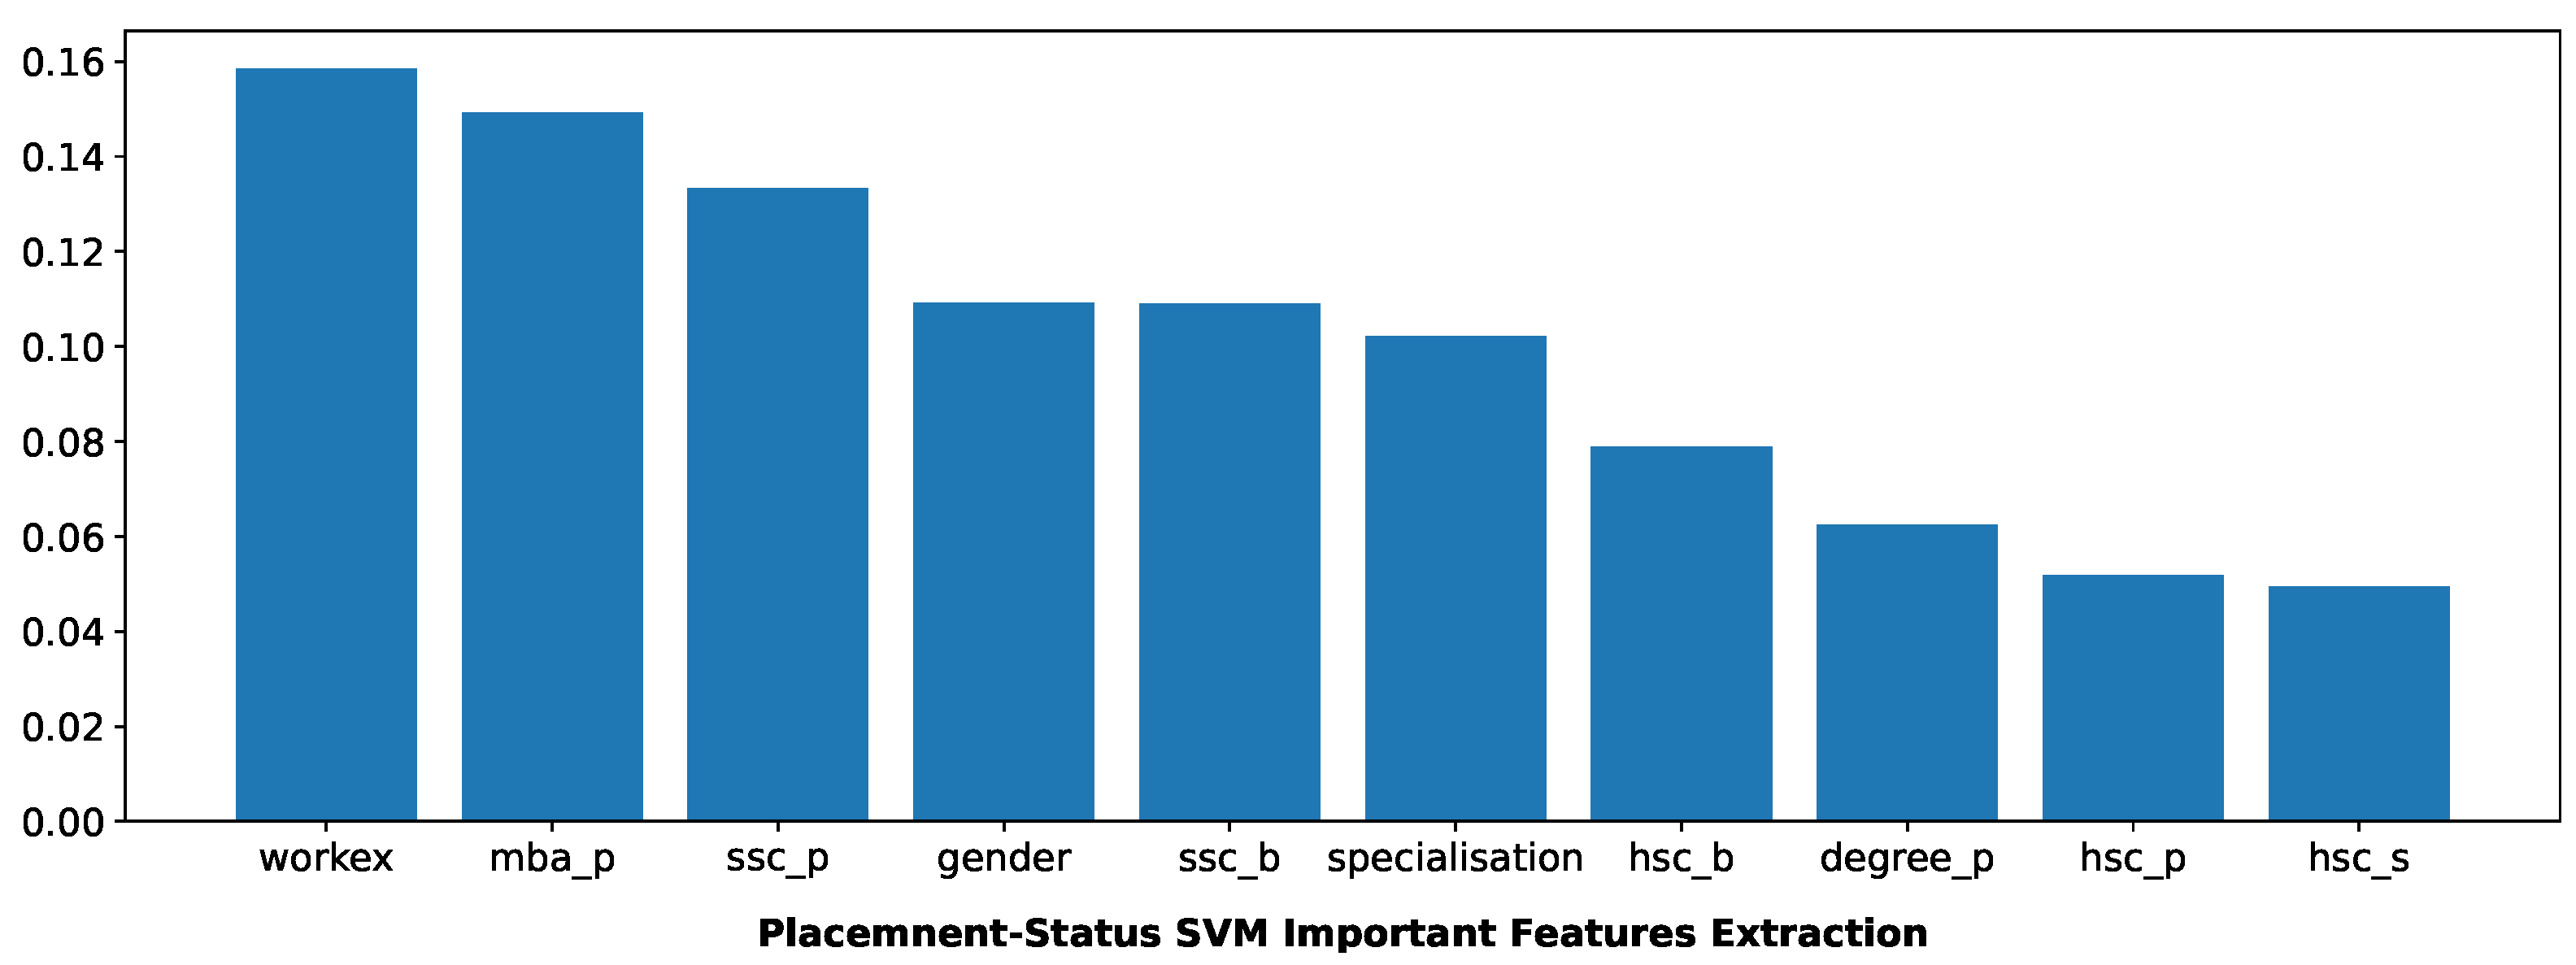