Article

A Wavelet-Based Method for the Impact of Social Media on the Economic Situation: The Saudi Arabia 2030-Vision Case

by
Majed S. Balalaa
1,
Anouar Ben Mabrouk
2,3,4,* and
Habiba Abdessalem
5
1
Deanship of Public Relations and Media, University of Tabuk, Tabuk 47512, Saudi Arabia
2
Department of Mathematics, Faculty of Science, University of Tabuk, Tabuk 47512, Saudi Arabia
3
Department of Mathematics, Higher Institute of Applied Mathematics and Computer Science, University of Kairouan, Kairouan 3100, Tunisia
4
Laboratory of Algebra, Number Theory and Nonlinear Analysis, LR18ES15, Department of Mathematics, Faculty of Sciences, University of Monastir, Monastir 5019, Tunisia
5
Department of Quantitative Methods, Faculty of Economic Sciences and Management, University of Sousse, Sousse 4023, Tunisia
*
Author to whom correspondence should be addressed.
Mathematics 2021, 9(10), 1117; https://doi.org/10.3390/math9101117
Submission received: 1 March 2021 / Revised: 7 May 2021 / Accepted: 7 May 2021 / Published: 14 May 2021
(This article belongs to the Section Financial Mathematics)

Abstract

:
In the present paper, a wavelet method is proposed to study the impact of electronic media on economic situation. More precisely, wavelet techniques are applied versus classical methods to analyze economic indices in the market. The technique consists firstly of filtering the data from unprecise circumstances (noise) to construct next a wavelet denoised contingency table. Next, a thresholding procedure is applied to such a table to extract the essential information porters. The resulting table subject finally to correspondence analysis before and after thresholding. As a case of study, the KSA 2030-vision is considered in the empirical part based on electronic and social media. Effects of the electronic media texts about the trading 2030 vision on the Saudi and global economy has been studied. Recall that the Saudi market is the most important representative market in the GCC continent. It has both regional and worldwide influence on economies and besides, it is characterized by many political, economic and financial movements such as the worldwide economic NEOM project. The findings provided in the present paper may be applied to predict the future situation of markets in GCC region and may constitute therefore a guide for investors to decide about investing or not in these markets.

1. Introduction and Motivation

A major problem in data analysis is the availability of abundant data, such as electronic textual news. Therefore, the analysis of such type of data is of great interest, and also extremely difficult because of many reasons. One main reason is the fact that electronic data is based in a great part on social media such as Facebook, Twitter, Instagram, etc. In such media, the control of the exactitude of news is extremely difficult. Besides, there is no rigorous analysis done on this news to extract the reality from fuzzy and/or false news. Consequently, there are no reasonable interpretations and discussions. Although, the affects and influence of this type of data has shown to be extremely important in many cases such as political changes in many countries.
Textual analysis has been the object of several studies. Antweiler and Frank in [1] investigated financial textual data. Dershowitz et al. in [2] applied the textual analysis for religious studies. In [3], a textual analysis is applied for political sciences. In [4], it is applied for literature texts analyzing. In economics, however, it is noticed that textual analysis is not yet widely developed, except few cases such as [5,6].
In the literature, the most used techniques in textual analysis are based on the so-called multidimensional data analysis such as factorial and classification. Such methods have been shown to be efficient in visualization and classification aims in many cases. See [7].
The present paper focuses on the KSA 2030-vision and its circulation in electronic media, especially Twitter. A type of advanced mathematical analysis will be applied such as wavelet theory to study the impact of Twitter trading 2030-vision on the Saudi and global economy. Recall in particular that Saudi Arabia has established 2030-projects that have a direct impact on the national market and thus the national economy, and the rest of the Gulf and global markets and economies, especially “Neom” project, which will have a profound impact on the movement of markets and economies.
The KSA 2030-vision is an ambitious economic and social reform plan launched by the crown prince Mohammad Bin Salman in April 2016. This plan is elaborated as a response to the budgetary difficulties faced by the Saudi Arabia after the sharp decrease of oil prices in 2014. Its main goal is to reduce the oil dependency, diversify Saudi Arabia economic resources and develop public service sectors like education, health, infrastructure, entertainment and tourism. This program is based particularly on the development of the private sector, the attraction of foreign investors, the reduction of the unemployment rate and the reconsideration of Saudi women status. The vision includes also plans related to the development of renewable energies, the mining sector and the production of natural gaz.
The KSA 2030-vision is structured around 13 operational programs: quality of life, national companies’ promotion, Saudi character enrichment, housing, human capital development, public investment fund, financial sector development, national transformation, hajj and umrah, fiscal balance, national industrial development and logistics, strategic partnerships and privatization. These programs represent the vision realization system. They include plans that improve the life quality of residents, strengthen the national identity and Islamic values, provide more employment opportunities, support culture, entertainment and arts. One of the vision biggest plans is the “NEOM” project, a megacity including futuristic buildings, flying taxis, robot dinosaurs, etc.
Our main aim here is to predict the economic situation in KSA by means of the information circulating in social and electronic media on the vision 2030. This choice is motivated and justified by the fact that KSA market is the most important representative market in GCC continent. It has both regional and worldwide influence on economies and besides, it is characterized by many political, economic and financial movements such as the worldwide economic NEOM project. Recall in particular, that the Kingdom of Saudi Arabia has established vision-2030-related projects that have a direct impact on the national market and the rest of the Arab Gulf and international markets such as Aramco subscription, and particularly NEOM project, which will have a profound impact on the market. This makes it of interest to study such market and understand its complexities. The last year is also characterized by the appearance of the pandemic COVID-19 that has been spread worldwide. GCC continent and especially KSA is related to all the world because of their geographical position and their strong effect on the worldwide economies as biggest petroleum regions. Besides, they gather the largest workers’ number. The Muslim saint cities in KSA are also the largest meetings of persons each year. These may be a strong cause of dispersion of viruses, which may be next transferred to other countries.
In the present work, the method consists in applying wavelet theory essentially at the step of denoising the contingency table (seen as an image) [8]. Indeed, classical textual analysis suffers from one main disadvantage due to noised results and especially contingency matrices. Sometimes, retaining only the higher frequency forms (whose frequency is greater than to some threshold) leads to a partial lexical table, which may not describe accurately the reality, especially when such forms constitute together a big part of the information. Besides, contingency tables may also be aggregated due to crossing different graphic forms of the lexicon with a set of variables fixed in advance. This makes the application of statistical methods in such cases resulting in non-accurate analysis of the relationship between the variables and the textual data. Wavelet methods, mainly wavelet thresholding, are adapted to overcome these problems without deleting a big piece of the information. The contingency table will be decomposed due to the application of wavelet analysis into components. The first component reflects the global shape of the image, and other components containing the noise. The application of the wavelet denoising method based on the thresholding permits to avoid this noise. The thresholding consists to remove the small coefficients, which are typically noisy without affecting the image quality. Next, the denoised or thresholded contingency table is reconstructed by using an inverse wavelet transform. As the denoised tables are obtained, the results are subject of correspondence analysis [9,10] before and after thresholding. The efficiency of the proposed method is evaluated on correspondence analysis and classification results using Kohonen maps [11].
The findings provided in the present paper may be applied to predict the future situation of markets in GCC continent, and may constitute therefore a guide for investors to decide about investing or not in these markets. Moreover, wavelet theory as a mathematical tool is recently introduced in the field of finance and proved its performance compared to classical tools. In the field of textual analysis, in our knowledge, the present work is a first application of such a method, among [8] and [6]. In [8], the subject was about economic applications similar to the present work, and in [6] the application has dealt with information processing. In the present work, one aim is to continue to prove the efficiency and the performance of such a method by applying it to different type of media texts.
The proposed method lies in fact in a whole topic of representing textual data by means of time series, statistical series, signals and/or images. This will permit to apply sophisticated mathematical and statistical methods for different purposes such as filtering, denoising, extracting information, decrypting, modeling, etc. There are in the literature many similar studies and/or ideas using this conversion of textual data into numerical one to serve from mathematical tools such as wavelets. In [6], for example, a similar method has been applied for textual information. Biological series such as DNA and proteins are also types of textual and/or character data. Wavelets are applied in such concepts for the purpose of denoising, filtering and forecasting. Fischer et al. in [12] applied a wavelet denoising method to predict transmembrane proteins helices. Arfaoui et al. [13,14], Bin et al. [15,16] and Cattani et al. [17,18,19,20,21] conducted wavelet methods for the modeling, forecasting, complexity and symmetries in proteins and DNA series. Schleicher [22] conducted a fascinating study on the use of wavelet methods in econo-financial fields, such as filtering, thresholding, denoising, forecasting, etc. A prominent comparison with Fourier analysis has been highlighted in [22] showing the superiority of wavelet analysis against Fourier one. See also [23,24,25,26].
The rest of this paper will be as follows. Section 2 is concerned with a brief review of existing statistical methods for textual data analysis. In the next section, wavelet method is developed. Section 4 is devoted to the description of the data applied here. Section 5 is concerned with the discussion of the empirical results. Section 6 is a discussion section devoted to a comparison between wavelet analysis and Fourier, especially in relation to the present application of wavelets for textual data. Section 7 is a concluding part.

2. Textual Data Analysis

2.1. Existing Statistical Methods

The use of statistical methods for textual data analysis is called lexicometry [27]. This approach, known also by lexical analysis, allows a linguistic and/or statistical analysis of the texts in a given corpus. In the following table (Table 1), a comparison is conducted between two main categories of lexical methods including the quantitative analysis and the multidimensional descriptive analysis.

2.2. Multidimensional Methods: Correspondence Analysis and Classification

Correspondence analysis has been originally developed by Benzecri in [34] as a descriptive multivariate technique for analyzing contingency matrices by exploring the eventual links rows/columns (see also [29]). Since its appearance, correspondence analysis has been the object of many studies especially in data analysis applied in various research fields such as social sciences, financial data comprehension, management, etc.
One main strong point for correspondence analysis is its ability to simultaneously representing and explaining finitely many variables’ categories in some suitable spaces having low dimensions. However, such reduction of dimensionality may induce a loss of information. The joint plot graphical display obtained via a correspondence analysis permits the identification of relationships between rows variables, columns and cells according to the placement in shared spaces [9,10].
Besides, the application of correspondence analysis allows analyzing the similarity character in the contingency matrix cells by using the well-known Chi-square distances [34]. Such a distance is evaluated as a probability measure on the rows/columns of the contingency table by quotienting the frequency associated to the elements by the total frequency of the corresponding row/column. In Escofier [35], a geometrical representation has been developed for different modalities corresponding to the row/column’s variables. Besides, the eventual link point-to-point is explained by means of similarities.
In textual data, correspondence analysis is somehow recent and needs more developments. The literature is growing up just in the last decades. In such a direction, correspondence analysis is applied on lexical tables by tabulating the different corpus terms issued from the textual documents. The table explains the eventual correspondence between cells and the textual units’ occurrences such as repeated segments, terms and lemmas. In [36], the authors noticed that correspondence analysis may be also applied to study lexical words/documents relations graphically.
Besides, correspondence analysis is generally followed by classification methods in order to understand more the texts analyzed and to yield a simplified resume known in financial analysis as the map of different classes or sectors. The most known method is due to Kohonen map classification or self-organization map. This technique allows precisely the classification of the elements of the contingency table into rectangular/polygonal windows gathering clusters of similar data relatively to the similarity tests [28].

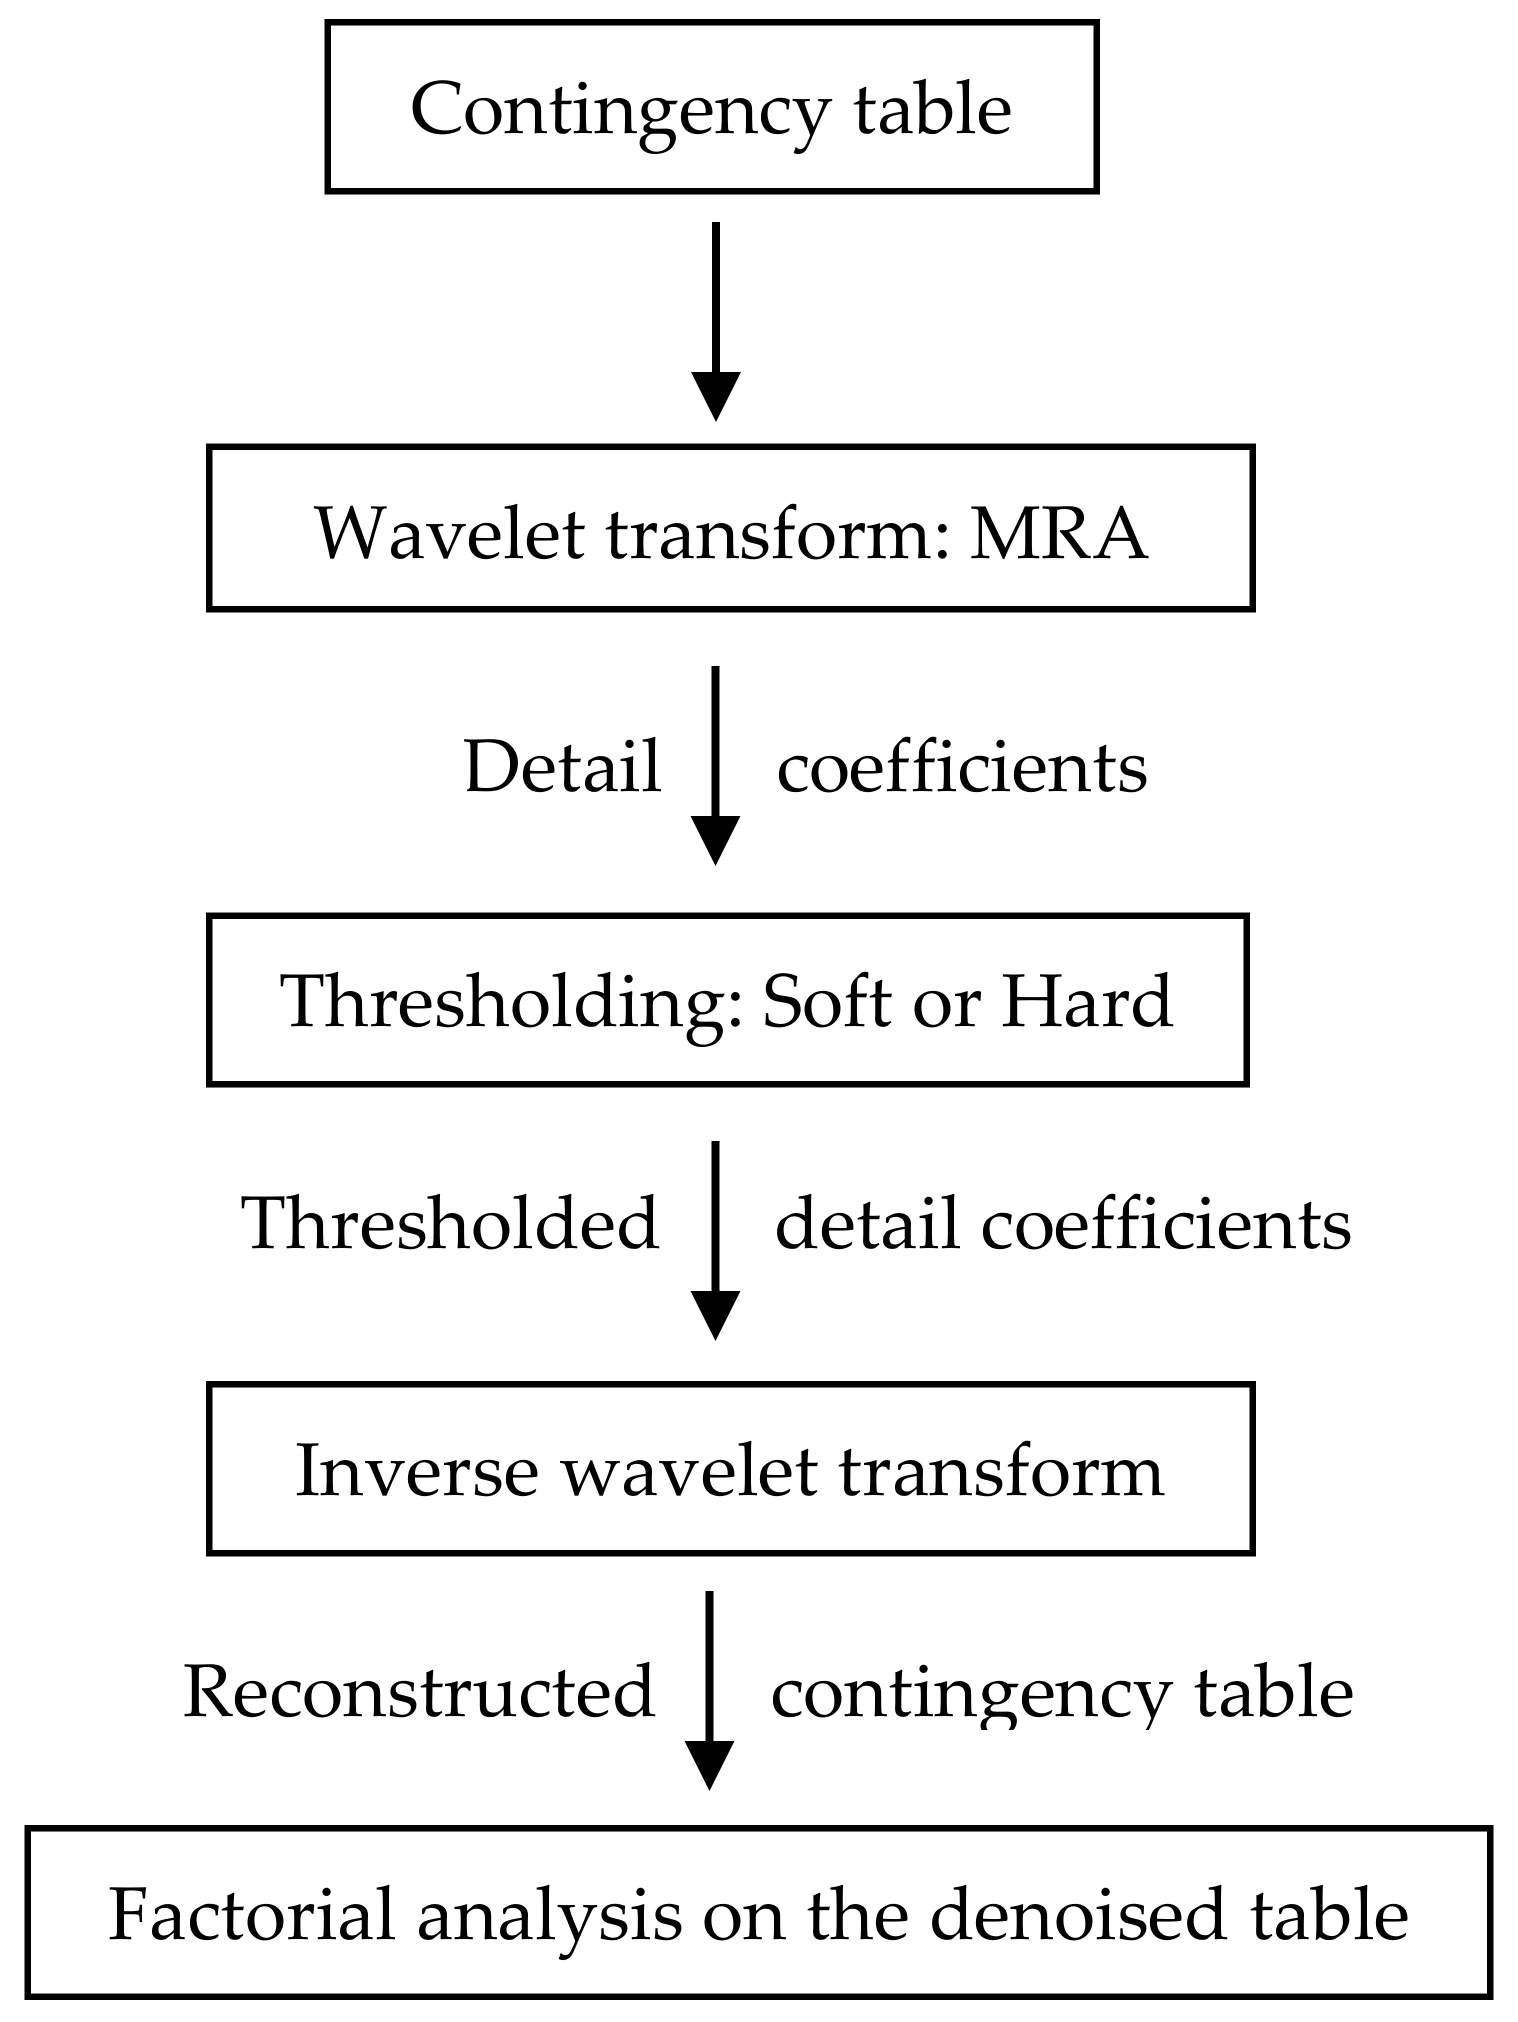
3. The Wavelet Method for Textual Data

The basic idea behind wavelet analysis of data is its scale analysis ability. Indeed, wavelets satisfy some special mathematical requirements that are useful in data representation. For example, in the case of non-stationary data, wavelets are proved to be efficient descriptors for trend representing, volatility clustering and variance due to their ability to take into account both frequency and time in the multiresolution contrarily to the Fourier transform [37,38].
Wavelet analysis is based on two types of source functions, the father wavelet ϕ and the mother wavelet ψ (which are in the majority of cases related to each other especially in the case of the existence of a multiresolution analysis). Their Fourier transforms satisfy
ϕ ^ 0 = 1   and   ψ ^ 0 = 0 ,
The father and mother wavelets permit to describe efficiently the components of the signal. The father wavelet is adopted to the smooth or the low-frequency part, and the mother is well adopted to the details or the high-frequency parts of the signal. The first step consists in introducing the wavelet basis elements formally expressed (in the dyadic version) as
ϕ j , k t = 2 j 2 ϕ t 2 j k / 2 j   and   ψ j , k t = 2 j 2 ψ t 2 j k / 2 j .
These copies need to be mutually orthogonal to yield good representations. Existing examples are due to Haar, Daubechies, Symlets, Coiflets, etc. Using wavelet basis, a signal f may be approximated at a level J ϵ ℤ by
f J t = k S J , k ϕ J , k t + k d J , k ψ J , k t + + k d 1 , k ψ 1 , k t
where j describes the frequency and k reflects the number of coefficients in the corresponding component and describes the position or the time. One has
S J , k = Φ J , k t f t d t   and   d j , k = ψ j , k t f t d t .
The S J , k ’s are called the approximation coefficients and the d j , k are called the detail or wavelet coefficients. More specifically, the detailed coefficients describe the higher frequency oscillations and the fine scale deviations of the wavelets in the representation of the signal. The approximation coefficients represent the smooth part of the signal and thus permit to capture the trend and/or the seasonality, so that the wavelet series of the signal f is splitted into two parts; a first part composed of the trend and reflects the global shape of the signal and a second part composed of the fluctuations as follows,
f t S J t + D J t + D J 1 t + + D 1 t
where
S j t = k S j , k Φ j , k t   and   D j t = k d j , k Ψ j , k t .
To compute the coefficients appearing in the wavelet series decomposition of a signal one did not need in practice to apply the numerical integral computation for all these coefficients. Moreover, there is also no need to compute all the coefficients simultaneously. Wavelet theory provides however a flexible way by applying the so-called wavelet filters and algorithms [39,40,41]. A set H = h j , l : l = 0 , , L j 1 is called a wavelet filter at the level j with length L j = 2 j 1 L 1 + 1 and total width L if it satisfies
l = 0 L j 1 h j , l = 0 ,   l = 0 L j 1 h j , l 2 = 1   and   l = 0 L j 1 h j , l h j , l + 2 n = 0
for all non-zero integer n . By the same way a scaling filter G = g j , l : l = 0 , , L j 1 is given by g j , l = ( 1 ) l + 1 h j , L j 1 l .
The maximum overlap discrete wavelet transform (MODWT) is a type of wavelet transform issued from the discrete one [42]. It may be adopted to signal without being necessarily of dyadic size [43]. Here also, the MODWT may be associated for both wavelet and scaling coefficients by considering
W ˜ j , t = l = 0 L j 1 h ˜ j , l X t l   and   V ˜ j , t = l = 0 L j 1 g ˜ j , l X t l
for t = 1 , , N 1 where
h ˜ j , l = h j , l 2 j 2   and   g ˜ j , l = g j , l 2 j 2
called the rescaled wavelet and scaling filters respectively. For backgrounds on wavelet analysis and especially its application in finance and economics the readers may refer to [41,44,45,46,47,48,49,50,51,52,53,54,55].
A denoising technique has been developed by Donoho and Johnstone in [56] using wavelet transform to get the so-called wavelet thresholding. It is next applied for denoising in various fields particularly in signal and image processing where its efficiency has been proved. The main idea consists in eliminating detail coefficients that are irrelevant relative to some threshold. The signal is reconstructed with thresholded coefficients by applying an inverse wavelet transform. Two main types of wavelet thresholding will be considered such as the hard and soft ones [57]. The first type consists in dropping to zero all the wavelet coefficients that are lower than a given threshold by setting
d j , k d j , k χ 0 , d j , k .
The second type consists in setting
d j , k ( d j , k + λ s i g n d j , k ) χ 0 , d j , k ,
where λ > 0 is the threshold. The parameter λ is selected by applying the most commonly used and universal global threshold due to Donoho and Johnstone [56], λ = σ 2 log N where Ν being the length of the signal and σ2 is the noise variance.
In our present paper, the denoising technique described above is used to remove noise from the contingency table constructed before applying the multidimensional textual data analysis methods. The principle of the proposed method is illustrated by Figure 1 below.
It is clearly noticed from the diagram above (Figure 1) that the role of the wavelet technique intervenes in the step of filtering (denoising) the data contained in the contingency matrix. Recall that for data bases applied in this type of analysis, being noised, uncertain, fuzzy, missing in some cases, affects negatively the findings. It may lead to non-accurate decisions for the makers, politicians, leaders, etc. False and inaccurate interpretations cause confused and bad decisions. In economics/finance, investors also wait generally for accurate analyses to decide about their investments. These are also motivations among those raised previously that led us apply wavelet techniques. Hereafter, a brief resume of the wavelet processing is given, with some comparison with existing methods in textual analysis.
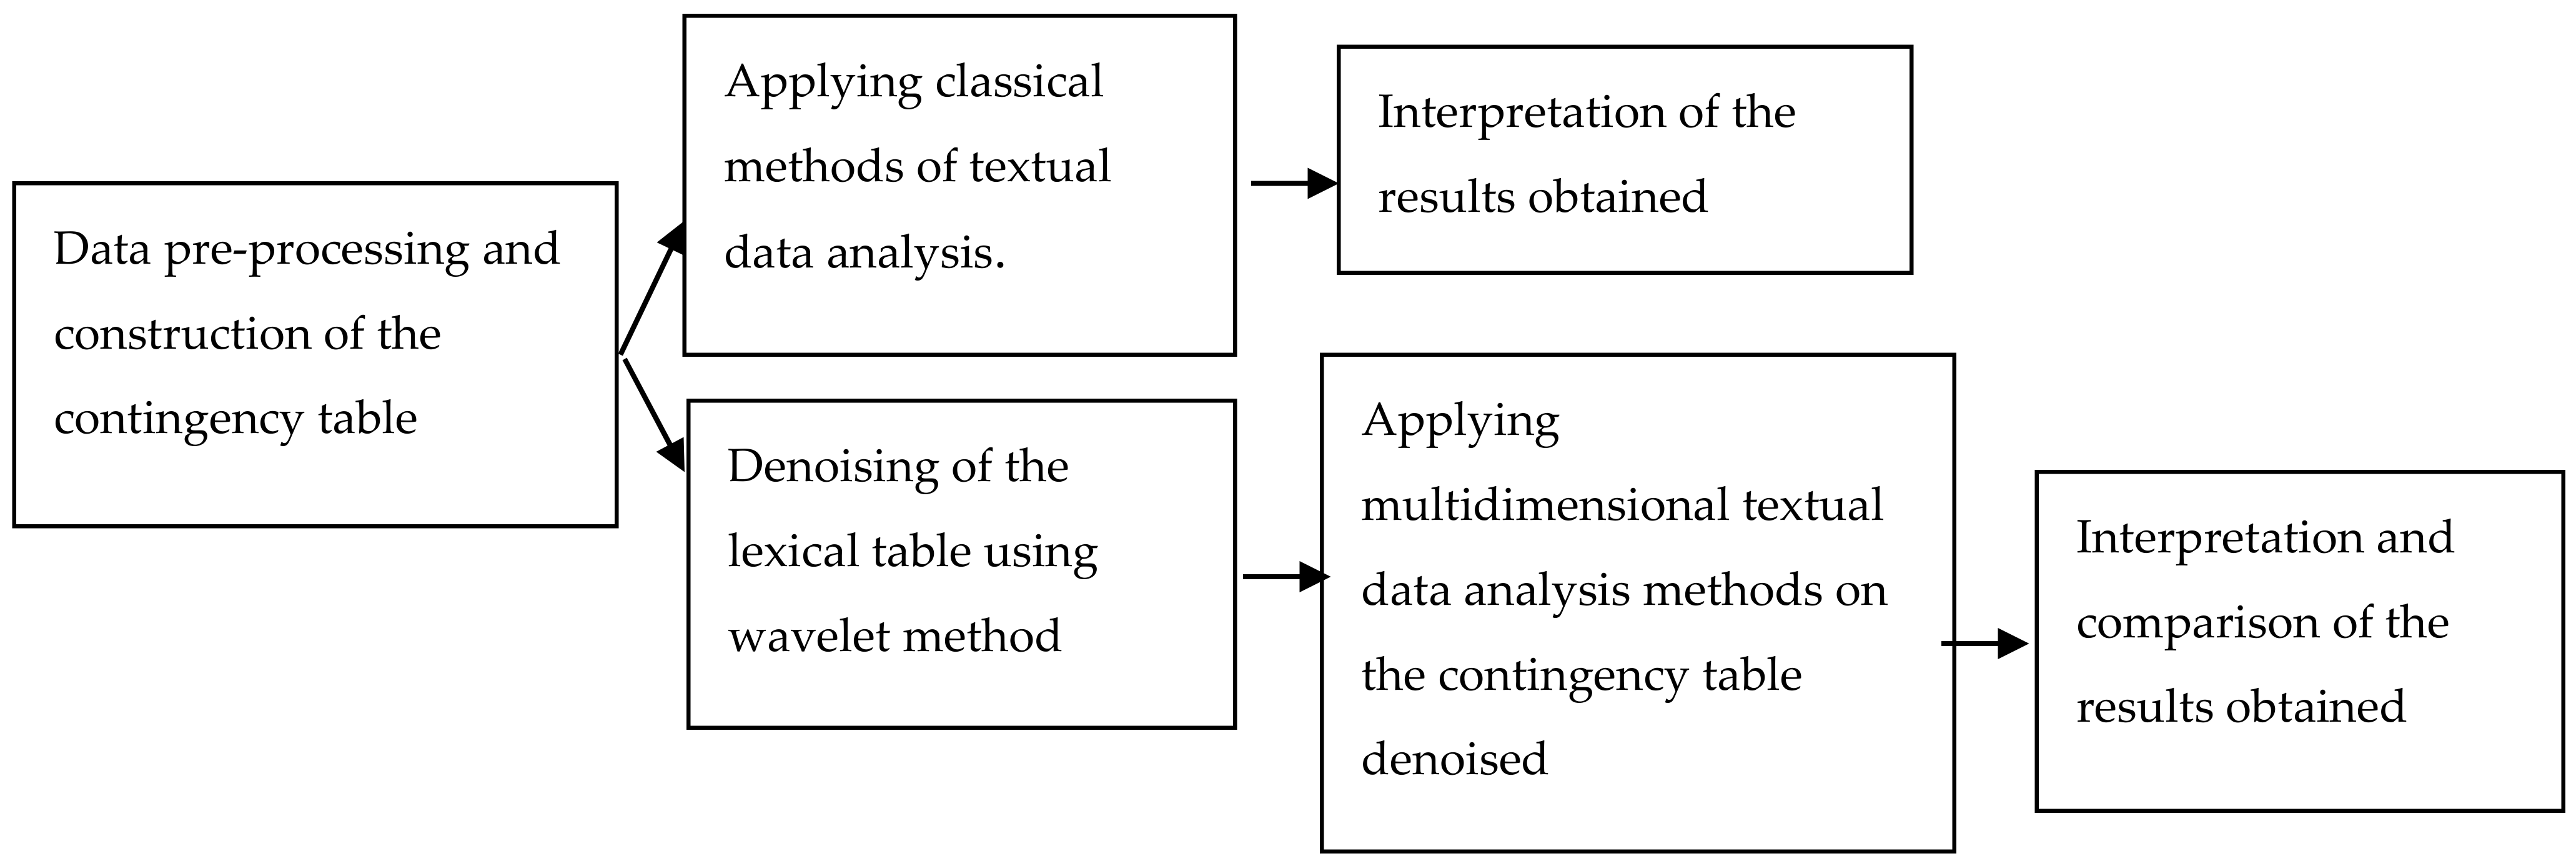
  • Step 1: In the classical methods, the data applied may suffer from many problems such as the lack of data, and essentially imprecision and fuzziness. Wavelet technique consists in resolving these circumstances before processing by applying denoising methods, reconstruction of missing data and correction of fuzzy parts.
  • Step 2: The construction of the contingency tables in textual analysis is always denoised in all the classical methods. By applying wavelet denoising, a clean data basis is obtained and thus a denoised contingency table.
  • Step 3: A second processing on the contingency table consists in classical methods to eliminate the least information forms (the forms with minimal frequency) in the lexical corpus, by letting to zero the corresponding values in the contingency table. However, considering a table (as equivalent to an image for example) and letting to zero in mathematical image processing may lead to non-accurate results and lacunarity. Recall that small parts in a time series may form together a great piece. In wavelet theory there is no need to eliminate these parts, while their effect may be evaluated on the whole image via their wavelet coefficients.
  • Step 4: Being constructed the clean contingency table; a reprocessing by the factorial correspondence analysis is conducted.
In fact, textual analysis wavelet processing is not very widely known. The efforts in such a field need more developments. In our knowledge, few works have been developed such as [5,58], where wavelets have been applied for the purpose of classification and comparison of textual data relatively to multiresolution levels. In [59], wavelet transform has been applied for the visualization of breakpoints in textual data. In [60], the wavelet thresholding method has been applied for detecting irrelevant parts in textual data.

4. Data Analysis

Social media sources, like Twitter and Facebook are becoming very popular around the world. The analysis of the large amounts of data generated by these media is therefore very useful. These are short messages that may include hyperlinks and various types of multimedia like images or videos. However, the writing style used is often non-standard, where abbreviations and lots of mistakes may exist such as spelling, lexical, grammar mistakes, writing in some languages with foreign languages letters especially Arabic tweets and messages, which are included in the present study.
In this work, the main focus was on the analysis of the tweets that circle around the word about KSA 2030-vision, and which are written in Arabic. For the data collection, at the beginning, the twitter search API (application programming interface) was applied, which allows to return tweets responding to a certain request. However, the limit of this method is that the number of tweets returned cannot exceed one week. For this reason, it is decided to collect the tweets by ourselves by varying each time the search keywords according to the different programs of the vision (the 13 programs are reorganized in Table 2 below).
Since interests are on real time content, only original tweets are considered in the analysis. Duplicated and in-reply tweets are eliminated from the data. A set of 627 tweets are collected by successive copy/paste operations. Table 3 below shows an example of these tweets.
After the data collection, a preprocessing stage must be conducted. The starting step reposes on the usual cleaning methods consisting mainly in removing links, hashtags, punctuation marks, numbers, non-alphabetic characters, diacritics and stop words. This step is realized due to the arabicStemR package of the R language. The corpus is reorganized by omitting stop words such as adverbs, articles and conjunction. In order to obtain legible and interpretable graphic representation, words with a frequency greater than 5 are kept. This has resulted in a final corpus of 3856 occurrences and 181 graphical forms. The next step consists in constructing the lexical matrix based on the 181 terms and the 13 programs of the KSA 2030-vision. This results in a (181 × 13) matrix. Each cell (i,j) is affected by the value 1 if the i term is mentioned in the j program and by the value 0 otherwise. This allows one to interpret the contingency matrix as a binary image, which permits by the next its wavelet processing [60].
In our case, the application of wavelet analysis intervenes essentially in the step of denoising the contingency table (seen as an image). Recall that a preprocessing step of the corpus resides in general to a noisy contingency table. The application of wavelet analysis permits to decompose such a table into components, a first component relative to the approximation coefficients and which reflects the global shape of the image, and other components containing the details and/or the fluctuations, relative to the detail coefficients. In this second part, the noise is concentrated. The application of the wavelet denoising method based on the thresholding permits to avoid this noise. Recall that wavelet transform leads to a sparse representation of the image, which leads to a concentration of the image features in a few large-magnitude wavelet coefficients. The thresholding consists to remove the small coefficients, which are typically noisy without affecting the image quality. Next, the denoised or thresholded contingency table is reconstructed by using an inverse wavelet transform. The diagram in Figure 2 illustrates the application of wavelet analysis in our case.

5. Results and Discussions

5.1. Correspondence Analysis before Denoising

5.1.1. Variance Explained by the Factors

In this step, a correspondence analysis was applied on the original non thresholded lexical table. In Table 4, the eigenvalues and the percentages of inertia explained are presented, provided with the cumulative percentages for all dimensions of the contingency matrix. It is noticed that the first axis contained approximately 15.22% of the inertia, and the second one accounts for approximately 13.07%. The two axes together yielded a cumulative total amount of inertia of approximately 28.29%. Statistically speaking, in correspondence analysis, this cumulative percentage was not satisfactory enough, as an important high percentage is expected for the total variance to be explained by these two principal axes.

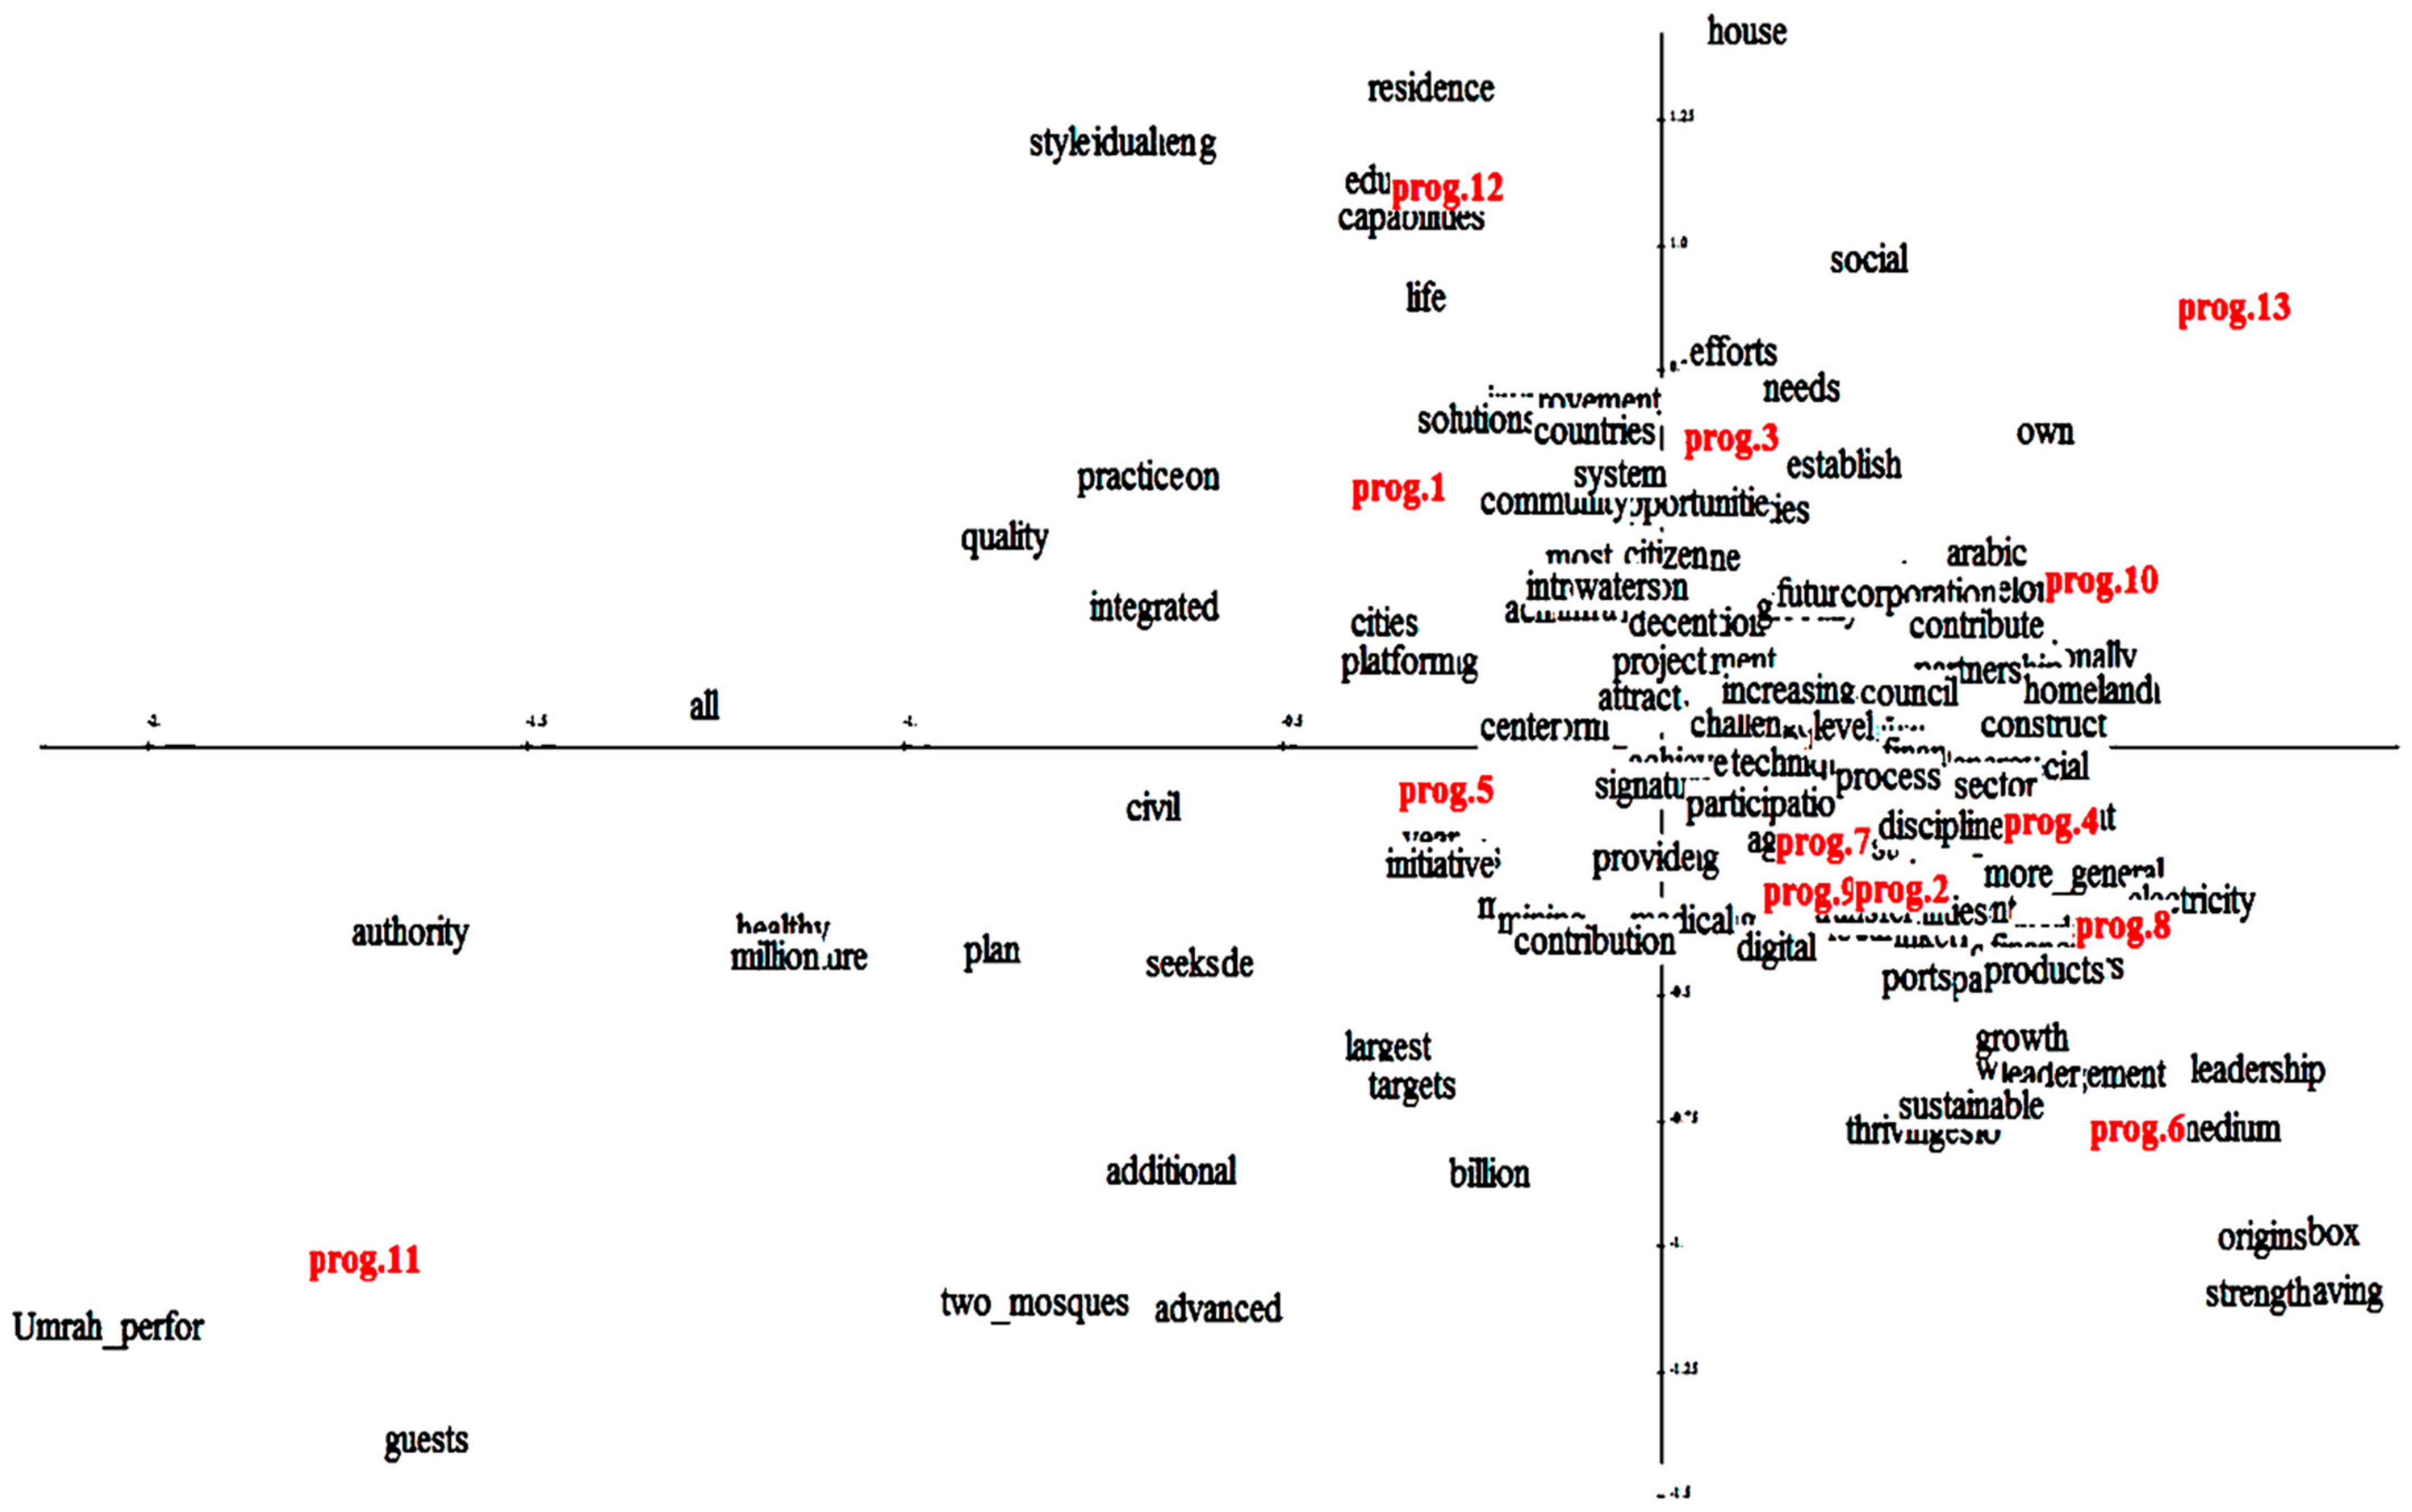
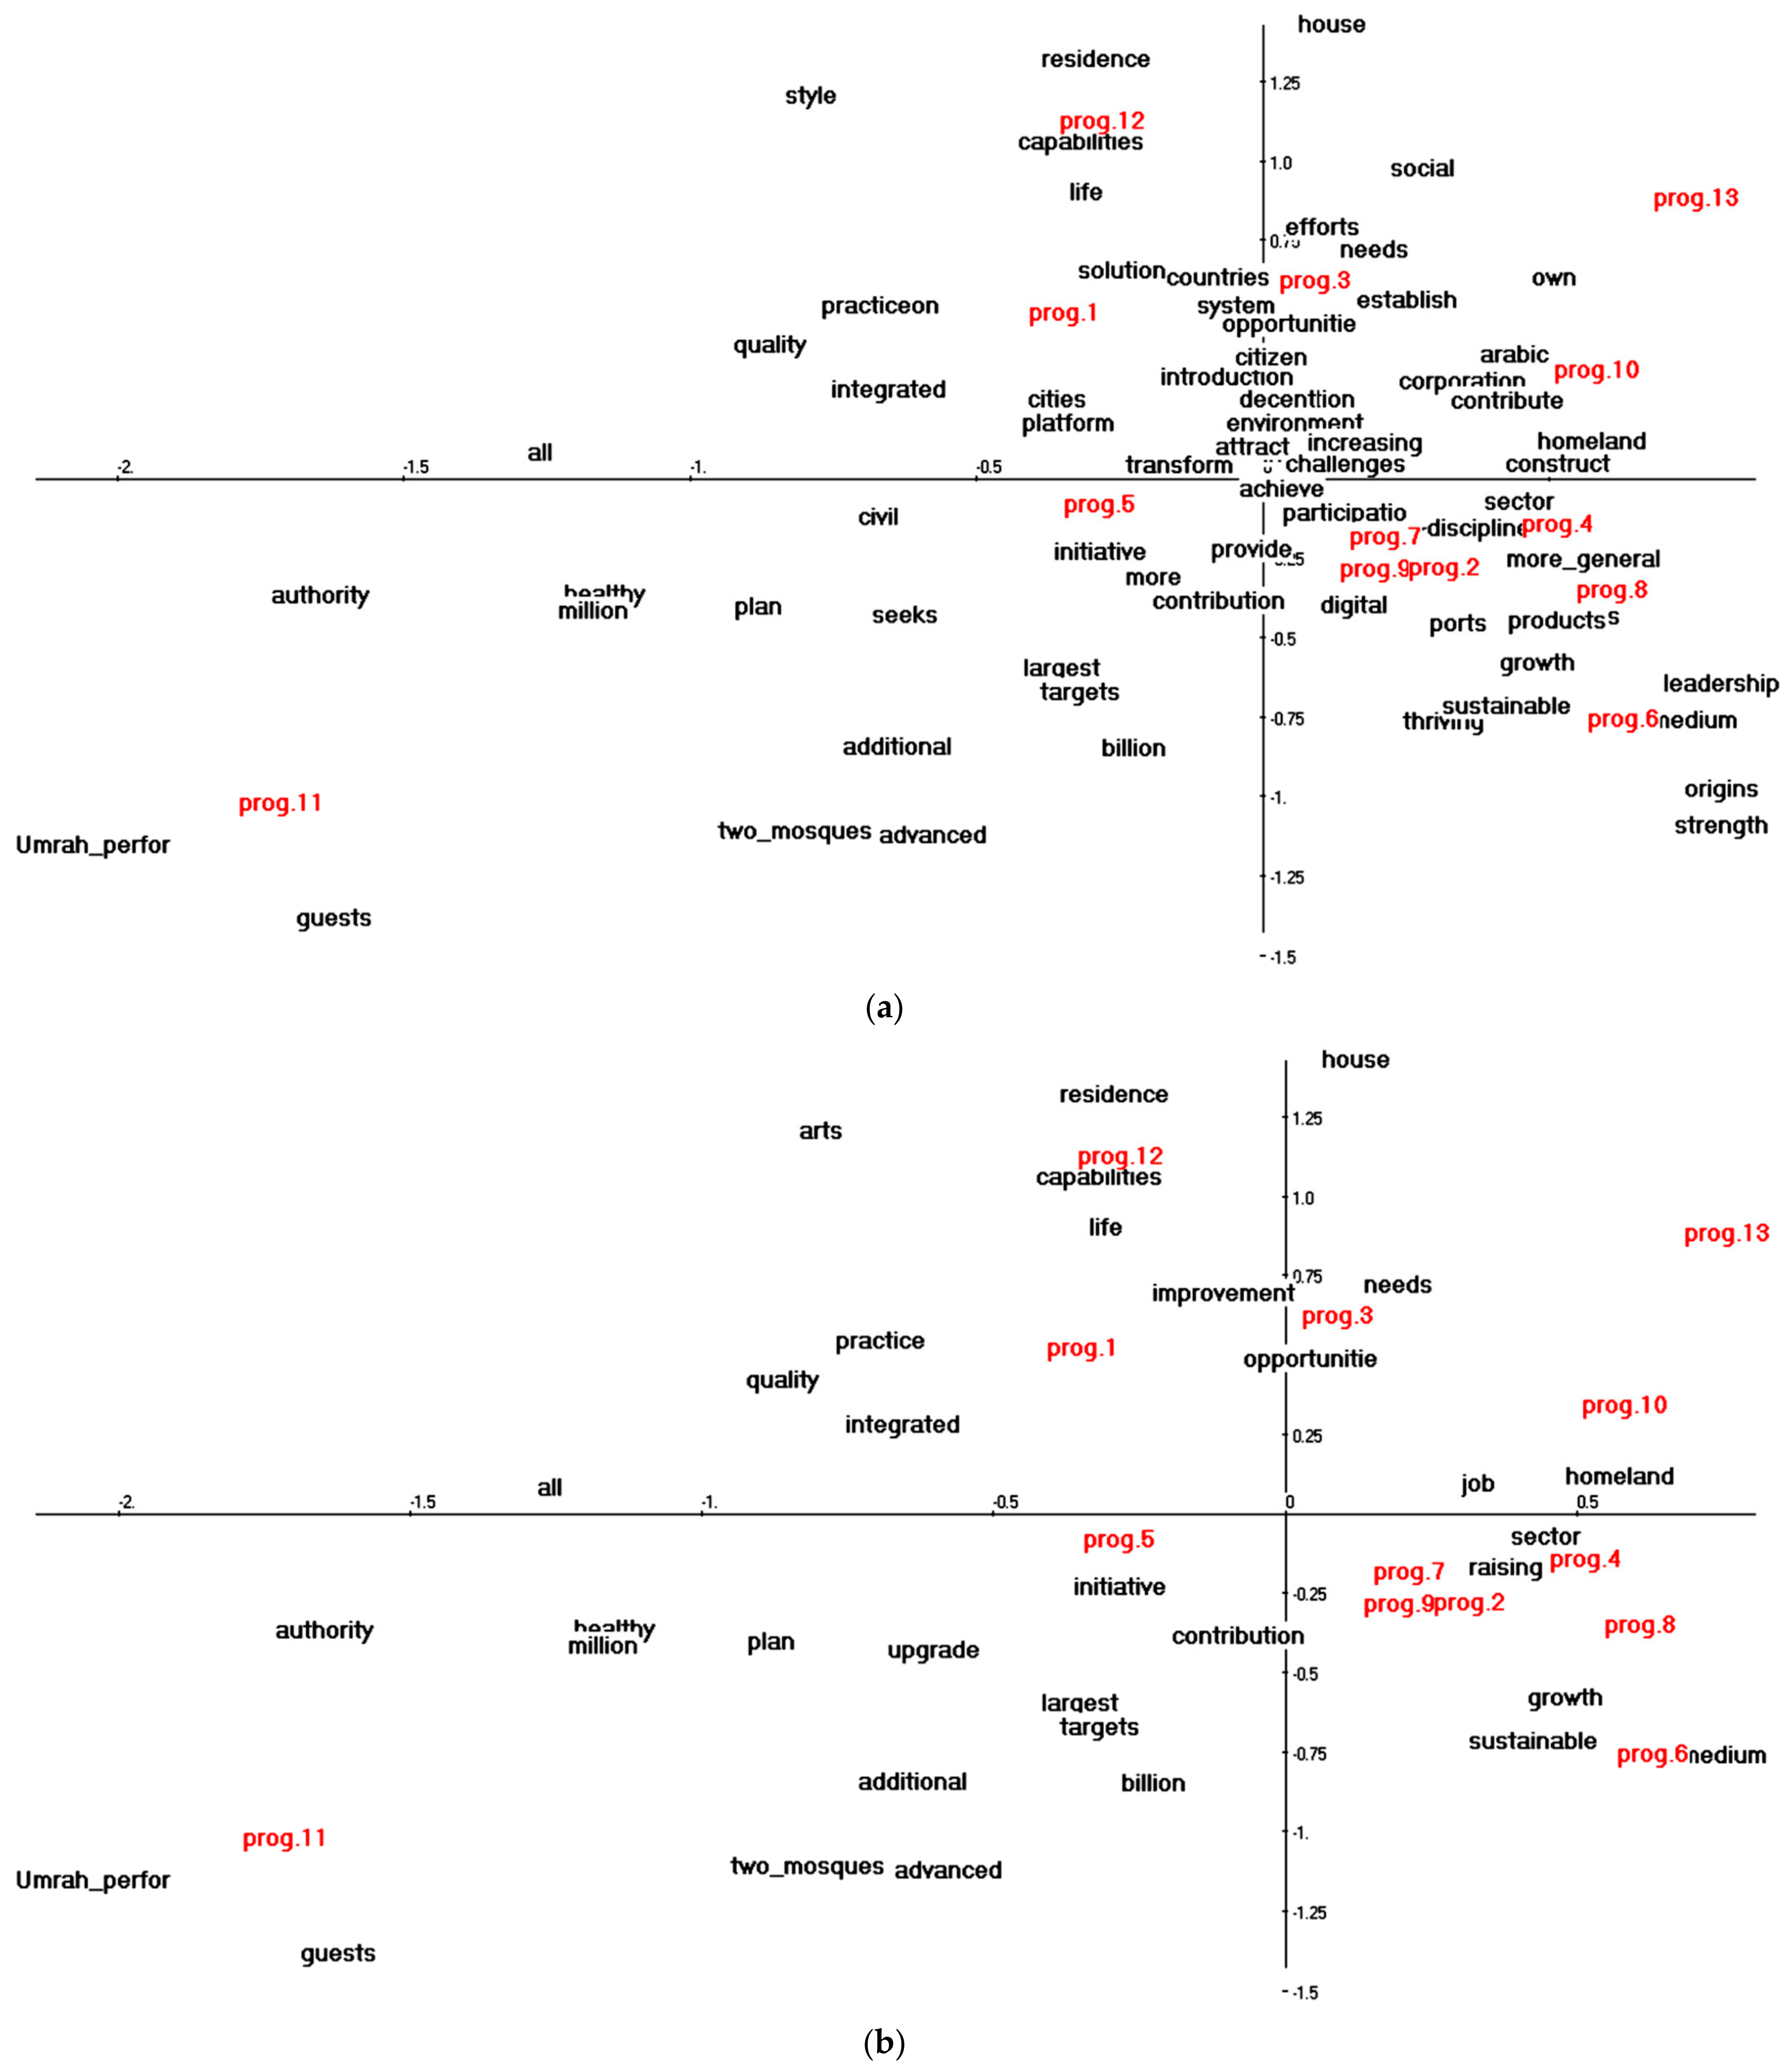
5.1.2. Representation of the First Factorial Plan

Figure 3 illustrates the projections of the row vectors and the column vectors of the lexical table on the first factorial plan before denoising. This graph presents a scatter plot concentrated around the gravity center, which is due to the low percentage of the inertia explained by the factorial plan (only 28.29% of the total variance is explained). Such a representation leads to a low analysis quality, since a good one is generally obtained when the first two dimensions represent a large part of the total variance.
By looking to the modalities of the variable “program” (columns of the contingency table) having an absolute contribution higher than the average one, it is observed that the modalities (prog.11) and (prog.5) were important for the first factor and the modalities (prog.1), (prog.12), (prog.3) and (prog.6) were important for the second factor. However, the result of the relative contribution shows that only the modality (prog.11) was well represented with a squared cosine values equal to 0.64 (Table 5). All the other modalities had bad representation quality on the first factorial plan and therefore they could not be retained in the analysis.
Figure 3 contains clearly a condensed part that is not easy to interpret, and reflects therefore a bad projection of the data according to the classical method applied before the wavelet processing. The majority of modalities are accumulated around the origin. In the sense of signal or image speaking, this figure is interpreted as a noised image. In Appendix A, some modified versions of Figure 3 are provided in order to clarify more and to show the inefficiency of the classical method. This motivates the application of wavelet analysis proposed in the present work. Indeed, the application of the wavelet transform in the case of the contingency table permits to decompose the latter according to the different multiresolution levels and thus permits next to apply the best decomposition for the purpose of denoising and the corresponding analysis.

5.2. Correspondence Analysis after Denoising

5.2.1. Variance Explained by the Factors

In Table 6 below, the inertia percentages due to the application of the correspondence analysis on the lexical table are provided. These proportions are explained obviously by means of the first two factors. The lexical table used was subject to both the hard and soft thresholding using Daubechies wavelets, db4, db6, db8 and db16.
From Table 6, a significant improvement of explained variance relative to the first plan is easily concluded. Moreover, the soft thresholding yielded better improvement than the hard threshold. It is also noticed that the highest result of the cumulative explained variance was reached by using the wavelet db16 with approximately 97.34%. This permits one to conclude that such a solution is the most powerful, and thus it will be subject to the next steps. It guarantees a minimum waste of information.

5.2.2. Absolute and Relative Contribution of the Modalities

The correspondence analysis in this case is of a good quality as the sum of the variance explained by the first two factors added up to 97% of the total inertia. This can be shown also by the analysis of the relative contribution of the different modalities of the variable “program”. As presented in Table 7, for the first axis, the most contributing modalities (with the highest absolute contribution values) were (prog.11), (prog.8), (prog.1), (prog.12), (prog.10) (prog.4) and (prog.7). Their relative contribution values were higher than 0.8 (only for the modalities (prog.4) and (prog.7)) meaning that they were well represented on this axis. The axis 2 was constructed by the modalities (prog.2), (prog.3), (prog.5), (prog.9) and (prog.6). With a squared cosine values higher than 0.7 (only for the modality (prog.6)), these modalities were also well represented on the second axis.
A significant improvement of the relative contribution of the rows of the contingency table (the graphical forms) was also noted after denoising. Table 8 presents a comparison of the results obtained before and after denoising for some graphical forms. As shown in this table, the representation quality of the graphical forms on the first plan was better after denoising. Taking for example the modality (partnership), the sum of the squared cosine values on the first two axes went from 0.12 before denoising to 1 after denoising of the lexical table, thus showing a good representation quality on this plan.
Therefore, the interpretation of the relative position, on the first factorial plan, of the different modalities (the rows and the columns of the contingency table) was identified as the most important.

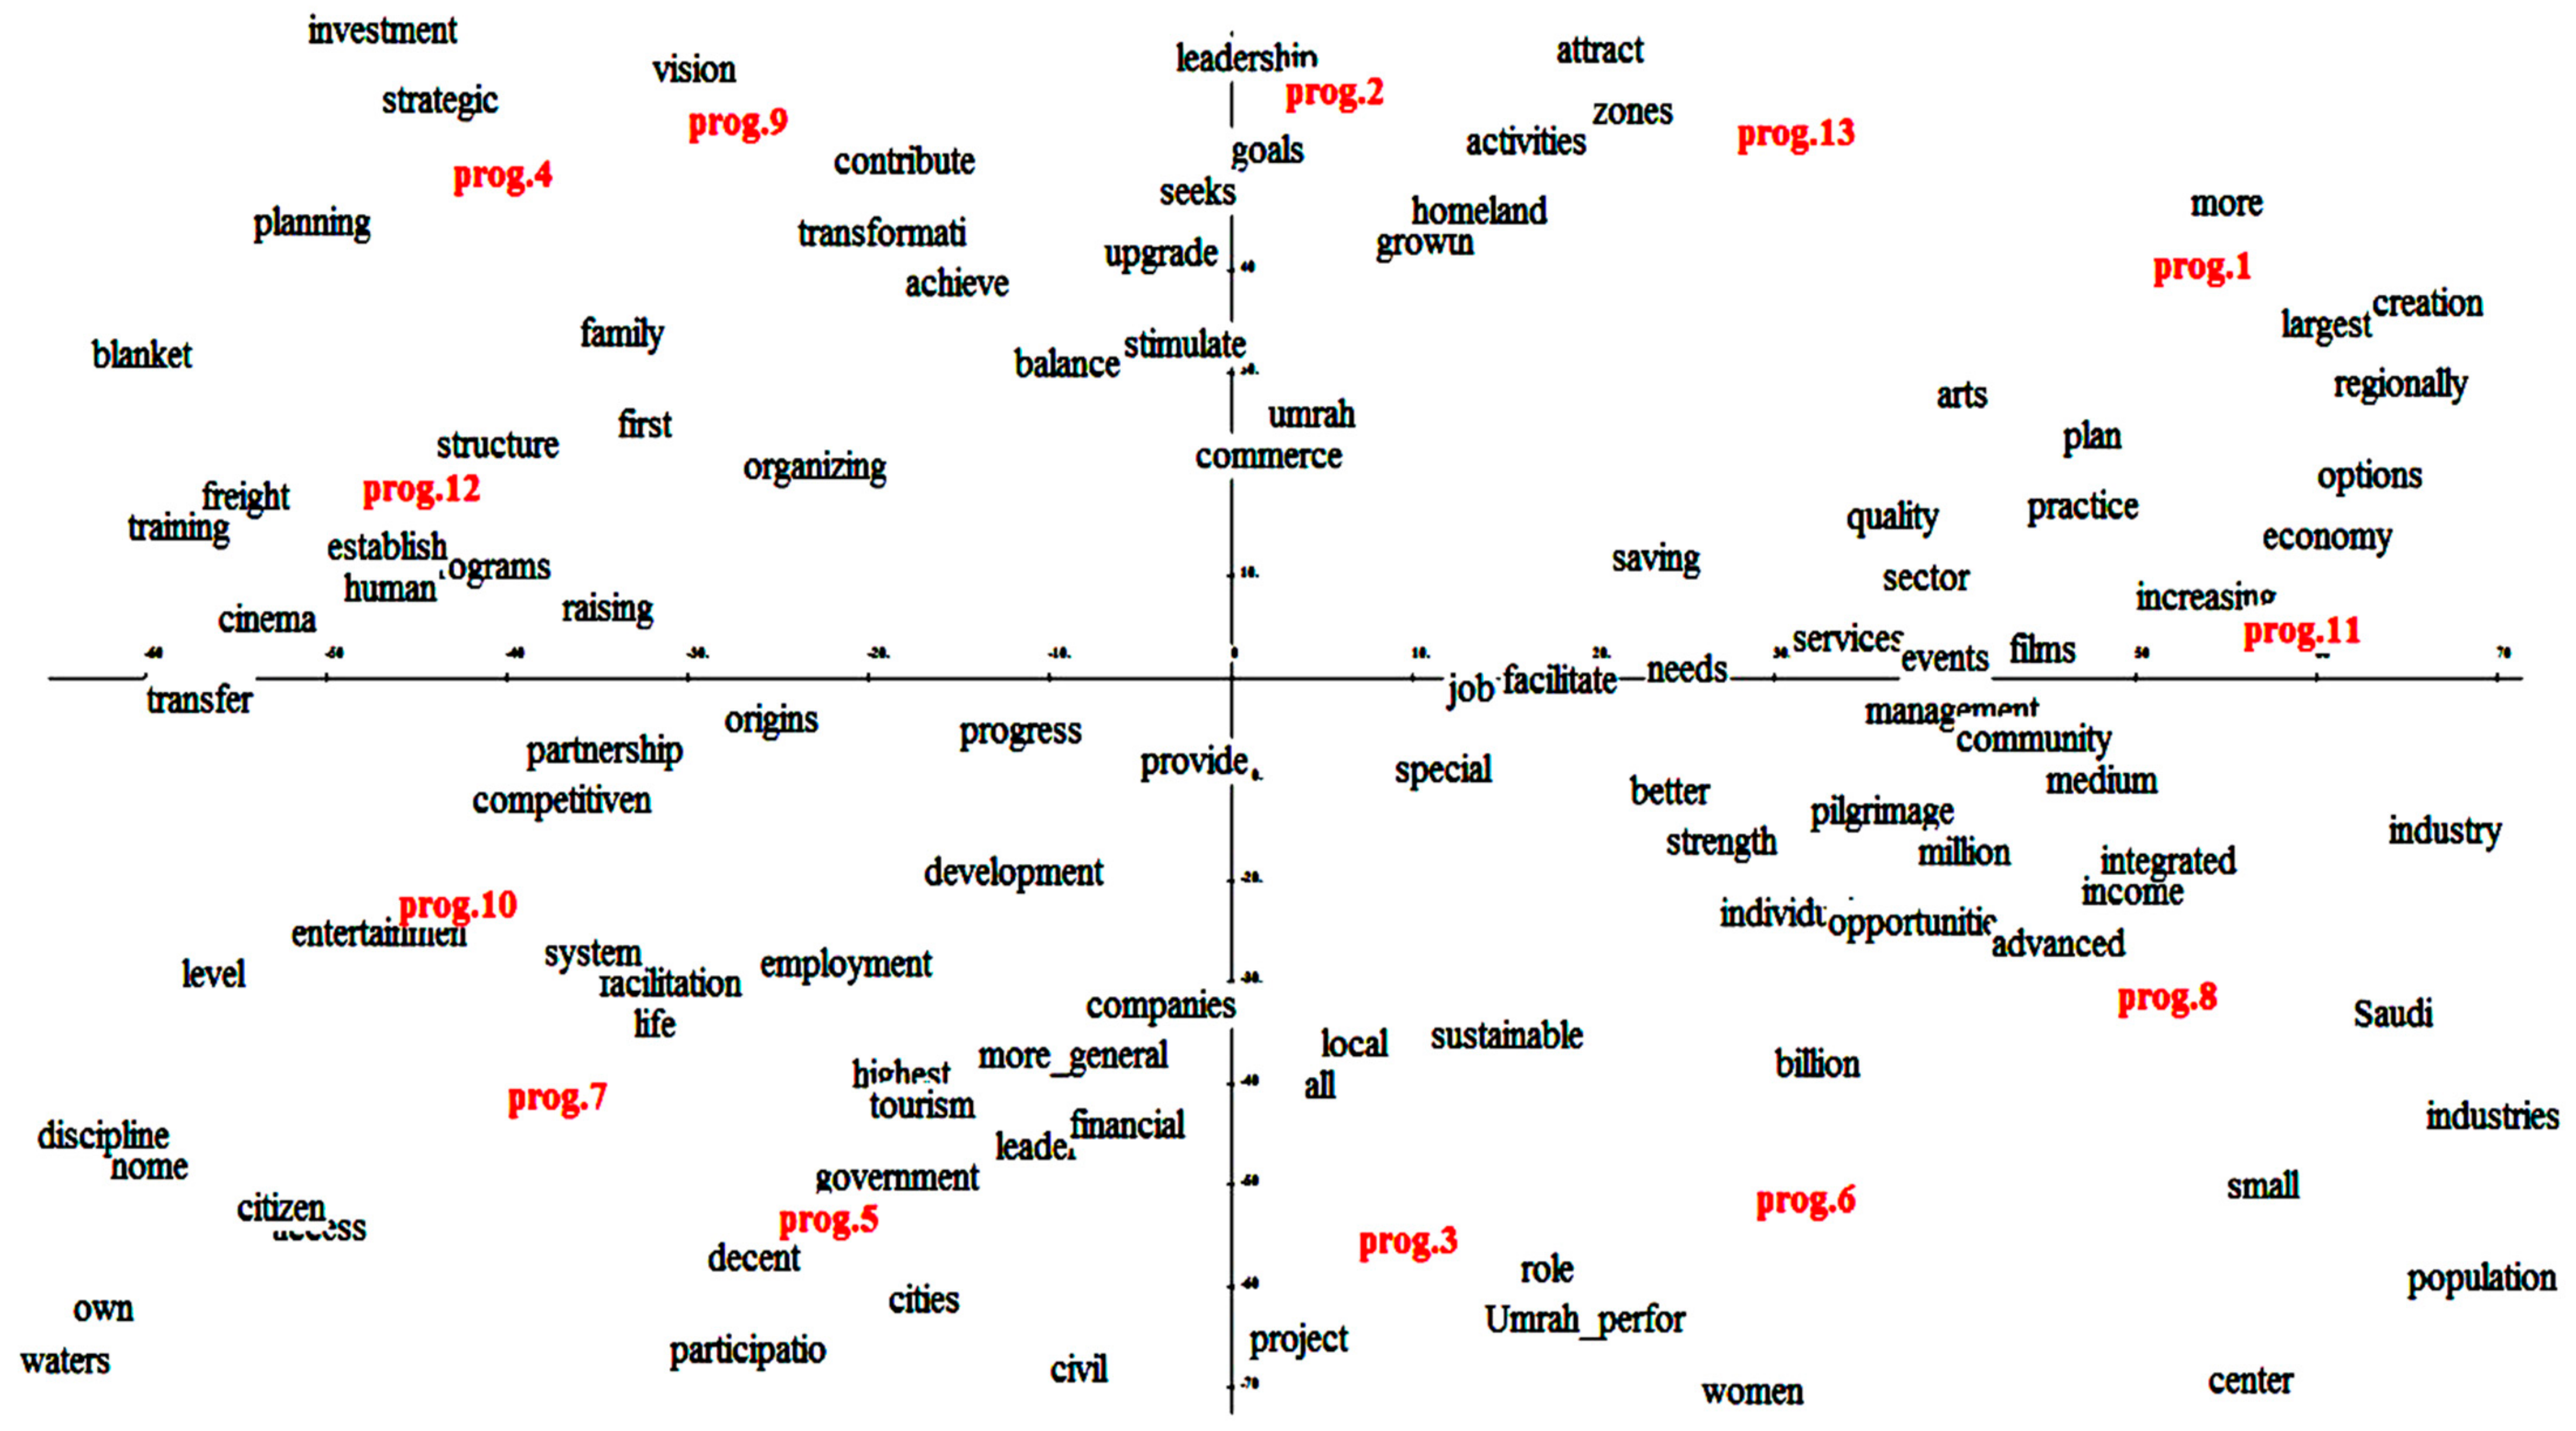
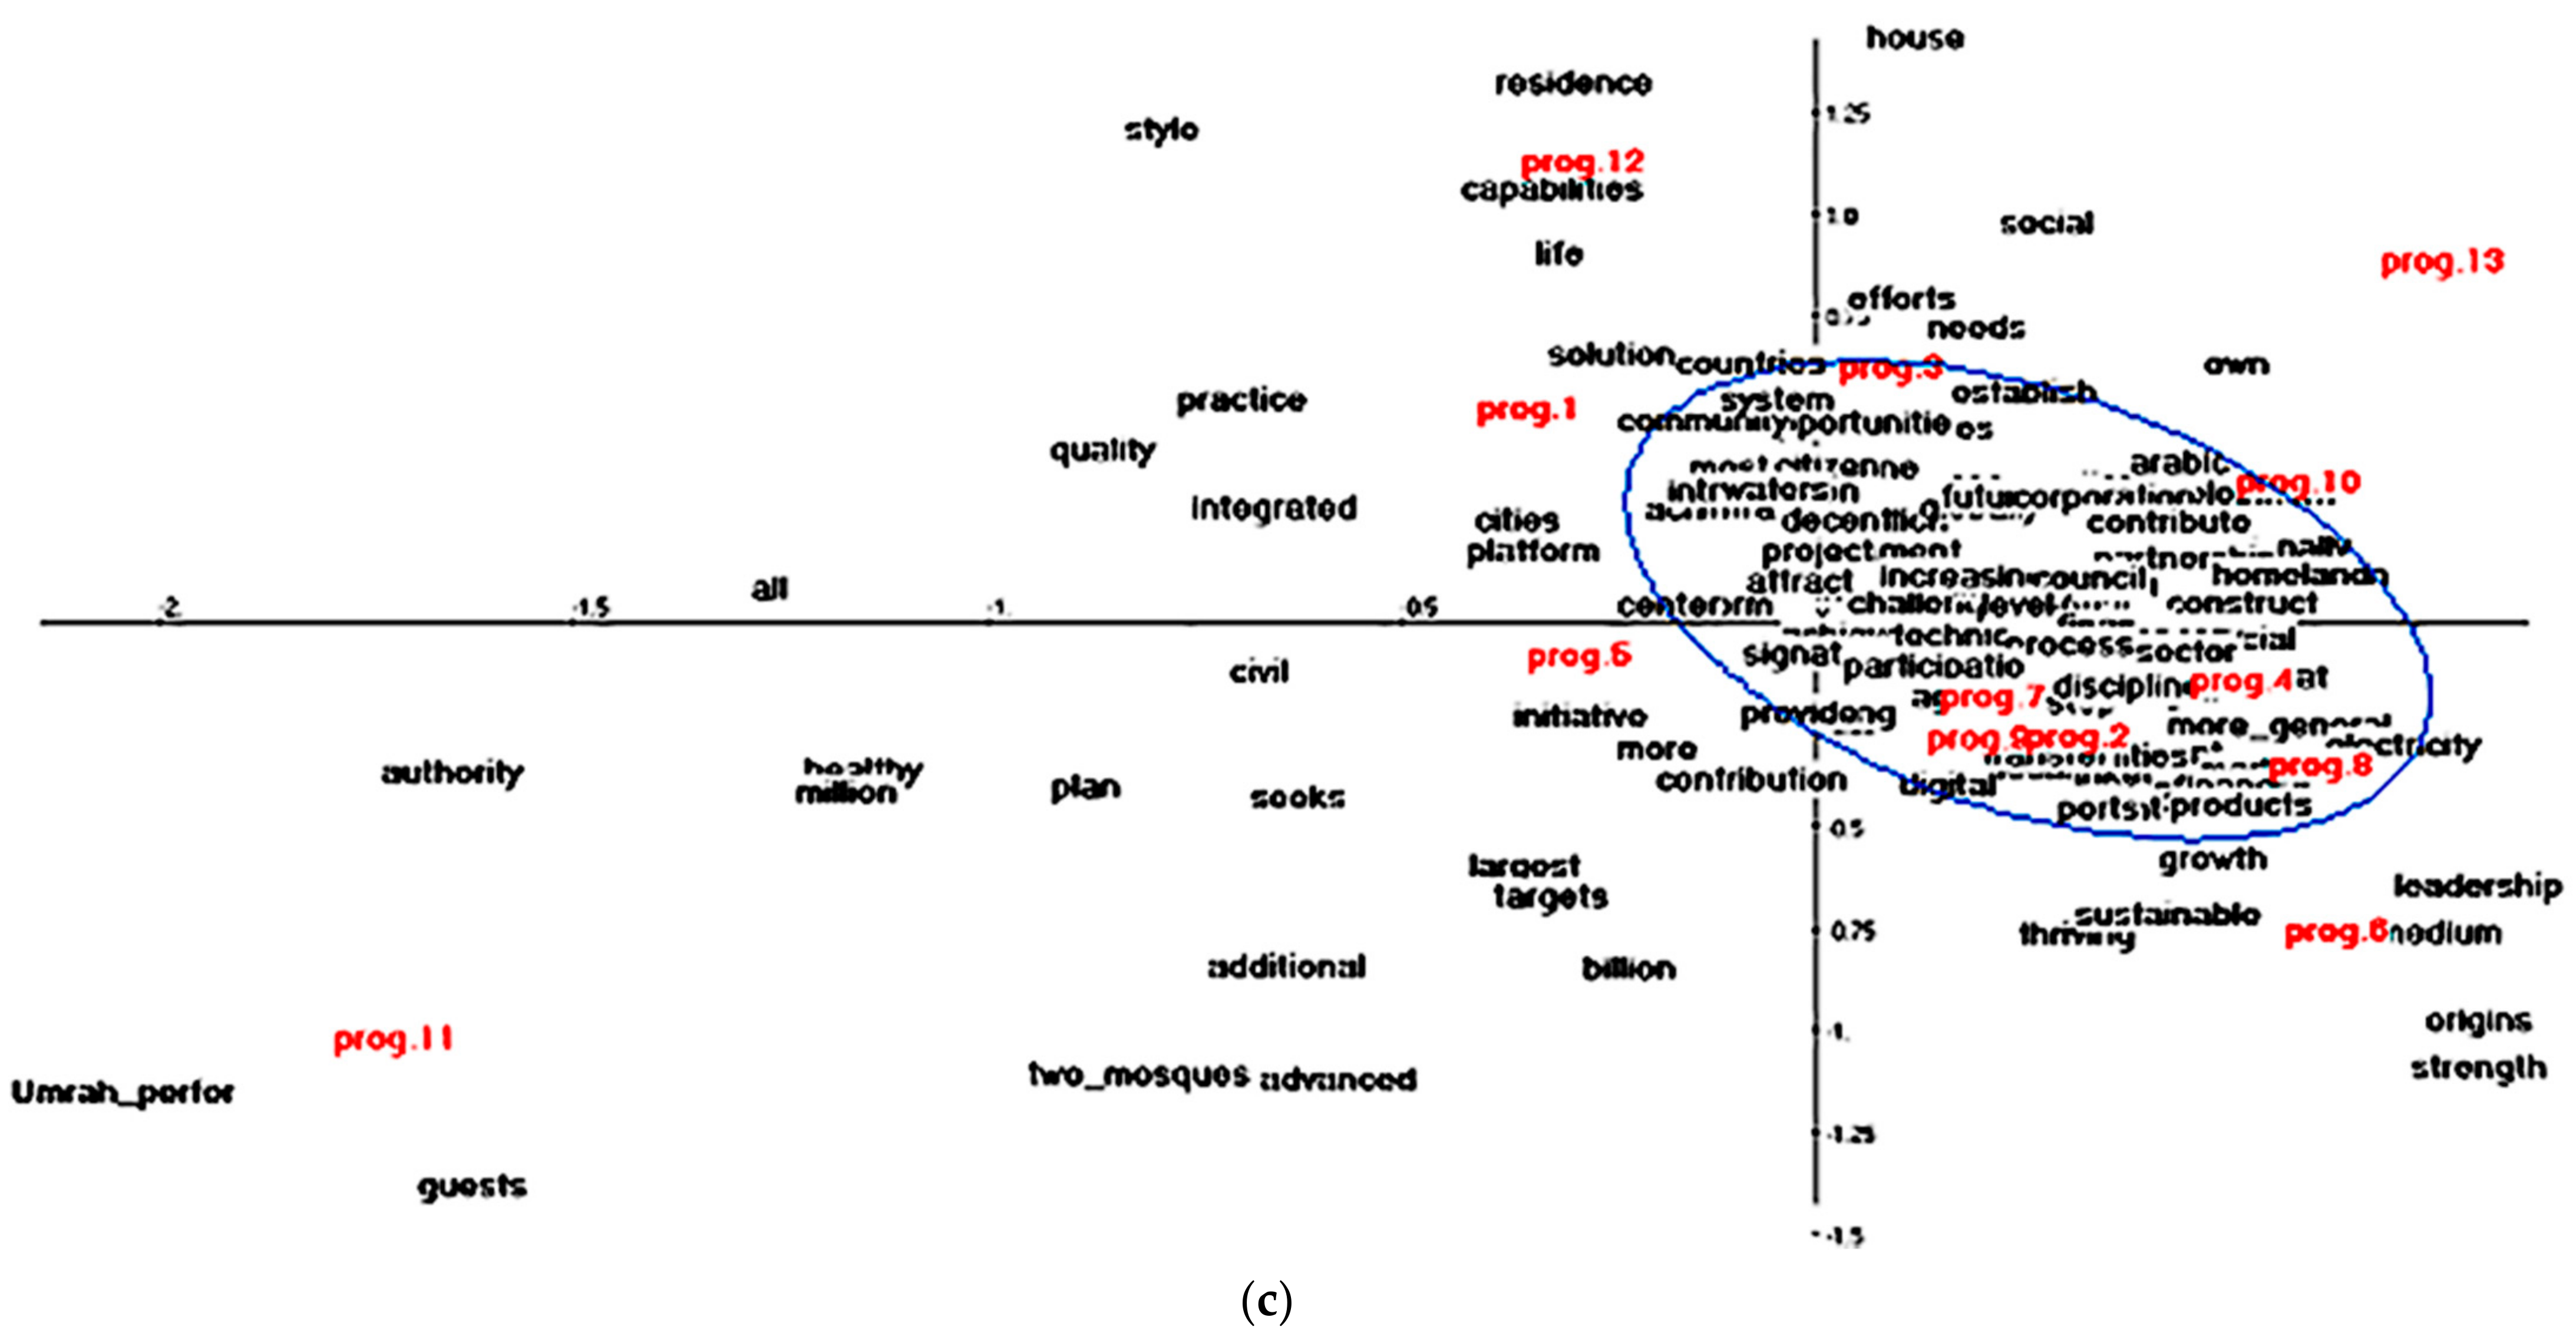
5.2.3. Representation of the First Factorial Plan

In Figure 4, the projections of the contingency matrix rows and columns on the first factorial plan were provided after the denoising. On this graphical display, only the words whom contribution to the inertia were greater than the average was illustrated, and had an acceptable representation quality (squared cosine values higher or equal to 0.7). It is precisely noticed that the first factor explained approximately 61.48% of the total variation, while the second factor explained approximately 35.86%.
On the right side of the first axis (Figure 4), the modalities (prog.8), (prog.1) and (prog.11) were observed to be in proximity of the graphical forms (economy), (Saudi), (small), (medium), (regionally), (creation), (job), (more), (sport), (quality), (better), (pilgrimage) and (million). In fact, the goal of national companies’ promotion program is to promote the development of national companies and to support the competitiveness of small and medium sized enterprises and their productive and export capacities. This leads to enhancement of the Saudi economy regionally and internationally and to the creation of more job opportunities. Through the quality-of-life program, the government seeks to improve the way of life of Saudis by encouraging them to participate in cultural, entertainment and sports activities. The Hajj and Umrah program aim to increase the number of pilgrims to 30 million in 2030.
On the left side of axis 1, (prog.12), (prog.10), (prog.4) and (prog.7) were found to have a higher representation quality for the first two modalities (cos2 = 0.91 and 0.92, respectively) than for (prog.4) and (prog.7) (cos2 = 0.67 and 0.61, respectively). These modalities were situated in proximity of the graphical forms (training), (programs), (human), (partnership), (competitiveness) and (strategic). In fact, the human capital development program aimed to improve educational and training systems in order to provide a human capital that responded to the labor market requirement and that promoted the kingdom’s international competitiveness. For the strategic partnerships program, its main objective was to ameliorate and strengthen the economic partnerships with the foreign countries that were considered as strategic actors for the KSA 2030-vision success. Among these countries, France, Germany, United States, Great Britain, China, South Korea, Japan and Russia have to be good partners. Recall that the objective of fiscal balance program is to achieve a balanced budget, maintain stable reserves and conserve the government debt capacity. While the privatization program leads to the amelioration of the services quality provided, the increase of the government revenues and the creation of new jobs. In such a program, many sectors are concerned by privatization such as telecommunication, environment, water, labor market, transport, housing, pilgrimage and visits, health, education, municipalities, energy and agriculture.
The second axis was constructed, on its right side, by the modalities (prog.2), (prog.9) and (prog.13) with a higher representation quality for prog.2 and prog.9 (cos2 = 0.95 and 0.72, respectively) than for (prog.13). In proximity of these modalities, the words (investment), (saving), (development), (growth) and (zones) were detected. In fact, the financial development program had a main role in creating an efficient, stable and diversified financial sector, which in turns leads to the national economy development, the diversification of its resources and the stimulation of saving, growth and investment. The primary goal of the national industrial development and logistics program is the development of the industrial zones and the manufacturing production while the Saudi character enrichment program aims to develop and strengthen the national personality of Saudi citizens by fostering a set of Islamic and national values.
On the left hand of axis 2, the modalities (prog.3), (prog.5) and (prog.6) are observed with a higher representation quality for (prog.3) and (prog.5) (cos2= 0.93 and 0.79, respectively) than for (prog.6). By studying the contribution of the words that participate to the construction of this axis, the graphical forms (life), (decent), (home), (access), (citizen), (own), (women), (development) and (tourism) were detected. In fact, in order to improve the percentage of the Saudis homeowners and the quality of homes that guarantee a decent life for citizens, several initiatives have been taken through the housing program. Talks are about the facilitation of the finance access for the purchase of a real estate, the improvement of housing service quality, the construction of housing suitable for all income groups and the encouragement of the private sector to carry out real estate’s projects. For the national transformation program, its main objectives are the transformation of the health sector, the amelioration of the environment living of Saudis, the preservation of natural resources, the enhancement of the associative sector, the raising of women participation in labor market, the facilitation of working access for disabled people, enhancing of working conditions of foreign workers and finally the development of the private and tourism sector. Through the public investment fund program an improvement of the public investment fund and a promotion of its investment capabilities are the main desired goals.

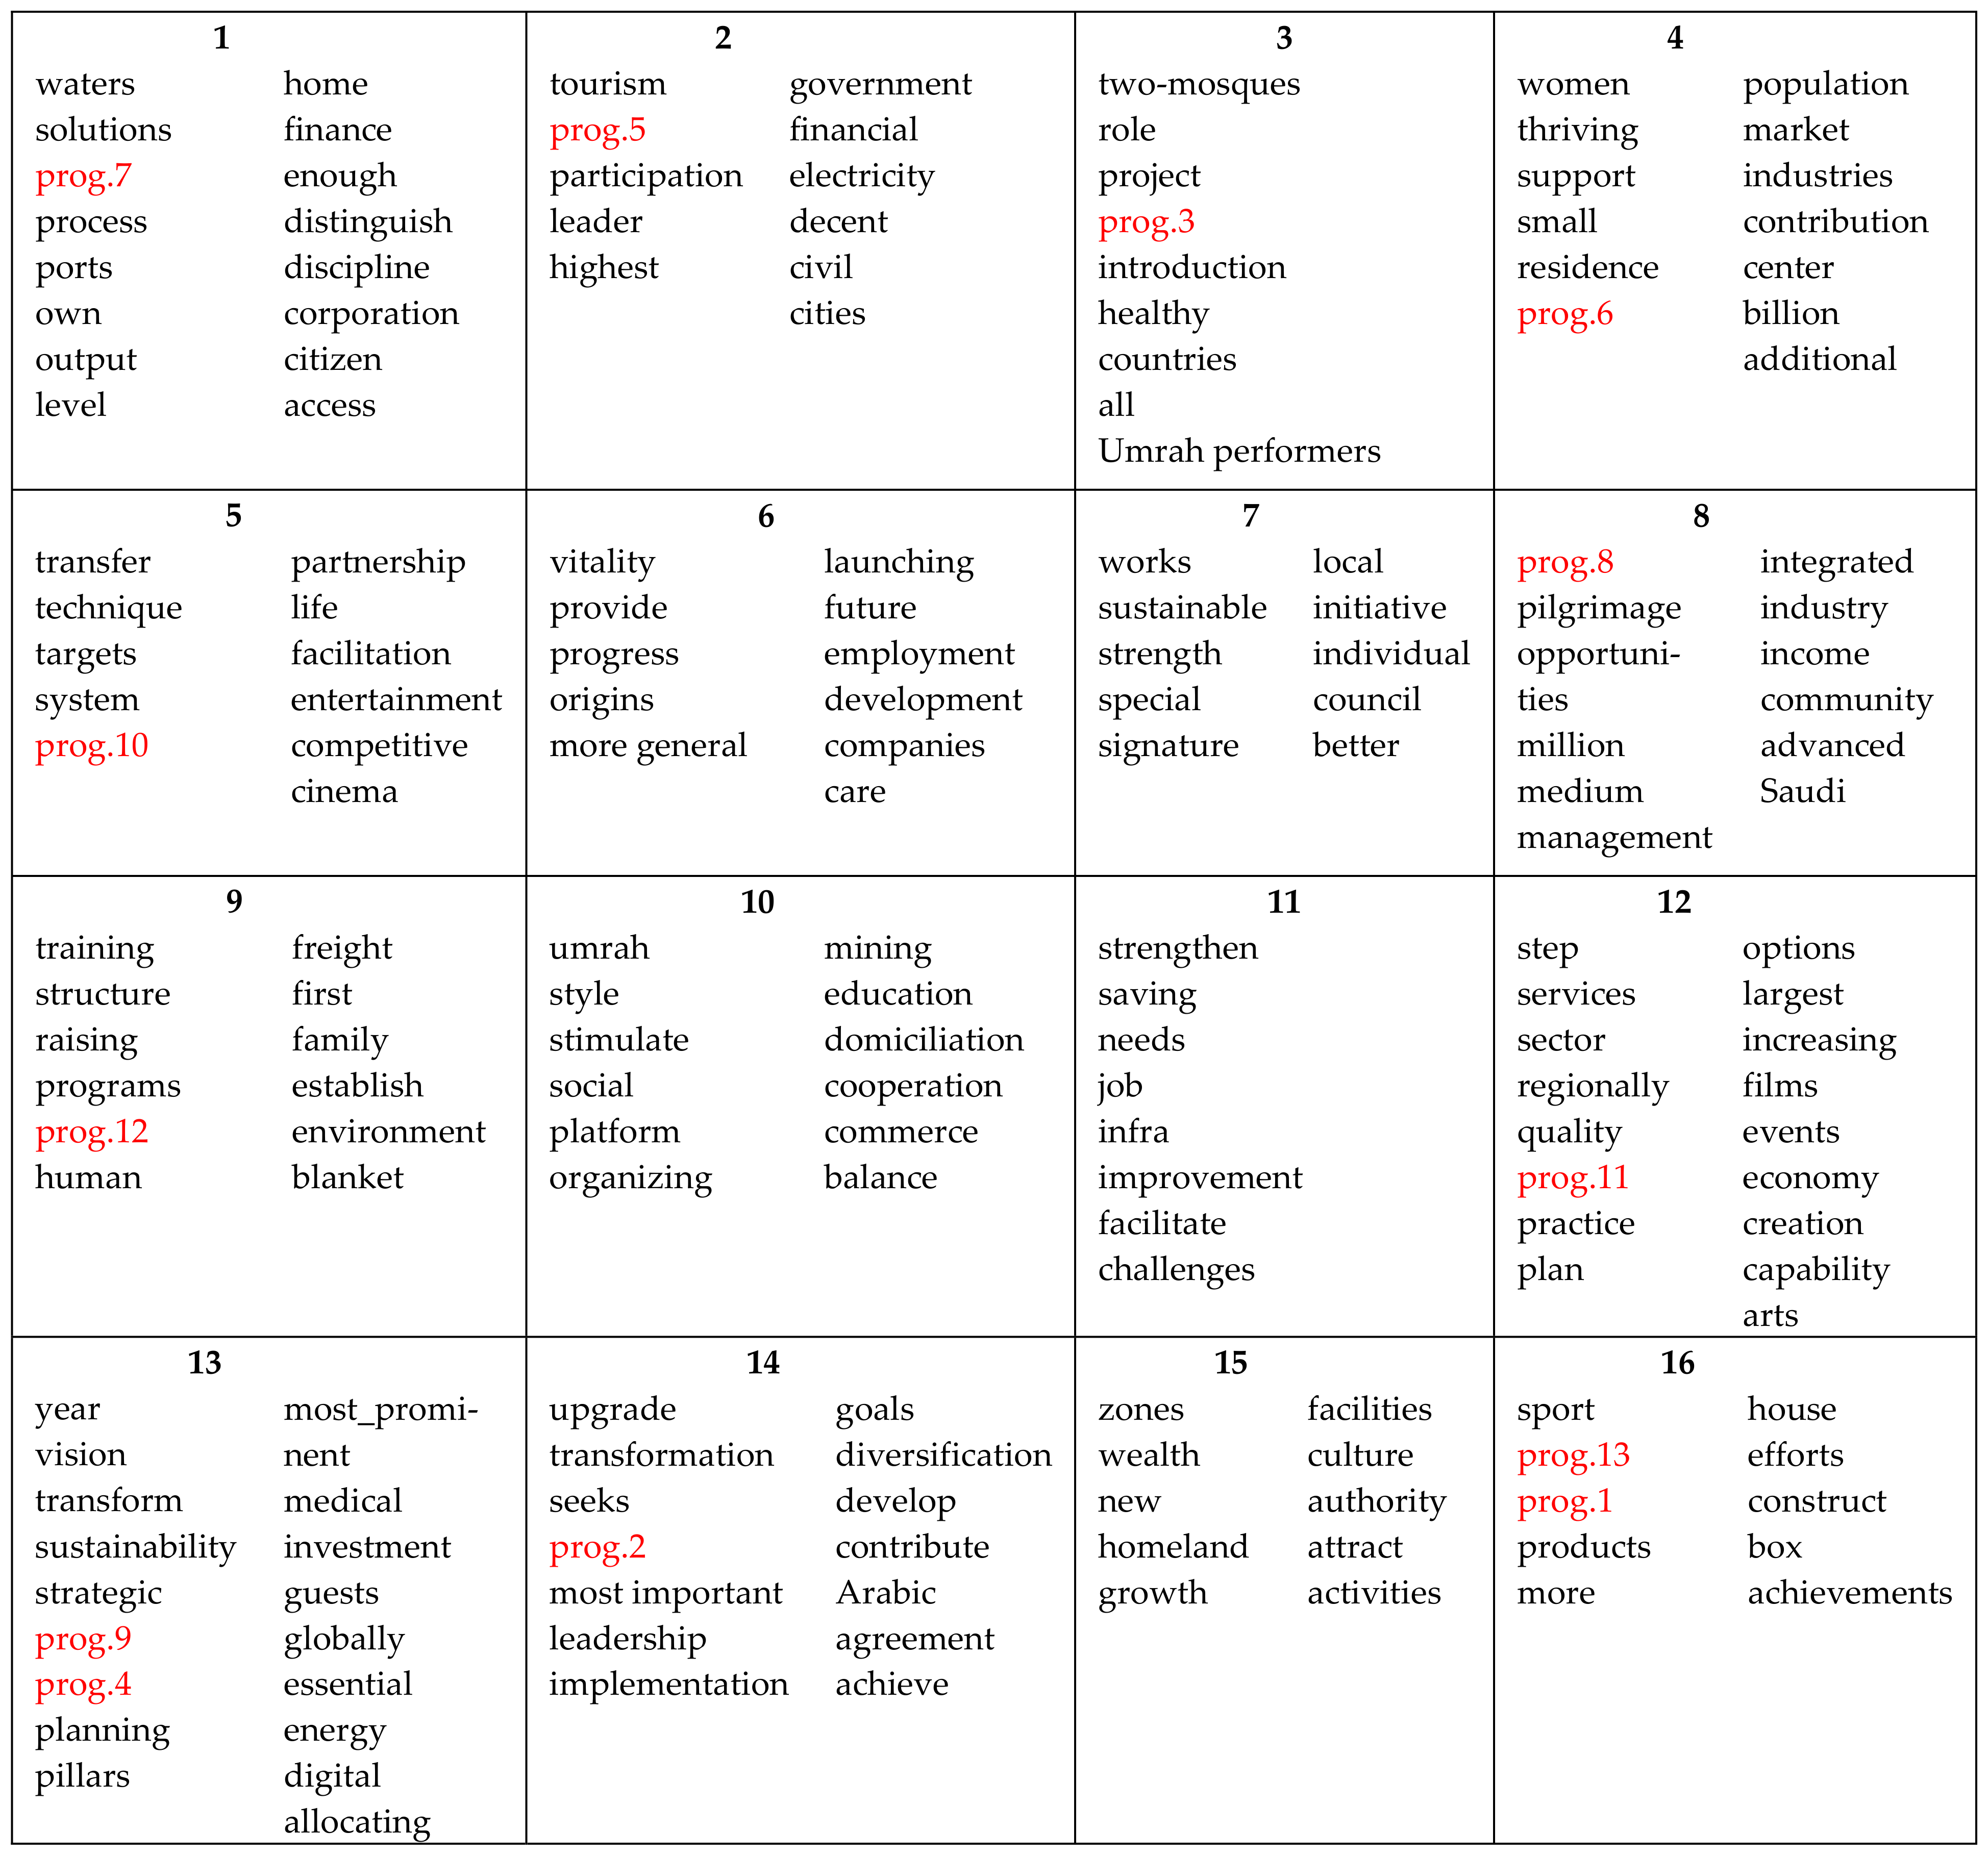
5.3. Classification Results: Kohonen Map

Unlike factorial plans, the Kohonen self-organizing map allows a more simplified visualization by representing simultaneously and without superposition, the rows and the columns of the contingency table presenting similar profile, in rectangular or polygonal windows. A Kohonen map representation is given in Figure 5 where each window regroups co-occurring graphical forms. The modalities of the variable “program” figure also in different windows of the map. This graph allows then a quickly identification of the words co-occurrences and the lexical proximities between the modalities.
A comparable synthesis to that resulting from the correspondence analysis (Figure 4) is obtained. For example, class 13 of Figure 5, characterized by the modalities (prog.4) and (prog.9), and class 16 of the same figure, characterized by the modalities (prog.1) and (prog.13), were characterized by neighboring graphical forms in the two representations (“vision” “strategic”, “planning”, “investment”, etc., for class 13 and “more”, “house”, “construct”, etc., for class 16). These two categories were distant on the two representations, which was the case for the other classes. For example, in class 9, the modality (prog.12) was detected in proximity of the graphical forms “training”, “structure”, “raising”, “programs”, etc., situated far away, on the two figures, from class 12 where the modality (prog.11) was in proximity of the words “regionally”, “increasing”, “quality”, “arts”, etc. These findings show that the wavelet method maintained the complementarity aspect between factorial analysis and classification methods, which proves its efficiency for textual data analysis.

6. Further Discussion

There are many different points in the Fourier analysis relative to the wavelet one. One simple task resides in the fact that two different signals and/or images may have the same Fourier transform. Moreover, in Fourier transform useful information in the signal/image may be dispersed on the whole frequency domain and thus may not be detected by the transform. This is what we call the localization property. Indeed, compared to Fourier, wavelet transform permits a well localization in both time and frequency, and permits besides to analyze the data according to the scale. From the point of view relative to the frequency content, a stationarity character is always assumed on the whole-time domain for the Fourier analysis. From the point of view of localization, any modification and/or change at a point in the time domain will be reflected in the Fourier transform sense on the whole domain. Furthermore, the wavelet decomposition of signals permits an independent component-wise analysis. Fourier transform could not detect simultaneously long-term and high-frequency movements, especially for non-stationary signals.
Related to the present subject, the procedure applied in our case can also be viewed as a wavelet filtering of a noisy image. In such a purpose, the procedure consists of removing the detail coefficients, which are below a fixed threshold. In the case of Fourier transform, the coefficients in the frequency domain below a certain bandwidth are removed. Due to the localization property, the wavelet method in this case is performant as the Fourier one needs a large number of coefficients, which may affect the local character of the image. This downside does not occur for the wavelet filtering as it permits to estimate the scale or the level of best wavelet decomposition. A scale-wise or level-wise analysis provides more understanding of the image or the series.
Already with relation to the present work, which may be subscribed also in the whole topic of socioeconomic studies, the wavelet decomposition permits to observe economic actions, decisions, income and money at different scales, by acting the forecasting at the scale levels instead of the whole-time domain. In [22], for example, the author discussed the relationship between income and money by applying causality tests to the wavelet series and stated that at the lowest timescales, money is caused by the income Granger. However, and on the contrary, income is caused by money Granger, at business-cycle periods. Moreover, the Granger causality may go in both directions at the highest scales. More about these facts may be found in [22] and the references therein.
Finally, the application of the wavelet transform in the case of the contingency table permits one to decompose the latter according to the different multiresolution levels, and next to apply the best decomposition for the purpose of denoising and the corresponding analysis.

7. Conclusions

In the present work, a contribution in wavelet theory applied for the purpose of textual analysis was developed. Recall that the use of wavelet theory in the processing of textual data is in fact an area that is not yet very widespread. In this paper, the main focuses were on the circulation, in electronic media, of the KSA 2030-vision. The hybrid method based on combining wavelet thresholding and correspondence analysis was proved to be efficient and performant for textual data. Removing the lexical noise from the contingency table constructed minimized the loss of information and yielded an improvement of the rate of inertia explained by the first factorial plan. The application of the wavelet method permitted to maintain a complementarity aspect between factorial and classification methods, which permits in turns a high-quality representation and an interpretable factorial plan.
The wavelet correspondence analysis applied permits one to understand and predict the situation in the KSA market such as Saudi Arabia. The idea starts by constructing a contingency table from a corpus constituted from social media articles about the 2030 vision of the Kingdom. It seems that the construction of contingency tables suffers always from noise due to many factors such as human mistakes. To remove the noise, the wavelet theory is then intervened by applying precisely the concept of wavelet thresholding.
The results of the present paper showed that the joint use of correspondence analysis and the wavelet thresholding in textual data analysis was efficient and performant in analyzing textual data and conducting good conclusions. The denoised contingency table permitted an improvement of the inertia rate explained by the principal factorial plan obtained by the application of the correspondence analysis. The quantity of lost information was minimized with an information rate being maximal and a number of axes being small. The wavelet denoising permitted also a good quality of factorial plan representing, provided with a good exploitation of the classification results. This in turns leaded to valuable interpretations.
The present work with the few ones applying wavelets in the textual analysis field may lead to many future directions, such as mixed languages’ corpuses, without the need for translation, which may induce ambiguous results due to confusions in the senses issued from translation for example, and the choice of the good word that reflects the best the meaning from a language to another. A serious and challenging idea may be realized by generalizing the method to more large texts, such as written media, which will induce a big data bases, and thus a complication in the processing and the analysis. Duplicated and in-reply tweets were eliminated from the data.
Related to the case study, the present work permits one to conclude many facts about the situation in the Saudi market relative to the 2030-vision. From the socioeconomic point of view, and related to the impact of social media on the economic situation, which was the main aim of the study, we easily notice that the proximities obtained by the factorial plan and the Kohonen map visualization enable a comprehensive look at the main social, religious and economic objectives of the Saudi 2030-vision related to projects and events carried out by the KSA vision. For example, the results emphasized that the political plan is moving mainly towards the privatization of the economic system leading to the provision of more and better social and economic opportunities. Moreover, the results highlighted the social transformations implemented by the KSA vision that aims for the improvement of the environmental living of Saudis, provided with an increase in women participation in the labor market. At the same time, the results showed that the vision seeks to strengthen the national belonging sense of Saudi citizens by fostering a set of Islamic and national values.
These observations will have a positive impact on the future situation of the market, especially, with a modernized environment living, a civilized society open to foreign citizens. These characteristics encourages investors to invest strongly in the market. This will open opportunities for citizens for more jobs, and thus will allow a decrease in the unemployment rate. These factors in turn are causes of a political stability in the kingdom.
It will be of interest to apply the method to other markets and to deduce eventual comparisons and eventual dependences between markets, such as GCC, Asian and also petroleum exportations’ countries, which are currently searching to reduce the dependency of their economy to petroleum, especially with the appearance and the development of other sources such as solar energy and clean energy in general.

Author Contributions

Conceptualization, M.S.B., A.B.M. and H.A.; methodology, M.S.B., A.B.M. and H.A.; software, M.S.B., A.B.M. and H.A.; validation, M.S.B., A.B.M. and H.A.; formal analysis, M.S.B., A.B.M. and H.A.; investigation, M.S.B., A.B.M. and H.A.; resources, M.S.B., A.B.M. and H.A.; data curation, M.S.B., A.B.M. and H.A.; writing—original draft preparation, M.S.B., A.B.M. and H.A.; writing—review and editing, M.S.B., A.B.M. and H.A.; visualization, M.S.B., A.B.M. and H.A.; supervision, M.S.B., A.B.M. and H.A.; project administration, M.S.B., A.B.M. and H.A.; funding acquisition, M.S.B., A.B.M. and H.A. All authors have read and agreed to the published version of the manuscript.

Funding

This research was funded by the deanship of scientific research; University of Tabuk, Saudi Arabia, grant number S-0343-1440.

Institutional Review Board Statement

Not applicable.

Informed Consent Statement

Not applicable.

Data Availability Statement

Not applicable.

Acknowledgments

The authors would like to thank the editor(s) of Mathematics and the anonymous reviewers for the interest given to our work and for the valuable comments which improved the paper. The authors would like also to thank Mohamed Guesmi from the center of English language at the University of Tabuk for the careful revision of the English language. The authors finally would like to thank the deanship of scientific research, University of Tabuk, KSA, for supporting this project.

Conflicts of Interest

The authors declare no conflict of interest.

Appendix A

The following figures are in fact reproductions of Figure 3, provided to explain it more. In Figure A1a below, the Figure 3 was reproduced by eliminating the overlapped (superposed) modalities and accumulated around the center. Figure A1b illustrates the same graph as Figure 3 from which the modalities centered at the origin were omitted. Finally, in Figure A1c, the ellipse covered the modalities whom projections on the first plan were not well represented, and which were hidden or condensed in the original Figure 3.
Figure A1. (a). A reproduction of Figure 3 by eliminating the superposed modalities. (b). A reproduction of Figure 3 by eliminating modalities centered at the origin. (c). A reproduction of Figure 3, where the ellipse covers approximately the hidden modalities whom projections on the first plan are not well represented.
Mathematics 09 01117 g0a1aMathematics 09 01117 g0a1b

References

  1. Antweiler, W.; Frank, M.Z. Is all that talk just noise? The information content of internet stock message boards. J. Financ. 2004, 59, 1259–1294. [Google Scholar] [CrossRef]
  2. Dershowitz, I.; Dershowitz, N.; Koppel, M.; Akiva, N. Unsupervised decomposition of a document into authorial components. In Proceedings of the 49th Annual Meeting of the Association for Computational Linguistics, Stroudsburg, PA, USA, 19–24 June 2011; pp. 1356–1364. [Google Scholar]
  3. Gentzkow, M.; Shapiro, J.M. What drives media slant? Evidence from U.S. daily newspapers. Econometrica 2010, 78, 35–71. [Google Scholar]
  4. Koppel, M.; Argamon, S.; Shimoni, A.R. Automatically categorizing written texts by author gender. Lit. Linguist. Comput. 2002, 17, 401–412. [Google Scholar] [CrossRef]
  5. Park, L.; Ramamohanarao, K.; Plalaniswamo, M. A novel document retrieval method using the discrete wavelet transform. ACM Trans. Inf. Syst. 2005, 23, 267–298. [Google Scholar]
  6. Smail, N. Contribution à L’analyse et à la Recherche D’information en Texte Intégral: Application de la Transformée en Ondelettes Pour la Recherche et L’analyse de Textes; Sciences de l’information et de la communication; Université Paris-Est: Paris, France, 2009. (In French) [Google Scholar]
  7. Lebart, L.; Salem, A. Statistique Textuelle; Dunod: Paris, France, 1994. [Google Scholar]
  8. Abdessalem, H.; Benammou, S. A wavelet technique for the study of economic socio-political situations in a textual analysis framework. J. Econ. Stud. 2018, 45, 586–597. [Google Scholar] [CrossRef]
  9. Greenacre, M.J. Correspondence Analysis in Practice, 2nd ed.; Chapman and Hall, CRC: London, UK, 2007. [Google Scholar]
  10. Greenacre, M.J. Theory and Applications of Correspondence Analysis; Academic Press: London, UK, 1984. [Google Scholar]
  11. Kohonen, T. Self-organized formation of topologically correct feature maps. Biol. Cybern. 1982, 43, 56–59. [Google Scholar] [CrossRef]
  12. Fischer, P.; Baudoux, G.; Wouthers, J. Wavepred: A wavelet-based algorithm for the prediction of transmembrane proteins. Comm. Math. Sci. 2003, 1, 44–56. [Google Scholar]
  13. Arfaoui, S.; Ben Mabrouk, A.; Cattani, C. New Type of Gegenbauer-Hermite Monogenic Polynomials and Associated Clifford Wavelets. J. Math. Imaging Vis. 2020, 62, 73–97. [Google Scholar] [CrossRef]
  14. Arfaoui, S.; Ben Mabrouk, A.; Cattani, C. New Type of Gegenbauer-Jacobi-Hermite Monogenic Polynomials and Associated Continuous Clifford Wavelet Transform. Acta Appl. Math. 2020, 170, 1–35. [Google Scholar] [CrossRef]
  15. Bin, Y.; Meng, X.-H.; Liu, H.-J.; Wang, Y.-F. Prediction of transmembrane helicals segments in transmembrane proteins based on wavelet transform. J. Shangahai Univ. 2006, 10, 308–318. [Google Scholar]
  16. Bin, Y.; Zhang, Y. A simple method for predicting transmembrane proteins based on wavelet transform. Int. J. Biol. Sci. 2013, 9, 22–33. [Google Scholar]
  17. Cattani, C. Fractals and hidden symmetries in DNA. Math. Prob. Eng. 2010, 2010, 507056. [Google Scholar] [CrossRef] [Green Version]
  18. Cattani, C. Wavelet algorithms for DNA analysis. In Algorithms in Computational Molecular Biology: Techniques, Approaches and Applications; Elloumi, A.M., Zomaya, Y., Eds.; Wiley Series in Bioinformatics; John Wiley & Sons: Hoboken, NJ, USA, 2011; pp. 799–842. [Google Scholar]
  19. Cattani, C. On the existence of wavelet symmetries in archaea DNA. Comput. Math. Methods Med. 2012, 2012, 673934. [Google Scholar] [CrossRef] [Green Version]
  20. Cattani, C. Complexity and symmetries in DNA sequences. In Handbook of Biological Discovery; Elloumi, A.M., Zomaya, Y., Eds.; Wiley Series in Bioinformatics; John Wiley & Sons: Hoboken, NJ, USA, 2013; pp. 700–742. [Google Scholar]
  21. Cattani, C.; Bellucci, M.; Scalia, M.; Mattioli, G. Wavelet analysis of correlation in DNA sequences. Izv. Vyss. Uchebn. Zaved. Radioelektron 2006, 29, 50–58. [Google Scholar]
  22. Schleicher, C. An Introduction to Wavelets for Economists; Staff Working Paper; Bank of Canada: Ottawa, ON, Canada, 2002. [Google Scholar]
  23. Audit, B.; Vaillant, C.; Arneodo, A.; d’Aubenton-Carafa, Y.; Thermes, C. Wavelet analysis of DNA bending profiles reveals structural constraints on the evolution of genomic sequences. J. Biol. Phys. 2004, 30, 33–81. [Google Scholar] [CrossRef]
  24. Coifman, R.; Wickerhauser, M. Adapted wave for denoising for medical signals and images. IEEE Eng. Med. Biol. Mag. 1995, 14, 578–586. [Google Scholar] [CrossRef] [Green Version]
  25. Ibrahim Mahmoud, M.M.; Ben Mabrouk, A.; Abdallah Hashim, M.H. Wavelet multifractal models for transmembrane proteins-series. Int. J. Wavelets Multires Inf. Process. 2016, 14, 1650044. [Google Scholar] [CrossRef]
  26. Kosnik, L.R. Determinants of contract completeness: An environmental regulatory application. Int. Rev. Law Econ. 2014, 37, 198–208. [Google Scholar] [CrossRef]
  27. Muller, C. La Statistique Lexicale. In Langue Française. Le Lexique; n°2; Guilbert, L., Ed.; Larousse: Paris, France, 1969; pp. 30–43. Available online: https://www.persee.fr/issue/lfr_0023-8368_1969_num_2_1 (accessed on 1 March 2021).
  28. Lebart, L. Validité des visualisations de données textuelles. In Le Poids des Mots, Actes des JADT04: Septièmes Journées Internationales D’Analyse Statistique des Données Textuelles; Purnelle, G., Fairon, C., Dister, A., Eds.; Presse Universitaires de Louvain: Ottignies-Louvain-la-Neuve, Belgium, 2004; pp. 708–715. [Google Scholar]
  29. Lebart, L.; Piron, M.; Morineau, A. Statistique Exploratoire Multidimensionnelle; Dunod: Paris, France, 1995. [Google Scholar]
  30. Lebart, L.; Salem, A. Analyse Statistique des Données Textuelles: Questions Ouvertes et Lexicométrie; Dunod: Paris, France, 1988. [Google Scholar]
  31. Fallery, B.; Rodhain, F. Quatre approches pour l’analyse de données textuelles: Lexicale, linguistique, cognitive, thématique, Congrès de l’AIMS. In Proceedings of the XVIème Conférence Internationale de Management Stratégique, Montréal, QC, Canada, 6–9 June 2007. [Google Scholar]
  32. Labbé, D. Normes de Dépouillement et Procédures D’analyse des Textes Politiques; Cahier du CERAT: Grenoble, France, 1990. [Google Scholar]
  33. Lemaire, B. Limites de la lemmatisation pour l’extraction de significations. In Proceedings of the Actes des 9émes Journées Internationales d’Analyse Statistique des Données Textuelles, Lyon, France, 12–14 March 2008; Volume 2, pp. 725–732. Available online: http://lexicometrica.univ-paris3.fr/jadt/jadt2008/tocJADT2008.htm (accessed on 1 March 2021).
  34. Benzecri, J.-P. L’analyse des Données: L’analyse des Correspondances; Dunod: Paris, France, 1973. [Google Scholar]
  35. Escofier, B. Analyse factorielle et distances répondant au principe d’équivalence distributionnelle. Rev. Stat. Appliquée 1978, 26, 29–37. [Google Scholar]
  36. Escofier, B.; Pagès, J. Analyses Factorielles Simples et Multiples, Objectifs, Méthodes et Interprétation; Dunod: Paris, France, 2008. [Google Scholar]
  37. Graps, A. An introduction to wavelets. IEEE Comput. Sci. Eng. 1995, 2, 50–61. [Google Scholar] [CrossRef]
  38. Weedon, G.P. Time Series Analysis and Cyclostratigraphy: Examining Stratigraphic Records of Environmental Cycles; Cambridge University Press: Cambridge, UK, 2003. [Google Scholar]
  39. Daubechies, I. Ten lectures on wavelets. In Proceedings of the CBMS-NSF Regional Conference Series in Applied Mathematics, Society for Industrial and Applied Mathematics, Philadelphia, PA, USA, 1 May 1992; Volume 61. [Google Scholar]
  40. Daubechies, I. Orthonormal bases of wavelets with finite support—connection with discrete filters. In Proceedings of the 1987 International Workshop on Wavelets and Applications, Marseille, France, 14–18 December 1987; Combes, J.M., Grossmann, A., Tchamitchian, P.H., Eds.; Springer: Berlin/Heidelberg, Germany, 1989. [Google Scholar]
  41. Härdle, W.; Kerkyacharian, G.; Picard, D.; Tsybakov, A. Wavelets Approximation and Statistical Applications, Lecture Notes in Statistics; Springer: Berlin/Heidelberg, Germany, 1998; p. 129. [Google Scholar]
  42. Percival, D.B.; Walden, A.T. Wavelet Methods for Time Series Analysis; Cambridge University Press: Cambridge, UK, 2000. [Google Scholar]
  43. Nason, G.P.; Silverman, B.W. The stationary wavelet transform and some statistical applications. Wavelets Stat. Lect. Notes Stat. 1995, 103, 281–300. [Google Scholar]
  44. Aktan, B.; Ben Mabrouk, A.; Ozturk, M.; Rhaiem, N. Wavelet-Based Systematic Risk Estimation An Application on Istanbul Stock Exchange. Int. Res. J. Financ. Econ. 2009, 23, 34–45. [Google Scholar]
  45. Ben Mabrouk, A.; Rhaiem, N.; Benammou, S. Estimation of capital asset pricing model at different time scales, Application to the French stock market. Int. J. Appl. Econ. Financ. 2007, 1, 79–87. [Google Scholar]
  46. Ben Mabrouk, A.; Rhaiem, N.; Benammou, S. Wavelet estimation of systematic risk at different time scales, Application to French stock markets. Int. J. Appl. Econ. Financ. 2007, 1, 113–119. [Google Scholar]
  47. Ben Mabrouk, A.; Ben Abdallah, N.; Dhifaoui, Z. Wavelet Decomposition and Autoregressive Model for the Prevision of Time Series. Appl. Math. Comput. 2008, 199, 334–340. [Google Scholar]
  48. Ben Mabrouk, A.; Kortas, H.; Dhifaoui, Z. A wavelet support vector machine coupled method for time series prediction. Int. J. Wavelets Multiresolution Inf. Process. 2008, 6, 1–17. [Google Scholar] [CrossRef]
  49. Ben Mabrouk, A.; Kortass, H.; Benammou, S. Wavelet Estimators for Long Memory in Stock Markets. Int. J. Theor. Appl. Financ. 2009, 12, 297–317. [Google Scholar] [CrossRef]
  50. Ben Mabrouk, A.; Kahloul, I.; Hallara, S.-E. Wavelet-Based Prediction for Governance, Diversification and Value Creation Variables. Int. Res. J. Financ. Econ. 2010, 60, 15–28. [Google Scholar]
  51. Ben Mabrouk, A.; Ben Abdallah, N.; Hamrita, M.E. A wavelet method coupled with quasi self similar stochastic processes for time series approximation. Int. J. Wavelets Multiresolution Inf. Process. 2011, 9, 685–711. [Google Scholar]
  52. Ben Mabrouk, A.; Zaafrane, O. Wavelet Fuzzy Hybrid Model for Physico Financial Signals. J. Appl. Stat. 2013, 40, 1453–1463. [Google Scholar] [CrossRef]
  53. Ben Mabrouk, A. Wavelet-Based Systematic Risk Estimation: Application on GCC Stock Markets: The Saudi Arabia Case. Quant. Financ. Econ. 2020, 4, 542–595. [Google Scholar]
  54. Conlon, T.; Crane, M.; Ruskin, H.J. Wavelet multiscale analysis for hedge funds: Scaling and strategies. Phys. A 2008, 387, 5197–5204. [Google Scholar] [CrossRef] [Green Version]
  55. Gencay, R.; Selcuk, F.; Whitcher, B. An Introduction to Wavelets and Other Filtering Methods in Finance and Economics; Academic Press: Waltham, PA, USA, 2002. [Google Scholar]
  56. Donoho, D.; Johnstone, I. Ideal spatial adaptation by wavelet shrinkage. Biometrika 1994, 81, 425–455. [Google Scholar] [CrossRef]
  57. Donoho, D.; Johnstone, I. Denoising by soft thresholding. IEEE Trans. Inf. Theory 1995, 41, 613–627. [Google Scholar] [CrossRef] [Green Version]
  58. Thaicharoen, S.; Altman, T.; Cios, K.J. Structure-Based Document Model with Discrete Wavelet Transforms and Its Application to Document Classification; Seventh Australasian Data Mining Conference (AusDM 2008), Glenelg, Australia. Conferences in Research and Practice in Information Technology (CRPIT); Australian Computer Society Inc.: Sydney, Australia, 2008; Volume 87. [Google Scholar]
  59. Miller, N.E.; Wong, P.C.; Brewster, M.; Foote, H. Topic lands—A wavelet based text visualization system. In Proceedings of the Conference on Visualization ’98, Research Triangle Park, NC, USA, 18–23 October 1998; pp. 189–196. [Google Scholar]
  60. Jaber, T.; Amira, A.; Milligan, P. A novel approach for lexical noise analysis and measurement in intelligent information retrieval. In Proceedings of the IEEE International Conference Pattern Recognition, Hong Kong, China, 20–24 August 2006; Volume 3, pp. 370–373. [Google Scholar]
Figure 1. The organigram of wavelet method for textual data processing.
Mathematics 09 01117 g001
Figure 2. The wavelet analyzing procedure.
Mathematics 09 01117 g002
Figure 3. The first factorial plan from correspondence analysis on the lexical table (before denoising).
Mathematics 09 01117 g003
Figure 4. The first factorial plan from correspondence analysis on the denoised lexical table.
Mathematics 09 01117 g004
Figure 5. Kohonen map visualization.
Mathematics 09 01117 g005
Table 1. Comparison between existing methods of textual analysis.
Quantitative AnalysisMultidimensional Analysis
PrincipleQuantitative study of the text vocabulary (richness, distribution of words, etc.).Analysis and visualization of the text content using factorial correspondence analysis and automatic classification.
Steps-Segmentation of the corpus and identification of the graphical forms.
-Assigning a sequence number to all the occurrences of the same graphical form [7,28,29,30].
-Identifying graphical forms.
-Keeping forms that carry information.
-The graphical forms are subject to a lemmatization process.
-A lexical matrix, considered as a particular contingency table, is constructed. The graphical forms are the rows of this table, while the columns correspond to the corpus parts [28].
AdvantagesExtremely helpful in the analysis of the vocabulary of different texts, the study of the evolution of an author style, and the comparison of many authors’ styles [27].Application of these techniques has proved a great value in the analysis of political speeches, interviews, open questions in surveys, electronic data, etc. This category of lexical analysis concentrates on the content of the texts rather than their forms, which make it a valuable tool for the comprehension of the corpus content.
DisadvantagesThe main disadvantage of these techniques is that they give priority to the analysis of the form of the texts while neglecting the content.Lexical table constructed could be noisy by various errors occurred while entering or segmentating [31]. Errors related to the lemmatization step (combining homonyms or polysemous words) affect the results of the multidimensional data analysis methods [32,33].
Table 2. The 13 programs of the KSA 2030-vision.
ProgramCorresponding Sector
Program1Quality of Life Program
Program2Financial Sector Development Program
Program3Housing Program
Program4Fiscal Balance Program
Program5National Transformation Program
Program6Public Investment Fund Program
Program7Privatization Program
Program8National Companies Promotion Program
Program9National Industrial Development and Logistics Program
Program10Strategic Partnerships Program
Program11Hajj and Umrah Program
Program12Human Capital Development Program
Program13Saudi Character Enrichment Program
Table 3. Example of the tweets collected (translated from original Arabic texts).
DateProgramText
03/2020Housing programThe housing program worked on using modern and varied construction techniques, which contributed to the fast and high quality delivery of housing units.
05/2019Pilgrims’ and visitors’ servicesPilgrims’ and visitors’ service program is planning to reach 30 million pilgrims annually by 2030.
03/2019Human capacity developmentThe human capabilities development program aims to achieve strategic objectives of the vision 2030.
Building an integrated educational journey (lifelong learning)
-Comprehensive support for talented people and developing their skills.
-Enrolling in prestigious universities.
-Improving equal access to quality education for all.
11/2018National entrepreneurshipThe national company leadership program works to raise the percentage of local content and diversify the economy by creating opportunities for small and medium-sized companies.
11/2018Strategic partnershipsThe strategic partnerships program contributes to achieving the Saudi Vision 2030 by building and deepening strategic economic partnerships at the regional and global level.
10/2018Public investment fundsThe public investment fund program works to enhance the role of the public investment fund as the effective engine to diversify the economy in the Kingdom, and to develop specific strategic sectors through developing and maximizing the impact of the fund’s investments.
08/2018Privatization programPrivatization program is one of the programs to achieve Saudi Vision 2030 for the development of local and foreign investments. The involvement of the private sector in the process of adopting regulations and drawing up investment policies, including the privatization system, is a pioneering step to enhance the competitiveness of the investment environment and achieve the highest possible level of transparency and governance.
Table 4. The factors eigenvalues and variance (before denoising).
FactorEigenvalueExplained Variance (%)Cumulative Variance (%)
10.2396416215.2215.22
20.2058239213.0728.29
30.1735001411.0239.31
40.152087239.6648.96
50.141970419.0257.98
60.131691758.3666.34
70.120964967.6874.02
80.102592536.5180.54
90.095384816.0686.60
100.085617715.4492.03
110.071467564.5496.57
120.053980473.43100.00
Table 5. Relative and absolute contribution of the variable “program” modalities (before denoising).
Absolute ContributionRelative Contribution
Axis 1Axis 2Axis 1Axis 2
prog.18.8019.900.150.29
prog.22.802.700.080.07
prog.30.0015.500.000.23
prog.45.100.300.100.00
prog.57.700.100.200.00
prog.66.9012.500.120.18
prog.71.201.100.040.03
prog.87.002.600.160.05
prog.91.103.800.030.11
prog.104.803.200.090.05
prog.1151.3017.700.640.19
prog.121.3016.300.020.20
prog.132.004.400.040.07
Table 6. Variance explained by the first two factors (after denoising).
1st Axis Explained Variance (%)2nd Axis Explained Variance (%)Cumulative Variance (%)
db4_hard45.9929.1375.12
db4_soft59.3933.7393.12
db6_hard54.6026.8381.43
db6_soft60.6434.2594.89
db8_hard46.6128.1974.80
db8_soft61.1934.7995.98
db16_har42.4324.8267.25
db16_sof61.4835.8697.34
Table 7. Relative and absolute contribution of the variable “program” modalities (after denoising).
Absolute ContributionRelative Contribution
Axis 1Axis 2Axis 1Axis 2
prog.113.404.300.830.16
prog.20.1014.900.010.95
prog.30.3014.400.030.93
prog.48.507.000.670.32
prog.51.5013.500.150.79
prog.65.309.500.480.50
prog.77.007.400.610.37
prog.813.602.600.880.10
prog.92.5013.300.230.72
prog.1012.301.100.920.05
prog.1118.000.100.990.00
prog.1213.000.900.910.04
prog.134.6011.000.410.58
Table 8. Comparison of the relative contributions of some graphical forms before and after denoising.
Before DenoisingAfter Denoising
Axe 1Axe 2Axe 1Axe 2
Training0.050.140.980.02
Partnership0.090.030.970.03
Financial0.140.090.010.97
Participation0.000.000.140.85
Tourism0.230.130.120.83
Upgrade0.230.130.010.97
Publisher’s Note: MDPI stays neutral with regard to jurisdictional claims in published maps and institutional affiliations.

