Developing and Applying a Selection Model for Corrugated Box Precision Printing Machine Suppliers

Abstract
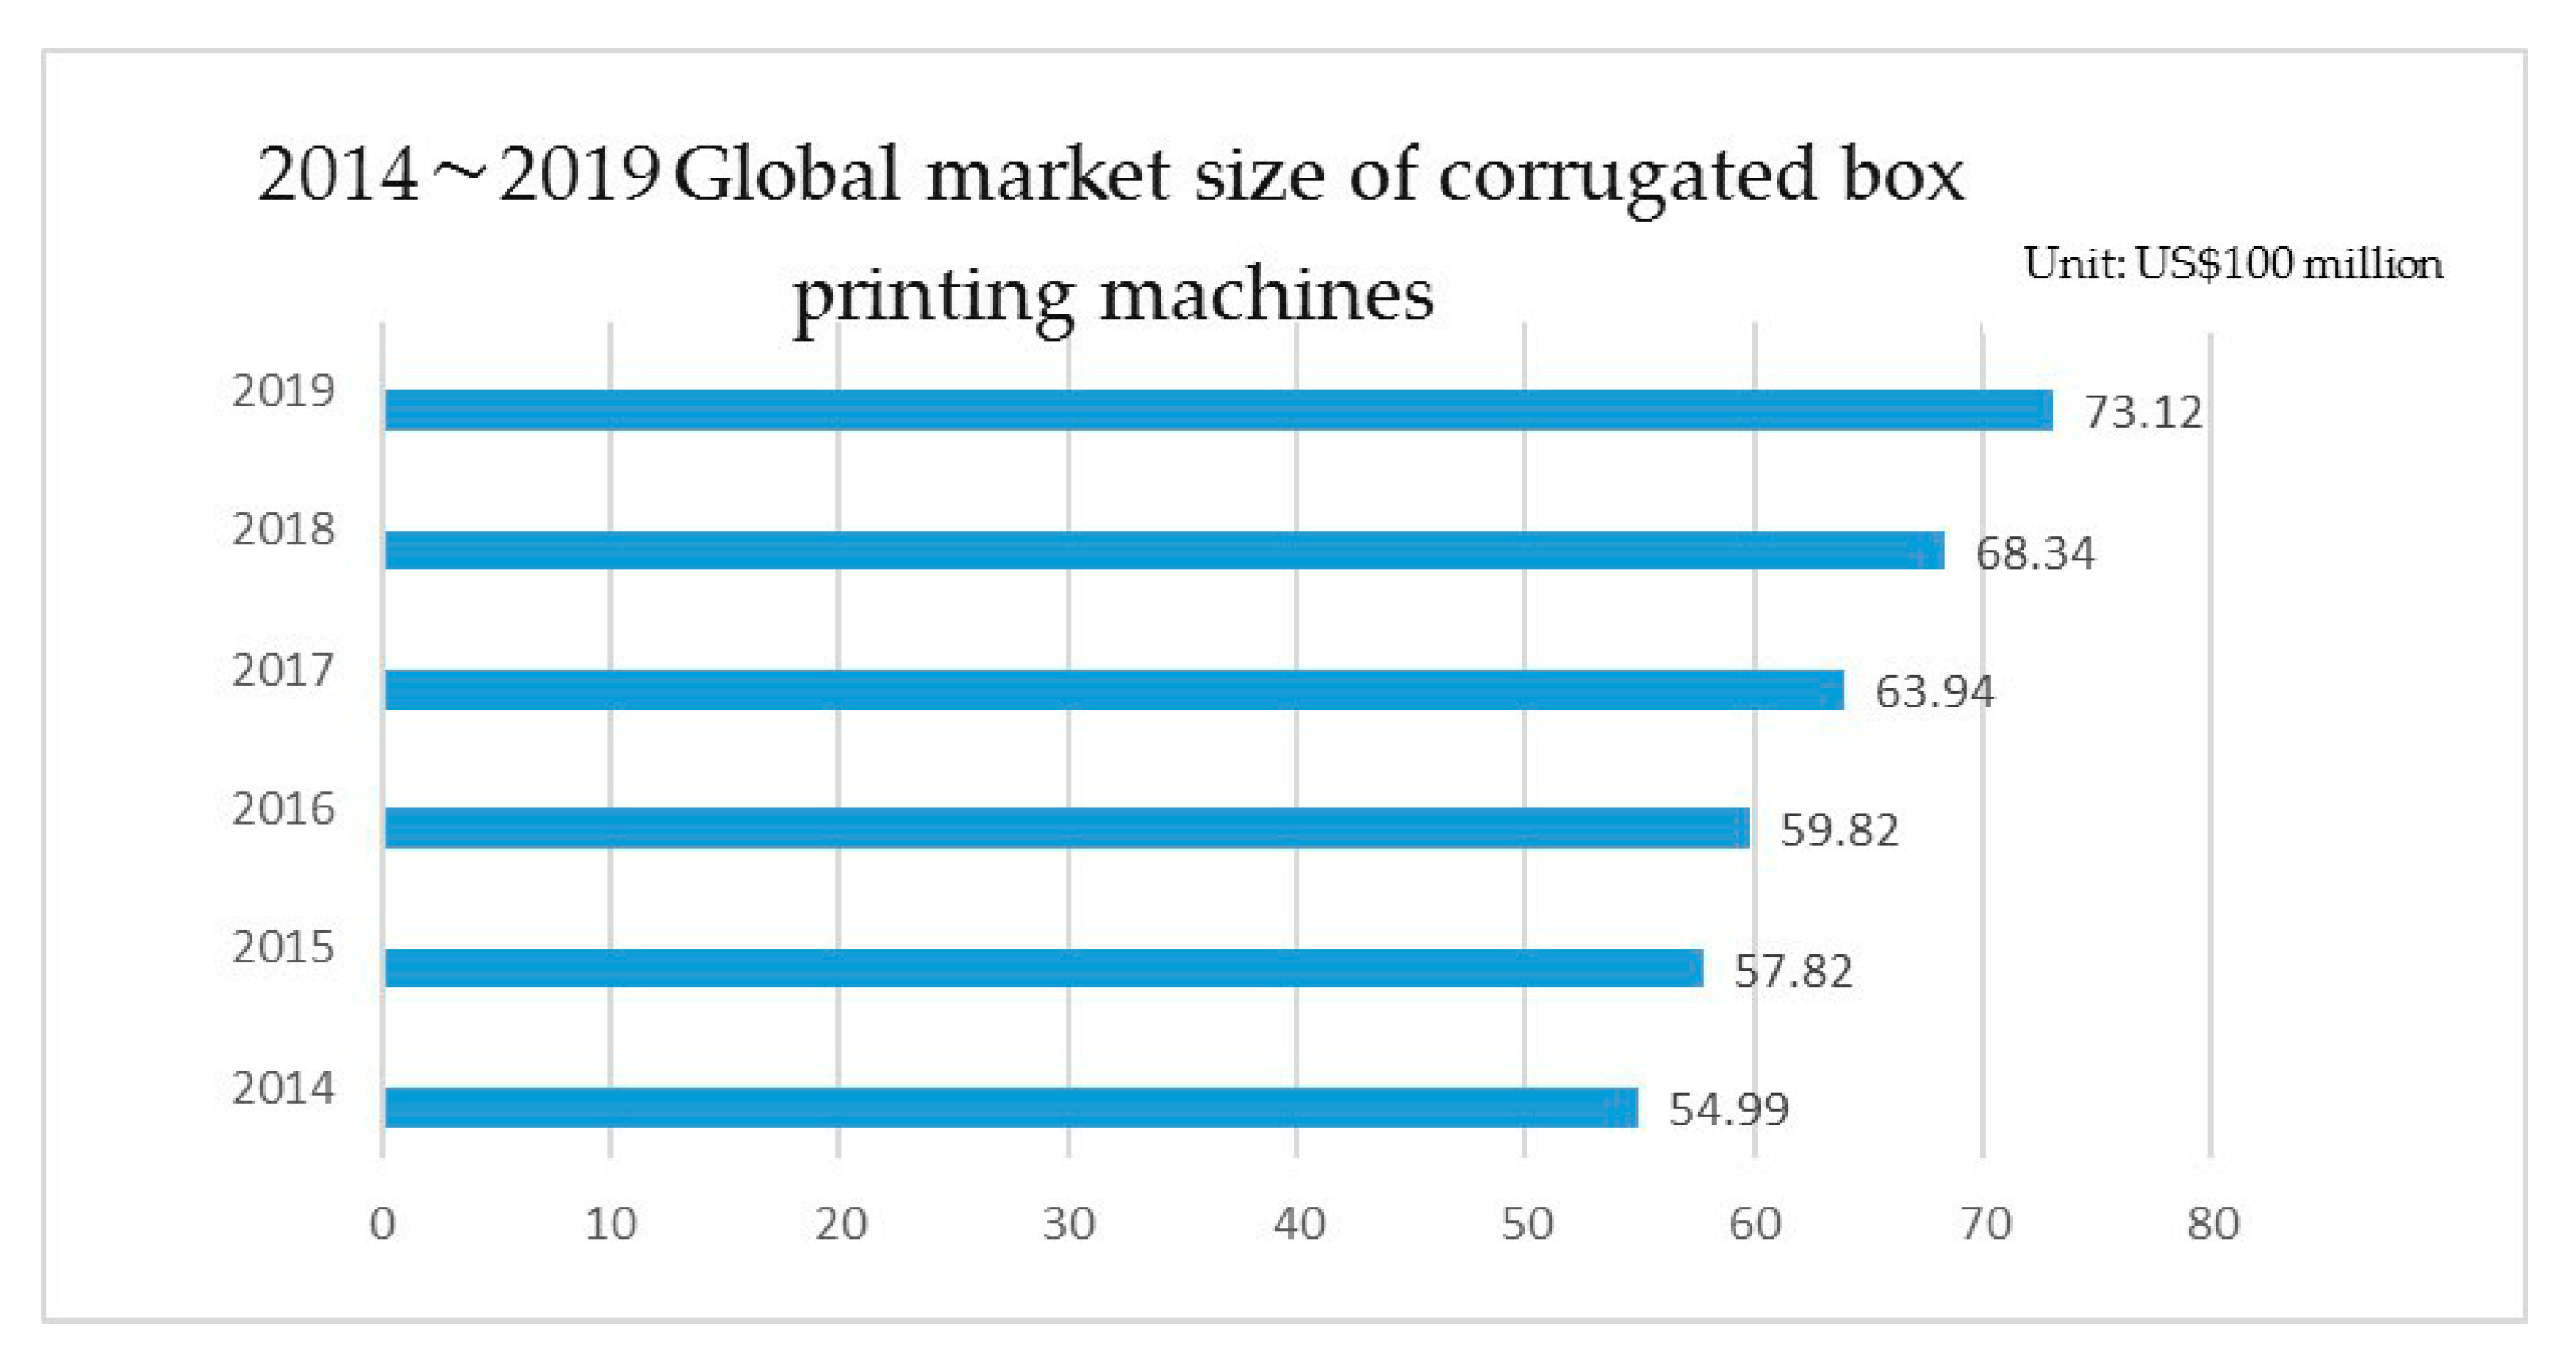
1. Introduction
2. Literature Review
2.1. Supplier Selection
2.2. Analytic Network Process
- Step 1: Constructing a Hierarchical Structure of the Problem
- Step 2: Establishing the Pairwise Comparison Matrix and Calculating the Eigenvector
- Step 3: Obtaining the Supermatrices and Weights
- Step 4: Determining the Optimal Alternative
3. Proposed Model
3.1. Stage 1: Establish a Hierarchical Network
- Step 1: Define the criteria.
- Step 2: Convene an expert panel.
- Step 3: Conduct a questionnaire survey on the panel.
- Step 4: Determine the standard of consistency within the panel.
3.2. Stage 2: Select the Optimal Supplier with the ANP
- Step 1: Establish the pairwise comparison matrix.
- Step 2: Calculate the eigenvalue and eigenvector.
- Step 3: Form the supermatrix and obtain the weights.
- Step 4: Select the optimal procurement alternative.
4. Results and Discussion
4.1. Stage 1: Establish a Hierarchical Network
- Step 1: Define the Criteria
- Step 2: Convene an Expert Panel
- Step 3: Conduct a Questionnaire Survey on the Panel
- Step 4: Determine the Standard of Consistency within the Panel
4.2. Stage 2: Select the Optimal Supplier with the ANP
- Step 1: Establish the Pairwise Comparison Matrix
- Step 2: Calculate the Eigenvalue and Eigenvector
- Step 3: Form the Supermatrix and Obtain the Weights


- Step 4: Select the Optimal Procurement Alternative

5. Conclusions
- This study convened a panel comprising 20 experts and scholars from the industry, government, and academia and employed the ANP to determine the weights of criteria as follows: quality (0.4206), commitment (0.2827), reputation (0.1327), cost (0.0985), and service attitude (0.0655).
- The three subcriteria assigned the most weight were product reliability (0.2094), accuracy and reliability (0.1244), and quality management system for substandard products (0.1139), two of which belonged to the “quality” criteria. A CBPPM manufacturer can face an enormous loss if it manufactures products using substandard components. Scrupulous product inspection and component control practices guarantee a long, useful life and high quality of machines, which in turn enhances the manufacturer’s commitment, service attitude, and reputation.
- The proposed CBPPM supplier selection model was verified to be feasible. Additionally, the robustness of this two-stage model was tested using the ranking of alternative suppliers. The ranking remained the same according to a sensitivity analysis of the five suppliers, which indicates the robustness of the model and its suitability for adoption by companies for supplier selection.
- A corporate culture emphasizing quality is commonly considered a main factor for successful total quality management [34,35]. Quality orientation is the extent to which companies emphasize quality, their attitude toward quality, and the effort they make to enhance quality. The establishment of a quality-oriented philosophy within a company creates a top-down drive for quality problem prevention and continuous improvement among company members at all levels. Forza and Filippini [36] researched total quality management practice in companies and observed that companies improved the consistency of product quality as well as customer satisfaction through emphasis on quality, maintained raw material quality by strengthening connections with suppliers, obtained improvement plans initiated by employees through employee education and training, and elevated the overall process control by enhancing communication with suppliers and employees.
Author Contributions
Funding
Data Availability Statement
Conflicts of Interest
References
- Smithers Pira. Available online: https://www.smithers.com/home (accessed on 27 May 2020).
- Tsao, C.-P. Talking about the Development of Corrugated Box Precision Printing Machine; China Packaging Federation: Beijing, China, 2011; Volume 31, pp. 59–61. [Google Scholar]
- China Packaging Federation. Development Status of Domestic and Foreign Corrugated Box Printing Machine Industry; China Packaging Federation: Beijing, China, 2011; Volume 31, pp. 31–36. [Google Scholar]
- China Packaging Federation. Available online: http://www.cpta.org.cn/ (accessed on 28 May 2020).
- Ptak, C.A.; Schragenheim, E. ERP: Tools, Techniques, and Applications for Integrating the Supply Chain; CRC Press: Boca Raton, FL, USA, 2003; pp. 9–10. [Google Scholar]
- Labib, A.W. A supplier selection model: A comparison of fuzzy logic and the analytic hierarchy process. Int. J. Prod. Res. 2011, 49, 6287–6299. [Google Scholar] [CrossRef]
- Tam, M.C.Y.; Tummala, V.M.R. An application of the AHP in vendor selection of a telecommunications system. Omega 2001, 29, 171–182. [Google Scholar] [CrossRef]
- Liao, C.N.; Kao, H.P. An integrated fuzzy TOPSIS and MCGP approach to supplier selection in supply chain management. Expert Syst. Appl. 2011, 38, 10803–10811. [Google Scholar] [CrossRef]
- Basnet, C.; Corner, F.; Wisner, F.; Tan, K.C. Banchmarking supply chain management practice in New Zealand. Supply Chain Manag. 2003, 8, 57–64. [Google Scholar] [CrossRef]
- Hsu, C.P. Procurement and Supply Management; BEST-WISE Book: Taipei, Taiwan, 2015. [Google Scholar]
- Hsu, C.P. Purchasing and Supply Management, 5th ed.; BEST-WISE Book: Taipei, Taiwan, 2017. [Google Scholar]
- Shirouyehzad, H.; Pourjavad, E. Evaluating manufacturing systems by fuzzy ANP: A case study. Appl. Manag. Sci. 2014, 6, 65–83. [Google Scholar]
- Chin, C.Y. Supplier Management Manual; Constitutional Enterprise Management (Group) Company: Taipei Taiwan, 2013. [Google Scholar]
- Pipaç, M.D. Interdependence between management, attitude and organizational behavior. Qual. Access 2015, 16, 99–104. [Google Scholar]
- Aghai, S.; Mollaverdi, N.; Sabbagh, M. A fuzzy multi-objective programming model for supplier selection with volume discount and risk criteria. Int. J. Adv. Manufact. Technol. 2014, 71, 1483–1492. [Google Scholar] [CrossRef]
- Yawar, S.A.; Seuring, S. Management of social issues in supply chains: A literature review exploring social issues, actions and performance outcomes. J. Bus. Ethics 2017, 141, 621–643. [Google Scholar] [CrossRef]
- Ramanathan, R. Supplier selection problem: Integrating DEA with the approaches of total cost of ownership and AHP. Supply Chain Manag. 2007, 12, 258–261. [Google Scholar] [CrossRef]
- Bai, C.; Sarkis, J. Integrating sustainability into supplier selection with grey system and rough set methodologies. Int. J. Prod. Econ. 2010, 124, 252–264. [Google Scholar] [CrossRef]
- Zhong, L.; Yao, L. An ELECTRE I-based multi-criteria group decision making method with interval type-2 fuzzy numbers and its application to supplier selection. Appl. Soft Comp. 2017, 57, 556–576. [Google Scholar] [CrossRef]
- Saaty, T.L. Decision Making with Dependence and Feedback: The Analytic Network Process, 1st ed.; RWS Publications: Pittsburgh, PA, USA, 1996. [Google Scholar]
- Saaty, T.L. RANK, Normalization and Idealization in the Analytic Hierarchy Process; 7th ISAHP: Bali, Indonesia, 2003. [Google Scholar]
- Momoh, J.A.; Zhu, J.Z. Application of AHP/ANP to unit commitment in the deregulated power industry. In Proceedings of the SMC’98 Conference Proceedings, 1998 IEEE International Conference on Systems, Man, and Cybernetics (Cat. No.98CH36218), San Diego, CA, USA, 14 October 1998; Volume 1, pp. 817–822. [Google Scholar]
- Saaty, T.L. Analytic Hierarchy Process: Planning, Priority Setting, Resource Allocation, 1st ed.; McGraw-Hill: New York, NY, USA, 1980. [Google Scholar]
- Lin, C.T.; Wu, C.S. Selecting marketing strategy for private hotels in Taiwan using the analytic hierarchy process. Serv. Ind. J. 2008, 28, 1077–1091. [Google Scholar] [CrossRef]
- Lin, C.T.; Tsai, M.C. Location choice for direct foreign investment in new hospitals in China by using ANP and TOPSIS. Qual. Quant. 2010, 44, 375–390. [Google Scholar] [CrossRef]
- Lin, C.T.; Hung, K.P.; Hu, S.H. A decision-making model for evaluating and selecting suppliers for the sustainable operation and development of enterprises in the aerospace industry. Sustainability 2018, 10, 735. [Google Scholar]
- Linstone, H.A.; Turoff, M. The Delphi Method: Techniques and Applications; Addison-Wesley Publishing Company: Reading, PA, USA, 1975. [Google Scholar]
- Murry, J.W.; Hommons, J.O. Delphi: A versatile methodology for conducting qualitative research. Rev. High. Educ. 1995, 18, 423–436. [Google Scholar] [CrossRef]
- Sunrise Pacific Co. Available online: http://www.sunrisemachinery.com/ (accessed on 23 June 2018).
- Chou, W.J. Supply Chain Integration Based on Fuzzy Multi-criteria Group Decision Methods. Master’s Thesis, Department of Information Management, Chaoyang University of Technology, Taichung City, Taiwan, 2006. [Google Scholar]
- Lawshe, C.H. A quantitative approach to content validity. Person. Psychol. 1975, 28, 563–575. [Google Scholar] [CrossRef]
- Waltz, C.W.; Strickland, O.L. Lenz ER: Measurement in Nursing Research; F.A. Davis Co.: Philadelphia, PA, USA, 1991. [Google Scholar]
- Chang, S.S. Fuzzy Multi-Criteria Decision Making for Evaluation Method, 2nd ed.; Wu-Nan Book Inc.: Taipei, Taiwan, 2016; pp. 547–576. [Google Scholar]
- Saraph, J.V.; Sebastian, R.J. Developing a quality culture. Qual. Progr. 1993, 26, 73–78. [Google Scholar]
- Westbrook, J.D. Organizational culture and its relationship to TQM. Ind. Manag. 1993, 35, 1–3. [Google Scholar]
- Forza, C.; Filippini, R. TQM impact on quality conformance and customer satisfaction: A causal model. Int. J. Prod. Econ. 1998, 55, 1–20. [Google Scholar] [CrossRef]


| Criteria | Definition | Subcriteria |
|---|---|---|
| Organization management | Effective process of realizing organizational goals through interaction, coordination, collaboration, and task delegation among all organization members, facilitated by establishing organizational structure, job roles or titles, and clear responsibilities and liabilities | (1) Emergency response (2) Employer–employee relationship (3) Government policy (4) Competitor behavior (5) Competitive analysis of the industry |
| Financial position | Management of asset purchases (investment), capital loans (financing), operation cash flows (working capital), and profit allocation given the overall goals | (1) Financial stability (2) Property risk management (3) Activity ratio (4) Investment in derivatives |
| Quality | Whether the product or service conforms to or surpasses the client’s expectation | (1) Continuous improvement (2) Product reliability (3) Quality records (4) Solving quality problems (5) Quality management system for substandard products (6) Repair and compensation claims |
| Delivery | (1) The period between when an order is placed and its delivery by the supplier (2) Delivery = time spent in administrative procedure + procurement + production + shipping + inspection + other operations | (1) Stable supply of orders (2) Commitment to the delivery of orders (3) Accuracy and reliability of supply (4) On-time delivery (5) Ability to deliver orders at short notice (6) Ability to manage inventory |
| Commitment | A contract made with mutual agreement of all parties | (1) Commitment to orders (2) Stable supply (3) Accuracy and reliability (4) Speed of delivery (5) Commitment to the delivery time |
| Cost | All costs incurred during a company’s acquisition of products or services and all expenses, which are the cost invested by a company in its business activities to make profit | (1) Procurement cost (2) Reflects real-time prices (3) Transportation cost (4) Price competitiveness (5) Ability to negotiate prices (6) Controlling price with volume (7) Discounts for cash payment |
| Production capacity | The maximum volume of products produced or raw materials processed by all fixed assets in a company within the contract period and under the given technological conditions | (1) Product stability (2) Production capacity and output value (3) Productivity (4) Expected sales and production capacity (5) Contracting or outsourcing |
| Technical capability | The level of understanding of and familiarity with a certain activity, particularly interaction with others, in relation to a method, process, program, or technique | (1) Ability to continuously improve (2) Ability to innovate techniques (3) Ability to provide technical support (4) Ability to change designs (5) Core technical skills |
| Service attitude | An activity or a benefit that is provided by one party to another, is intangible, and does not involve change of rights in remuneration | (1) Continuously reporting back to client (2) Attitude (3) Ability to manage customer complaints (4) Ability to supply spare parts (5) Negotiation with suppliers (6) Ability to conduct training (7) Maintenance of product safety (8) After-sales repair (9) After-sales services |
| Reputation | The sum of a company’s value-creation capabilities generated from its acquisition of recognition by society and then of resources, opportunities, and support | (1) Integrity (2) Value of business reputation (3) Business competitiveness (4) Enhancement of corporate value (5) Improvement of profit (6) Corporate social responsibility (7) Profit increase (8) Financial robustness |
| Environmental protection product management | Manufacturing, use, and processing of products, conforming to environmental requirements, causing no or very little harm to the environment and conducive to resource circulation and product repurposing | (1) RoHS Regulations on Banned Substances in Components (2) RoHS monitoring and documentation on inbound materials (3) RoHS training (4) Provision of guarantee and a third-party report |
| Expert Category | Place of Employment | Number of People | Percentage (%) |
|---|---|---|---|
| Industry | Manufacturers specializing in the design, production, and sale of CBPPMs (each with over 20 years of experience in selling and manufacturing CBPPMs [note 1]) | 12 | 52.17 |
| Government | Bureau of Foreign Trade (Ministry of Economic Affairs); Industrial Development Bureau (Ministry of Economic Affairs); Taiwan External Trade Development Council; National Taiwan Bureau of Taipei (Ministry of Finance) | 5 | 21.74 |
| Academia | Five from academic institutions; one from The Global Logistics & Commerce Council of Taiwan | 6 | 26.09 |
| Total | 23 | 100 | |
| Category | First Round | Second Round |
|---|---|---|
| Number of copies distributed | 23 | 20 |
| Number of responses | 20 | 20 |
| Response rate (%) | 86.96 | 100 |
| Criteria | Subcriteria | Relationship |
|---|---|---|
| Quality (C1) | Product reliability (C11) | Interdependent with C21, C22, C23, C24, C31, and C32 |
| Quality management system for substandard products (C12) | Interdependent with C21, C22, C23, C24, C31, and C32 | |
| Commitment (C2) | Commitment to orders (C21) | Interdependent with C11, C12, C31, and C32 |
| Unilaterally dominant over C51 and C52 | ||
| Stable supply (C22) | Interdependent with C11, C12, C31, and C32 | |
| Unilaterally dominant over C51 and C52 | ||
| Accuracy and reliability (C23) | Interdependent with C11, C12, C31, and C32 | |
| Unilaterally dominant over C43 and C44 | ||
| On-time delivery (C24) | Interdependent with C11, C12, C31, and C32 | |
| Unilaterally dominant over C41, C42, and C43 | ||
| Cost (C3) | Price reduction (C31) | Interdependent with C11, C12, C21, C22, C23, C24, C43, and C52 |
| Price competitiveness (C32) | Interdependent with C11, C12, C21, C22, C23, C24, C42, and C51 | |
| Service attitude (C4) | Attitude (C41) | Unilaterally dominant over C11, C12, C31, C32, and C51 |
| Ability to manage customer Complaints (C42) | Interdependent with C32 and C51 | |
| Unilaterally dominant over C11, C12, C31, and C52 | ||
| Negotiation with suppliers (C43) | Interdependent with C31 and C51 | |
| Unilaterally dominant over C11, C12, and C32 | ||
| After-sales services (C44) | Unilaterally dominant over C11, C12, C31, C32, and C51 | |
| Reputation (C5) | Integrity (C51) | Interdependent with C32, C43, and C52 |
| Unilaterally dominant over C11, C12, C31, and C42 | ||
| Profit increase (C52) | Interdependent with C31 and C51 | |
| Unilaterally dominant over C11, C12, and C32 |
| Criteria | Quality (C1) | Commitment (C2) | Cost (C3) | Service Attitude (C4) | Reputation (C5) | Eigenvector |
|---|---|---|---|---|---|---|
| Quality C1 | 1 | 2 | 5 | 5 | 3 | 0.4206 |
| Commitment C2 | 0.5000 | 1 | 4 | 3 | 3 | 0.2827 |
| Cost C3 | 0.2000 | 0.2500 | 1 | 3 | 0.5000 | 0.0985 |
| Service attitude C4 | 0.2000 | 0.3333 | 0.3333 | 1 | 0.5000 | 0.0655 |
| Reputation C5 | 0.3333 | 0.3333 | 2 | 2 | 1 | 0.1327 |
| Subcriteria Under C1 | Product Reliability (C11) | Quality Management System for Substandard Products (C12) | Eigenventor |
|---|---|---|---|
| Product reliability (C11) | 1 | 4 | 0.8000 |
| Quality management system for substandard products (C12) | 0.2500 | 1 | 0.2000 |
| Criteria | Criteria Weight (W21) | Subcriteria | Subcriteria Weight (W32) |
|---|---|---|---|
| Quality (C1) | 0.4206 | Product reliability (C11) | 0.8000 |
| Quality management system for substandard products (C12) | 0.2000 | ||
| Commitment (C2) | 0.2827 | Commitment to orders (C21) | 0.0493 |
| Stable supply (C22) | 0.2075 | ||
| Accuracy and reliability (C23) | 0.2701 | ||
| On-time delivery (C24) | 0.4731 | ||
| Cost (C3) | 0.0985 | Price reduction (C31) | 0.1111 |
| Price competitiveness (C32) | 0.8889 | ||
| Service attitude (C4) | 0.0655 | Attitude (C41) | 0.6642 |
| Ability to manage customer complaints (C42) | 0.0903 | ||
| Negotiation with suppliers (C43) | 0.0957 | ||
| After-sales services (C44) | 0.1498 | ||
| Reputation (C5) | 0.1327 | Integrity (C51) | 0.7500 |
| Profit increase (C52) | 0.2500 |
| Unweighted Super Matrix | Goal | (C1) | (C2) | (C3) | (C4) | (C5) | (C11) | (C12) | (C21) | (C22) | (C23) | (C24) | (C31) | (C32) | (C41) | (C42) | (C43) | (C44) | (C51) | (C52) |
|---|---|---|---|---|---|---|---|---|---|---|---|---|---|---|---|---|---|---|---|---|
| Goal | 0 | 0 | 0 | 0 | 0 | 0 | 0 | 0 | 0 | 0 | 0 | 0 | 0 | 0 | 0 | 0 | 0 | 0 | 0 | 0 |
| (C1) | 0.4206 | 0.4296 | 0 | 0 | 0 | 0.1779 | 0 | 0 | 0 | 0 | 0 | 0 | 0 | 0 | 0 | 0 | 0 | 0 | 0 | 0 |
| (C2) | 0.2827 | 0 | 0.4806 | 0 | 0.1093 | 0.1982 | 0 | 0 | 0 | 0 | 0 | 0 | 0 | 0 | 0 | 0 | 0 | 0 | 0 | 0 |
| (C3) | 0.0985 | 0.0784 | 0.1140 | 0.1655 | 0.1093 | 0.1402 | 0 | 0 | 0 | 0 | 0 | 0 | 0 | 0 | 0 | 0 | 0 | 0 | 0 | 0 |
| (C4) | 0.0655 | 0.0820 | 0 | 0.6098 | 0.5725 | 0.2043 | 0 | 0 | 0 | 0 | 0 | 0 | 0 | 0 | 0 | 0 | 0 | 0 | 0 | 0 |
| (C5) | 0.1327 | 0.4100 | 0.4054 | 0.2247 | 0.2090 | 0.2793 | 0 | 0 | 0 | 0 | 0 | 0 | 0 | 0 | 0 | 0 | 0 | 0 | 0 | 0 |
| (C11) | 0 | 0.8 | 0 | 0 | 0 | 0 | 0.2808 | 0 | 0.2936 | 0.4116 | 0.1736 | 0.0479 | 0.2522 | 0.2176 | 0.3302 | 0.3702 | 0.3495 | 0.2489 | 0.0561 | 0.0466 |
| (C12) | 0 | 0.2 | 0 | 0 | 0 | 0 | 0 | 0.4158 | 0.1587 | 0.0454 | 0.0645 | 0.0520 | 0.0442 | 0.0942 | 0.2869 | 0.2201 | 0.2409 | 0.0986 | 0.0346 | 0.0440 |
| (C21) | 0 | 0 | 0.25 | 0 | 0 | 0 | 0.0292 | 0.0430 | 0.0497 | 0 | 0 | 0 | 0.1451 | 0.0725 | 0 | 0 | 0 | 0 | 0 | 0 |
| (C22) | 0 | 0 | 0.25 | 0 | 0 | 0 | 0.1200 | 0.0459 | 0 | 0.1593 | 0.0341 | 0 | 0.1937 | 0.1582 | 0 | 0 | 0 | 0 | 0 | 0 |
| (C23) | 0 | 0 | 0.25 | 0 | 0 | 0 | 0.3515 | 0.0853 | 0 | 0 | 0.1691 | 0 | 0.1535 | 0.1617 | 0 | 0 | 0 | 0 | 0 | 0 |
| (C24) | 0 | 0 | 0.25 | 0 | 0 | 0 | 0.1004 | 0.1071 | 0 | 0 | 0.0545 | 0.1278 | 0.0921 | 0.1608 | 0 | 0 | 0 | 0 | 0 | 0 |
| (C31) | 0 | 0 | 0 | 0.5 | 0 | 0 | 0.0586 | 0.1324 | 0.2257 | 0.0340 | 0.0447 | 0.0591 | 0.0257 | 0 | 0.0437 | 0.0253 | 0.0286 | 0.0339 | 0.0466 | 0.1211 |
| (C32) | 0 | 0 | 0 | 0.5 | 0 | 0 | 0.0595 | 0.1706 | 0.1849 | 0.0533 | 0.0436 | 0.0513 | 0 | 0.0263 | 0.0437 | 0.0317 | 0.0534 | 0.0427 | 0.0581 | 0.2903 |
| (C41) | 0 | 0 | 0 | 0 | 0.25 | 0 | 0 | 0 | 0 | 0.1261 | 0 | 0.1474 | 0 | 0 | 0.1143 | 0 | 0 | 0 | 0 | 0 |
| (C42) | 0 | 0 | 0 | 0 | 0.25 | 0 | 0 | 0 | 0 | 0 | 0 | 0.3575 | 0 | 0.0420 | 0 | 0.0869 | 0 | 0 | 0.1663 | 0 |
| (C43) | 0 | 0 | 0 | 0 | 0.25 | 0 | 0 | 0 | 0 | 0.1702 | 0.1860 | 0.1570 | 0.0339 | 0 | 0 | 0 | 0.0800 | 0 | 0.2076 | 0 |
| (C44) | 0 | 0 | 0 | 0 | 0.25 | 0 | 0 | 0 | 0 | 0 | 0.2299 | 0 | 0 | 0 | 0 | 0 | 0 | 0.2475 | 0 | 0 |
| (C51) | 0 | 0 | 0 | 0 | 0 | 0.5 | 0 | 0 | 0.0624 | 0 | 0 | 0 | 0 | 0.0666 | 0.1812 | 0.1449 | 0.2476 | 0.3284 | 0.3273 | 0.2687 |
| (C52) | 0 | 0 | 0 | 0 | 0 | 0.5 | 0 | 0 | 0.0250 | 0 | 0 | 0 | 0.0596 | 0 | 0 | 0.1210 | 0 | 0 | 0.1033 | 0.2294 |
| Weighted Super Matrix | Goal | (C1) | (C2) | (C3) | (C4) | (C5) | (C11) | (C12) | (C21) | (C22) | (C23) | (C24) | (C31) | (C32) | (C41) | (C42) | (C43) | (C44) | (C51) | (C52) |
|---|---|---|---|---|---|---|---|---|---|---|---|---|---|---|---|---|---|---|---|---|
| Goal | 0 | 0 | 0 | 0 | 0 | 0 | 0 | 0 | 0 | 0 | 0 | 0 | 0 | 0 | 0 | 0 | 0 | 0 | 0 | 0 |
| (C1) | 0.4206 | 0.2148 | 0 | 0 | 0 | 0.0889 | 0 | 0 | 0 | 0 | 0 | 0 | 0 | 0 | 0 | 0 | 0 | 0 | 0 | 0 |
| (C2) | 0.2827 | 0 | 0.2403 | 0 | 0.0546 | 0.0991 | 0 | 0 | 0 | 0 | 0 | 0 | 0 | 0 | 0 | 0 | 0 | 0 | 0 | 0 |
| (C3) | 0.0985 | 0.0392 | 0.0570 | 0.0828 | 0.0546 | 0.0701 | 0 | 0 | 0 | 0 | 0 | 0 | 0 | 0 | 0 | 0 | 0 | 0 | 0 | 0 |
| (C4) | 0.0655 | 0.0410 | 0 | 0.3049 | 0.2862 | 0.1022 | 0 | 0 | 0 | 0 | 0 | 0 | 0 | 0 | 0 | 0 | 0 | 0 | 0 | 0 |
| (C5) | 0.1327 | 0.2050 | 0.2027 | 0.1123 | 0.1045 | 0.1397 | 0 | 0 | 0 | 0 | 0 | 0 | 0 | 0 | 0 | 0 | 0 | 0 | 0 | 0 |
| (C11) | 0 | 0.4 | 0 | 0 | 0 | 0 | 0.2808 | 0 | 0.2936 | 0.4116 | 0.1736 | 0.0479 | 0.2522 | 0.2176 | 0.3302 | 0.3702 | 0.3495 | 0.2489 | 0.0561 | 0.0466 |
| (C12) | 0 | 0.1 | 0 | 0 | 0 | 0 | 0 | 0.4158 | 0.1587 | 0.0454 | 0.0645 | 0.0520 | 0.0442 | 0.0942 | 0.2869 | 0.2201 | 0.2409 | 0.0986 | 0.0346 | 0.0440 |
| (C21) | 0 | 0 | 0.1250 | 0 | 0 | 0 | 0.0292 | 0.0430 | 0.0497 | 0 | 0 | 0 | 0.1451 | 0.0725 | 0 | 0 | 0 | 0 | 0 | 0 |
| (C22) | 0 | 0 | 0.1250 | 0 | 0 | 0 | 0.1200 | 0.0459 | 0 | 0.1593 | 0.0341 | 0 | 0.1937 | 0.1582 | 0 | 0 | 0 | 0 | 0 | 0 |
| (C23) | 0 | 0 | 0.1250 | 0 | 0 | 0 | 0.3515 | 0.0853 | 0 | 0 | 0.1691 | 0 | 0.1535 | 0.1617 | 0 | 0 | 0 | 0 | 0 | 0 |
| (C24) | 0 | 0 | 0.1250 | 0 | 0 | 0 | 0.1004 | 0.1071 | 0 | 0 | 0.0545 | 0.1278 | 0.0921 | 0.1608 | 0 | 0 | 0 | 0 | 0 | 0 |
| (C31) | 0 | 0 | 0 | 0.25 | 0 | 0 | 0.0586 | 0.1324 | 0.2257 | 0.0340 | 0.0447 | 0.0591 | 0.0257 | 0 | 0.0437 | 0.0253 | 0.0286 | 0.0339 | 0.0466 | 0.1211 |
| (C32) | 0 | 0 | 0 | 0.25 | 0 | 0 | 0.0595 | 0.1706 | 0.1849 | 0.0533 | 0.0436 | 0.0513 | 0 | 0.0263 | 0.0437 | 0.0317 | 0.0534 | 0.0427 | 0.0581 | 0.2903 |
| (C41) | 0 | 0 | 0 | 0 | 0.1250 | 0 | 0 | 0 | 0 | 0.1261 | 0 | 0.1474 | 0 | 0 | 0.1143 | 0 | 0 | 0 | 0 | 0 |
| (C42) | 0 | 0 | 0 | 0 | 0.1250 | 0 | 0 | 0 | 0 | 0 | 0 | 0.3575 | 0 | 0.0420 | 0 | 0.0869 | 0 | 0 | 0.1663 | 0 |
| (C43) | 0 | 0 | 0 | 0 | 0.1250 | 0 | 0 | 0 | 0 | 0.1702 | 0.1860 | 0.1570 | 0.0339 | 0 | 0 | 0 | 0.0800 | 0 | 0.2076 | 0 |
| (C44) | 0 | 0 | 0 | 0 | 0.1250 | 0 | 0 | 0 | 0 | 0 | 0.2299 | 0 | 0 | 0 | 0 | 0 | 0 | 0.2475 | 0 | 0 |
| (C51) | 0 | 0 | 0 | 0 | 0 | 0.25 | 0 | 0 | 0.0624 | 0 | 0 | 0 | 0 | 0.0666 | 0.1812 | 0.1449 | 0.2476 | 0.3284 | 0.3273 | 0.2687 |
| (C52) | 0 | 0 | 0 | 0 | 0 | 0.25 | 0 | 0 | 0.0250 | 0 | 0 | 0 | 0.0596 | 0 | 0 | 0.1210 | 0 | 0 | 0.1033 | 0.2294 |
| Limit Super Matrix | Goal | (C1) | (C2) | (C3) | (C4) | (C5) | (C11) | (C12) | (C21) | (C22) | (C23) | (C24) | (C31) | (C32) | (C41) | (C42) | (C43) | (C44) | (C51) | (C52) |
|---|---|---|---|---|---|---|---|---|---|---|---|---|---|---|---|---|---|---|---|---|
| Goal | 0 | 0 | 0 | 0 | 0 | 0 | 0 | 0 | 0 | 0 | 0 | 0 | 0 | 0 | 0 | 0 | 0 | 0 | 0 | 0 |
| (C1) | 0 | 0 | 0 | 0 | 0 | 0 | 0 | 0 | 0 | 0 | 0 | 0 | 0 | 0 | 0 | 0 | 0 | 0 | 0 | 0 |
| (C2) | 0 | 0 | 0 | 0 | 0 | 0 | 0 | 0 | 0 | 0 | 0 | 0 | 0 | 0 | 0 | 0 | 0 | 0 | 0 | 0 |
| (C3>) | 0 | 0 | 0 | 0 | 0 | 0 | 0 | 0 | 0 | 0 | 0 | 0 | 0 | 0 | 0 | 0 | 0 | 0 | 0 | 0 |
| (C4) | 0 | 0 | 0 | 0 | 0 | 0 | 0 | 0 | 0 | 0 | 0 | 0 | 0 | 0 | 0 | 0 | 0 | 0 | 0 | 0 |
| (C5) | 0 | 0 | 0 | 0 | 0 | 0 | 0 | 0 | 0 | 0 | 0 | 0 | 0 | 0 | 0 | 0 | 0 | 0 | 0 | 0 |
| (C11) | 0.2094 | 0.2094 | 0.2094 | 0.2094 | 0.2094 | 0.2094 | 0.2094 | 0.2094 | 0.2094 | 0.2094 | 0.2094 | 0.2094 | 0.2094 | 0.2094 | 0.2094 | 0.2094 | 0.2094 | 0.2094 | 0.2094 | 0.2094 |
| (C12) | 0.1139 | 0.1139 | 0.1139 | 0.1139 | 0.1139 | 0.1139 | 0.1139 | 0.1139 | 0.1139 | 0.1139 | 0.1139 | 0.1139 | 0.1139 | 0.1139 | 0.1139 | 0.1139 | 0.1139 | 0.1139 | 0.1139 | 0.1139 |
| (C21) | 0.0257 | 0.0257 | 0.0257 | 0.0257 | 0.0257 | 0.0257 | 0.0257 | 0.0257 | 0.0257 | 0.0257 | 0.0257 | 0.0257 | 0.0257 | 0.0257 | 0.0257 | 0.0257 | 0.0257 | 0.0257 | 0.0257 | 0.0257 |
| (C22) | 0.0675 | 0.0675 | 0.0675 | 0.0675 | 0.0675 | 0.0675 | 0.0675 | 0.0675 | 0.0675 | 0.0675 | 0.0675 | 0.0675 | 0.0675 | 0.0675 | 0.0675 | 0.0675 | 0.0675 | 0.0675 | 0.0675 | 0.0675 |
| (C23) | 0.1244 | 0.1244 | 0.1244 | 0.1244 | 0.1244 | 0.1244 | 0.1244 | 0.1244 | 0.1244 | 0.1244 | 0.1244 | 0.1244 | 0.1244 | 0.1244 | 0.1244 | 0.1244 | 0.1244 | 0.1244 | 0.1244 | 0.1244 |
| (C24) | 0.0647 | 0.0647 | 0.0647 | 0.0647 | 0.0647 | 0.0647 | 0.0647 | 0.0647 | 0.0647 | 0.0647 | 0.0647 | 0.0647 | 0.0647 | 0.0647 | 0.0647 | 0.0647 | 0.0647 | 0.0647 | 0.0647 | 0.0647 |
| (C31) | 0.0578 | 0.0578 | 0.0578 | 0.0578 | 0.0578 | 0.0578 | 0.0578 | 0.0578 | 0.0578 | 0.0578 | 0.0578 | 0.0578 | 0.0578 | 0.0578 | 0.0578 | 0.0578 | 0.0578 | 0.0578 | 0.0578 | 0.0578 |
| (C32) | 0.0692 | 0.0692 | 0.0692 | 0.0692 | 0.0692 | 0.0692 | 0.0692 | 0.0692 | 0.0692 | 0.0692 | 0.0692 | 0.0692 | 0.0692 | 0.0692 | 0.0692 | 0.0692 | 0.0692 | 0.0692 | 0.0692 | 0.0692 |
| (C41) | 0.0204 | 0.0204 | 0.0204 | 0.0204 | 0.0204 | 0.0204 | 0.0204 | 0.0204 | 0.0204 | 0.0204 | 0.0204 | 0.0204 | 0.0204 | 0.0204 | 0.0204 | 0.0204 | 0.0204 | 0.0204 | 0.0204 | 0.0204 |
| (C42) | 0.0424 | 0.0424 | 0.0424 | 0.0424 | 0.0424 | 0.0424 | 0.0424 | 0.0424 | 0.0424 | 0.0424 | 0.0424 | 0.0424 | 0.0424 | 0.0424 | 0.0424 | 0.0424 | 0.0424 | 0.0424 | 0.0424 | 0.0424 |
| (C43) | 0.0680 | 0.0680 | 0.0680 | 0.0680 | 0.0680 | 0.0680 | 0.0680 | 0.0680 | 0.0680 | 0.0680 | 0.0680 | 0.0680 | 0.0680 | 0.0680 | 0.0680 | 0.0680 | 0.0680 | 0.0680 | 0.0680 | 0.0680 |
| (C44) | 0.0380 | 0.0380 | 0.0380 | 0.0380 | 0.0380 | 0.0380 | 0.0380 | 0.0380 | 0.0380 | 0.0380 | 0.0380 | 0.0380 | 0.0380 | 0.0380 | 0.0380 | 0.0380 | 0.0380 | 0.0380 | 0.0380 | 0.0380 |
| (C51) | 0.0763 | 0.0763 | 0.0763 | 0.0763 | 0.0763 | 0.0763 | 0.0763 | 0.0763 | 0.0763 | 0.0763 | 0.0763 | 0.0763 | 0.0763 | 0.0763 | 0.0763 | 0.0763 | 0.0763 | 0.0763 | 0.0763 | 0.0763 |
| (C52) | 0.0222 | 0.0222 | 0.0222 | 0.0222 | 0.0222 | 0.0222 | 0.0222 | 0.0222 | 0.0222 | 0.0222 | 0.0222 | 0.0222 | 0.0222 | 0.0222 | 0.0222 | 0.0222 | 0.0222 | 0.0222 | 0.0222 | 0.0222 |
| (C12) | Company A | Company B | Company C | Company D | Company E | Weight |
|---|---|---|---|---|---|---|
| Company A | 1 | 3 | 0.5 | 0.5 | 0.3333 | 0.1470 |
| Company B | 0.3333 | 1 | 1 | 0.3333 | 0.3333 | 0.1024 |
| Company C | 2 | 1 | 1 | 1 | 1 | 0.2154 |
| Company D | 2 | 3 | 1 | 1 | 1 | 0.2538 |
| Company E | 3 | 3 | 1 | 1 | 1 | 0.2814 |
| Alternatives | (C11) | (C12) | (C21) | (C22) | (C23) | (C24) | (C31) | (C32) | (C41) | (C42) | (C43) | (C44) | (C51) | (C52) |
|---|---|---|---|---|---|---|---|---|---|---|---|---|---|---|
| Company A | 0.3274 | 0.1470 | 0.2346 | 0.2183 | 0.2086 | 0.2909 | 0.1033 | 0.0957 | 0.0787 | 0.1421 | 0.0566 | 0.0718 | 0.1688 | 0.0877 |
| Company B | 0.1299 | 0.1024 | 0.1660 | 0.0986 | 0.2630 | 0.1470 | 0.1818 | 0.1599 | 0.1814 | 0.1459 | 0.1308 | 0.1388 | 0.1601 | 0.1498 |
| Company C | 0.1331 | 0.2154 | 0.1978 | 0.0888 | 0.0947 | 0.1062 | 0.1377 | 0.1733 | 0.1814 | 0.0878 | 0.1218 | 0.0988 | 0.1217 | 0.2148 |
| Company D | 0.2383 | 0.2538 | 0.1694 | 0.2730 | 0.2881 | 0.2479 | 0.2256 | 0.2428 | 0.3149 | 0.4103 | 0.5491 | 0.2862 | 0.2435 | 0.2739 |
| Company E | 0.1714 | 0.2814 | 0.2321 | 0.3213 | 0.1457 | 0.2080 | 0.3515 | 0.3283 | 0.2435 | 0.2139 | 0.1417 | 0.4045 | 0.3059 | 0.2739 |
Publisher’s Note: MDPI stays neutral with regard to jurisdictional claims in published maps and institutional affiliations. |
© 2020 by the authors. Licensee MDPI, Basel, Switzerland. This article is an open access article distributed under the terms and conditions of the Creative Commons Attribution (CC BY) license (http://creativecommons.org/licenses/by/4.0/).
Share and Cite
Lin, C.-T.; Chiang, C.-Y. Developing and Applying a Selection Model for Corrugated Box Precision Printing Machine Suppliers. Mathematics 2021, 9, 68. https://doi.org/10.3390/math9010068
Lin C-T, Chiang C-Y. Developing and Applying a Selection Model for Corrugated Box Precision Printing Machine Suppliers. Mathematics. 2021; 9(1):68. https://doi.org/10.3390/math9010068
Chicago/Turabian StyleLin, Chin-Tsai, and Cheng-Yu Chiang. 2021. "Developing and Applying a Selection Model for Corrugated Box Precision Printing Machine Suppliers" Mathematics 9, no. 1: 68. https://doi.org/10.3390/math9010068
APA StyleLin, C.-T., & Chiang, C.-Y. (2021). Developing and Applying a Selection Model for Corrugated Box Precision Printing Machine Suppliers. Mathematics, 9(1), 68. https://doi.org/10.3390/math9010068