Article

A Time Series Prediction Model of Foundation Pit Deformation Based on Empirical Wavelet Transform and NARX Network

School of Water Conservancy Engineering, Zhengzhou University, Zhengzhou 450001, China
*
Author to whom correspondence should be addressed.
Mathematics 2020, 8(9), 1535; https://doi.org/10.3390/math8091535
Submission received: 17 August 2020 / Revised: 4 September 2020 / Accepted: 7 September 2020 / Published: 8 September 2020

Abstract

:
Large deep foundation pits are usually in a complex environment, so their surface deformation tends to show a stable rising trend with a small range of fluctuation, which brings certain difficulty to the prediction work. Therefore, in this study we proposed a nonlinear autoregressive exogenous (NARX) prediction method based on empirical wavelet transform (EWT) pretreatment is proposed for this feature. Firstly, EWT is used to conduct adaptive decomposition of the measured deformation data and extract the modal signal components with characteristic differences. Secondly, the main components affecting the deformation of the foundation pit are analyzed as a part of the external input. Then, we established a NARX prediction model for different components. Finally, all predicted values are superpositioned to obtain a total value, and the result is compared with the predicted results of the nonlinear autoregressive (NAR) model, empirical mode decomposition-nonlinear autoregressive (EMD-NAR) model, EWT-NAR model, NARX model, EMD-NARX model and EWT-NARX model. The results showed that, compared with the EWT-NAR and EWT-NARX models, the EWT-NARX model reduced the mean square error of KD25 by 91.35%, indicating that the feature of introducing external input makes NARX more suitable for combining with the EWT method. Meanwhile, compared with the EMD-NAR and EWT-NAR models, the introduction of the NARX model reduced the mean square error of KD25 by 78.58% and 95.71%, indicating that EWT had better modal decomposition capability than EMD.

1. Introduction

Deep foundation pit deformation is an important parameter for engineering safety at construction sites. It is of great significance to analyze the evolution law of deformation according to the monitored surface settlement data. Settlement prediction is a complex dynamic engineering mode. The complexity and dynamics of the construction process can lead to foundation pit deformation in a nonlinear time series of intermittent fluctuations [1,2,3,4]. Therefore, it is crucial to build an effective model based on the existing historical deformation data. However, if data is only predicted using a time series analysis, there are certain limitations and defects, because the deformation process in a foundation pit is subject to interference and influence of many non-deterministic factors when obtaining monitoring data. Thus, this impacts the accuracy of data and thus affects the reliability of the prediction results [5,6,7,8,9].
Signal processing often uses Fourier transform, wavelet transform, empirical mode decomposition (EMD), Hilbert–Huang transform (HHT) and empirical wavelet transform (EWT). Fourier transform is the most widely used signal processing method, yet its processing capacity for non-stationary signals is insufficient and can only obtain frequency components of a signal without knowing the time when each component appears [10]. The mathematical basis of wavelet transform is Fourier transform, which is better than Fourier transform for abrupt signal use. However, wavelet transform also has a shortcoming, i.e., the wavelet base needs to be artificially chosen [11,12,13]. Hilbert–Huang transform is a new time-frequency analysis method for non-stationary signals, which takes the transient frequency as the basic quantity and the inherent mode signal as the basic signal. HHT is composed of EMD and Hilbert transform. Through EMD, signals are decomposed into different basic model components of the intrinsic mode function (IMF). Hilbert transform is used to process each IMF and the time-frequency relation of each IMF can thus be obtained [14,15,16]. Empirical wavelet transform is a new adaptive wavelet decomposition method. Its core idea is to construct orthogonal wavelet filter banks using modal signal components with Fourier support. Compared with the EMD method, the phenomenon of modal aliasing and false modes can be avoided and the modal signal components are less [17].
In order to remove the noise of the initial data, scholars in various fields have adopted EWT to process the data. Many scholars applied empirical wavelet transform (EWT) decomposition to wind speed prediction models, then compared the prediction results. It was found that the introduction of EWT greatly improved the prediction accuracy of different time series models [18,19,20,21]. Some scholars compared EWTs decomposition ability with empirical mode decomposition (EMD). The results showed that EWT had better data decomposition ability with both a small calculation amount and high precision [22]. When predicting China’s stock market, EWT greatly improved the accuracy of different models [23]. Meanwhile, EWT also verified good data regarding decomposition ability in the fields of mechanical fault diagnosis, vibration signal analysis and structural health state analysis [24,25,26,27,28,29]. However, EWT has not been studied when analyzing of foundation pit deformation data. Because wavelet analysis and the EMD method have a good effect on deformation data processing, it is necessary to discuss the applicability of EWT in the noise reduction of foundation pit deformation data [30,31].
Relevant literature at home and abroad show that deformation changes in the process of foundation pit excavation are impacted by many factors. Therefore, it is of great practical significance to analyze the main factors that affect foundation pit deformation and predict the deformation by combining the historical monitoring data. The nonlinear autoregressive exogenous (NARX) neural network model is a widely used dynamic neural network, that has overcome a traditional time series limitation, i.e., the inanity to take external factors into account [32,33,34,35,36]. The combination of the NARX method, wavelet technology, and the EMD method have also been applied in various fields, but its combination with EWT has not been studied deeply enough [37,38,39].
However, the applicability of the combination of EWT and NARX has hardly been discussed in the existing researches, especially in the field of foundation pit deformation prediction. To fill in the inanity in this study, it is necessary to evaluate its accuracy in the prediction of foundation pit deformation data. In this paper, we collected and collated monitoring data from foundation pit engineering in Beilonghu Financial Island in Zhengzhou City, Henan Province. Then, the NARX network was used to train the decomposition results and predict the later settlement. Finally, the accuracy of the model was evaluated by comparing our prediction results with the NAR, EMD-NAR, EWT-NAR, NARX, EMD-NARX, EWT-NARX models.

2. Materials and Methods

2.1. Principle of EWT

EWT is a new adaptive signal processing method that which combines the adaptive decomposition idea of EMD and the theoretical framework of wavelet transform [17]. This method combines the Fourier support detected in the signal information, processing the wavelet filter bank adaptively, and extracting different modal components from the signal through the filter bank. In order to determine the frequency range of the bandpass filter, adaptive segmentation was performed on the signal’s Fourier spectrum as shown in Figure 1.
Figure 1 illustrates the EWT’S adaptive decomposition process. Firstly, the Fourier support interval is defined as [0, π] and assume that it is divided into N continuous parts, let Λ n = [ ω n 1 , ω n ] represent the boundary of each segment, (n = 1, 2, …, N, ω 0 = 0, ω N = π), select ω n as the midpoint between two adjacent maximum points of signal Fourier spectrum, then n = 1 N Λ n = [ 0 , π ] . With each ω n as the center, it define a transition area of width T n = 2 τ n , as shown in the shaded part in Figure 1. In the segmentation interval Λ n , the empirical wavelet is defined as the band-pass filter on each Λ n . Therefore, the empirical scale function and empirical wavelet function were determined according to the Meyer wavelet, as shown in Equation (1) and Equation (2), respectively [40].
Ψ ^ n ( ω ) = { 1 ω n + τ n | ω | ω n + 1 τ n + 1 cos { π 2 β [ 1 2 τ n + 1 ( | ω | ω n + 1 + τ n + 1 ) ] } ω n + 1 τ n + 1 | ω | ω n + 1 + τ n + 1 sin { π 2 β [ 1 2 τ n ( | ω | ω n + τ n ) ] } ω n τ n | ω | ω n + τ n 0 other
Φ ^ n ( ω ) = { 1 | ω | ω n τ n cos { π 2 β [ 1 2 τ n ( | ω | ω n + τ n ) ] } ω n τ n | ω | ω n + τ n 0 other
Here, τ n = γ w n , and γ < min { ω n + 1 ω n ω n + 1 + ω n } . Generally, function β ( z ) is defined as β ( z ) = z 4 ( 35 84 z + 70 z 2 20 z 3 ) .
The original signal can be reconstructed as:
x ( t ) = W x ε ( 0 , t ) ϕ 1 ( t ) + n = 1 N W x ε ( n , t ) ϕ n ( t )
Here, is a convolution operation, W x ε ( 0 , t ) is the approximation coefficient, and W x ε ( n , t ) is the empirical wavelet transform of x ( t ) .
Empirical mode x k ( t ) can be defined according to Equation (4).
{ x 0 ( t ) = W x ε ( 0 , t ) ϕ 1 ( t ) x k ( t ) = W x ε ( n , t ) ϕ n ( t )

2.2. Basic Principles of NARX

The NARX network is known as a nonlinear autoregressive model with external inputs and belongs to a dynamic recursive neural network, which is equivalent to the BP network with input delays plus a delayed feedback connection between the output and input [41]. By introducing an appropriate external input, the NARX time series prediction model can train the network, determines the value of unknown parameters in (Equation (5)) according to the training effect, and finally uses the network with parameters determined to predict the time series of surface deformation. The process is shown in Figure 2 [42]. Because the output layer continuously feeds back the output data containing the history to the input layer, the NARX network has the ability of memory. Compared with the traditional regression neural network, the NARX network contains a network history and real-time state information for a longer time.
In Figure 2, x ( t ) represents the external input of the neural network, i.e., the external influencing factors; m represents the delay order of the external input; y ( t ) is the output of the neural network, namely the surface deformation in the next period; n is the output delay order. Then, the value of the output y(t + 1) of the network is:
y ( t ) = f [ x ( t ) , x ( t 1 ) , , x ( t m + 1 ) , y ( t ) , y ( t 1 ) , y ( t n ) ]

2.3. Model Prediction Process

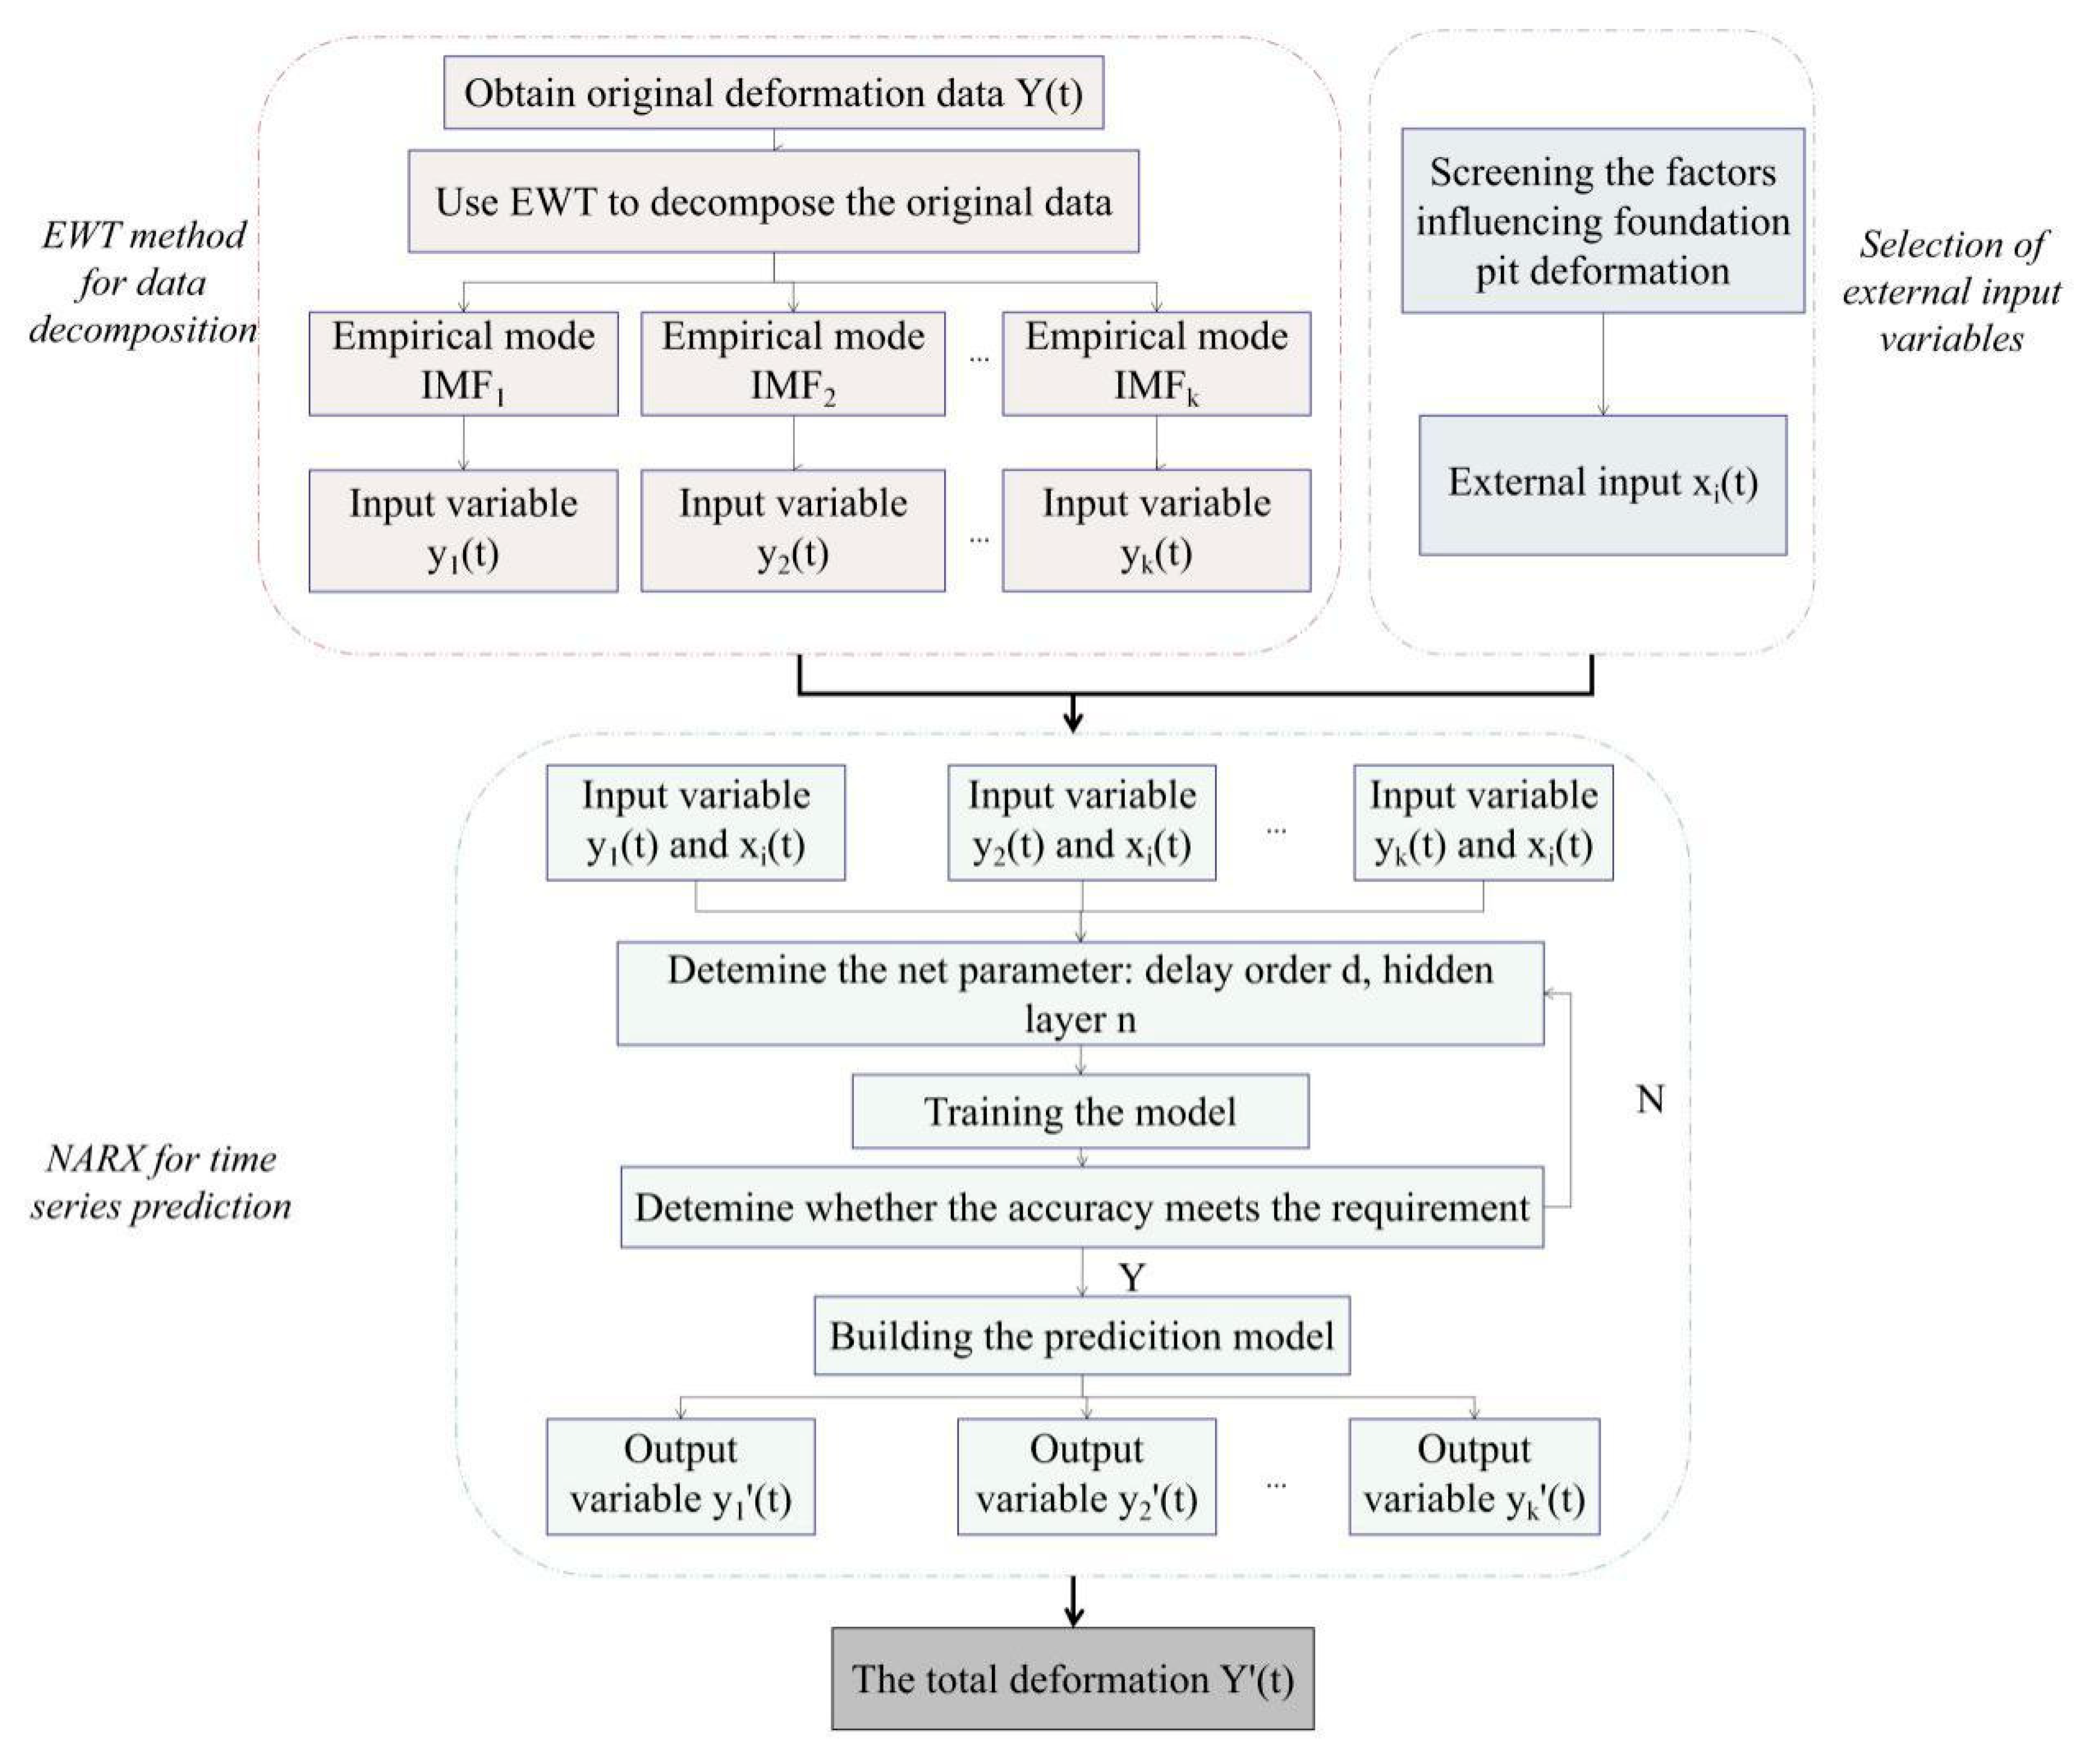
Based on the discussion of factors affecting the deformation of foundation pits, this paper established a time series model for the surface deformation of large deep foundation pits based on EWT-NARX. The process is shown in Figure 3 and briefly described below.

2.3.1. Data Decomposition by EWT

We recorded the time series of foundation pit surface deformation as Y(t), t = 1, 2, 3, 4,..., N. EWT signal processing technology was used to preprocess the original foundation pit deformation data sequence and decompose it into k empirical modes with different frequencies. The k empirical modes I M F 1 , I M F 2 , I M F 3 , , I M F k were denoted as y 1 , y 2 , y 3 , , y k . The component y i ( t ) ( i 1 , 2 , 3 , , k ) was imported into the NARX prediction model as part of the input variable to obtain the predicted results y i ( t ) , ( i 1 , 2 , 3 , , k ) at k different sub-points. The total predicted values Y ( t ) were obtained by superposition of the predicted results on different components.

2.3.2. Prediction by NARX

In view of the law regarding foundation pit settlement, scholars at home and abroad have carried on extensive research with engineering examples. Many have concluded that there are many main factors that impact foundation pit settlement, such as hydrological and climatic conditions [36,41,43,44]. However, for specific foundation pit engineering, many influencing factors have been determined in the design stage, and cannot be selected as the set of influencing factors in this paper. In addition, if all factors are taken as external input variables, the training difficulty increases and the accuracy reduces. Therefore, seven factors that may affect the change of foundation pit settlement are selected: internal friction angle, cohesion force, gravity, groundwater level, permeability coefficient, excavation depth of deep foundation pit, and axial force of internal support. In order, they are denoted as x 1 , t , x 2 , t , x 3 , t , x 4 , t , x 5 , t , x 6 , t , x 7 , t , and the set of related variables of the model can be expressed as X 7 ( t ) = [ x 1 , t , x 2 , t , x 3 , t , , x 7 , t ] . X 7 ( t ) and the historical time series of sedimentation y i ( t ) ( i 1 , 2 , 3 , , k ) constitute the input of the NARX network and the neural network is trained to obtain the prediction model. Then the prediction value at the next moment y ( t ) can be obtained.

2.3.3. Model Performance Evaluation Index

Model performance evaluation is the key to judging the prediction performance of the model. The main indicators for evaluating the performance of the NARX model are mean square error (MSE), mean absolute error (MAE), and mean relative error (MRE), etc. The smaller the values of MSE, MAE, MRE, and other indicators, the higher the prediction accuracy of the model. The equations are shown in Equations (6)–(8), respectively.
M S E = 1 N i = 1 N [ y ( i ) y ( i ) ] 2
M A E = 1 N i = 1 N | y ( i ) y ( i ) |
M R E = 1 N i = 1 N | y ( i ) y ( i ) y ( i ) |

2.4. Project Overview

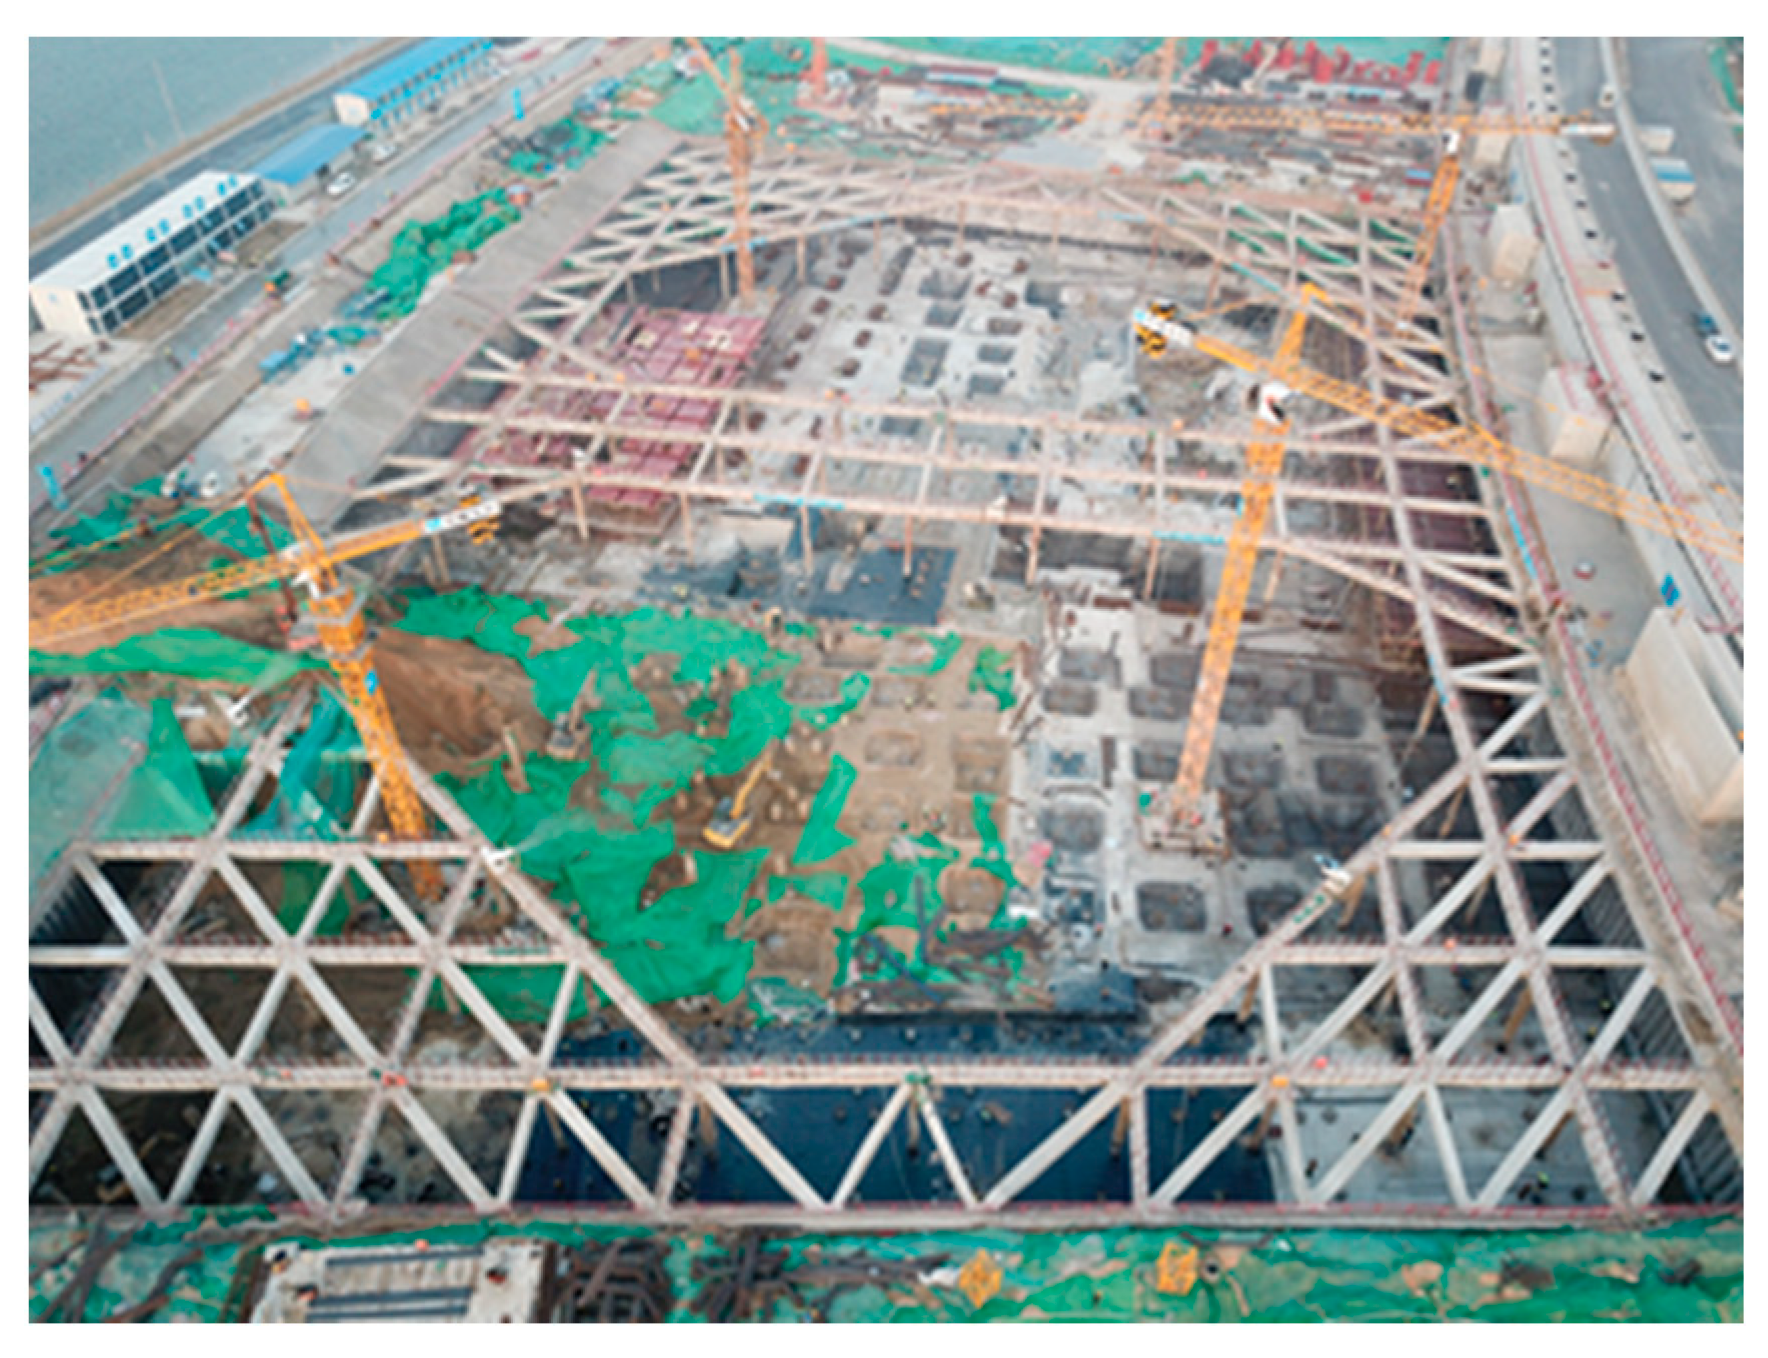
The main research object of this paper was the No. 12 foundation pit located in the outer ring of Beilonghu Financial Island, Zhengdong New District, Zhengzhou City (Figure 4 and Figure 5). The total area was about 18,366.79 m2. The underground was 4 stories and the foundation pit was generally excavated 12.5 m. The deepest area reached 16 m and belonged to large-scale deep foundation pit engineering. The supporting type was reinforced concrete supported by a bored cast-in-place pile. An equal thickness cement-soil mixing wall waterproof curtain was arranged on the outside. According to its genetic type, lithology, and engineering geological characteristics, the 16.0 m depth strata in the site were divided into 4 engineering geological unit layers and 2 engineering geological unit sublayers. Hence, 7.3 m was plain fill and 7.3–16.0 m was fine sand [36].
The buildings and roads around the proposed site were dense. The water level line near the site was high. The foundation construction was difficult and the influence on the surrounding environment was great. Therefore, it was important to predict and control the foundation pit surface settlement during construction.

3. Results and Discussion

3.1. Decomposition of Deformation Data

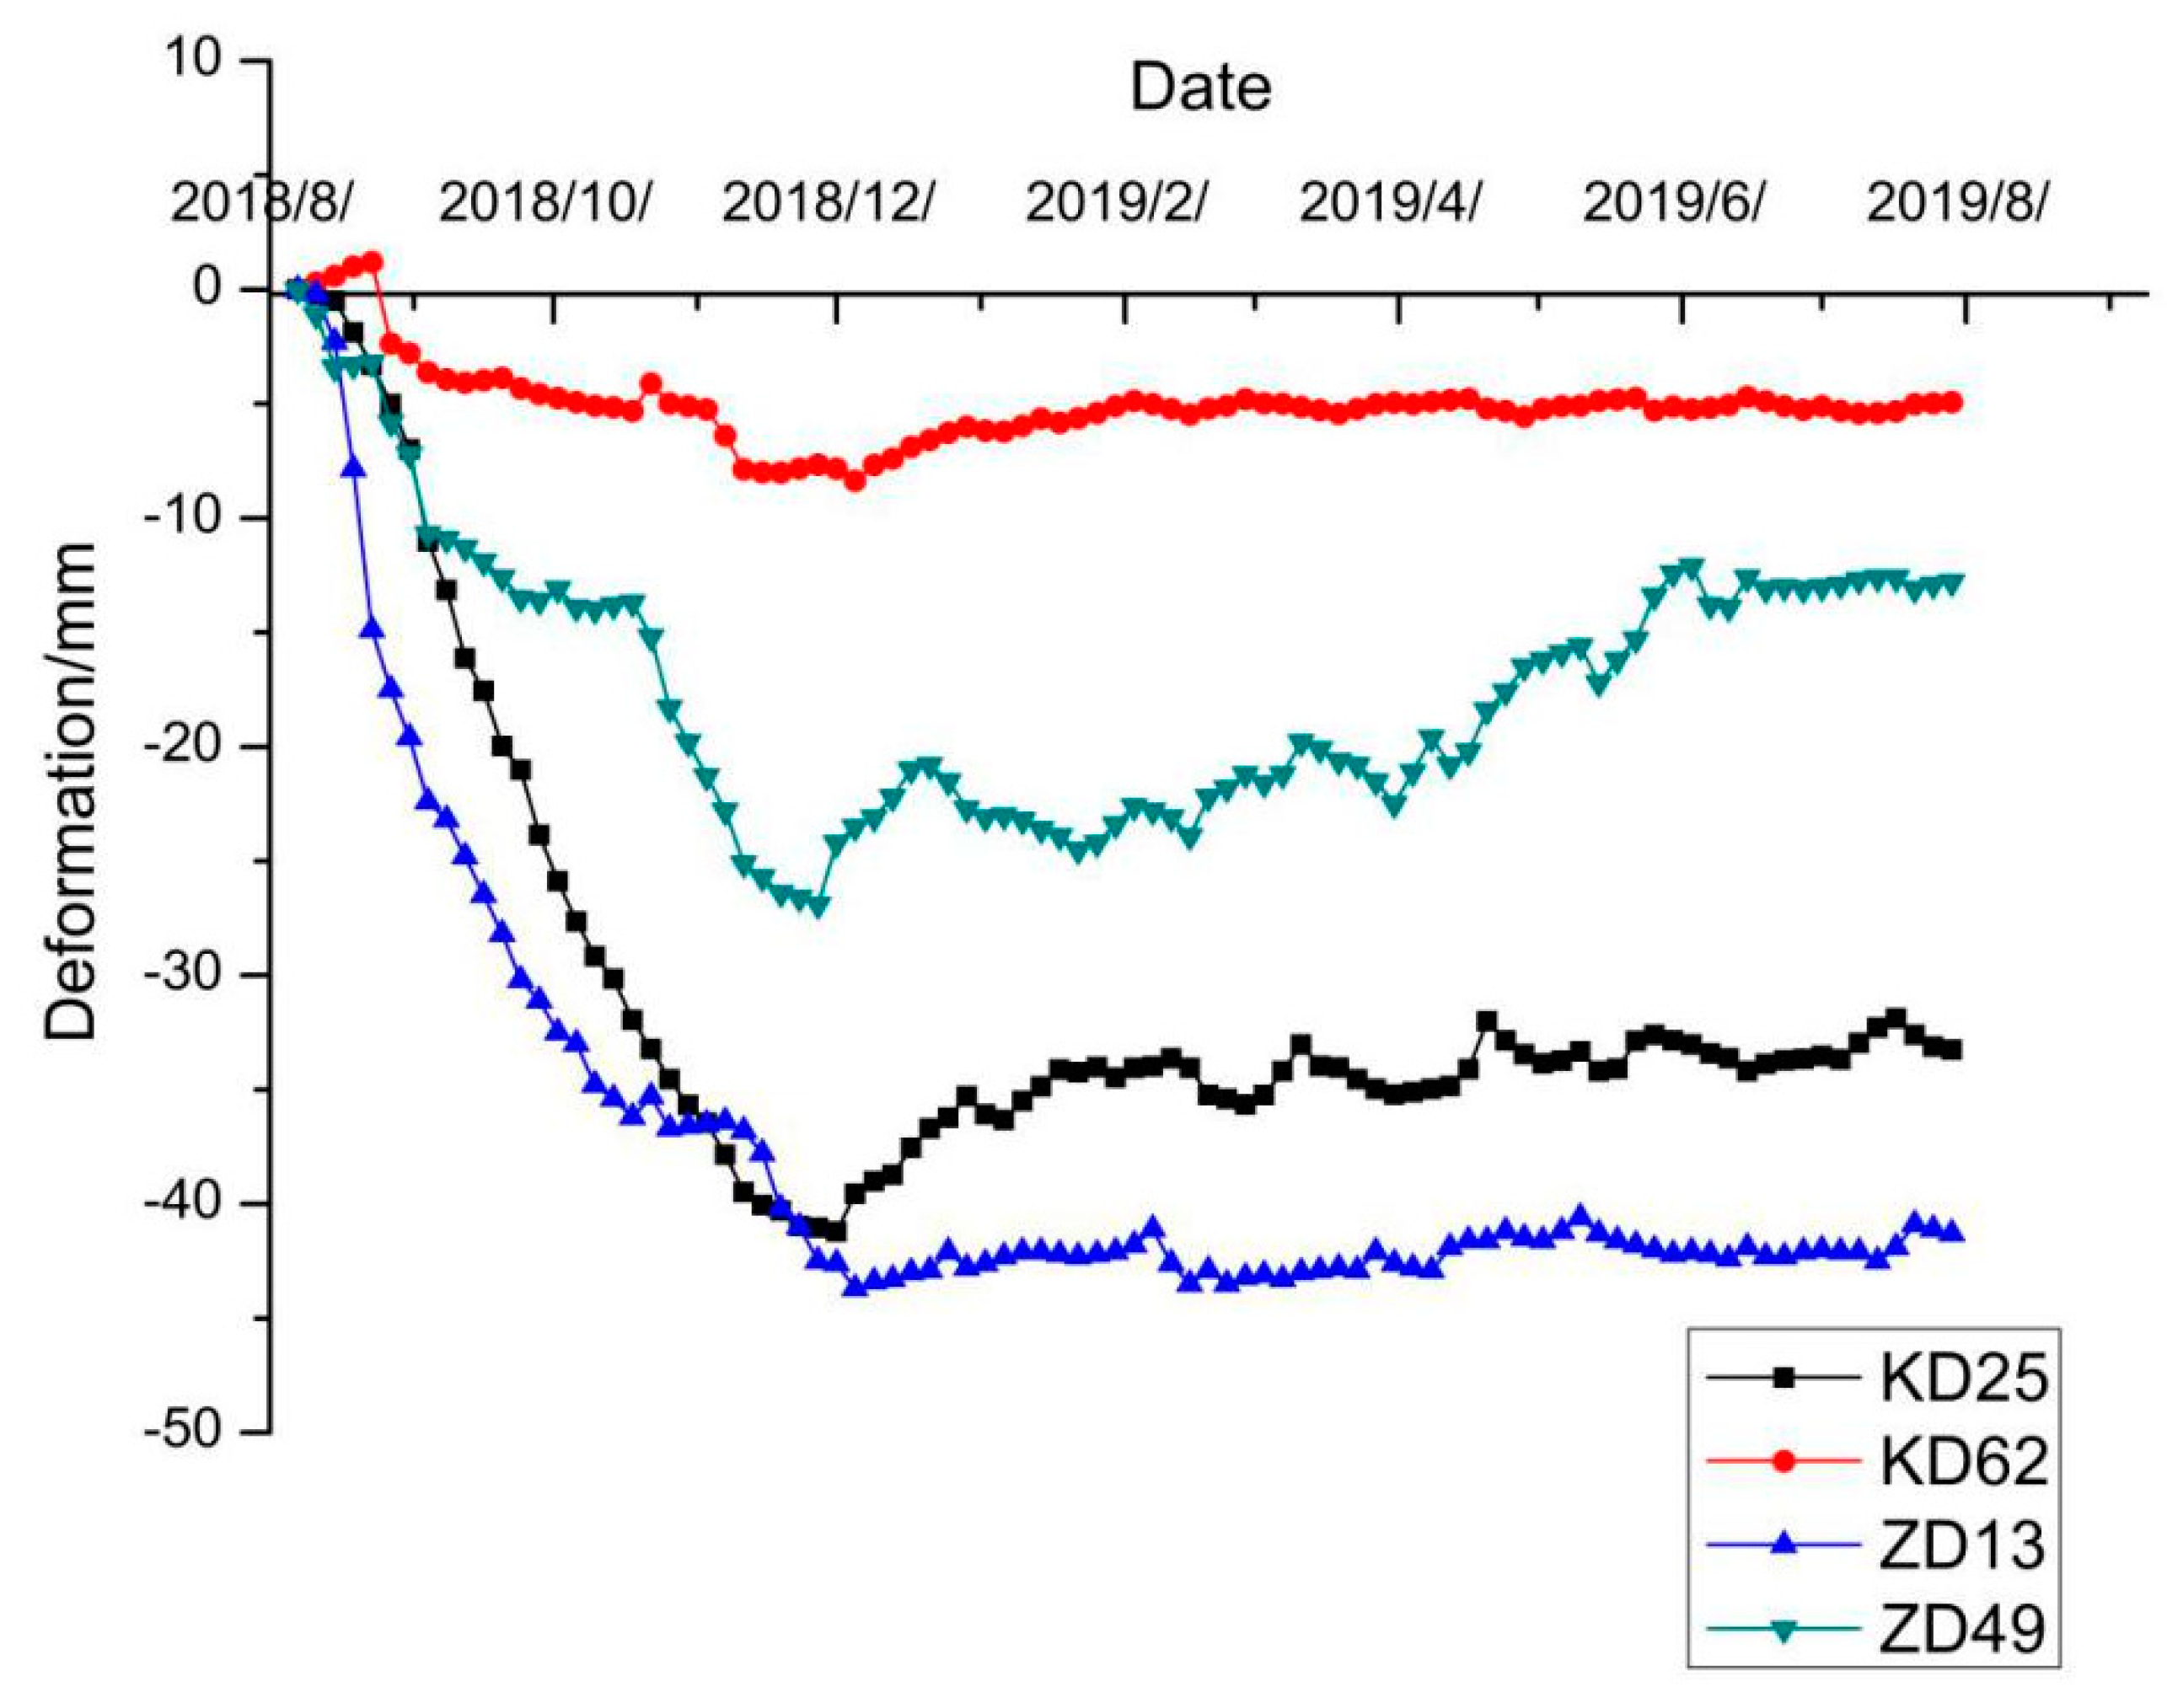
We selected four representative monitoring points—KD25, KD62, ZD13, and ZD14 —as targets. Both KD and ZD are the names of the monitoring points. Among them, those starting with KD are all settlement monitoring points, while those starting with ZD are all horizontal displacement monitoring points. KD25 and KD62 were the surface settlement monitoring points located in the middle of the foundation pit and the outer ring side, respectively. ZD13 and ZD49 were the surface horizontal displacement monitoring points located in the middle of the foundation pit and the outer ring side, respectively. We selected these four consecutive 90 periods for field monitoring data. The date range of the applied data was from 26 August 2018 to 17 August 2019. The deformation duration curve of the four points is shown in Figure 6.
As can be seen in Figure 6, the deformation curves of these four points had obvious differences. KD25 rose rapidly in the early stage, decreased slowly, and showed a state of stability with small fluctuations. KD62 varied with small fluctuations in the early stage and continued to be stable in the middle and late stages. ZD13 was in a stable state after it rose rapidly and reached the highest value. ZD49 presented a gradual increase and then a declining state of irregular fluctuations. The curves of these four points showed different trends, representing the deformation fluctuations of the monitoring points at different locations and different deformation types. Choosing these four points as detection targets can fully verify the applicability of EWT when decomposing the deformation of the foundation pit.
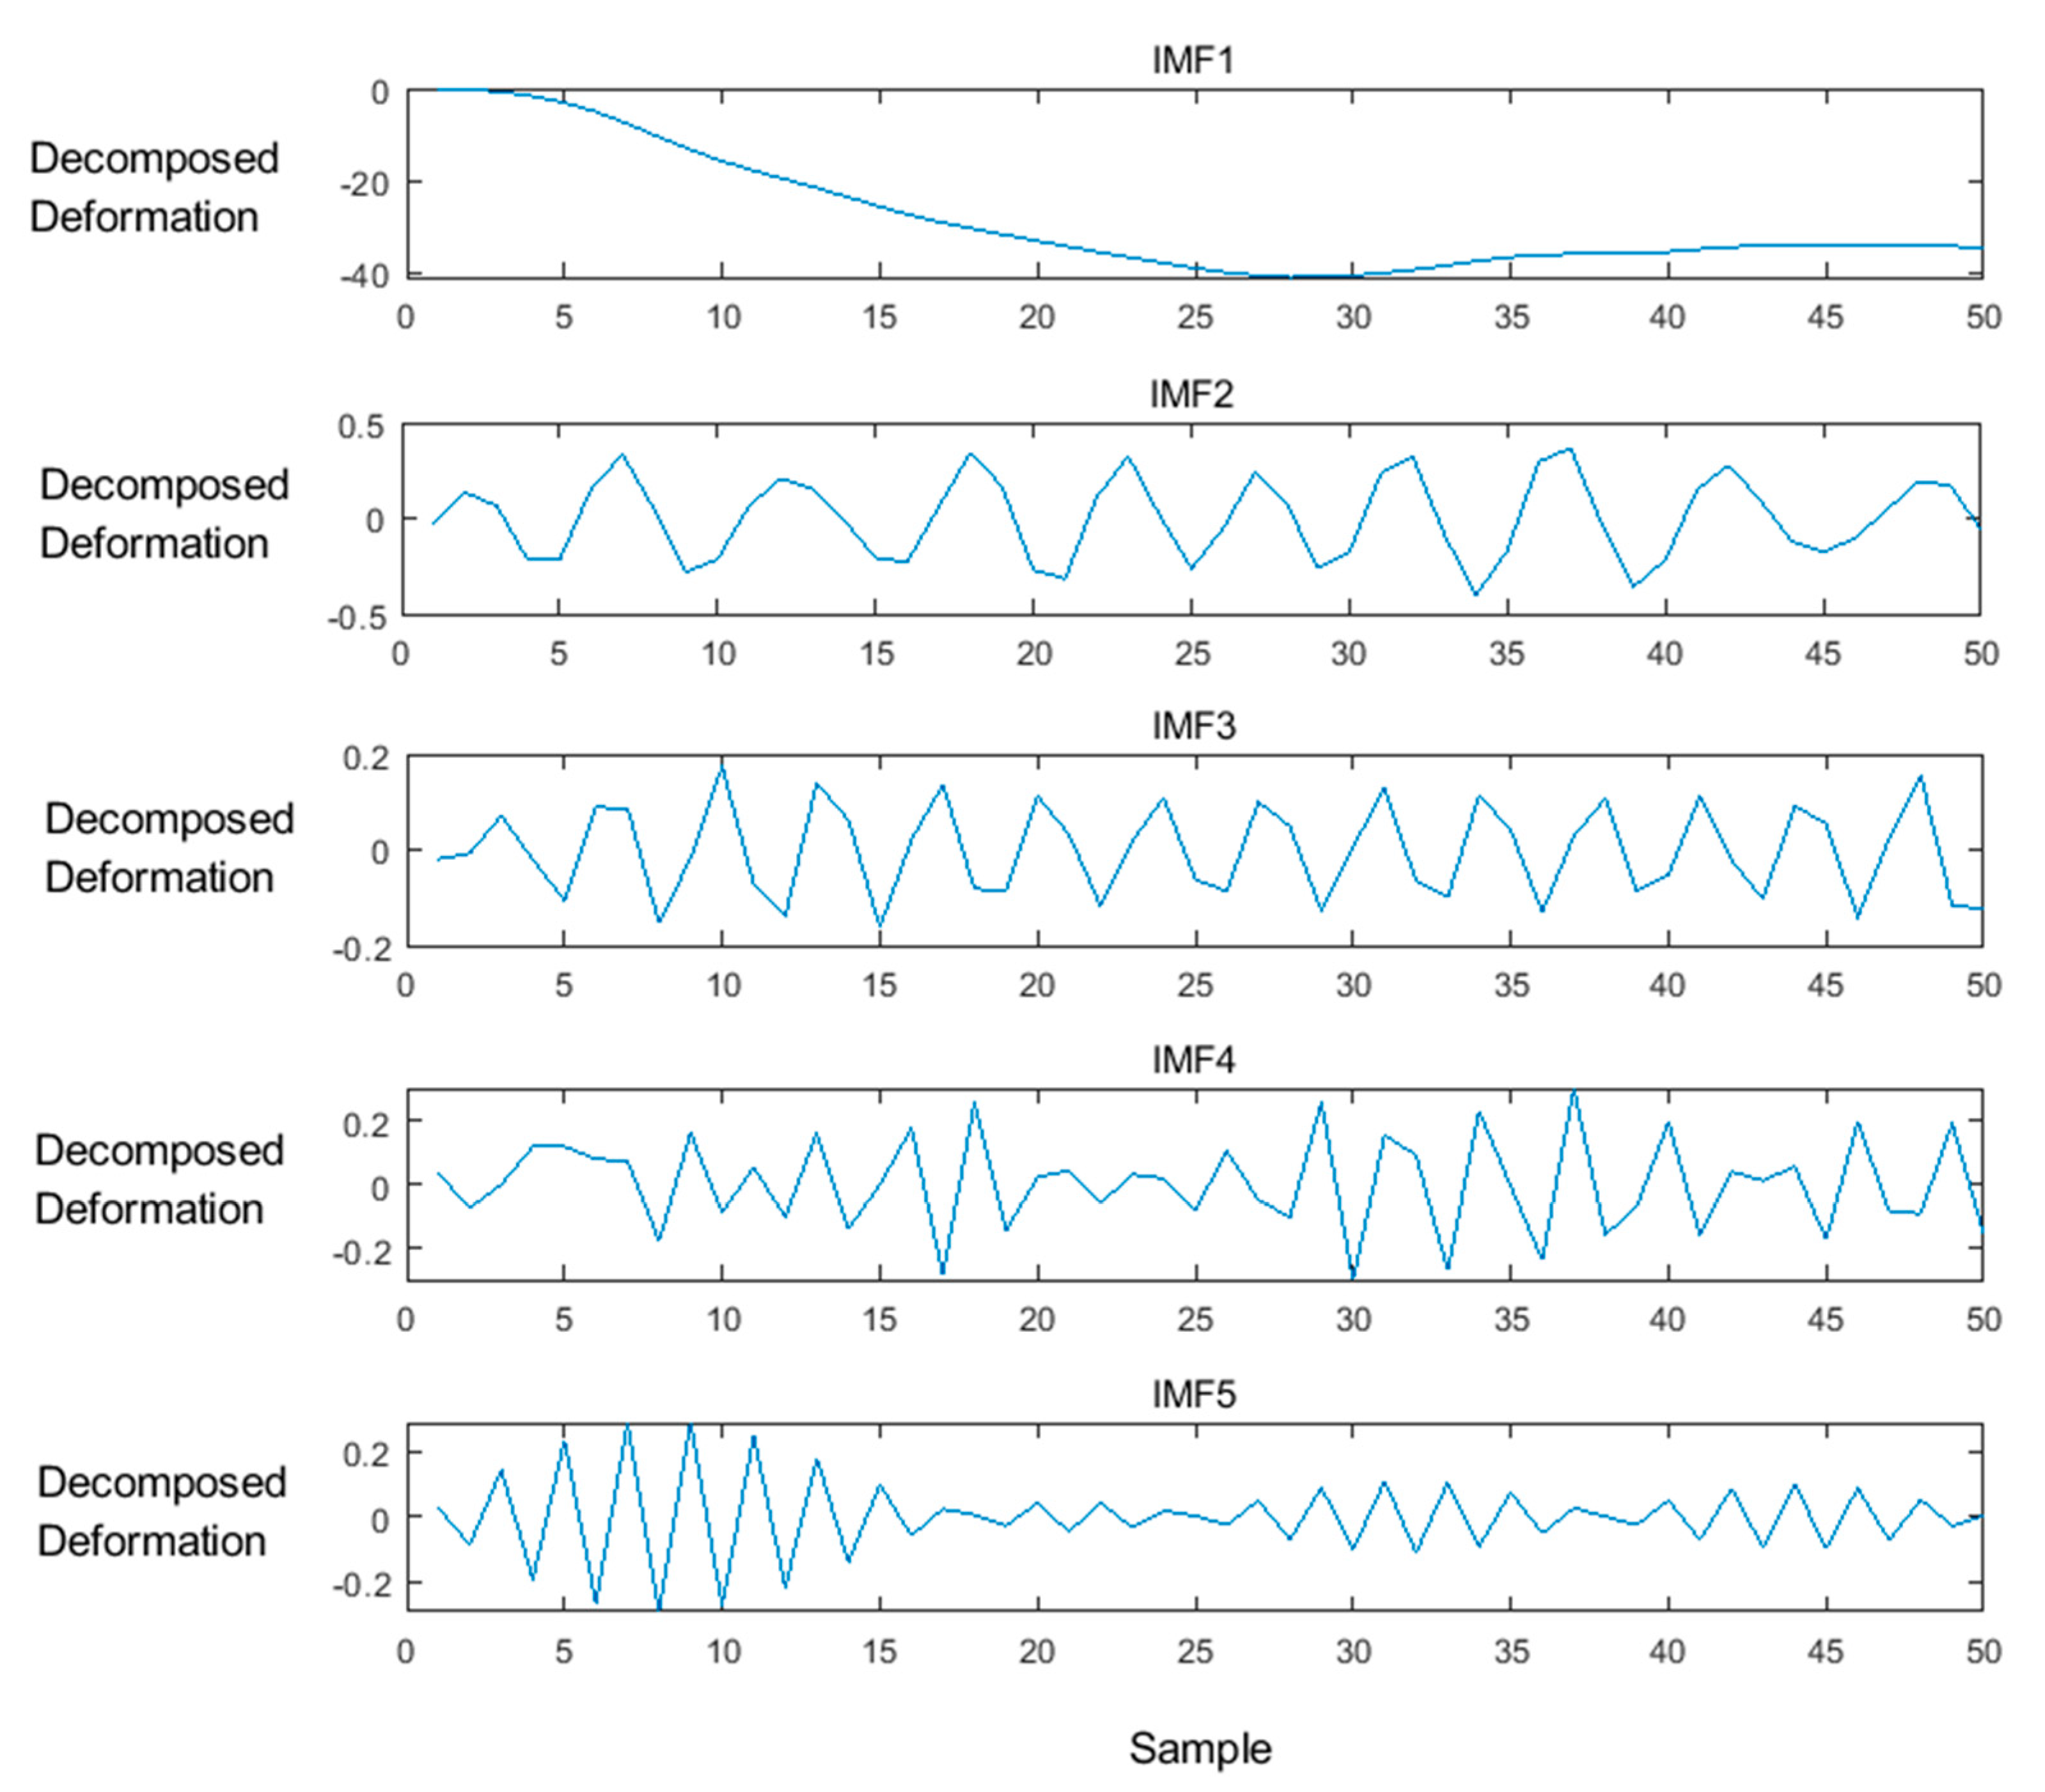
In order to omit space, this section only takes the monitoring point ZD13 as an example and uses the EWT method to decompose its settlement sequence. The results are shown in Figure 7. EWT decomposed the original horizontal displacement sequence into 5 empirical modes and the frequency characteristics of each mode were more obvious. The NARX prediction model was established for each component, thereby reducing the modeling workload and improving efficiency.

3.2. Training and Evaluation of Prediction Models

The relevant variable X 7 ( t ) and historical settlement y i ( t ) ( i 1 , 2 , 3 , , k ) of the foundation pit were used as the input data set in the NARX network. In order to judge the training effect of the network, 35 sets of data were used as the training set for model, 8 sets as the test set, and 7 sets as the prediction set. After the model training, we chose the NARX network delay order, d, to be 4, and the hidden layer, m, to be 10. The NARX dynamic neural network model has a high accuracy, which was obtained after training. When the overall goodness of fit coefficient R was greater than 0.95, the prediction model was considered to have excellent performance and can met the requirements.
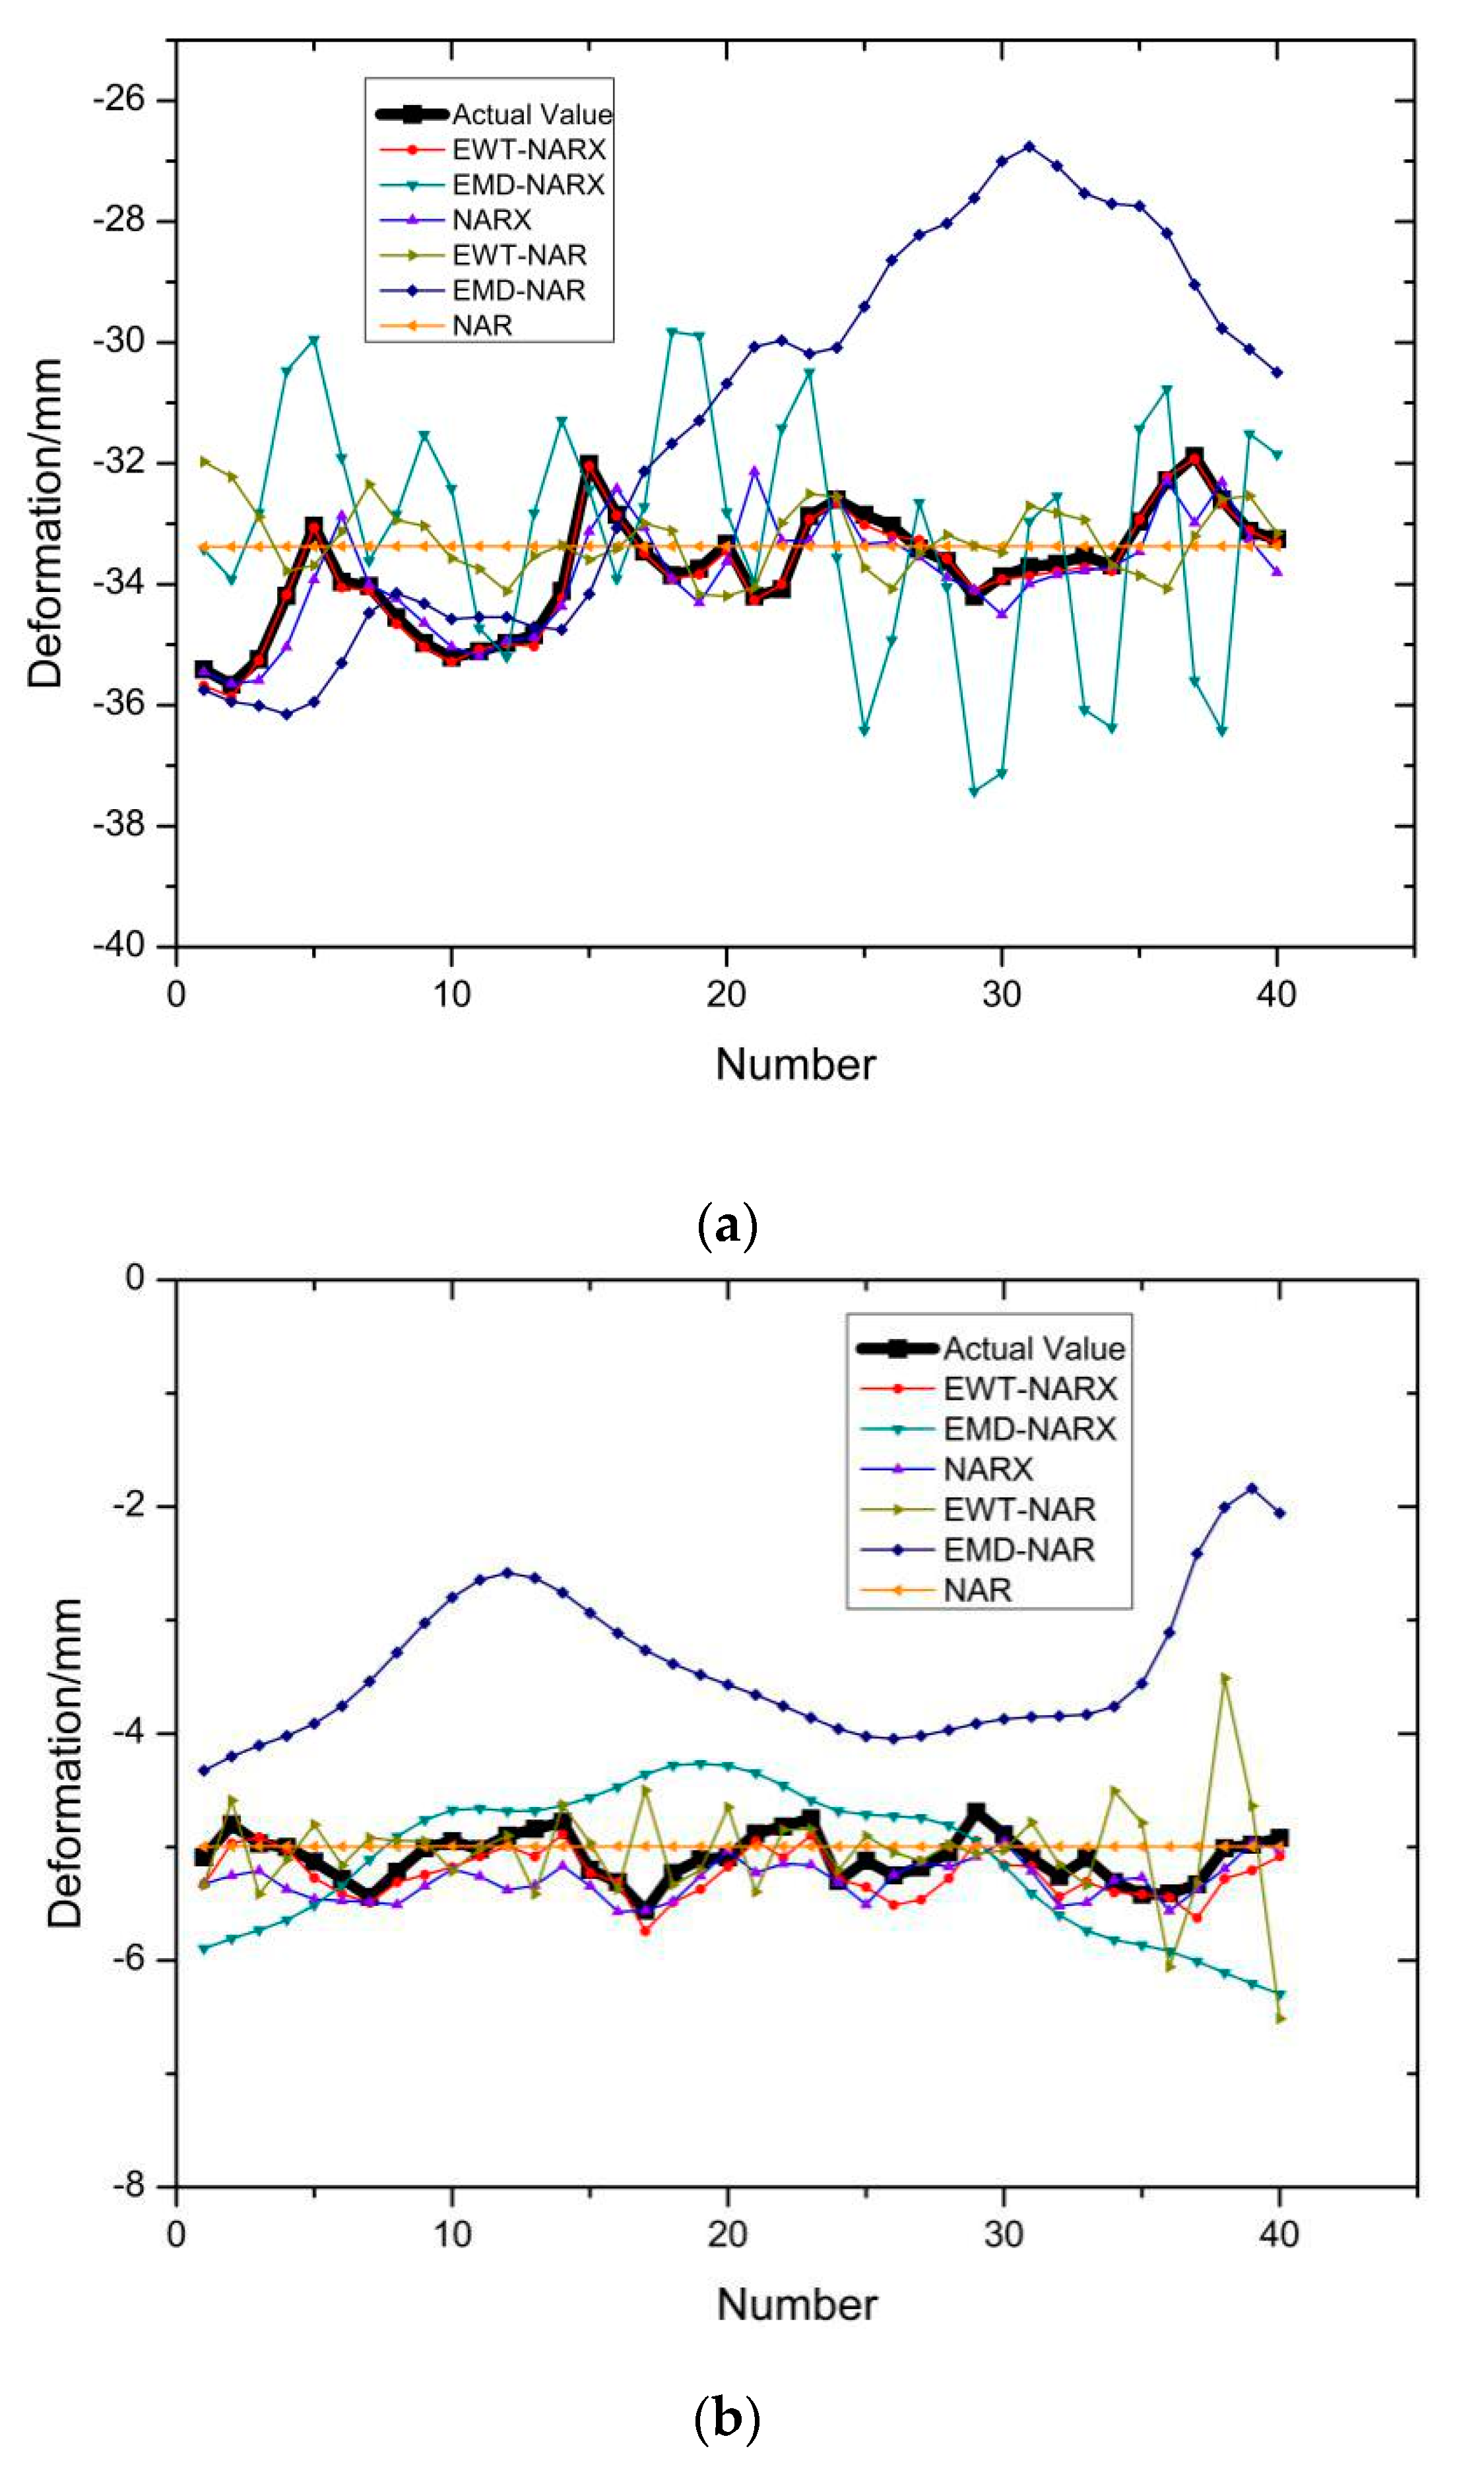
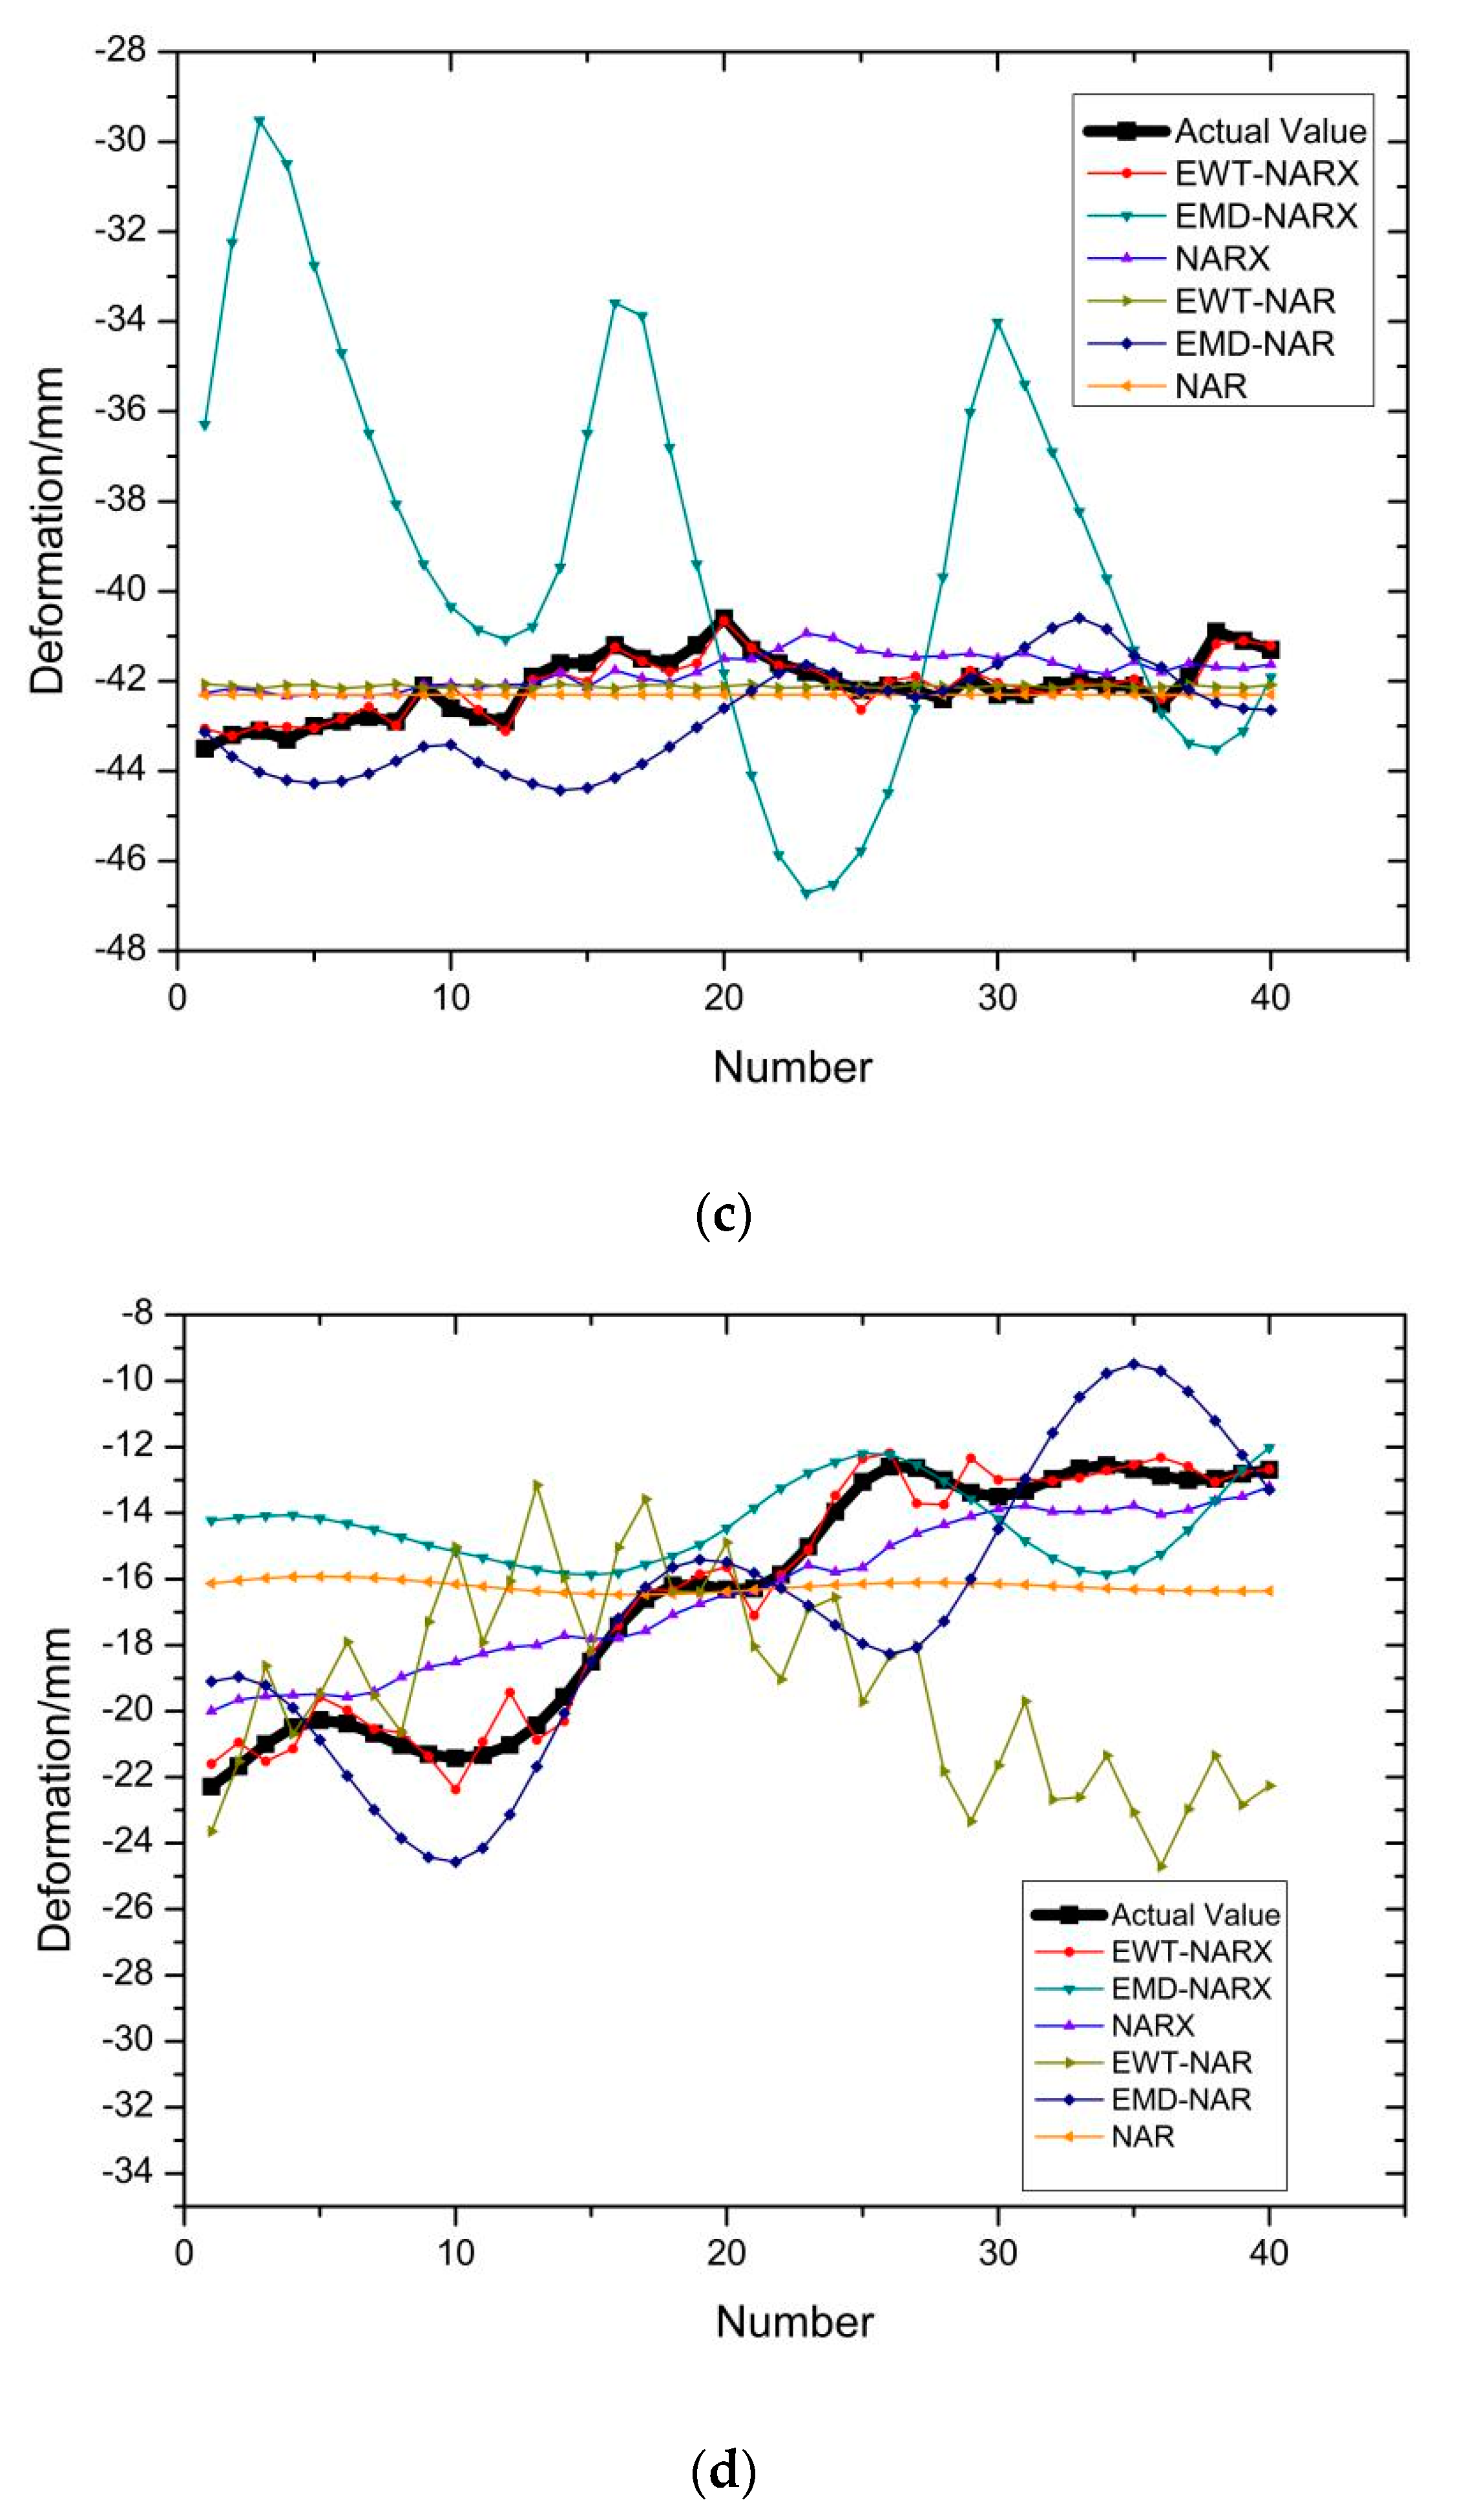
In order to verify the prediction effect of the EWT-NARX dynamic neural network model, we used the NAR model, EMD-NAR model, EMD-NARX model, EWT-NAR model, and EWT-NARX model to predict the deformation of the foundation pit. The foundation pit settlement curves predicted by the four models are summarized in Figure 8. The comparison of the prediction effects is shown in Table 1.
After the analysis of Figure 8, we believed that most of the six models used in this paper could suitably predict the foundation pit deformation, whether it was the prediction of surface settlement (KD25, KD62) or the prediction of horizontal displacement (ZD13, ZD49). However, it was obvious that the predicted curve of the EWT-NARX model was more consistent with the actual monitoring curve. Furthermore, the EWT-NARX model could respond and realize the prediction of fluctuations in time whether to predict the data with large or small fluctuations in the later period.
Table 1 summarizes our accuracy evaluation for each model of EWT combined with NARX, MAE, MRE, and MSE. By comparing the results of the NARX, EMD-NARX and EWT-NARX models, we found that whether the target was KD25, KD62, ZD13 or ZD49, the EWT-NARX model had the minimum error value. Table 2 summarizes the reduction ratio of each model to EWT-NARX. Taking point KD25 as an example, the MAE in EWT-NARX was 78.58% and 95.71% lower than NARX and EMD-NARX. Further, the reduction ratio of KD62 was 28.36% and 52.86%, whereas the reduction ratio of ZD13 was 73.10% and 70.40%. Moreover, the reduction ratio of ZD49 was 90.33% and 97.31%. Such results show that EWT had good modal decomposition ability and greatly improved the accuracy of NARX prediction model. In addition, its modal decomposition ability was better than EMD. Compared with the MAE of EWT-NAR, the MAE of KD25 predicted by EWT-NARX was reduced by 91.35%. Further, the reduction ratio of KD62 was 71.45% and the reduction ratio of ZD13 was 87.59%. Lastly, the ratio of ZD49 was 95.88%. These results indicate that EWT greatly improves the accuracy of the NARX model’s prediction target. When the predicted targets were consistent, NARX can adjust the predicted value when the external conditions changed, as it introduced an external input and had a higher accuracy. This result proves that the combination of NARX is more suitable for EWT decomposition than NAR.
Whether it is comparing the fit of each curve with the real curve in Figure 8, or comparing the accuracy of each model, we can clearly draw conclusions: the EWT-NARX model shows high accuracy and stability in predicting deformation of different positions and types. This is because EWT’s good data decomposition ability provides a good data basis for NARX’s prediction, and NARX can introduce external input variables to make it more advantageous in predicting curves with fluctuations. Therefore, the combination of EWT and NARX can be applied in the deformation prediction of foundation pit.

4. Conclusions

In this paper, the NAR model, EMD-NAR model, EMD-NARX model, EWT-NARX model, and EWT-NARX model were used to predict different targets. By analyzing the prediction curve and model accuracy table, we discussed the possibility and applicability of EWT-NARX combinations. The results showed that, the accuracy of the EWT-NARX model was higher than that of EMD-NARX model and NARX model, indicating that the data decomposition ability of EWT was higher than EMD. Moreover, the introduction of EWT improved the prediction accuracy of the NARX model. On the other hand, the accuracy of the EWT-NARX model was higher than the EWT-NAR model, indicating that the NARX model’s characteristics of external input make it more suitable for predicting the fluctuation curve of drastic changes in the external environment. The combination of NARX and EWT gave full play to this advantage. The research methods and results of this paper can provide theoretical support for foundation pit surface deformation prediction that is in the process of foundation pit excavation in a complex environment.

Author Contributions

Conceptualization, Q.M.; methodology, Q.M.; validation, Q.M. and S.L.; formal analysis, Q.M. and S.L.; investigation, Q.M. and S.L.; resources, Q.M.; data curation, S.L.; writing—original draft preparation, S.L.; writing—review and editing, Q.M., S.L., X.F., C.C., Y.W., and K.Y.; visualization, S.L.; supervision, Q.M.; project administration, Q.M.; funding acquisition, Q.M. All authors have read and agreed to the published version of the manuscript.

Funding

This research was funded by Science and Technology Development Plan of Henan Province in 2018, grant number 182102310900.

Acknowledgments

The authors express their appreciation for the financial support of Science and Technology Development Plan of Henan Province, grant number 182102310900. Thanks to reviewers for their valuable comments.

Conflicts of Interest

The authors declare no conflict of interest.

Abbreviations

EWTEmpirical wavelet transform
EMDEmpirical mode decomposition
HHTHilbert-Huang transform
NARNonlinear autoregressive
NARXNonlinear autoregressive exogenous
MSEMean square error
MAEMean absolute error
MREMean relative error
IMFIntrinsic mode function

References

  1. Jiang, X.F.; Liu, G.B.; Zhang, W.L. Study on deformation characteristics of ultra-deep foundation pits in Shanghai area based on measured data. J. Rock Soil Eng. 2010, 32, 570–573. [Google Scholar]
  2. Tan, Y.; Li, M.W. Measured performance of a 26 M deep top-down excavation in Downtown Shanghai. Can. Geotech. J. 2011, 48, 704–719. [Google Scholar] [CrossRef]
  3. Liao, S.M.; Liu, J.H.; Wang, R.L. Shield Tunneling and Environment Protection in Shanghai soft ground. Tunn. Undergr. Space Technol. 2009, 24, 454–465. [Google Scholar] [CrossRef]
  4. Tan, Y.; Wei, B. Performance of an Overrestrained Metro station and facilities nearby. J. Perform. Facil. 2012, 26, 241–254. [Google Scholar] [CrossRef]
  5. Yin, G.Z.h.; Yue, S.H.; Zh, T.; Li, D.Q. Analysis of tunnel displacement time series based on ARMA model. Rock Soil Mech. 2009, 30, 2727–2732. [Google Scholar]
  6. Xu, Q.; Guo, W.; He, S. Research on prediction of ground settlement in foundation pit excavation based on log-arma combination model. Safety Environ. Eng. 2017, 24, 160–163. [Google Scholar]
  7. Zhao, Z.X. Analysis and Prediction of Deep Foundation Pit Deformation Based on Time Series Metabolism Method. Master’s Thesis, Shanghai Jiao Tong University, Shanghai, China, 2018. [Google Scholar]
  8. Cao, J.; Ding, W.Y.; Zhao, D.S.; Song, Z.G.; Liu, H.M. Prediction of foundation pit deformation time series based on lssvm-arma model. Rock Soil Mech. 2014, 35, 579–586. [Google Scholar]
  9. Ghaderpour, E.; Vujadinovic, T. The Potential of the Least-Squares Spectral and Cross-Wavelet Analyses for Near-Real-Time Disturbance Detection within Unequally Spaced Satellite Image Time Series. Remote Sens. 2020, 12, 2446. [Google Scholar] [CrossRef]
  10. Li, S.H.M.; Guo, H.D.; Li, D.R. Overview of vibration signal processing methods. Chin. J. Sci. Instrum. 2013, 34, 1907–1915. [Google Scholar]
  11. Chui, C.K.; Wang, J.Z. A cardinal spline approach to wavelets. Am. Math. Soc. 1991, 113, 785–793. [Google Scholar] [CrossRef]
  12. Niu, P.F.; Zhang, J.; Zou, G. Study on application of wavelet transform technique to turbine generator fault diagnosis. Chin. J. Sci. Instrum. 2007, 28, 189–192. [Google Scholar]
  13. Newland, D.E. Ridge and phase identification in the frequency analysis of transient signals by harmonic wavelets. J. Vib. Acoust. 1999, 121, 149–155. [Google Scholar] [CrossRef]
  14. Huang, N.E.; Shen, Z.; Long, S.R. The empirical mode decomposition and the Hilbert spectrum for nonlin- ear and non-stationary time series analysis. Proc. R. Soc. Lond. Ser. A-Math. Phys. Eng. Sci. 1998, 454, 903–995. [Google Scholar] [CrossRef]
  15. Huang, N.E.; Wu, Z. A review on Hilbert-Huang transform: Method and its applications to geophysical studies. Rev. Geophys. 2008, 46, RG2006. [Google Scholar] [CrossRef] [Green Version]
  16. Wang, T. Research on EMD Algorithm and its Application in Signal Denoising. Master’s Thesis, Harbin Engineering University, Harbin, China, 2010. [Google Scholar]
  17. Gilles, J. Empirical Wavelet Transform. IEEE Trans. Signal Process. 2013, 61, 3999–4010. [Google Scholar] [CrossRef]
  18. Li, Y.; Wu, H.; Liu, H. Multi-step Wind Speed decomposition using EWT decomposition, LSTM Principal Computing, RELM subordinate computing and IEWT reconstruction. Energy Convers. Manag. 2018, 167, 203–219. [Google Scholar]
  19. Liu, H.; Wu, H.; Li, Y. Smart Wind Speed Forecasting using EWT decomposition, GWO evolutionary optimization, RELM learning and IEWT reconstruction. Energy Convers. Manag. 2018, 161, 266–283. [Google Scholar]
  20. Zhuo, Z.Y.; Cao, Q.; Li, Q. Short-term wind power combination prediction based on ewt-kelm method. Electr. Meas. Instrum. 2019, 56, 83–89. [Google Scholar]
  21. Wang, X.Y.; Li, Q.; Zheng, S. Short-term Wind Power Prediction Based on EWT-ESN. J. Solar Energy 2008, 39, 633–642. [Google Scholar]
  22. Hu, J.; Wang, J. Short-term wind speed prediction using empirical wavelet transform and Gaussian process regression. Energy 2015, 93, 1456–1466. [Google Scholar] [CrossRef]
  23. Cui, J.X.; Zou, H.W. Research on Chinese stock market forecast based on ewt-pso-svm error correction combination model. Syst. Sci. Math. 2019, 39, 1212–1235. [Google Scholar]
  24. Li, Z.H.N.; Zhu, M.; Zhu, F.L.; Xiao, Y.X. Research on mechanical fault diagnosis method based on empirical wavelet transform. Chin. J. Instrum. 2014, 35, 2423–2432. [Google Scholar]
  25. Chegini, S.N.; Bagheri, A.; Najafi, F. Application of A new ewt-based denoising technique in bearing fault diagnosis. Meas. J. Int. Meas. Confed. 2019, 144, 275–297. [Google Scholar] [CrossRef]
  26. Thirumala, K.; Pal, S.; Jain, T.; Umarikar, A.C. A Classification method for multiple power quality factor using EWT Based Adaptive Filtering and Multiclass SVM. Neurocomputing 2019, 334, 265–274. [Google Scholar] [CrossRef]
  27. Yu, H.; Li, H.; Li, Y. Vibration Signal Fusion Using Improved Empirical Transform and Variance Contribution Rate for weak Fault Detection of hydraulic Pumps. ISA Trans. 2020, in press. [Google Scholar] [CrossRef]
  28. Cheng, T.D.; Wu, Y.W.; Luo, X.Y.; Dai, C.C.; Yin, B.Y. Feature extraction and classification method of mine microseismic signal based on EWT-Hankel-SVD. Acta Instrum. 2019, 40, 181–191. [Google Scholar]
  29. Liu, Y.Y.; Tian, T.; Wang, C.X. Prediction of structural health state trend based on EWT and FESN. Chin. J. Kinet. 2019, 36, 645–651. [Google Scholar]
  30. Guo, J.; Zha, L.Y.; Pang, Y.C.h.; Shen, S.S.; Xia, P. Prediction of deep foundation pit surface settlement based on wavelet analysis. J. Geotech. Eng. 2014, 36, 343–347. [Google Scholar]
  31. Xu, S.; Niu, R. Displacement prediction of Baijiu jected based on empirical mode decomposition and long short-term memory neural network in Three Gorges Area, China. Comput. Geosci. 2018, 111, 87–96. [Google Scholar] [CrossRef]
  32. Li, M.; Shen, Y.; Ren, Q.; Li, H. A new Distributed Time Series Evolution Model for dam deformation based on Commodity Prices. Adv. Eng. Inform. 2019, 39, 41–52. [Google Scholar] [CrossRef]
  33. Wen, M.; Zhang, D.L.; Fang, Q.; Zhang, L.Y. NARXNN time series prediction model for ground subsidence during subway station construction. J. Rock Mech. Eng. 2015, 34, 3306–3312. [Google Scholar]
  34. Wen, M.; Zhang, S.L.; Fang, Q.; Qi, J.; Fang, H.C.; Chen, W.B. Study on nonlinear autoregressive time series prediction method for tunnel surrounding rock deformation. J. Beijing Jiaotong Univ. 2017, 41, 1–7. [Google Scholar]
  35. Lin, T.G.; Horne, B.G.; Tino, P. Learning long-term dependencies in NARX neural networks. IEEE Trans. Neural Netw. 1996, 7, 1329–1338. [Google Scholar] [PubMed] [Green Version]
  36. Ma, Q.W.; Liu, S.H.; Zhao, X.C. PCA-NARX Time Series Prediction Model of Surface Settlement during Excavation of Deep Foundation Pit. In Proceedings of the 2020 4th International Conference on Water Conservancy, Hydropower and Building Engineering, Lanzhou, China, 3–5 July 2020. [Google Scholar]
  37. Liu, H.; Wu, H.; Lv, X.; Ren, Z.; Liu, M.; Li, Y.; Shi, H. An intelligent hybrid Model for Air Pollutant concentration forecasting: Case of Beijing in China. Sustain. Cities Soc. 2019, 47, 101471. [Google Scholar] [CrossRef]
  38. Liu, M.Y.; Li, Q.L.; Li, Z.J.; Ma, Y.N.; Zhang, H.C.; Jiang, F.Q.; Yao, Y.M. Application of NARX neural network based on wavelet analysis in water level prediction. South-to-North Water Transf. Water Sci. Technol. 2019, 17, 56–63. [Google Scholar]
  39. Zhang, Z.H.H.; Ma, C.h.; Xu, J.H.; Ouyang, Z.Z. Combined forecast of total power of wind farm by EMD and NARX neural network. Comput. Eng. Appl. 2016, 52, 265–270. [Google Scholar]
  40. Daubechies, I. Ten Lectures on Wavelets; Society for Industrial and Applied Mathematics: Philadelphia, PA, USA, 1992. [Google Scholar]
  41. Ge, M. Study on Deformation Law and Influencing Factors of Subway Foundation Pit excavation in Soft soil area of Tianjin. Master’s, Thesis, Beijing Jiaotong University, Beijing, China, 2016. [Google Scholar]
  42. Wong, C.X.; Worden, K. Generalised NARX Shunting Neuralnet-Work Modeling. Mechanloal Syst. Signal Process. 2007, 21, 553–572. [Google Scholar] [CrossRef]
  43. Wu, C.Y. Research on the Influence of Subway station Foundation Pit Construction on adjacent Buildings. Ph.D. Thesis, Hunan University, Changsha, China, 2015. [Google Scholar]
  44. Huang, C.S. Research on deformation prediction Method and Engineering Application of Subway Deep Foundation Pit Excavation. Ph.D. Thesis, Central South University, Changsha, China, 2011. [Google Scholar]
Figure 1. Fourier spectrum segmentation.
Mathematics 08 01535 g001
Figure 2. NARX network structure diagram.
Mathematics 08 01535 g002
Figure 3. Flow chart of the EWT-NARX foundation pit deformation prediction.
Mathematics 08 01535 g003
Figure 4. Beilong Lake Financial Island.
Mathematics 08 01535 g004
Figure 5. Schematic diagram of the foundation pit shape and surrounding environment.
Mathematics 08 01535 g005
Figure 6. Surface deformation duration curve of each monitoring point.
Mathematics 08 01535 g006
Figure 7. Decomposition results of ZD13 via EWT.
Mathematics 08 01535 g007
Figure 8. The prediction results of different models at each point: (a) The prediction results of point KD62; (b) the prediction results of point ZD13; (c) the prediction results of point KD25; (d) the prediction results of point ZD49.
Mathematics 08 01535 g008aMathematics 08 01535 g008b
Table 1. The reduction ratio of each model compared to EWT-NARX.
NARNARXEMD-NAREWT-NAREMD-NARXEWT-NARX
KD25MAE0.80340.39772.85610.98521.98730.0852
MRE0.02360.01190.08540.02890.05890.0025
MSE1.01210.327012.71851.60485.33520.0110
KD62MAE0.18560.21861.67570.54850.33220.1566
MRE0.03590.04370.32830.10740.06500.0310
MSE0.05230.06933.24870.40650.24190.0332
ZD13MAE0.59170.61481.11624.50090.55870.1654
MRE0.01410.01460.02660.10630.01330.0039
MSE0.51570.45331.867731.50320.48530.0457
ZD49MAE3.24501.35632.03063.18464.87470.1311
MRE0.19840.08240.13370.17500.34340.0081
MSE13.22032.7092164.931915.881837.70210.0227
Table 2. The reduction ratio of each model to EWT-NARX.
NARNARXEMD-NAREWT-NAREMD-NARX
KD25MAE89.40%78.58%97.02%91.35%95.71%
MRE89.41%78.99%97.07%91.35%95.76%
MSE98.91%96.64%99.91%99.31%99.79%
KD62MAE15.63%28.36%90.65%71.45%52.86%
MRE13.65%29.06%90.56%71.14%52.31%
MSE36.52%52.09%98.98%91.83%86.28%
ZD13MAE72.05%73.10%85.18%96.33%70.40%
MRE72.34%73.29%85.34%96.33%70.68%
MSE91.14%89.92%97.55%99.85%90.58%
ZD49MAE95.96%90.33%93.54%95.88%97.31%
MRE95.92%90.17%93.94%95.37%97.64%
MSE99.83%99.16%99.99%99.86%99.94%