1. Introduction
One of the essential sections of the queuing theory is the theory of priority systems. In such systems, customers of different classes are assigned different categories of importance and service is carried out in accordance with a priority scheme. More important customers have an advantage in access to service compared to less important ones. Priority queueing models arise in many real world applications. In particular, the considered in this paper priority queueing model can be effectively used in various applications in telecommunication networks, where traffic prioritization is required, e.g., when using the IEEE 1588 synchronization protocol in cellular networks, DVB-T2 video transmission for synchronizing TV transmitters, in unmanned vehicle systems, in telemedicine applications, etc., it is necessary to ensure the guaranteed delivering of the highest priority packets. Similar models are used for voice and data transmission in multiprocessor switching nodes to ensure priority of voice traffic. The model has applications in other areas, including scheduling computations in multiprocessor systems, operation of medical institutions, etc. Various priority schemes are used in hospital emergency departments during sorting incoming patients according to the severity o, e.g.f the injury or disease, see, e.g., [
1]. In the case of unreliable systems, a priority customer may be considered as equipment failure. Priority can be also set to maximize a company’s profit or increase system utilization. For instance, an online store the manager can set a high priority for customers of big spenders in order to prevent their departure to other online resources, see [
2]. In some telecommunication networks, the priority of a customer is determined by its owner through a Service Level Agreement (SLA), whereby certain customers have chosen to pay more so as to get high-priority access to some high-demand resource.
Another set of potential applications of the priority queueing model like considered in our paper is described in [
3] as applications in customer service centers, see [
4], airport security checkpoints [
5], hospital emergency rooms [
6], cloud computing systems [
7] or processor management in certain computer operating systems [
8].
There is an extensive literature on priority queues. An overview of early research works on priority queueing models can be found in monographs [
9,
10,
11,
12,
13] and references therein. Mostly of these works focused on the queueing models with stationary Poisson inputs. However, the area of application of these models is currently being greatly narrowed, since flows in modern telecommunication networks do not possess memoryless property of stationary Poisson flow. They are, as a rule, correlated and heterogeneous. In the case of homogeneous customers, a good mathematical model of such flows well known in the literature as a Markovian arrival process (
), see, e.g., [
14,
15,
16]. A
is the significant generalization of the stationary Poisson process to the case of correlated bursty traffic. Queuing systems with a
and priorities are discussed in the papers [
17,
18,
19,
20,
21,
22,
23,
24,
25,
26].
Markovian arrival processes are a suitable class of stochastic processes to represent correlated traffic in case when all customers are of the same type and only the sequence of inter-arrival times is of interest. However, systems with correlated flows of heterogeneous customers are also of great interest to applications. Such flows are well modeled by a marked Markovian arrival process (
), see [
27]. Using of a
allows to represent flows where inter-arrival times are correlated across customer classes and to achieve models of greater accuracy. However, very few results are known about priority queue with
. We can only refer to the papers [
1,
25,
26,
28]. In [
28]
queue with preemptive priorities is analysed, the moments of queue size is derived. The article [
1] deals with a multi-server queue with a
, preemptive priorities and priority upgrade. For this system, the authors found a condition for the existence of a stationary regime and the bounds for the lengths of the queues. The problem of concrete computation of the stationary distribution of the system states is not touched in that paper. This problem is considered in the recent papers [
25,
26]. However, those papers deal with single server priority queues. In [
25], possibility of increase of the non-preemptive priority during customer stay in the buffer is analysed. In [
26], the discipline of flexible providing of non-preemptive priorities is under study.
In this paper, we consider a priority
queueing system with two types of customers. As it is pointed out above, although analysis of such multi-server systems is very important for practice, these systems did not get a proper portion of attention of queueing theorists. e.g., the authors of [
3] note that “Despite the large number of systems that can be viewed as instances of a priority queue with multiple servers, the literature devoted to their theoretical analysis appears rather moderate as the inherent complexity of these queues hinders their analysis”. It is also mentioned in [
3] that “To the best of our knowledge, few exact results exist in the case of priority queues with multiple servers even under the simplest assumption of exponentially distributed service times”. In paper [
3], the authors analyze the model similar to the considered in our paper with two essential differences: (i) Several priority classes are suggested in [
3] while we consider the case of two classes, (ii) arrival flow is assumed be the renewal with phase type distribution of mutually independent inter-arrival times while we assume that the inter-arrival times can be dependent. One more advantages of our paper consists of the fact that we provide exact analysis of the model while only the accurate approximate solution is proposed in [
3].
In this paper, we make some step to provide the analysis of a multi-server priority system. We assume that customers of one of the types have the preemptive priority. The service times of customers of both types have phase type distribution (
) with different parameters. Exact description of the model is given in
Section 2. The most important performance measures of the considered system are probabilities of loss of customers of different types. To calculate these probabilities, we, first, described the process of the system operation by a multi-dimensional Markov chain. This description is given in
Section 3. The explicit form of the generator of this Markov is given in that section along with the short explanation of the form of the blocks of this generator. In
Section 4, we briefly note how to compute stationary distribution of this Markov chain. We do not go into details of computations and give just an advice how to compute this distribution. It is worth to mention that although the state space of the Markov chain is finite, in situation when the number of servers
N and (or) state spaces of the underlying processes of arrival and service process are large, computation of this distribution is far from the trivial. Using the stationary distribution been calculated, in
Section 4 we also derive loss probabilities associated with the system and a number of other characteristics. Numerical results are provided in
Section 5.
2. Model Description
We consider an
N -server queueing system without a buffer. Customers of two types arrive to the system according to a
The arrivals in the
is directed by the underlying process
which is an irreducible continuous time Markov chain with the state space
In case of two types of customers, the
is completely defined by the state space of underlying process and
matrices
or their generating function
The entries of the matrix
give the rate of transitions of the process
which are accompanied by generating a customer of type
Non-diagonal entries of the matrix
describe the rate of transitions of the process
which are not accompanied by generating a customer. Diagonal entries of the matrix
are negative and such that the matrix
is an infinitesimal generator of the chain
The fundamental rate of arrivals of type-
k customers is calculated as
where
is a row vector of the steady state probabilities of the underlying process
The vector
is the unique solution to the system
Here and in the sequal
is a column vector consisting of 1’s, and
is a row vector consisting of 0’s. The total fundamental rate of arrivals is
The variance of inter-arrival times of customers of type
k is calculated as
The coefficient of correlation of lengths of two successive inter-arrival times of
k-type of customers is calculated as
More details about a
can be found in [
27].
The service time of the
k-type customer has
type distribution with irreducible representation
Here
is a row vector of size
, and
is a square matrix of size
. Thus, the specified service time is interpreted as the time during which an underlying Markov chain
,
with state space
will reach the only absorbing state
. The transition rates of the chain
,
within the space of transient states
are defined by the sub-generator
, and the rates of transitions to the absorbing state are defined by the vector
. At the time the service starts, the state of the process
,
is selected from the state space
according to the probability row vector
. The service rate are calculated as
More information about the
type distribution can be found, e.g., in [
17,
29].
We assume that customers of type 1 have the preemptive priority. If a priority customer arrives to the system when all servers are busy and there are servers occupied with non-priority customers, then the arriving priority customer crowds out one of these customers (which is lost) and takes his/her place on the server. If all servers are occupied with priority customers, then an arriving priority customer is lost. If a non-priority customer arrives at the system when all server are busy, he/she leaves the system forever.
3. Process of the System States
Let at the time
be the number of busy servers, ;
be the number of servers serving type 1 customers, ;
be the state of the underlying process ;
be the state of underlying process of service on jth server servicing type k customer, We assume the following dynamical enumeration of the busy servers. The servers, which provide service to customers of type are located after servers serving customers of type 1. In addition, we assume that the servers serving customers of the k-th type are numbered in the order of their occupation, i.e., the server that starts the service is numbered by the maximum number among all servers engaged in servicing customers of this type. When some server finishes the service, the corresponding renumbering of servers occurs.
The operation of the queue under consideration is described by the Markov chain
with the state space
It can be calculated that cardinality of the set is equal to
Introduce the following notation:
is a column vector of size n, consisting of 1’s;
I (O) is an identity (zero) matrix of appropriate dimension. When needed we will identify the dimension of this matrix with suffix;
is a diagonal matrix with diagonal blocks ;
is a sub-diagonal matrix with the sub-diagonal blocks
is an over-diagonal matrix with the over-diagonal blocks
⊗ and ⊕ are the symbols of the Kronecker product and sum of matrices, see [
30];
;
for the matrix A having n rows;
Let us arrange the states of the chain in the lexicographic order and form the matrices consisting of the rates of the chain transition from the states corresponding to the value n of the first component to the states corresponding to the value of this component. Then the infinitesimal generator of the chain is defined by the following theorem.
Theorem 1. The infinitesimal generator of the Markov chain has the following block structure: Proof. The tri-block diagonal form of the generator is easily explained by the evident fact that the customers arrive to the considered system and depart from this system only one-by-one. Therefore, all blocks
of the generator are equal to zero matrices if
Before to immediately prove the expressions for the nonzero blocks of the generator, let us rewrite some blocks in the less compact but more transparent for explanations form:
where
Now, to prove the presented forms of the non-zero blocks of the generator, we analyze transitions of the Markov chain during the infinitesimal length interval.
These blocks for various values of n and have the following meaning:
The non-diagonal entries of the blocks define the transition rates of the chain which do not lead to the change in the number n of busy servers. The diagonal entries of the blocks define the departure rates of the chain from the corresponding states. If and the number of priority customers in the service is r, transitions, which do not lead to the change of the number n of busy servers, occur either when the underlying process of the makes an idle transition (i.e., a transition without generation of any customers) or a phase of service time of one of r priority customers is changed or a phase of service time of one of non-priority customers is changed. The corresponding transition rates are described by the matrix It is worth to mention here that the operations of the Kronecker product and sum of matrices are very useful for description of transition rates or transition probabilities of the multi-dimensional random processes with independent Markovian components.
In the case and the number of busy servers and the number of priority customers in the service do not change when makes an idle transition or a non-priority customer arrives (this customer is lost). The corresponding transition rates are described by the matrix If in this case a priority customer arrives, he/she pushes a non-priority customer from the service (which is lost) and takes his/her place on the server. In this case the number of priority customers in the service becomes equal to . The corresponding transition rates are described by the matrix If at an arrival time all servers are occupied by priority customers, i.e., an arriving customer, regardless of its priority, is lost. The corresponding transition rates are described by the matrix
The blocks define the transition rates of the chain which lead to a decrease in the number of busy servers from n to . If the number of priority customers in the service is equal to r, such a transition occurs when the service of one of priority customers ends (the corresponding transition rates of the chain are described by the matrix ) or when the service of one of non- priority customers ends (the corresponding transition rates are described by the matrix ).
The blocks define the transition rates of the chain which lead to an increase in the number of busy servers from n to . Such an increase occurs if a non-priority customer arrives (the corresponding transition rates are defined by the matrix or a priority customer arrives (the corresponding transition rates are defined by the matrix ).
This completes the proof of the theorem. □
4. Stationary Distribution. Performance Measures
The Markov chain
is irreducible and admits the values in a finite state space. Therefore, a unique stationary distribution of this chain exists for any values of the system parameters. Let
be the row vector of the steady state (stationary) probabilities of the states of the chain enumerated in the lexicographic order. It is well known that the vector
is defined as the unique solution of the Chapman-Kolmogorov (equilibrium or balance) equations
This system can be solved by any of the well-known methods for solving the finite system of linear algebraic equations. However, in the case of a large dimension of this system, the solution of this system can be not trivial due to existing restrictions on the computer memory and computation speed. Therefore, for solution of this system it is advisable to use a special stable algorithm proposed in [
31] and based on the idea of substituting this system of equations by an alternative system derived via consideration of a sequence of specially constructed so called censored Markov chains.
As the result of computations, we obtain the partitioned vector where is a row vector of steady state probabilities corresponding to the value n of the first component of the Markov chain, Having the vectors be calculated, we are able to calculate a number of stationary performance measures of the queue under consideration.
The distribution of the number of busy servers at an arbitrary time
The average number of busy servers
The distribution of the number of servers providing service to priority customers
where
To make clear Formula (1), we note that, multiplying the vector by the vector we select and sum up the entries of the probability vector which correspond to the states with n busy servers of which r servers are busy with priority customers. Summing the results over n, we obtain the probability .
The average number of servers providing service to priority customers
The distribution of the number of servers providing service to non-priority customers
Formula (2) is explained similarly to Formula (1).
The average number of servers providing service to non-priority customers Evidently, and this relation can be used for control of accuracy of computations.
The probability that a priority customer will be lost
The brief explanation of Formula (3) can be done as follows. A priority customer will be lost if at the moment of his/her arrival all servers are occupied with priority customers. The th entry of the vector gives the probability that an arbitrary time all server are busy with priority customers and the underlying process of the is in the state Multiplying this vector by we obtain the probability that at the moment of the priority customer arrival all servers are busy. In this case, the priority customers is lost.
The probability that a non-priority customer will be lost due to lack of free servers at the moment of his/her arrival
Formula (4) is explained similarly to Formula (3).
The probability that an arriving priority customer pushes out a non-priority customer from the server
The brief explanation of Formula (5) is as follows. The probability is calculated by considering the situation at the moment of an arrival of a priority customer which meets all servers busy and at least one server occupied with a non-priority customer.
The th entry of the vector gives the probability that at an arbitrary time all servers are busy, at least one server is occupied with a non-priority customer and the underlying process of the is in the state Multiplying this vector by we obtain the probability that at the moment of a priority customer arrival all servers are busy and at least one server is occupied with a non-priority customer. In this case the priority customer pushes out a non-priority customer from the server and takes his/her place.
The probability that an arbitrary customer arriving to the system will be lost due to the lack of free servers
The numerator in the right hand side of Formula (6) is the rate of lost customers of two types and the denominator is the total input rate. The probability is calculated as the ratio of these rates.
5. Numerical Experiments
In this section, we present the results of numerical experiments that allow us to estimate the effect of the input rate and correlation in the on the system performance measures.
We consider three s with the same arrival rates of customers of both types but different coefficients of correlation. These s are defined by the matrix as follows. For each , to get the matrices , we first define a certain matrix D and then split it into the matrices in the proportion
The first
is the superposition of two stationary Poisson flows. In this case the matrices
are defined as follows:
For this the coefficients of variation of inter-arrival times are and the coefficients of correlation of inter-arrival times are
The second
is defined by the matrices
For this the coefficients of variation of inter-arrival times are and the coefficients of correlation of inter-arrival times are .
The third
is defined by the matrices
For this the coefficients of variation of inter-arrival times are and the coefficients of correlation of inter-arrival times are
The number of servers
The service time of a priority customer has Erlang distribution defined by the vector and the matrix . The service time of a non-priority customer has Erlang distribution defined by the vector and the matrix .
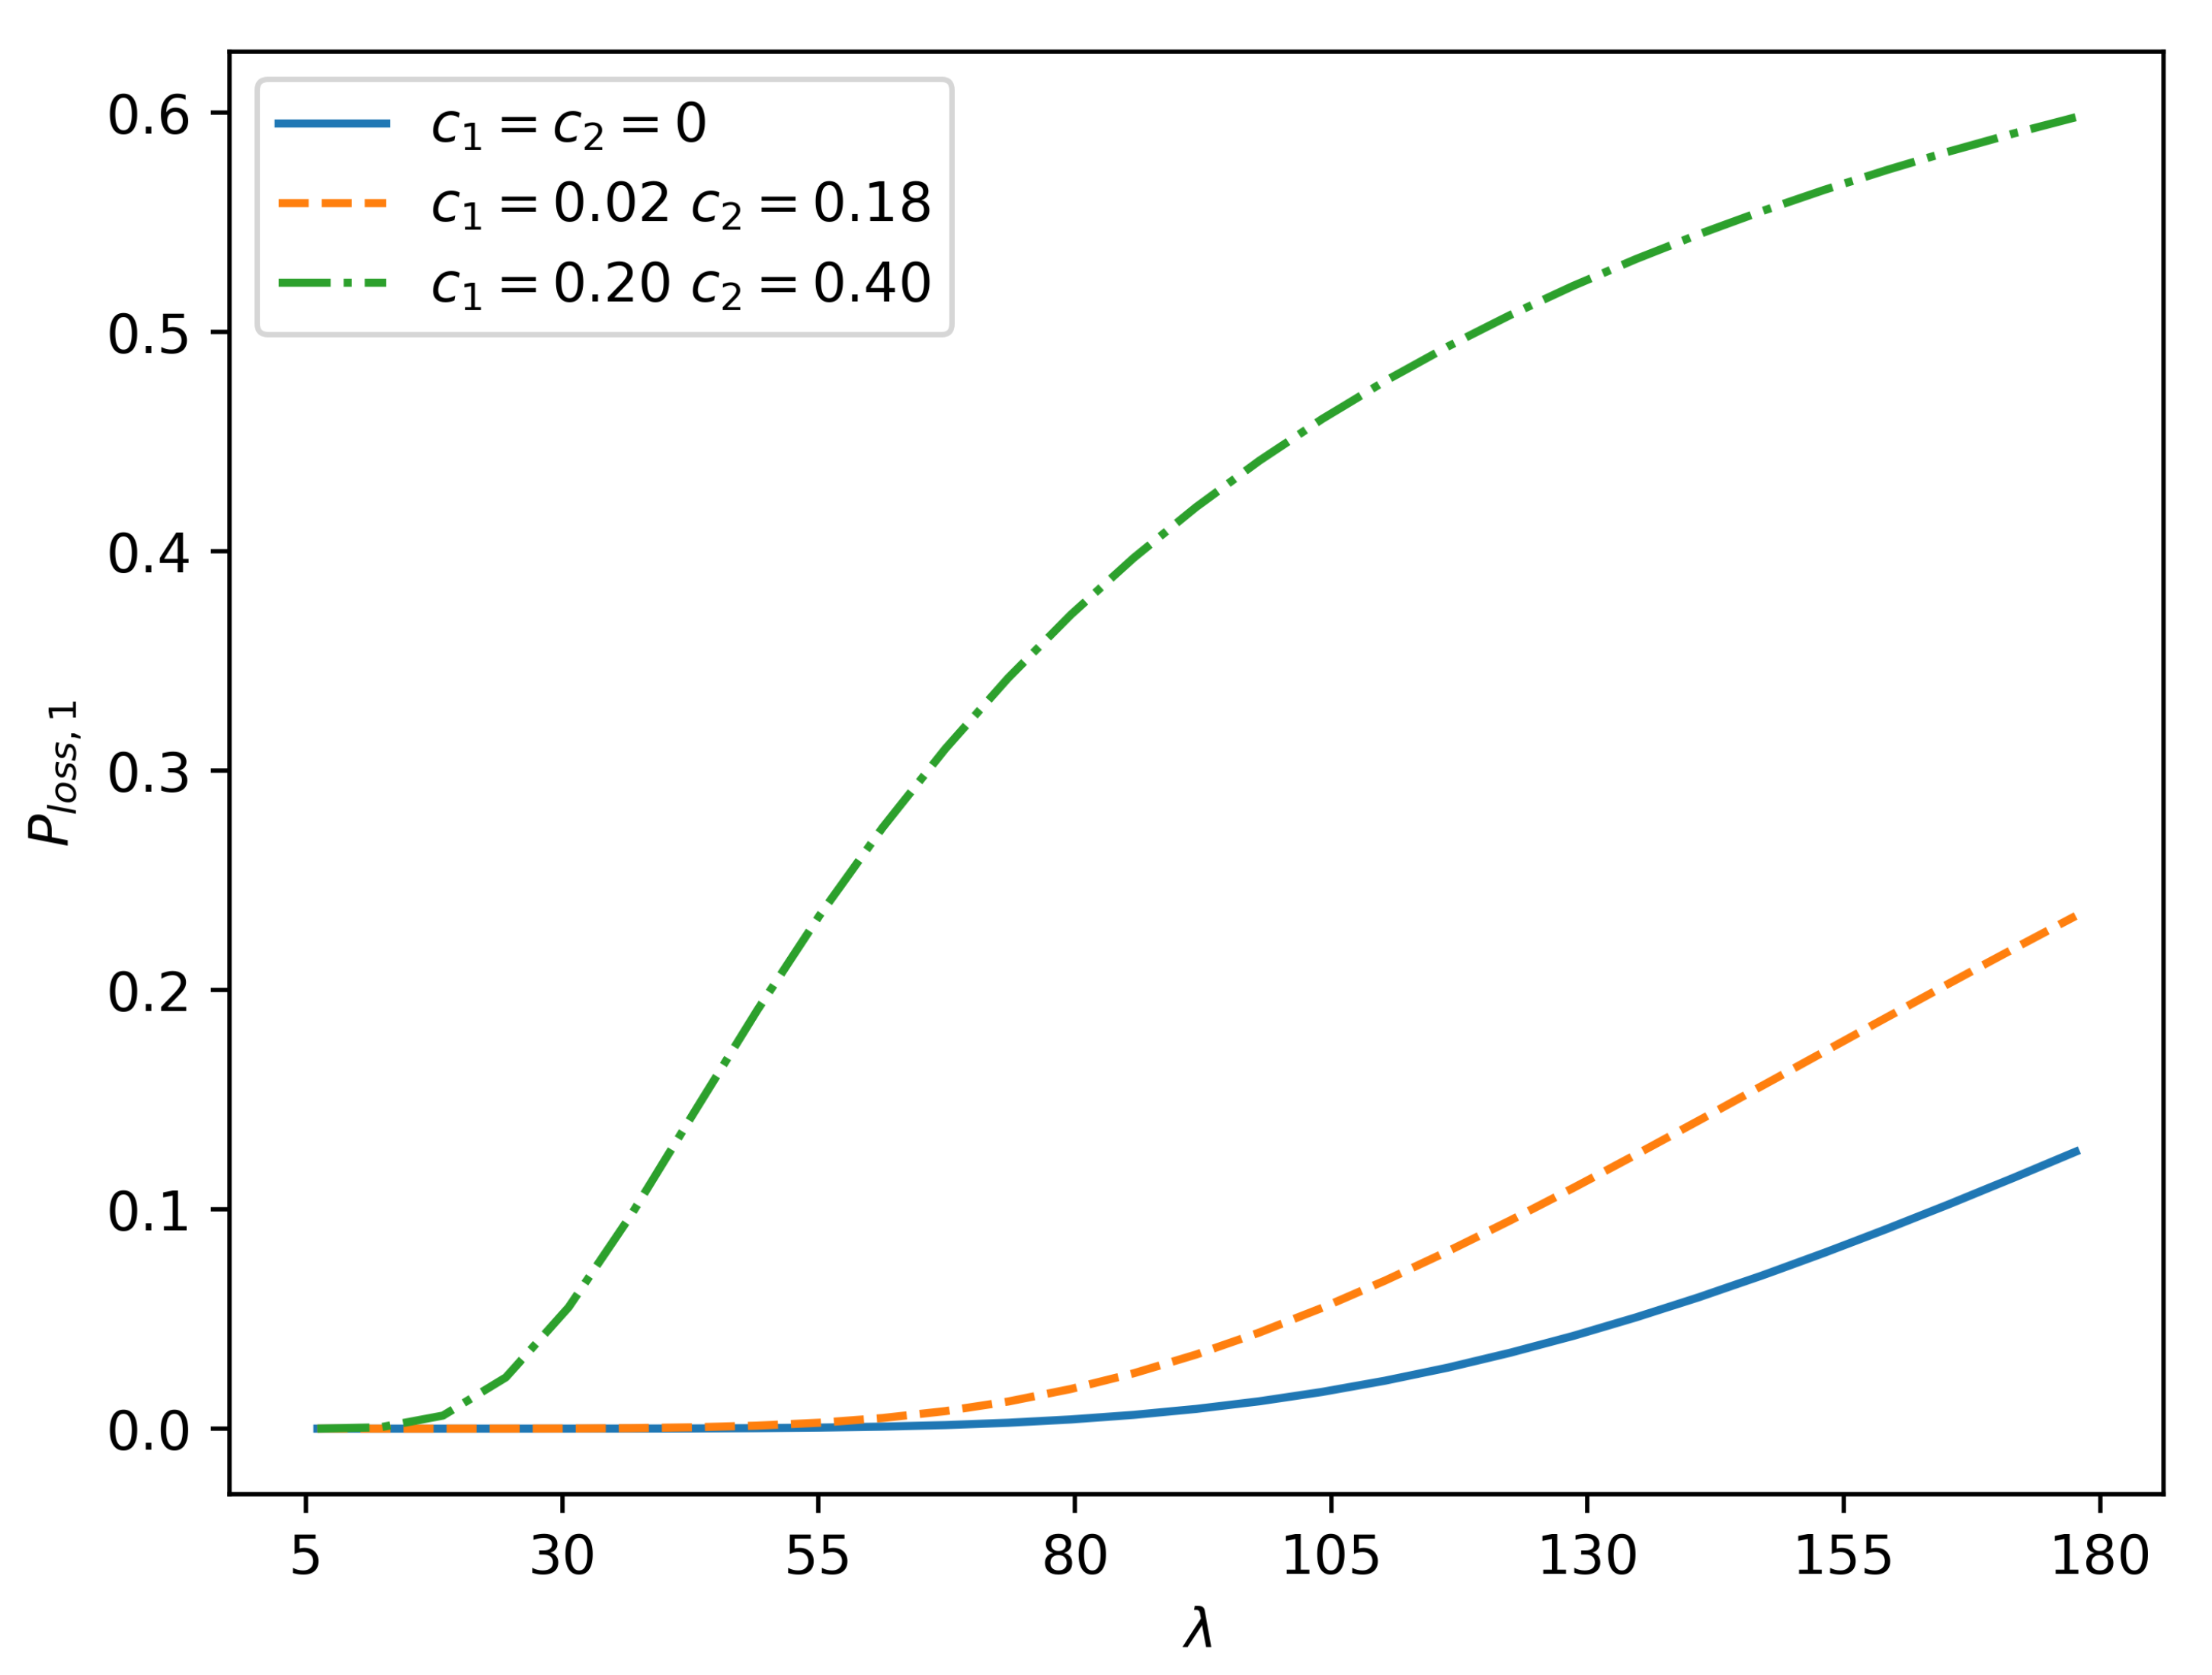
Experiment 1. In the experiment, we investigate the behavior of loss probabilities associated with the system under consideration. We consider the probabilities , and as functions of the input rate and coefficients of correlation and .
Figure 1 depicts the dependence of the probability that a priority customer will be lost,
, on the input rate
and coefficients of correlation
and
.
As expected, the value of increases with increasing Under the same value of , this probability is essentially greater for the larger coefficients of correlation in the . This effect is easily explained intuitively. The positive correlation in the arrival process causes fluctuation of the instantaneous arrival rate. Periods of time when customers arrive frequently (and likely a lot of customers is lost due to the business of all servers) alternate with the periods when customers arrive rarely (and likely starvation of the servers occurs).
Figure 2 shows the dependence of the probability of losing non-priority customers due to occupancy of all servers,
, on the input rate
and coefficients of correlation
and
.
Comparing the
Figure 1 and
Figure 2, we see that the behavior of the curves is similar, but with the same
, the probability
is greater than the probability
. This is because priority customers are blocked only when all servers are occupied with priority customers, while non-priority customers are blocked if all servers are busy with any customers, priority and non-priority.
Figure 3 shows the dependence of the probability that an arriving priority customer will push out a non-priority customer from the server,
, on the input rate
and coefficients of correlation
and
.
It is seen from the figure that the curves for different s first increase, and then decrease. The reason for this behavior of the curves lies in the following. When the input rate is relatively small, an arriving priority customer often finds at least one free server and it does not have a need to push out the non-priority customer from the service. As the input rate increases, the system becomes more crowded, and priority customers are forced to push out a non-priority customer to get service. Therefore, the probability increases and reaches maximum at some point . The further decreasing of this probability is explained by the fact that with increasing the most servers become busy with priority customers. Then the number of non-priority customers in the service decreases (they are mostly lost upon arrival to the system) and the probability that a priority customer removes a non-priority customer from the service decreases.
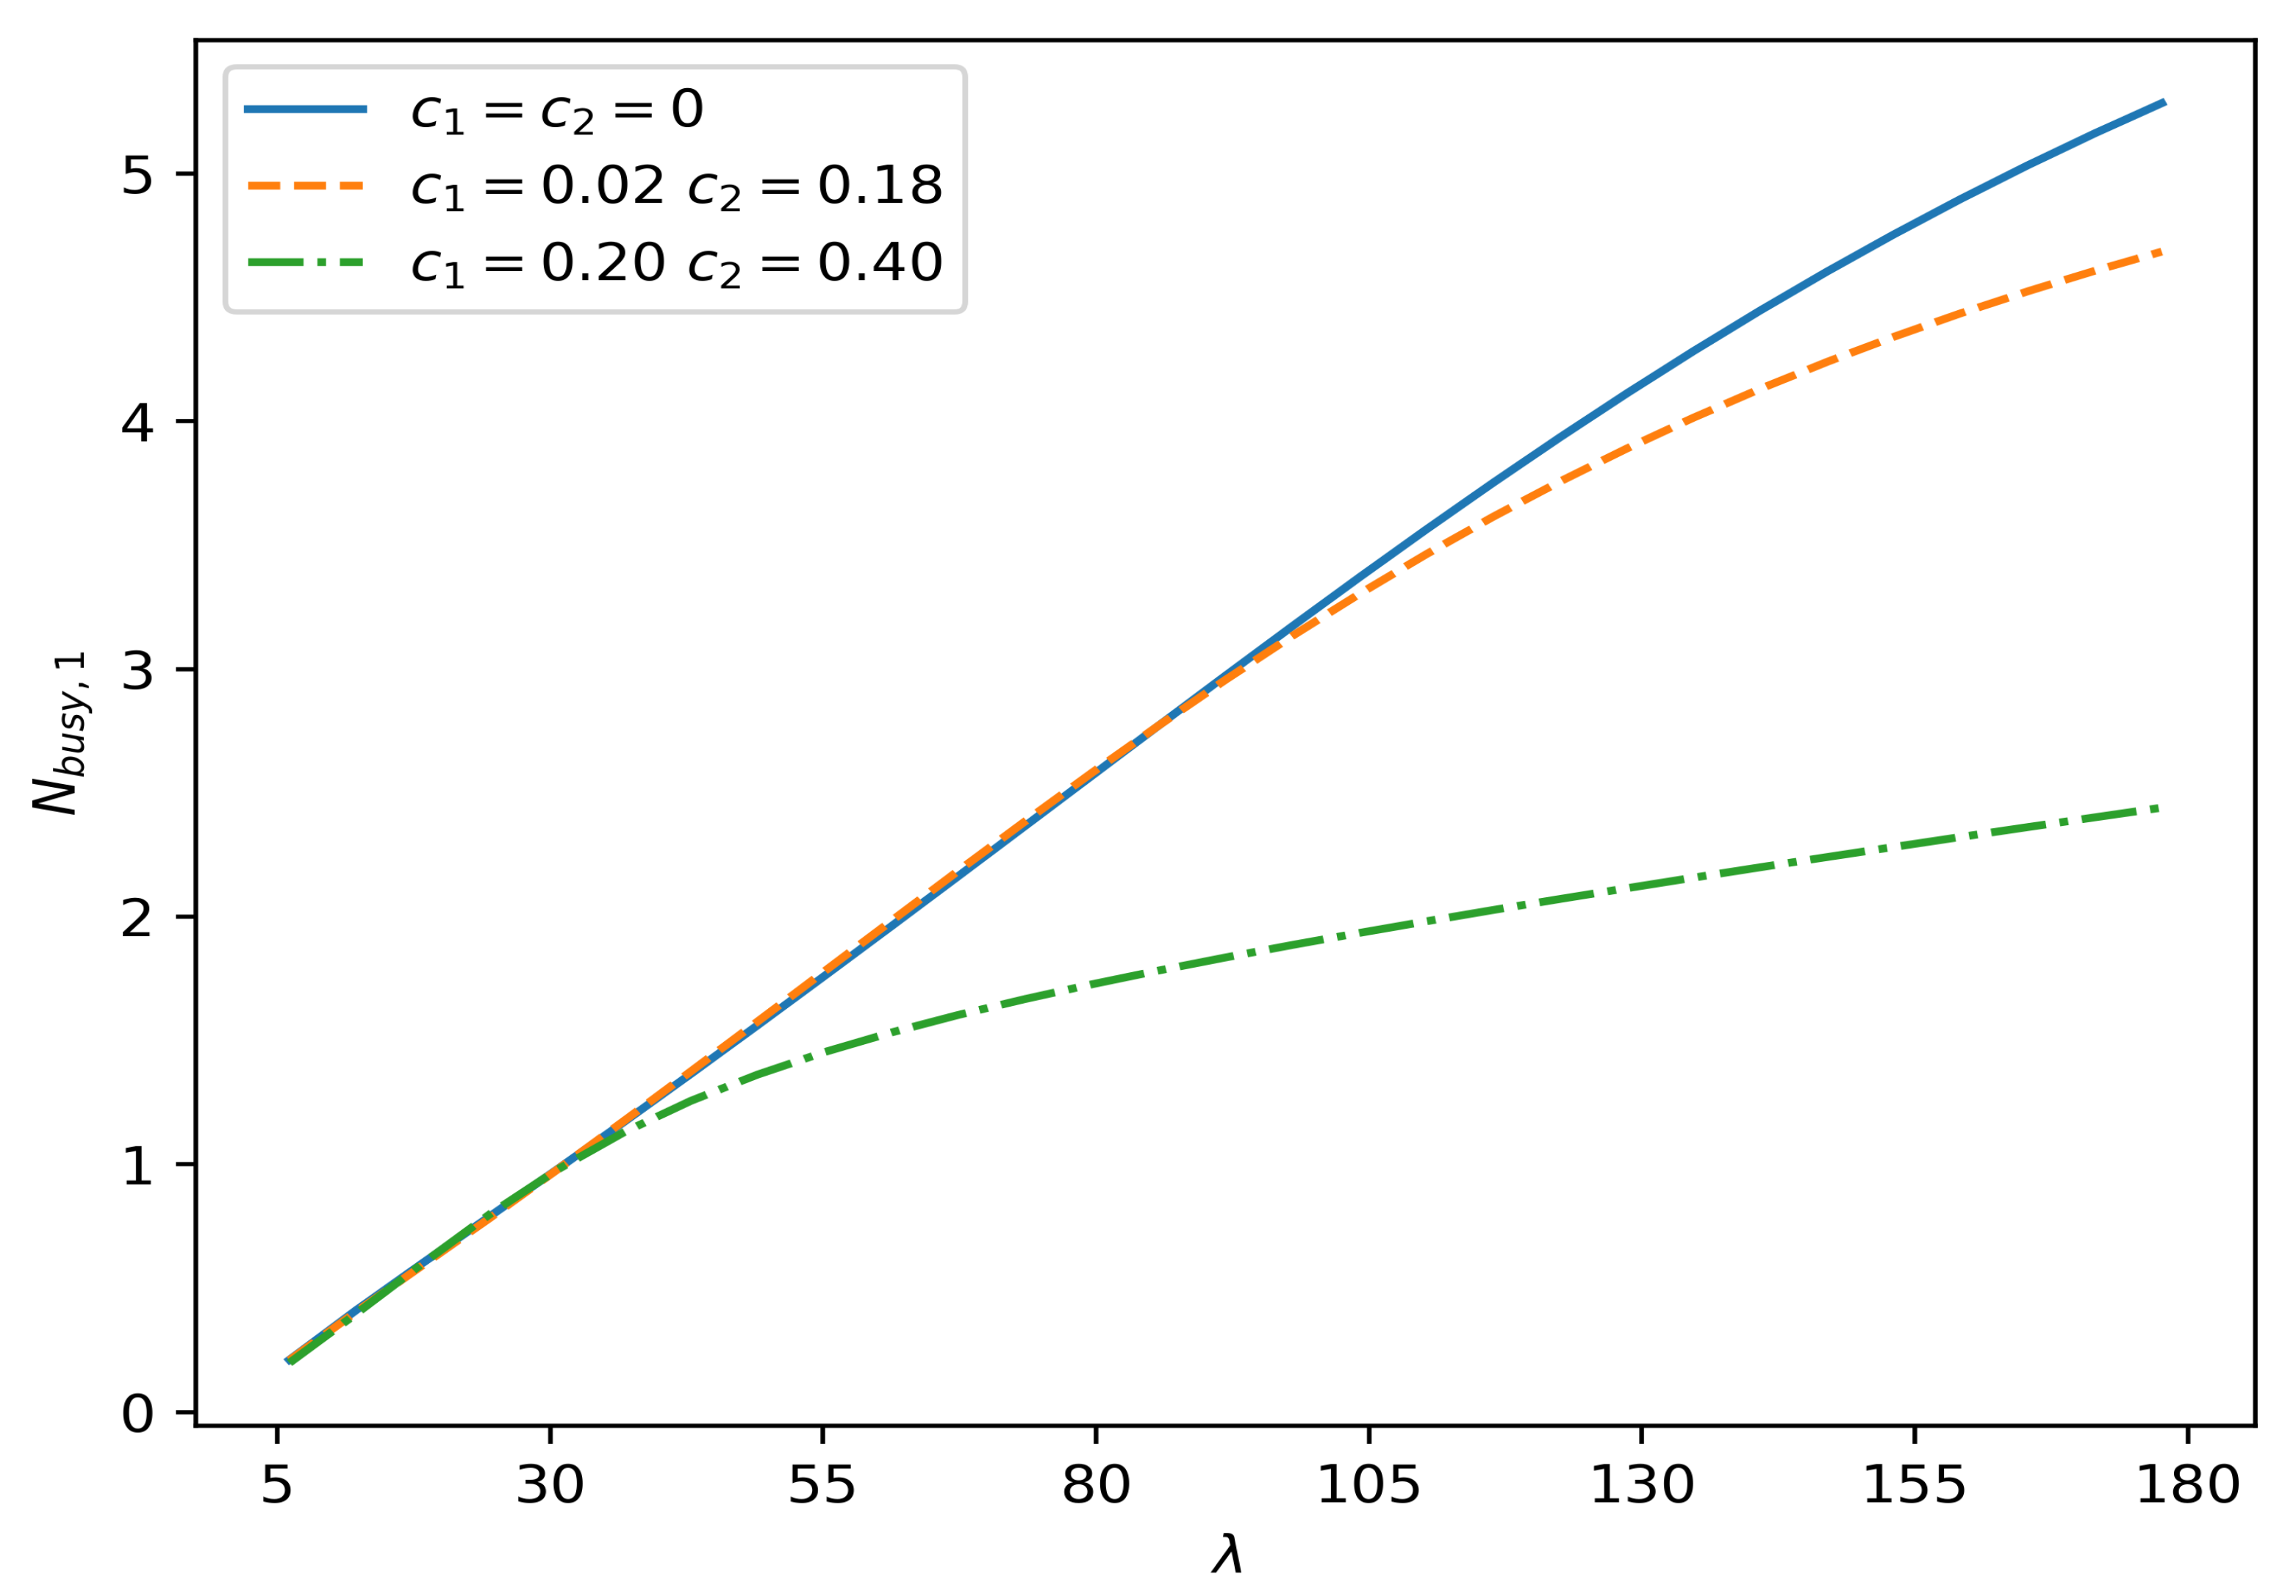
Experiment 2. In this experiment, we investigate the mean number of servers providing service to the priority and non-priority customers as functions of the input rate and coefficients of correlation and .
Figure 4 shows the dependence of the mean number of servers providing service to priority customers,
, on the input rate
and coefficients of correlation
and
.
It is expectable, that the value of increases with increasing. More interesting is that, for the same values of , the mean number of servers servicing priority customers decreases with increasing correlation in the input flow. Such a relation between the values of for s with different correlations is explained by the mentioned above fact that, with less correlation, customers arrive more uniformly, which guarantees more uniform occupation of servers and an increase in the mean number of occupied servers.
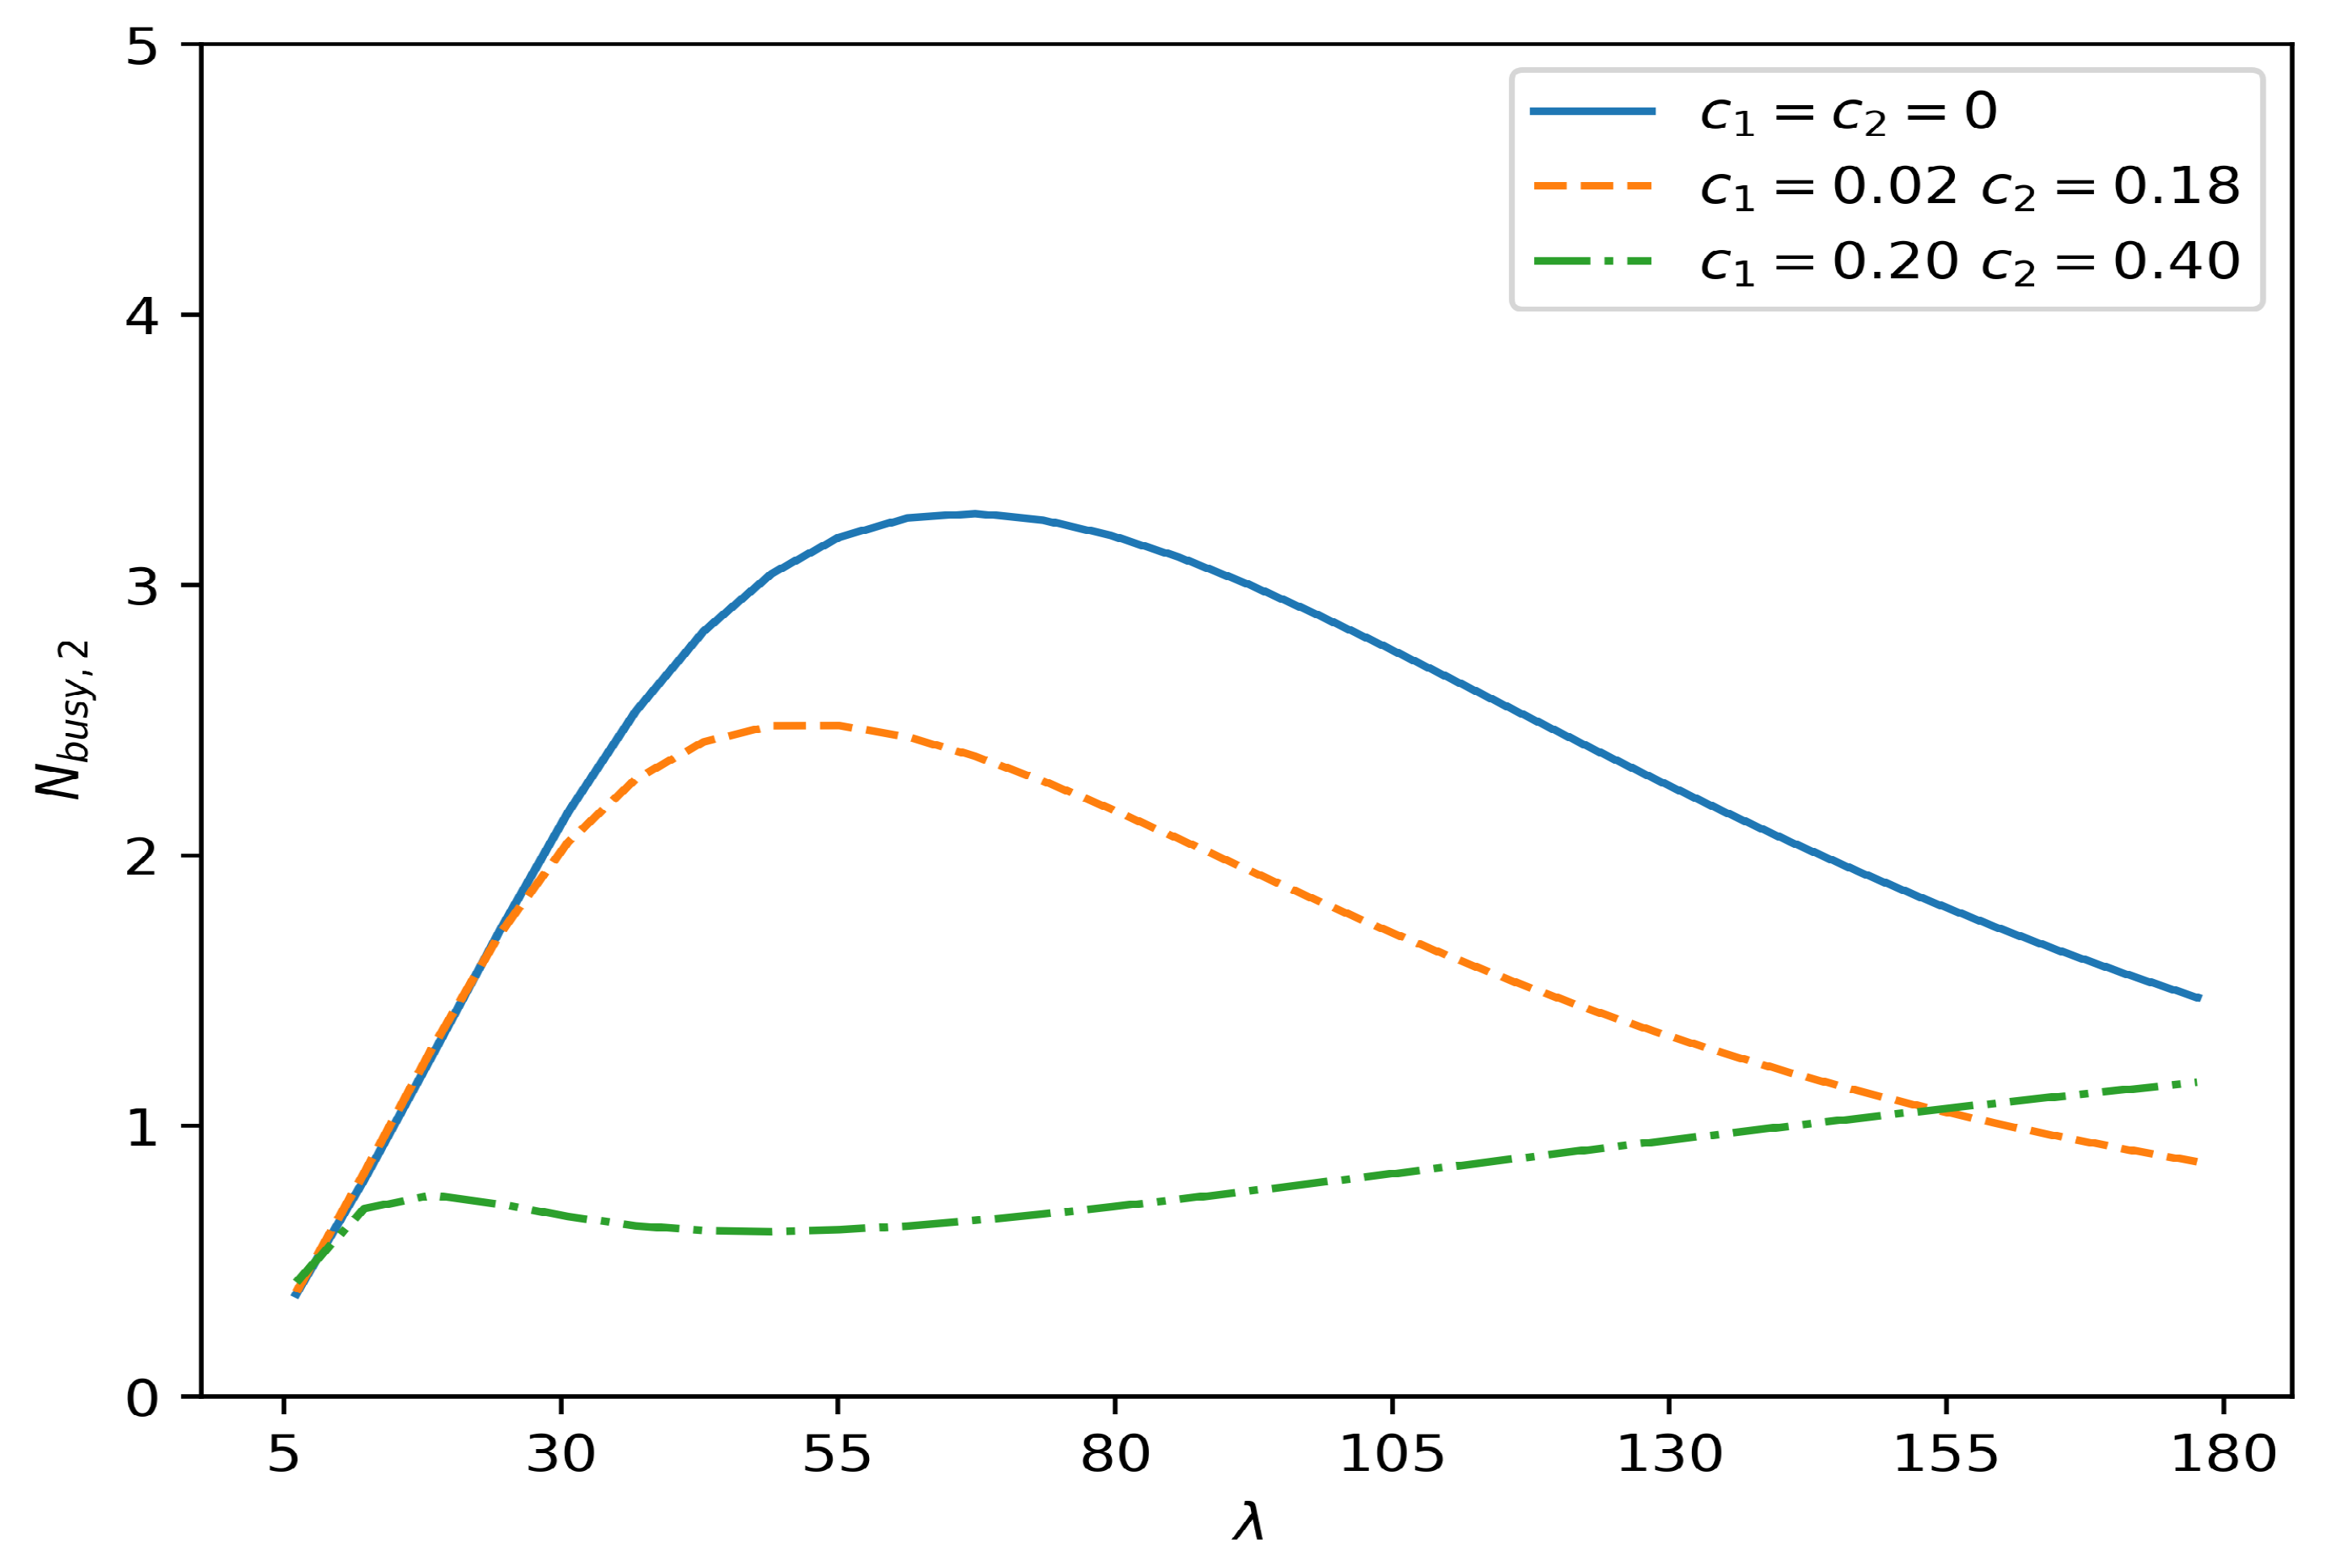
Figure 5 depicts the mean number of servers providing service to non-priority customers,
, as a function of the input rate
and coefficients of correlation
and
.
It is seen from the figure, that the curves for different s first increase, and then decrease. Such a behavior of the curves can be explained by the mechanism of occupation of servers by non-priority customers: when the input rate is relatively small, an arriving non-priority customer often finds at least one free server and occupies it. This customer has a good chance of not being pushed out of service by a priority customer. Therefore, in a certain area, the mean number of servers servicing non-priority customers increases with increasing. When the input rate increases further, the system becomes more loaded, and priority customers push out non-priority customers from the servers. Thus, most servers become busy with priority customers and the mean number of servers servicing non-priority customer decreases.
6. Output Flow
Quite often, service to customers is provided not by one set of servers but by the series of such sets. This implies the necessity to consider not a separate queueing system, but a tandem or a network of queues. In such a case, it is very important to investigate the output flow from each system. The output flow from the considered queueing system is characterized as follows.
The output flow from the system under consideration is a
. The underlying process of this
is the Markov chain
which describes the operation of the system, i.e.,
Let us enumerate the states of the chain in the lexicographic order. Then the output flow is defined by the following theorem.
Theorem 2. The output flow from the system under study is a that is defined by the matrix which are calculated by the formulaswhere the matrices are defined in Theorem 1,wherewhere Proof. The underlying process of the output makes idle transitions when:
(i) The underlying process of the input makes transitions without a customer arrival or the phase of service processes changes in the set of transient states. If the number of busy servers is n, the rates of corresponding transitions are described by the block of the matrix .
(ii) The process makes a transition accompanied by arrival a customer of type 1 or 2. If the number of busy servers is n, the rates of corresponding transition are described by the block of the matrix
The underlying process of the output makes transitions, which are accompanied by generation of type k customer, when one of servers servicing type k customer finishes the service, If the number of servers servicing type k customer is n, the rates of corresponding transitions are described by the block of the matrix □
Corollary 1. The output rate of type-k customers is computed bywhere is the solution of the Chapman-Kolmogorov equations derived above. The loss probability of type-
k customers is computed by
The loss probability of type-2 customer loss due pushing out of service is computed by
7. Conclusions
In this paper, we investigated the multi-server priority queueing system with correlated flow of two types of customers. Such kind of systems practically is not investigated in the existing literature. The type of a customer defines its priority and distribution of the required service time. The system is analysed under quite general assumptions about the arrival and service processes. We calculated the stationary distribution of system states and the main performance measures including the probability of losses due to the lack of free servers at an arrival moment and due to forcing out of service a non-priority customer with priority ones. We conducted numerical experiments that showed the influence of the mean arrival rate and the effect of correlation in the input flow on the system performance measures. It is evidently seen that the use of the superposition of the stationary Poisson processes as a model of arrival flow leads to the significantly redundant optimism in prediction of the values of the main performance indicators of the system. This is unacceptable in real life applications and justifies the necessity of the provided mathematical analysis of the system.
The used methodology of analysis (primarily the methodology for constructing the structured generator of multi-dimensional Markov chain) looks to be suitable for extension to the systems with more than two priority classes. The results seem to be also extendable to the systems with finite or infinite buffers. The results can be used to model modern telecommunication networks where the flows of information may be essentially heterogeneous with respect to the required bandwidth, importance for the system and tolerance to the losses and (or) delay and jitter.


