1. Introduction
The researchers’ attention is focused on the study of the properties and characteristics of hydrate production in connection with virtually untouched deposits [
1,
2,
3]. Currently, the main methods of gas production from gas hydrate deposits are the following: pressure reduction at the production well bottom, reservoir heating or injection of inhibitors [
3,
4,
5]. Often the use of these methods of extraction is not economically feasible and may also have an adverse environmental impact [
3,
4,
5,
6]. In this regard, a new method of natural gas production was proposed, consisting in the injection of carbon dioxide into natural deposits of gas hydrates [
7,
8,
9,
10,
11,
12,
13]. Also, the problem of CO
2 utilization can be solved by using this method.
According to experimental data, the transition of CH
4 hydrate to CO
2 hydrate during carbon dioxide injection can occur in two different modes [
14,
15,
16,
17]. A characteristic feature of the first mode is the absence of free water release. In the second mode, there is an intermediate zone of methane hydrate dissociation to water and gas, and the subsequent formation of CO
2 hydrate from water and carbon dioxide. In this case, the released heat can accelerate the decomposition of methane gas hydrate. Experiments were carried out to study the formation of CO
2 hydrates in [
18,
19,
20,
21,
22]. It should be noted that experimental works, which study these processes, were carried out in examples of small size. Due to the small size of the samples, the processes of formation and decomposition of gas hydrate are limited by kinetic mechanisms. The possibility of replacement of CH
4 by CO
2 in gas hydrate upon the injection of carbon dioxide is due to the negative value of the Gibbs free energy of this reaction (i.e., the negative value of the change in the Gibbs free energy) [
23]. The thermodynamic conditions of the CH
4–CO
2 replacement reaction are maintained even without the additional influence of external factors. For cases when natural reservoirs of real length are considered, the limitation of formation of gas hydrate CO
2 and decomposition of CH
4 gas hydrate are determined not by the kinetics of the phase transition processes, but by heat and mass transfer in the reservoir, as well as the release and absorption of heat during phase transitions. These do not allow comparing the results of mathematical modeling of the formation and decomposition of gas hydrates in extended natural reservoirs with the experimental data available to date. Therefore, in our opinion, it is necessary to examine mathematical models describing the studied processes.
There are works devoted to mathematical modeling of the development of gas hydrate deposits by injection of CO
2. In [
24,
25,
26,
27], approximate analytical solutions are given for replacing CH
4 hydrate with CO
2 when CO
2 is injected into a reservoir. In these works, self-similar solutions for a semi-infinite reservoir are constructed. These self-similar solutions can adequately describe only the initial process. The solution is consistent only until the pressure perturbation reaches the reservoir right boundary. In the future, over time, the effect on the course of the process will completely depend on the conditions on the right boundary. In [
28], the case of mathematical modeling of CO
2 injection in a gaseous state into a natural reservoir containing methane and its gas hydrate was considered. A similar problem was considered in [
29], but instead of CO
2 in the gaseous state, carbon dioxide in the liquid state was supplied. However, in [
29], only the case when the recovery of methane from the hydrate occurs in the replacement mode and is not accompanied by dissociation of methane gas hydrate is studied in detail. In the present work, unlike in [
29], the injection mode of liquid CO
2 reservoir into a gas hydrate of finite length, accompanied by dissociation of CH
4 gas hydrate and the subsequent formation of CO
2 hydrate, is studied in detail.
In [
29], only the case when a direct transition of methane hydrate to carbon dioxide hydrate occurs in a reservoir is studied in detail. In contrast to [
29], the presented work considers another physical process. Namely, the case is considered when methane gas hydrate decomposes first to gas and water (at the far boundary of phase transitions), and then carbon dioxide gas hydrate is formed from the released water and injected carbon dioxide. Since in [
29] and in the presented work two different physical processes are considered, the mathematical description of these processes is also different. For example, in [
29], one moving boundary of phase transitions is considered, dividing the reservoir into two zones. Two different systems of differential equations correspond to the mathematical description of the processes of heat and mass transfer in these two zones. At the boundary separating these two zones, a system of differential equations is written, which follows from the conditions for the balances of mass and heat. In contrast to [
29], the presented work considers two moving boundaries of phase transitions, dividing the reservoir into three zones. Three different systems of differential equations correspond to the mathematical description of the processes of heat and mass transfer in these three zones. On the two boundaries of the phase transitions separating these three zones, two different systems of differential equations are written, arising from the conditions for the balances of mass and heat.
The main purpose of the presented work is to study the main features of mathematical models that provide a consistent description of the considered processes. This is due to the lack of a clear understanding of even the qualitative features of the behavior of the system when injecting carbon dioxide into an extended gas hydrate reservoir. Due to the formation and decomposition of gas hydrates, boiling of carbon dioxide, as well as thermal and hydrodynamic effects on the reservoir, the pressure and temperature of the system can change significantly. Therefore, it is unknown in advance what phase transformations will occur, nor their nature. In such cases, a detailed numerical study of the considered processes is possible only after the consistent mathematical models will be constructed for describing the processes and identifying the limits of applicability of these models. Due to these reasons, for the construction of such mathematical models, it is required to involve certain assumptions, and the constructed mathematical models have certain and previously unknown limits of applicability. When going beyond the limits of applicability of a mathematical model, the numerical solution may contradict the original problem formulation.
Thus, due to the above reasons, a detailed numerical study of the considered processes is possible only after solving two main problems. The first problem is to identify the main features of mathematical models that provide a consistent description. The second problem is the construction of maps of possible solutions, which show in what ranges of parameters different mathematical models are consistent. The presented work is devoted to the solution of these two problems.
The results obtained can be used to create software for geological and hydrodynamic modeling of the development of gas hydrate deposits by the injection of carbon dioxide, when planning and carrying out a complex of geological and technological measures at gas hydrate deposits, to select the most effective strategy for gas recovery.
2. Mathematical Model
The mathematical formulation of most problems on non-isothermal multiphase flows in a porous medium accompanied by phase transitions is currently presented in the form of an initial-boundary value problem for a system of nonlinear partial differential equations. However, the problems formulated at the moment are rather complicated, the existence and uniqueness theorems have not been proved for them, and the use of numerical methods is currently constrained by the lack of a clear understanding of the qualitative features of the thermodynamic behavior of systems. In this regard, first of all, researches are needed to determine the possible structures of the problems mathematical solution.
Consider the following problem statement. Consider a natural reservoir with a porous structure and length
L. The pores of the reservoir are saturated with methane and methane hydrate. The temperature and pressure of the formation correspond to the conditions for the stable existence of a hydrate. In accordance with the problem statement, the injection of liquid CO
2 through the left border (
x = 0) of the reservoir is considered. The temperature
Te and injection pressure
pe are selected in the phase diagram
Figure 1 in such a way that they correspond to the conditions for the existence of CO
2 in the liquid state and the conditions for the existence of CO
2 hydrate [
30].
The statement of the problem, which is solved in this work, corresponds to the case of continuous injection of carbon dioxide into the formation. This is due to the fact that on the left boundary of the reservoir (through which liquid carbon dioxide is pumped), at time values of
, a constant pressure is maintained that exceeds the pressure on the right boundary:
Injection of CO
2 starts the decomposition of methane hydrate. The next stage is associated with the formation of CO
2 hydrate, and its formation requires released water and carbon dioxide. In [
31], it was shown that in natural porous layers, filtration (convective) transfer significantly dominates over diffusion transfer. In addition, currents in natural reservoirs are laminar, and the viscosity of carbon dioxide exceeds the viscosity of methane. In this regard, in this paper we will assume the stability of the front of displacement of methane by carbon dioxide.
The specific features of the processes of formation and decomposition of gas hydrates are indeed in many cases strongly dependent on these processes’ kinetics. However, one of the main goals of this work is to study the possibility of boiling liquid carbon dioxide during its injection into a reservoir, accompanied by the formation and decomposition of gas hydrate. The possibility of boiling carbon dioxide during its filtration in a gas hydrate reservoir depends primarily on the hydrodynamic and temperature fields in the reservoir. At low values of permeability considered in the work and high values of the drops of pressure and temperature, the hydrodynamic and temperature fields depend on filtration mass transfer in the reservoir, as well as convective and conductive heat transfer. Therefore, in this case, to study the possibility of boiling liquid carbon dioxide, the kinetics of the processes of formation and decomposition of gas hydrates in comparison with heat and mass transfer in the reservoir can be neglected.
In addition, in this work, we will consider the case when the reservoir has a sufficiently large extent (L ≥ 100 m), as well as low permeability (k < 10−13 m2). In this case the process of filling the reservoir with injected carbon dioxide will proceed rather slowly, and since there was no carbon dioxide in the initial state, the process of conversion of CH4 hydrate to CO2 hydrate will also occur very slowly (i.e., limited by the rate of filtration). Therefore, for the considered process (when the reservoir length L > 100 m), times of the order of several tens of days are of practical interest. At such long times, which significantly exceed the characteristic time of the process kinetics (which, according to experimental data, is on the order of several hours), the kinetic mechanisms no longer limit the process of the transition of CH4 hydrate to CO2 hydrate. Therefore, considering sufficiently large time values (on the order of several days or ten days), the kinetics of the processes of formation and decomposition of gas hydrates can be neglected. In this regard, the constructed model is valid only for large time scales, relatively long reservoir length (L ≥ 100 m) and low permeability (k < 10−13 m2).
Thus, it can be assumed that, under the above conditions, three characteristic regions are formed in the reservoir. According to the problem statement, the near (first) region of the pore is saturated with liquid CO
2 and its hydrate. In the intermediate (second) region, only methane and water are present in the reservoir. In the far (third) region, in addition to methane, its hydrate is present in the pores
Figure 2. Methane hydrate decomposition is present only between the 2 and 3 boundaries, respectively, on the moving frontal surface. In this case, the formation of CO
2 hydrate occurs only at the border between 1 and 2 regions.
To describe the processes that occur when carbon dioxide is injected into a porous layer, we make the following assumption. Also, assume that the initial hydrate saturation value is small (no more than 0.2). Then the filtration of water released during the decomposition of the gas hydrate can be neglected. The system of basic equations in the straight-parallel case has the form [
32,
33,
34,
35,
36]:
Here φ is the porosity; T is the temperature; p is pressure; ρj, Sj, υj, kj, Cj and μj are density, saturation, speed, phase permeability, specific heat capacity and dynamic viscosity of carbon dioxide (j = c) and methane (j = m) respectively; Rm is the gas constant of methane; β is the compressibility factor of CO2; k0 is the absolute permeability; ρC and λ are the specific volumetric heat capacity and system thermal conductivity coefficient.
The last relation in the system (1) means that to describe the dependence of the relative (phase) permeability of carbon dioxide
kc on its saturation
Sc, the following relation is used [
25,
37]:
where
Sc is the carbon dioxide saturation. The saturation of carbon dioxide in the first region is equal to:
where
Shc is the saturation for carbon dioxide gas hydrate.
Thus, to describe the dependence of the relative (phase) permeability of carbon dioxide
kc on the hydrate saturation of
Shc, the following relation is used:
Analogically, to describe the dependence of the relative (phase) permeability of methane
km on its saturation
Sm, the following relation is used:
where
Sm is the methane saturation.
The saturation value of methane
Sm(3) in the third region is equal to:
where
ν is the saturation for methane gas hydrate in the third region.
Therefore, to describe the dependence of the relative (phase) permeability of methane
km in the third region on the saturation of methane gas hydrate
ν, the following relation is used:
The equations of mass balance of CO
2 and CH
4 on the border between the first and second areas are:
where
Gc,
ρhc,
Shc are the mass concentrations in hydrate of carbon dioxide, density and saturation of carbon dioxide gas hydrate;
is the speed of movement of the near boundary of phase transitions. Hereinafter, to describe the thermophysical characteristics at the boundary between 1 and 2 regions, the index
n is used.
The ratio of mass and heat balance at the boundary between 1 and 2 areas has the form:
Here,
Lhc is the heat of the carbon dioxide gas hydrate formation,
T(i) and
p(i) are the temperature and the pressure; index
i = 1 and
i = 2 belong to the first and second area;
Sl and
ρl are the pore saturation and density of water. The pressure and temperature at the boundary between 1 and 2 areas are assumed to be continuous.
The ratio of mass and heat balance at the boundary between 2 and 3 areas has the form:
Here
Sm(i),
T(i) and
p(i) are pore saturation, temperature and pressure of methane, index
i = 3 belong to the third area;
Gm,
,
ν,
Lhm are the mass concentrations in hydrate of methane, density, saturation and heat of the methane gas hydrate formation;
is the speed of movement of the far border of phase transitions. The pressure and temperature on this surface are related by the phase equilibrium condition for methane and its hydrate [
30]:
where
A = 29.112,
B = 7694.30.
The initial conditions, as well as the conditions at the reservoir boundaries, are presented as:
The equations of piezoconductivity and thermal conductivity, obtained from the system of Equation (1), have the form:
where
,
,
,
,
,
,
,
(
i = 2, 3). In addition, from (2) and (3) it follows that
,
,
. Hereinafter, the subscripts in brackets
i = 1, 2, 3 relate respectively to the indicated area.
Problems (6)–(8) with boundary, initial and on the moving boundaries of phase transitions conditions (2)–(5) are closed. To solve it, the method of catching the front into a grid node is used [
38,
39]. When using the method of catching the front at the grid point, it is assumed that the boundary of the CO
2 hydrate formation moves along the coordinate grid by exactly one step in one step by time. This time step is calculated by iterations. The distributions of pressure and temperature in the far and intermediate regions, as well as the position of the phase transition boundary
x =
x(d), are determined based on the end-to-end counting method.
To test the mathematical model, we used approximate analytical solutions presented in work [
24]. These approximate analytical solutions were obtained for the problem of decomposition of methane gas hydrate during the injection of liquid carbon dioxide into a gas hydrate layer based on the method of converting to a self-similar variable. To obtain analytical solutions, a number of simplifying assumptions were used. For example, the self-similar approximation and linearization of equations were used. It was also assumed that the reservoir has a semi-infinite extent. Therefore, the analytical solutions presented in work [
24] are valid only for the initial stage of time.
In [
24], these values of the parameters were used:
φ = 0.2, ν = 0.2,
Te = 282 K,
T0 = 274 K,
p0 = 3.5 MPa,
pe = 4 MPa,
k0 = 10
−16 m
2,
ρC = 2 × 10
6 J/(K∙m
3),
λ = 2 W/(m∙K). For these parameters, the following values of the self-similar coordinates of the phase transition boundaries were obtained in the work of [
24] (p. 744, Figure 5):
where
.
Thus, with the parameters listed above, the results obtained in [
24] correspond to the following dependences of the coordinates of the phase transition boundaries on time:
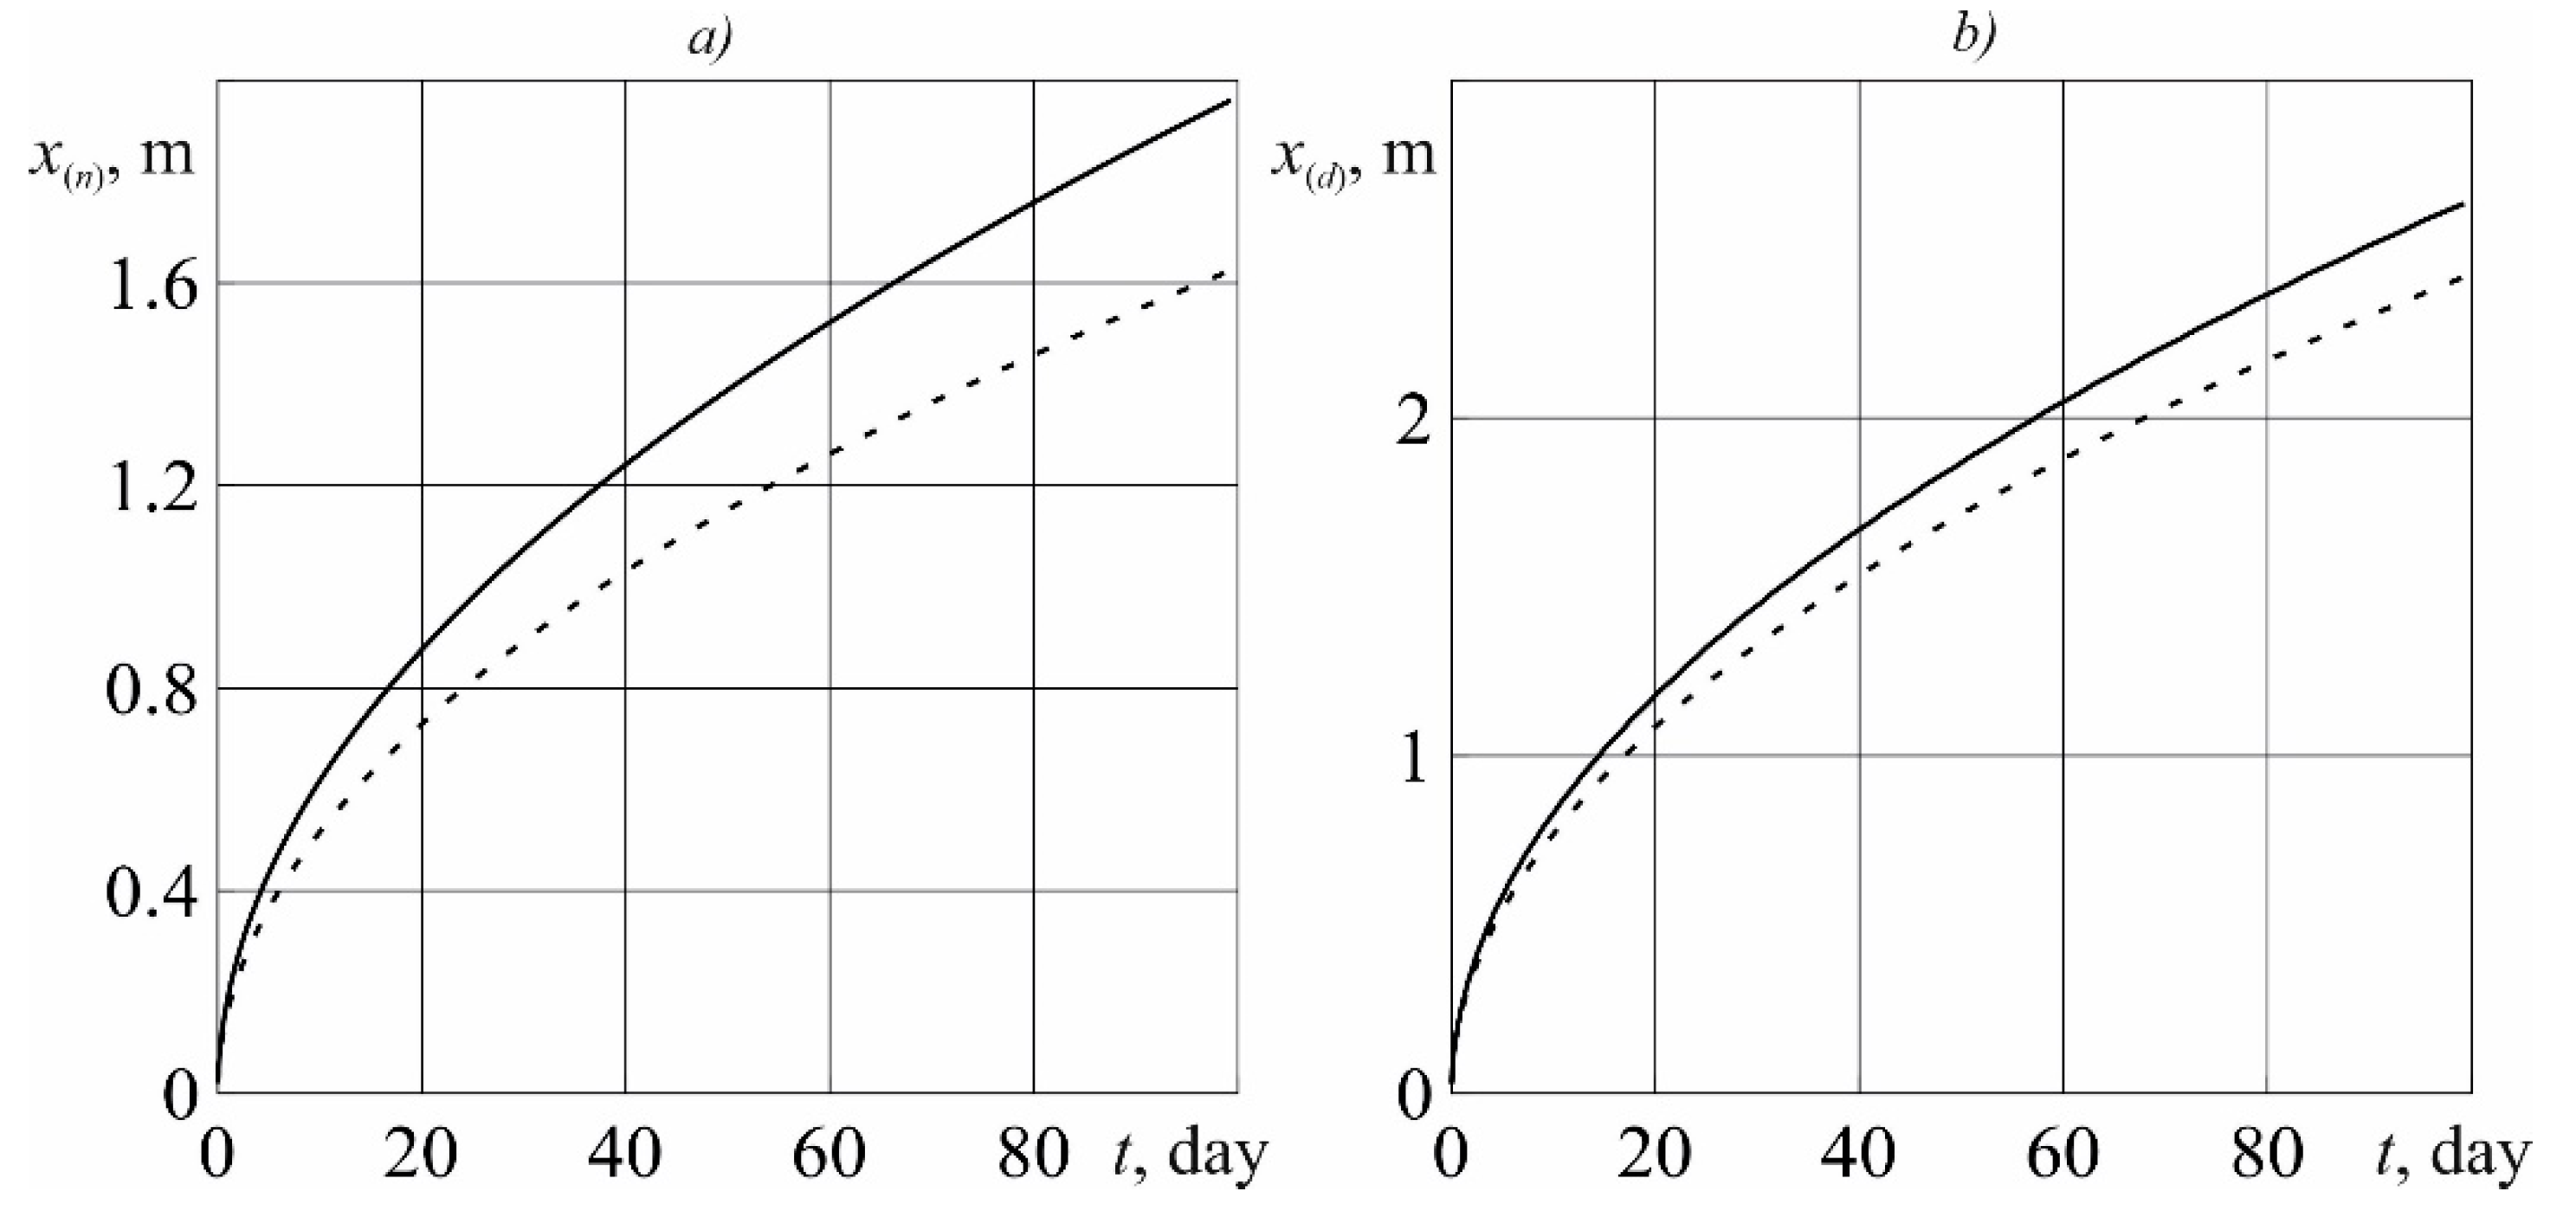
We compared our numerical solutions with those of an analytical solution.
Figure 3 shows the dependence of the coordinates of the phase transitions boundaries on time. The solid curve corresponds to the numerical solutions obtained from our model. The dashed curve corresponds to the analytical solutions obtained in [
24]. Comparison of these solutions shows a fairly good match for small values of time. Note that for large values of time, self-similar analytical solutions do not allow adequately describing the process, as they are obtained for the case of a semi-infinite reservoir. However, any layer has a finite extent. For large time values, the pressure perturbation will reach the right boundary of the reservoir. In this case, the conditions on the right border will have a significant impact on the peculiarities of the process.
3. Calculations, Results and Discussion
The original parameters used in the model are shown in
Table 1 [
1,
30].
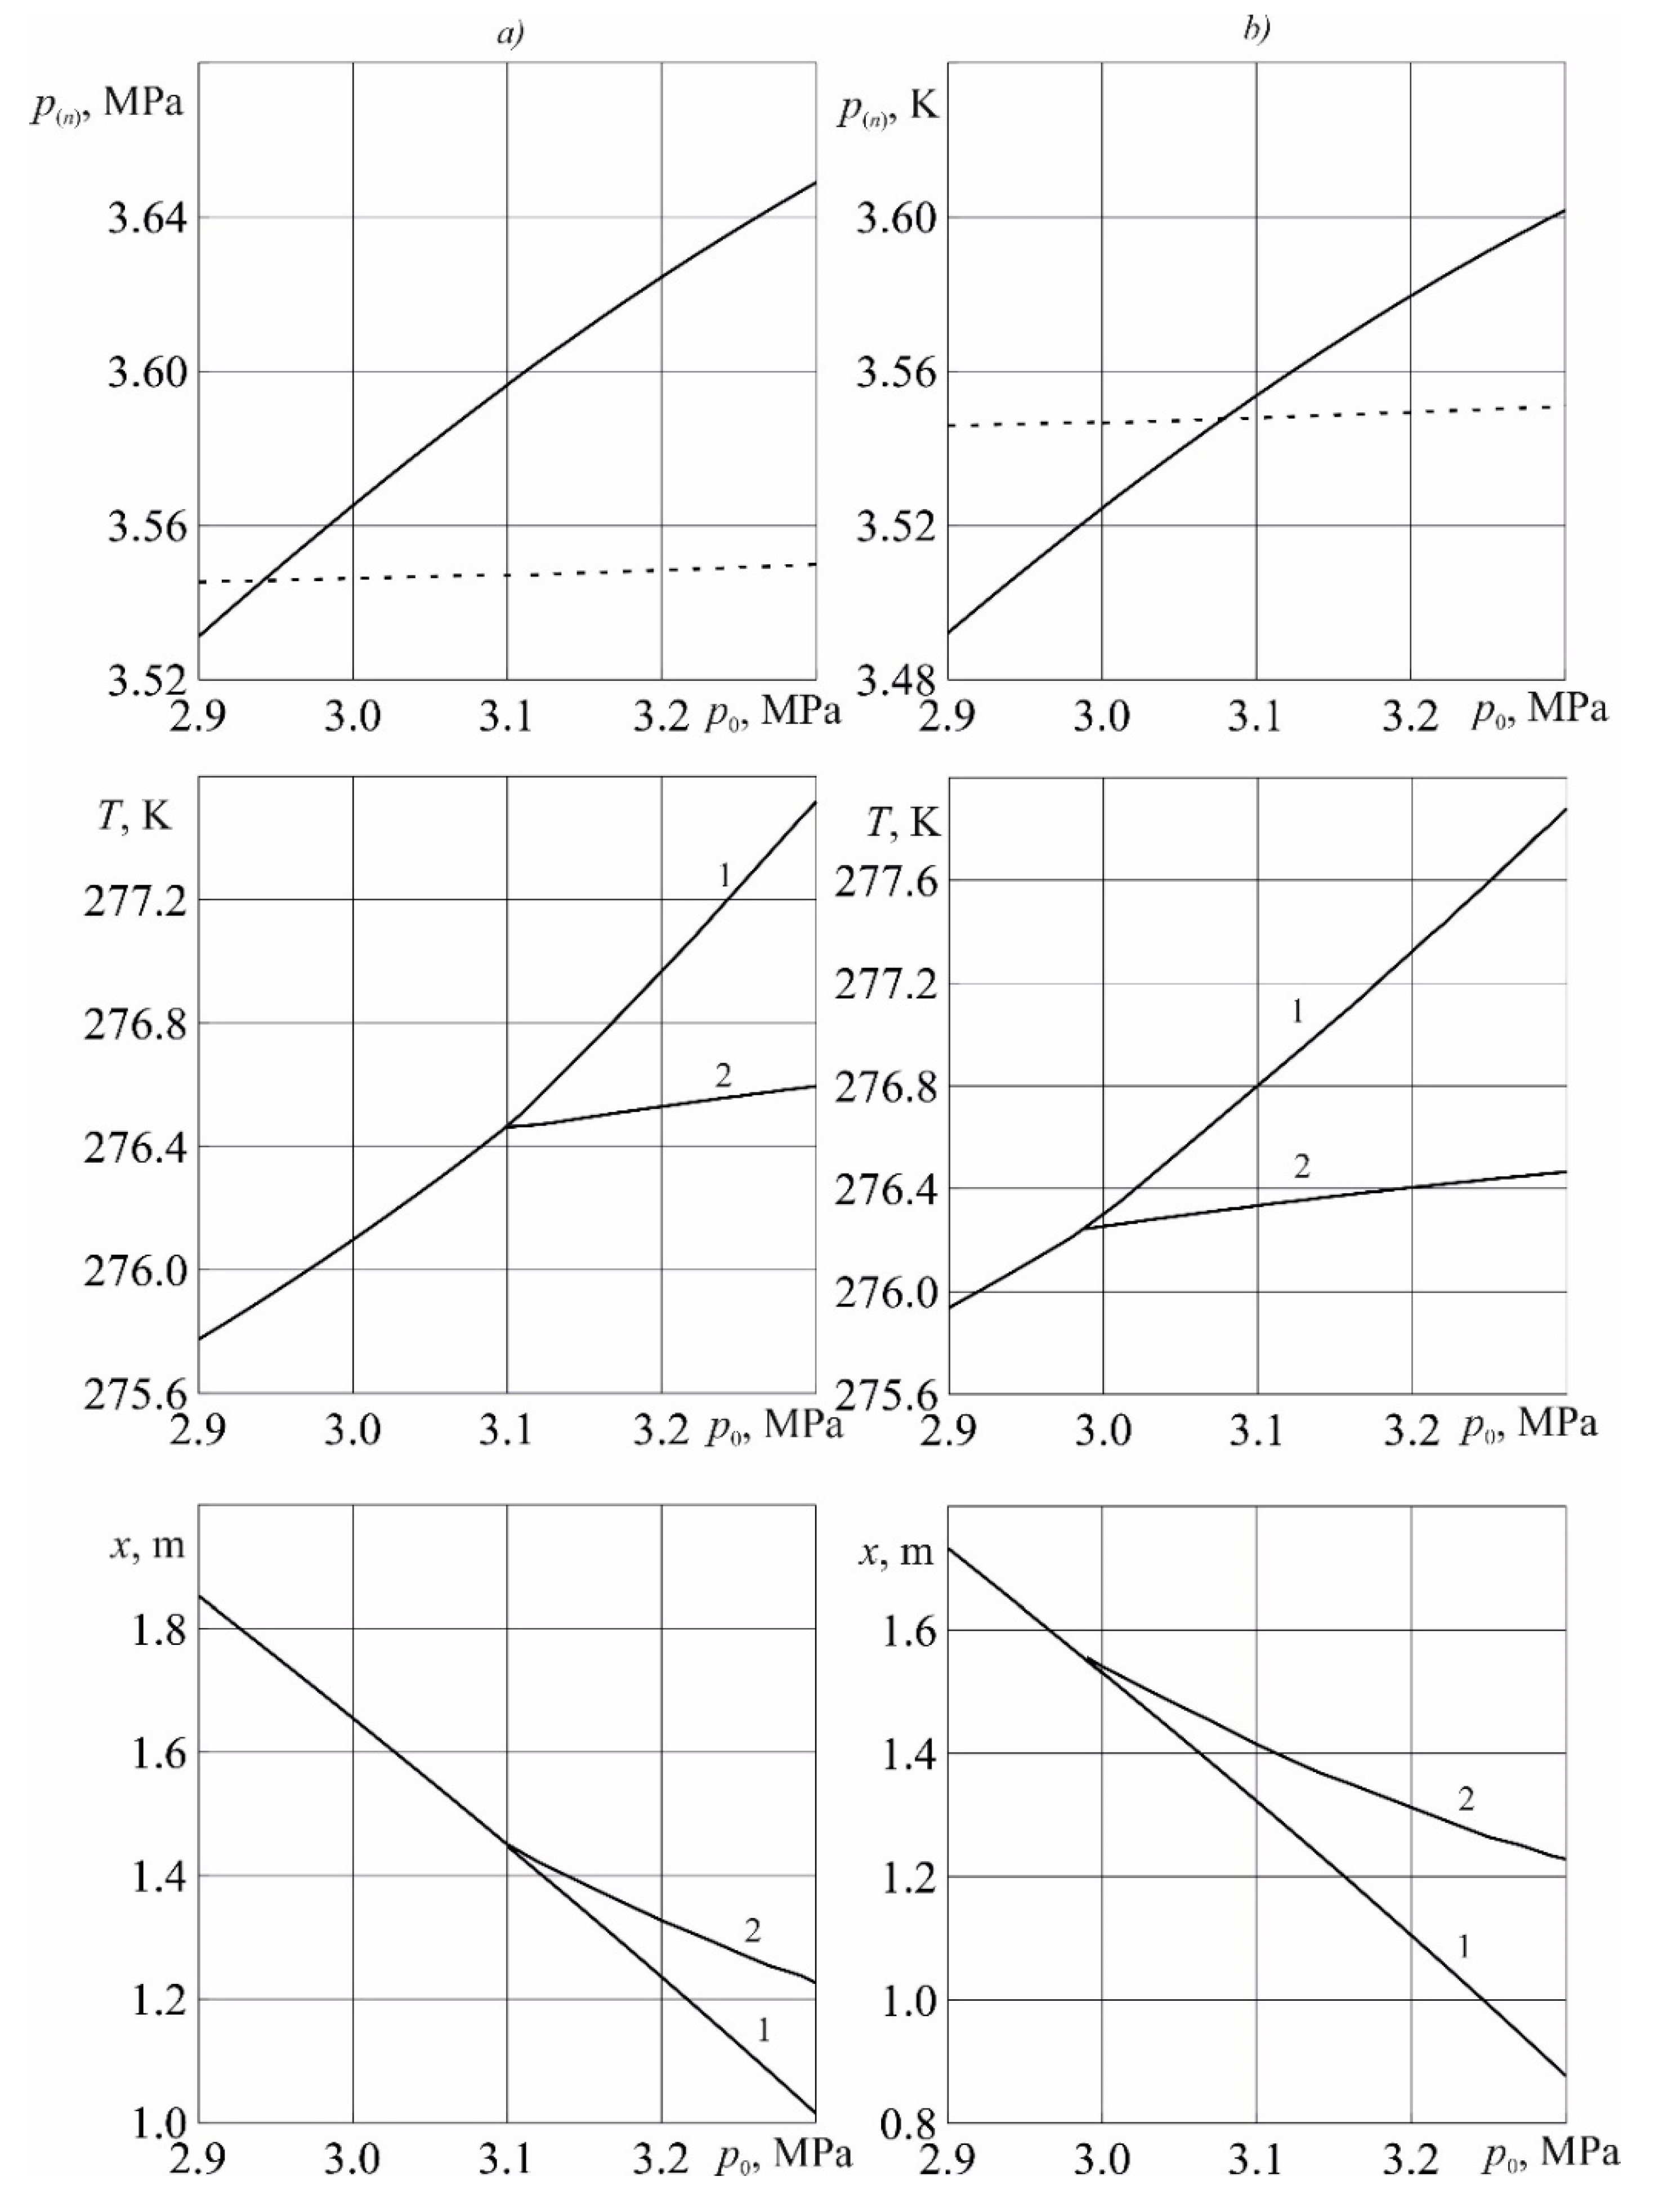
In
Figure 4, for the time
t = 20 days, the dependences of pressure at the near boundary of phase transitions, as well as temperatures and coordinates of the near (curve
1) and distant (curve
2) of phase transitions boundaries depending on the injection pressure, are shown. The dashed line corresponds to the equilibrium boiling pressure of liquid CO
2. For the value of the initial pressure of the system, the values
p0 = 3.1 MPa (a) and 2.9 MPa (b) are assumed.
Figure 4 shows a decrease in temperature at the boundary of the CO
2 hydrate formation with increasing injection pressure. It also follows from
Figure 4 that with an increase in the injection pressure, the coordinate of the hydrate reservoir boundary also increases, and the coordinate of the dissociation boundary of methane hydrate increases slightly. This is due to the increase in the filtration rate of carbon dioxide with increasing injection pressure. The rate of displacement of methane by carbon dioxide has a major effect on the rate of hydrate formation. An increase in the velocity of this boundary leads to a decrease in the influence on it of a hotter left boundary and, accordingly, to a decrease in its temperature. According to
Figure 4, at high pressures, the near boundary of phase transitions can catch up with the far boundary. In this case, methane in the gas hydrate is replaced by carbon dioxide at the only phase transition boundary. In addition, at sufficiently low injection pressures, the pressure at the near boundary may fall below the equilibrium boiling pressure. Therefore, in this case, it is necessary, in addition to the area containing liquid CO
2 and its gas hydrate, to introduce into consideration a region saturated with gaseous CO
2 and its gas hydrate. Thus, at low values of the injection pressure of
pe in the reservoir, an additional region saturated with gaseous carbon dioxide and its hydrate will additionally appear. At high injection pressures, a CO
2 gas hydrate formation will occur in the replacement mode in the absence of a region containing methane and water. For average injection pressures, two different cases are possible, depending on the pressure at the right boundary of the reservoir,
p0. At relatively high values of
p0, the regime is implemented according to the scheme shown in
Figure 2. At relatively low values of
p0, the formation of CO
2 hydrate will occur in the replacement mode, but is accompanied by boiling of liquid carbon dioxide.
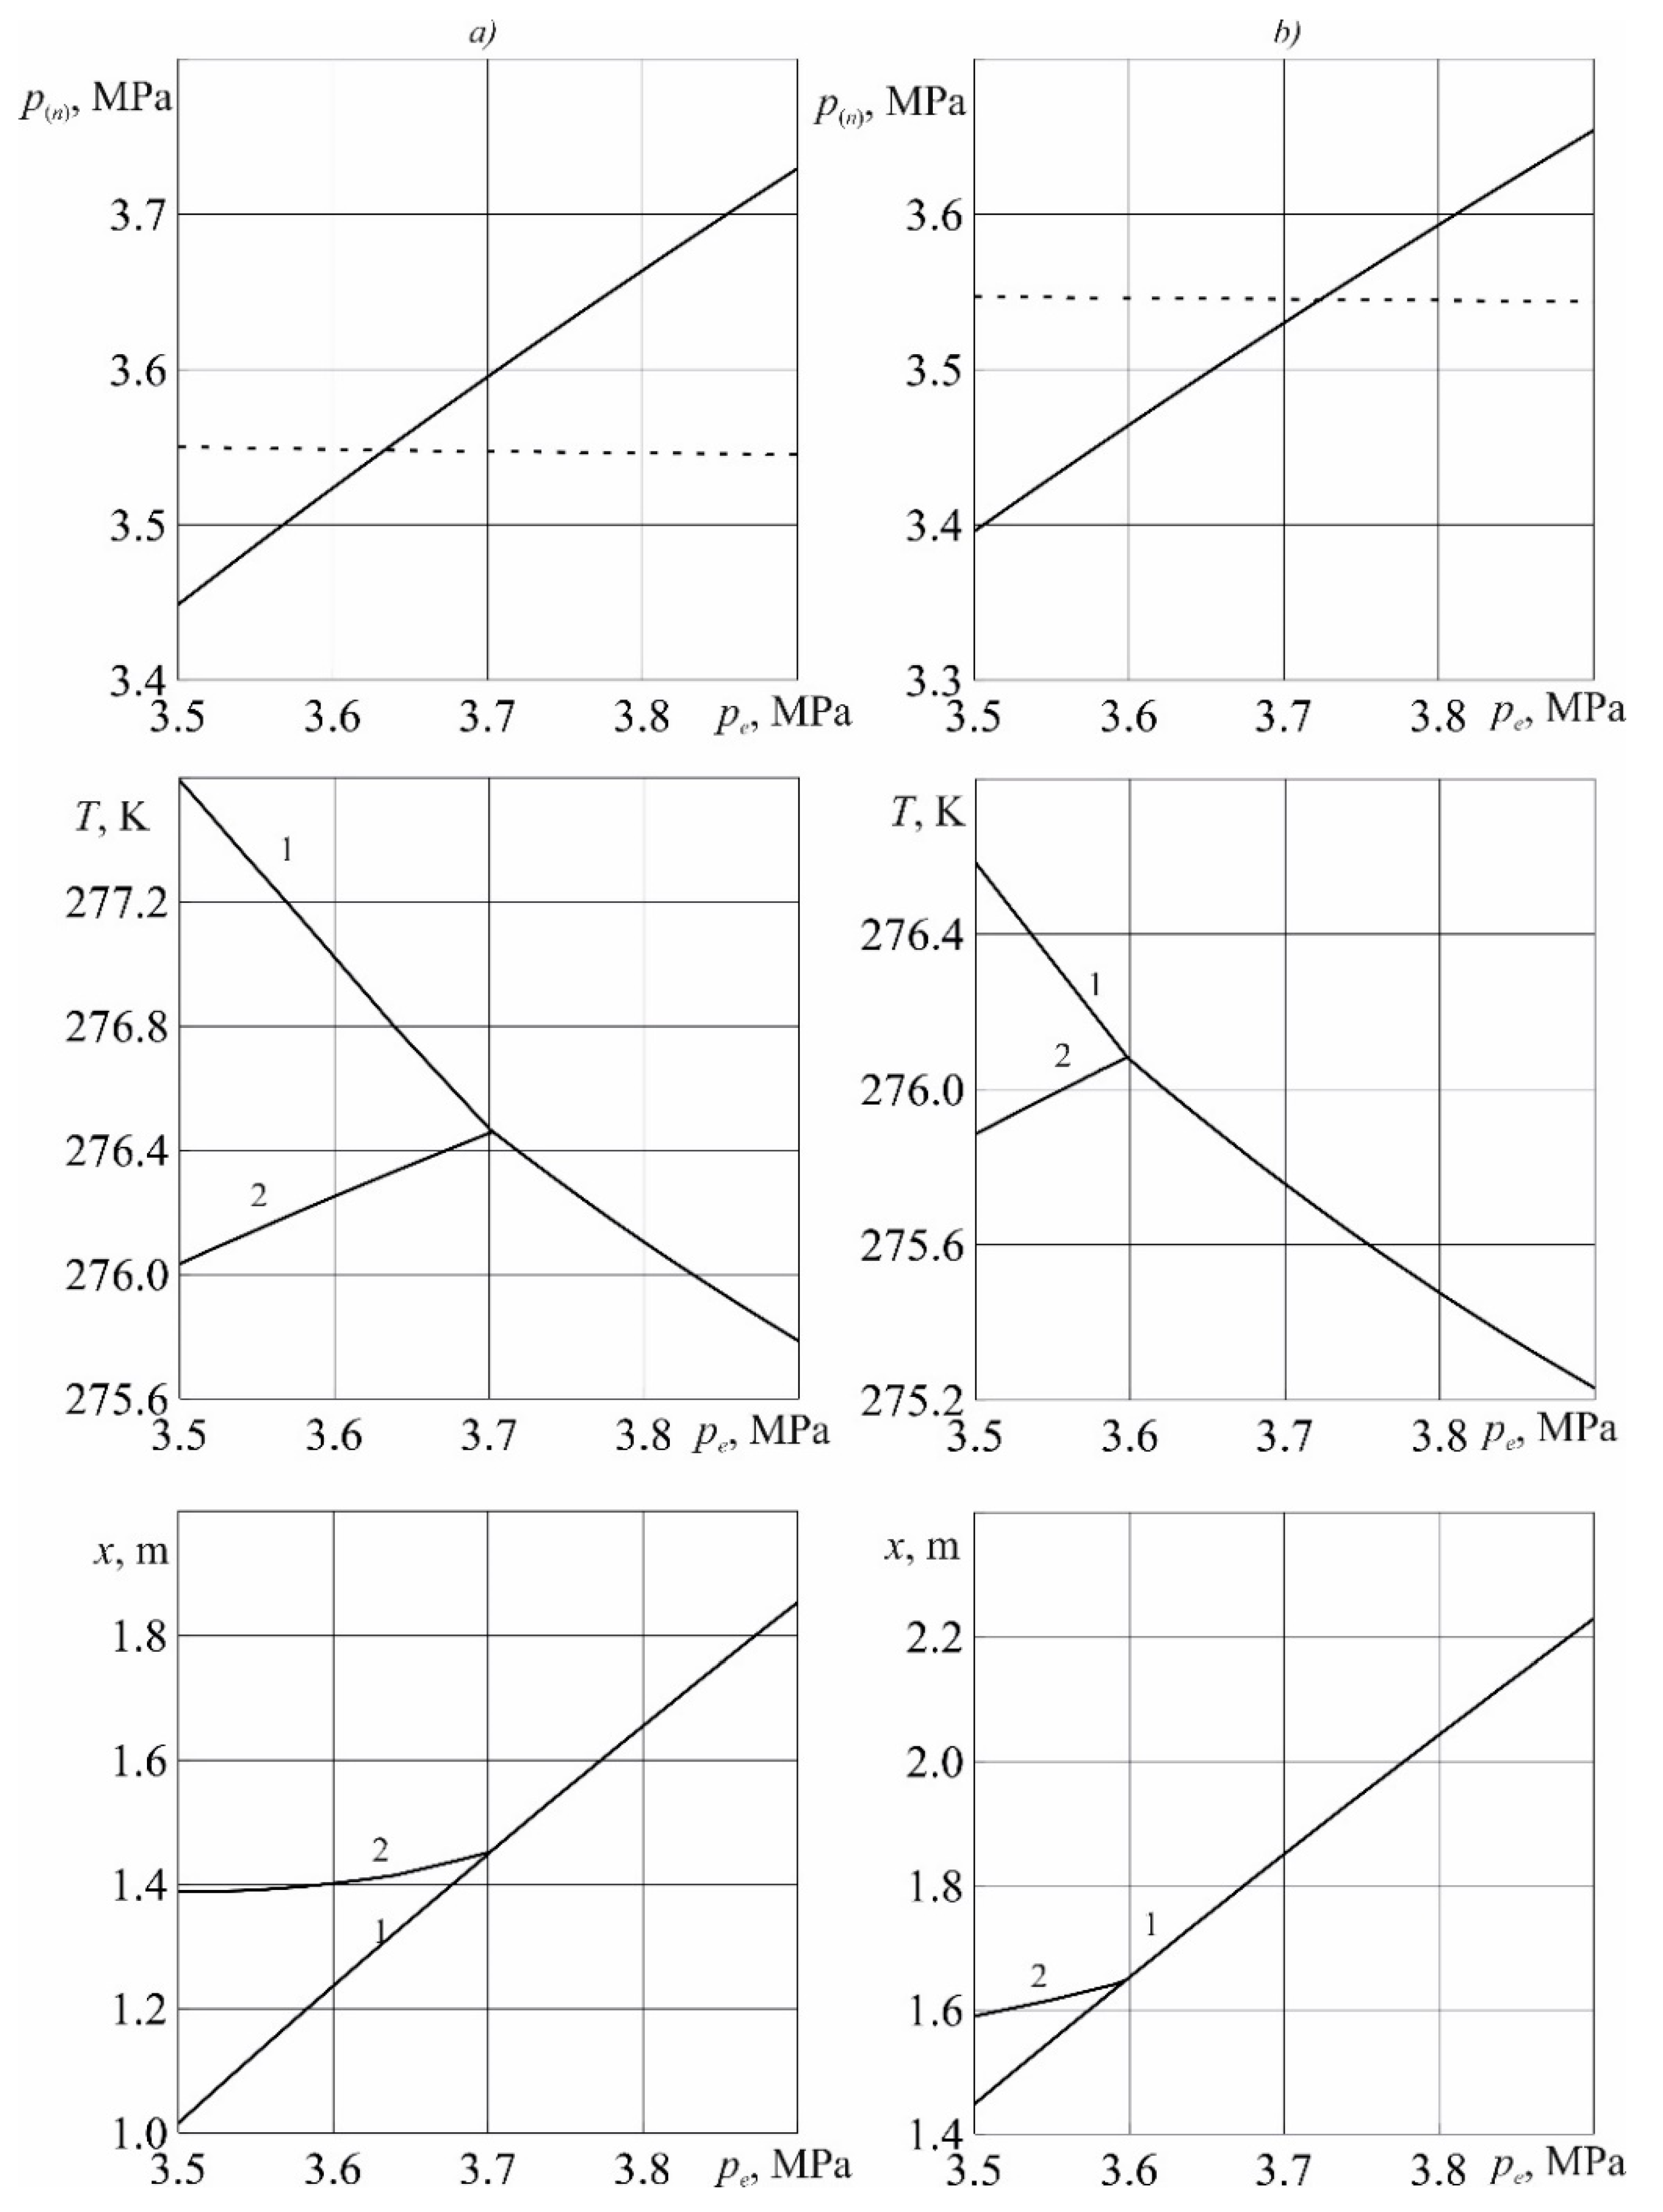
In
Figure 5, for the moment of time
t = 20 days, the dependences of pressure at the near boundary of phase transitions, as well as temperatures and coordinates of the near (curve 1) and distant (curve 2) of phase transitions boundaries, depending on the pressure at the right boundary of the reservoir, are shown. The values of injection pressure are
pe = 3.7 MPa for case (a) and 3.64 MPa for case (b).
Figure 5 shows the increase in temperature at the boundary of the formation of CO
2 gas hydrate with increasing pressure at the right boundary
p0. Also, according to
Figure 5, as the pressure on the right border
p0 decreases, the coordinates of both the near and far boundaries of the phase transition increase. This is due to the fact that the rate of CO
2 hydrate formation boundary is determined by the rate of methane displacement by carbon dioxide. Thus, the filtration rate of carbon dioxide increases with increasing pressure drop in the reservoir. An increase in the velocity of this boundary leads to a decrease in the influence on it of a hotter left boundary and, respectively, to a decrease in its temperature. As a consequence, according to
Figure 5, at low values of
p0, it is possible to merge the boundaries of phase transitions and therefore it is also possible to merge the formation of CO
2 hydrate in the replacement mode. Also, in the case of low values of
p0, the pressure at the near phase transition boundary can fall below the equilibrium boiling pressure. Thus, as follows from
Figure 5, at low pressures at the right boundary of the reservoir, the formation of CO
2 gas hydrate occurs in the replacement mode with the formation of a region saturated with gaseous CO
2 and its gas hydrate. At high values of
p0, the formation of CO
2 gas hydrate occurs according to the scheme shown in
Figure 2.
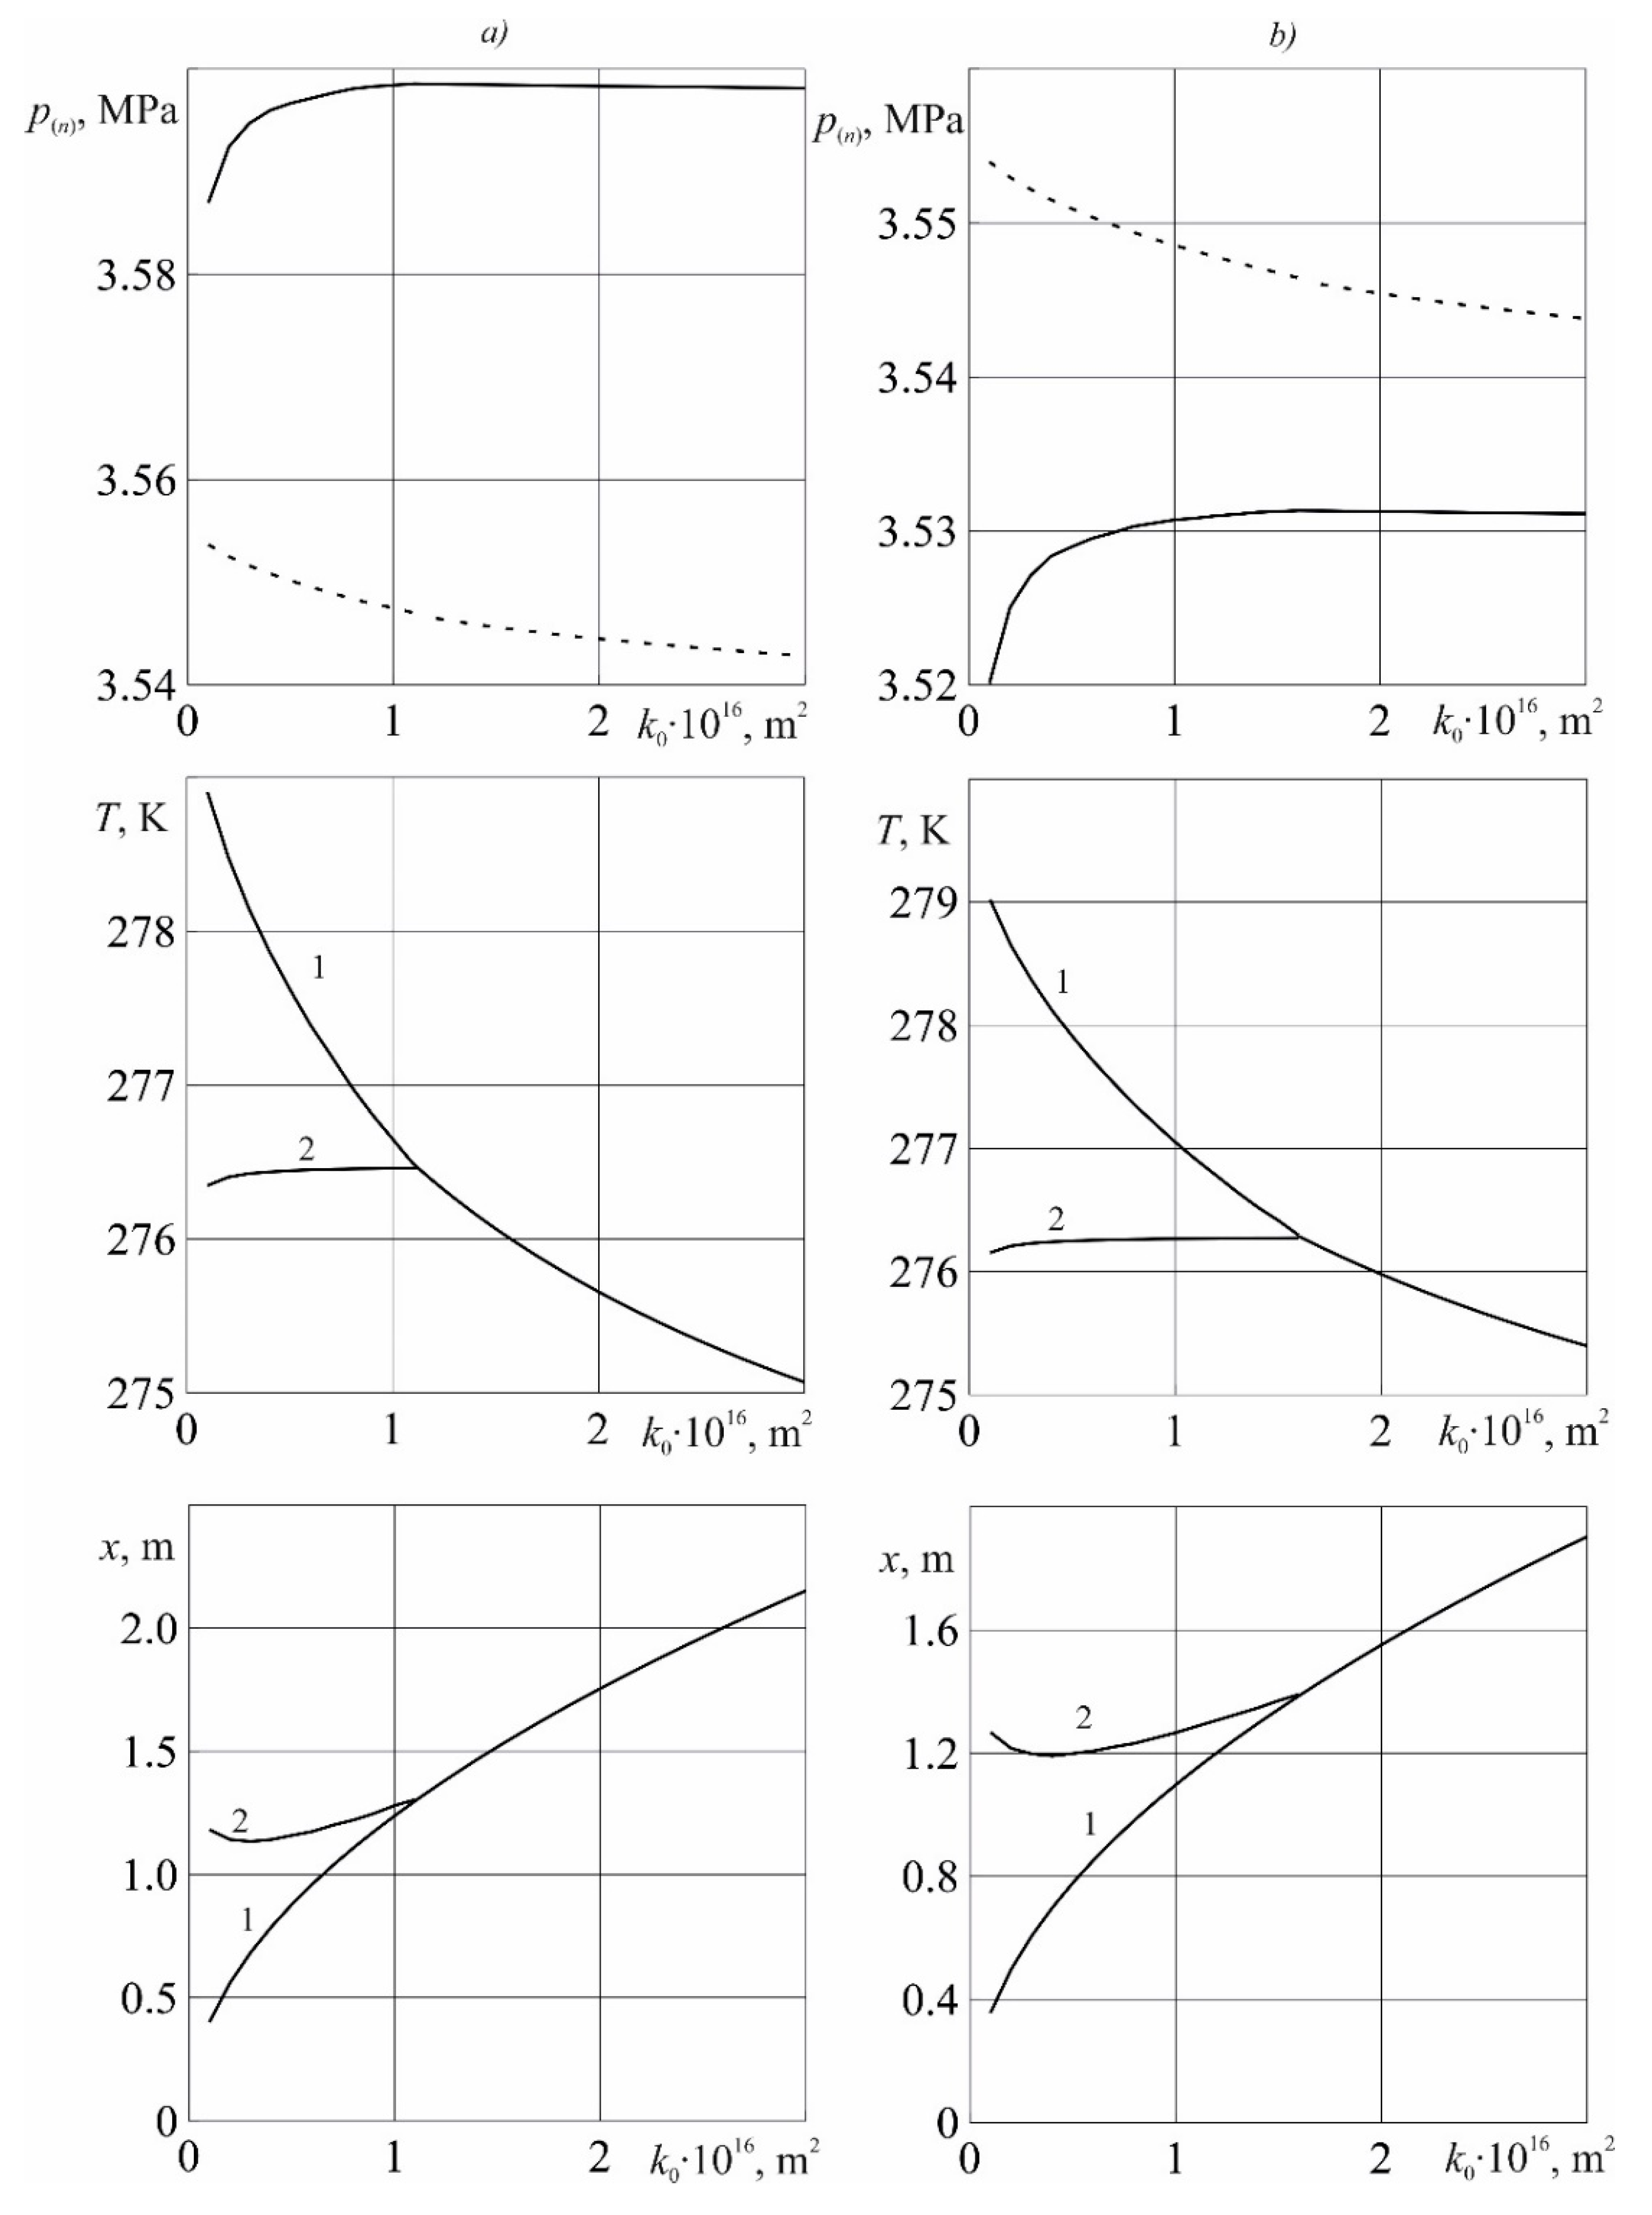
In
Figure 6, for the time of
t = 20 days the dependences of pressure at the near boundary of phase transitions, as well as temperatures and coordinates of the near (curve 1) and distant (curve 2) phase transition boundaries from the absolute permeability of the reservoir, are shown. The dashed line corresponds to the equilibrium boiling pressure of liquid CO
2. For the pressure of injection, the values are
pe = 3.75 MPa (a) and 3.65 MPa (b). From here and on, the pressure at the right boundary of the reservoir was assumed to be
p0 = 3 MPa. As follows from
Figure 6, with an increase in the permeability of the reservoir, the phase transitions may merge and produce CO
2 gas hydrate in the replacement mode. Also, according to
Figure 6, at relatively high injection pressures, the process of forming CO
2 gas hydrate will occur without forming a region saturated with gaseous CO
2 and its gas hydrate. At low injection pressures, the process will be accompanied by boiling of liquid carbon dioxide.
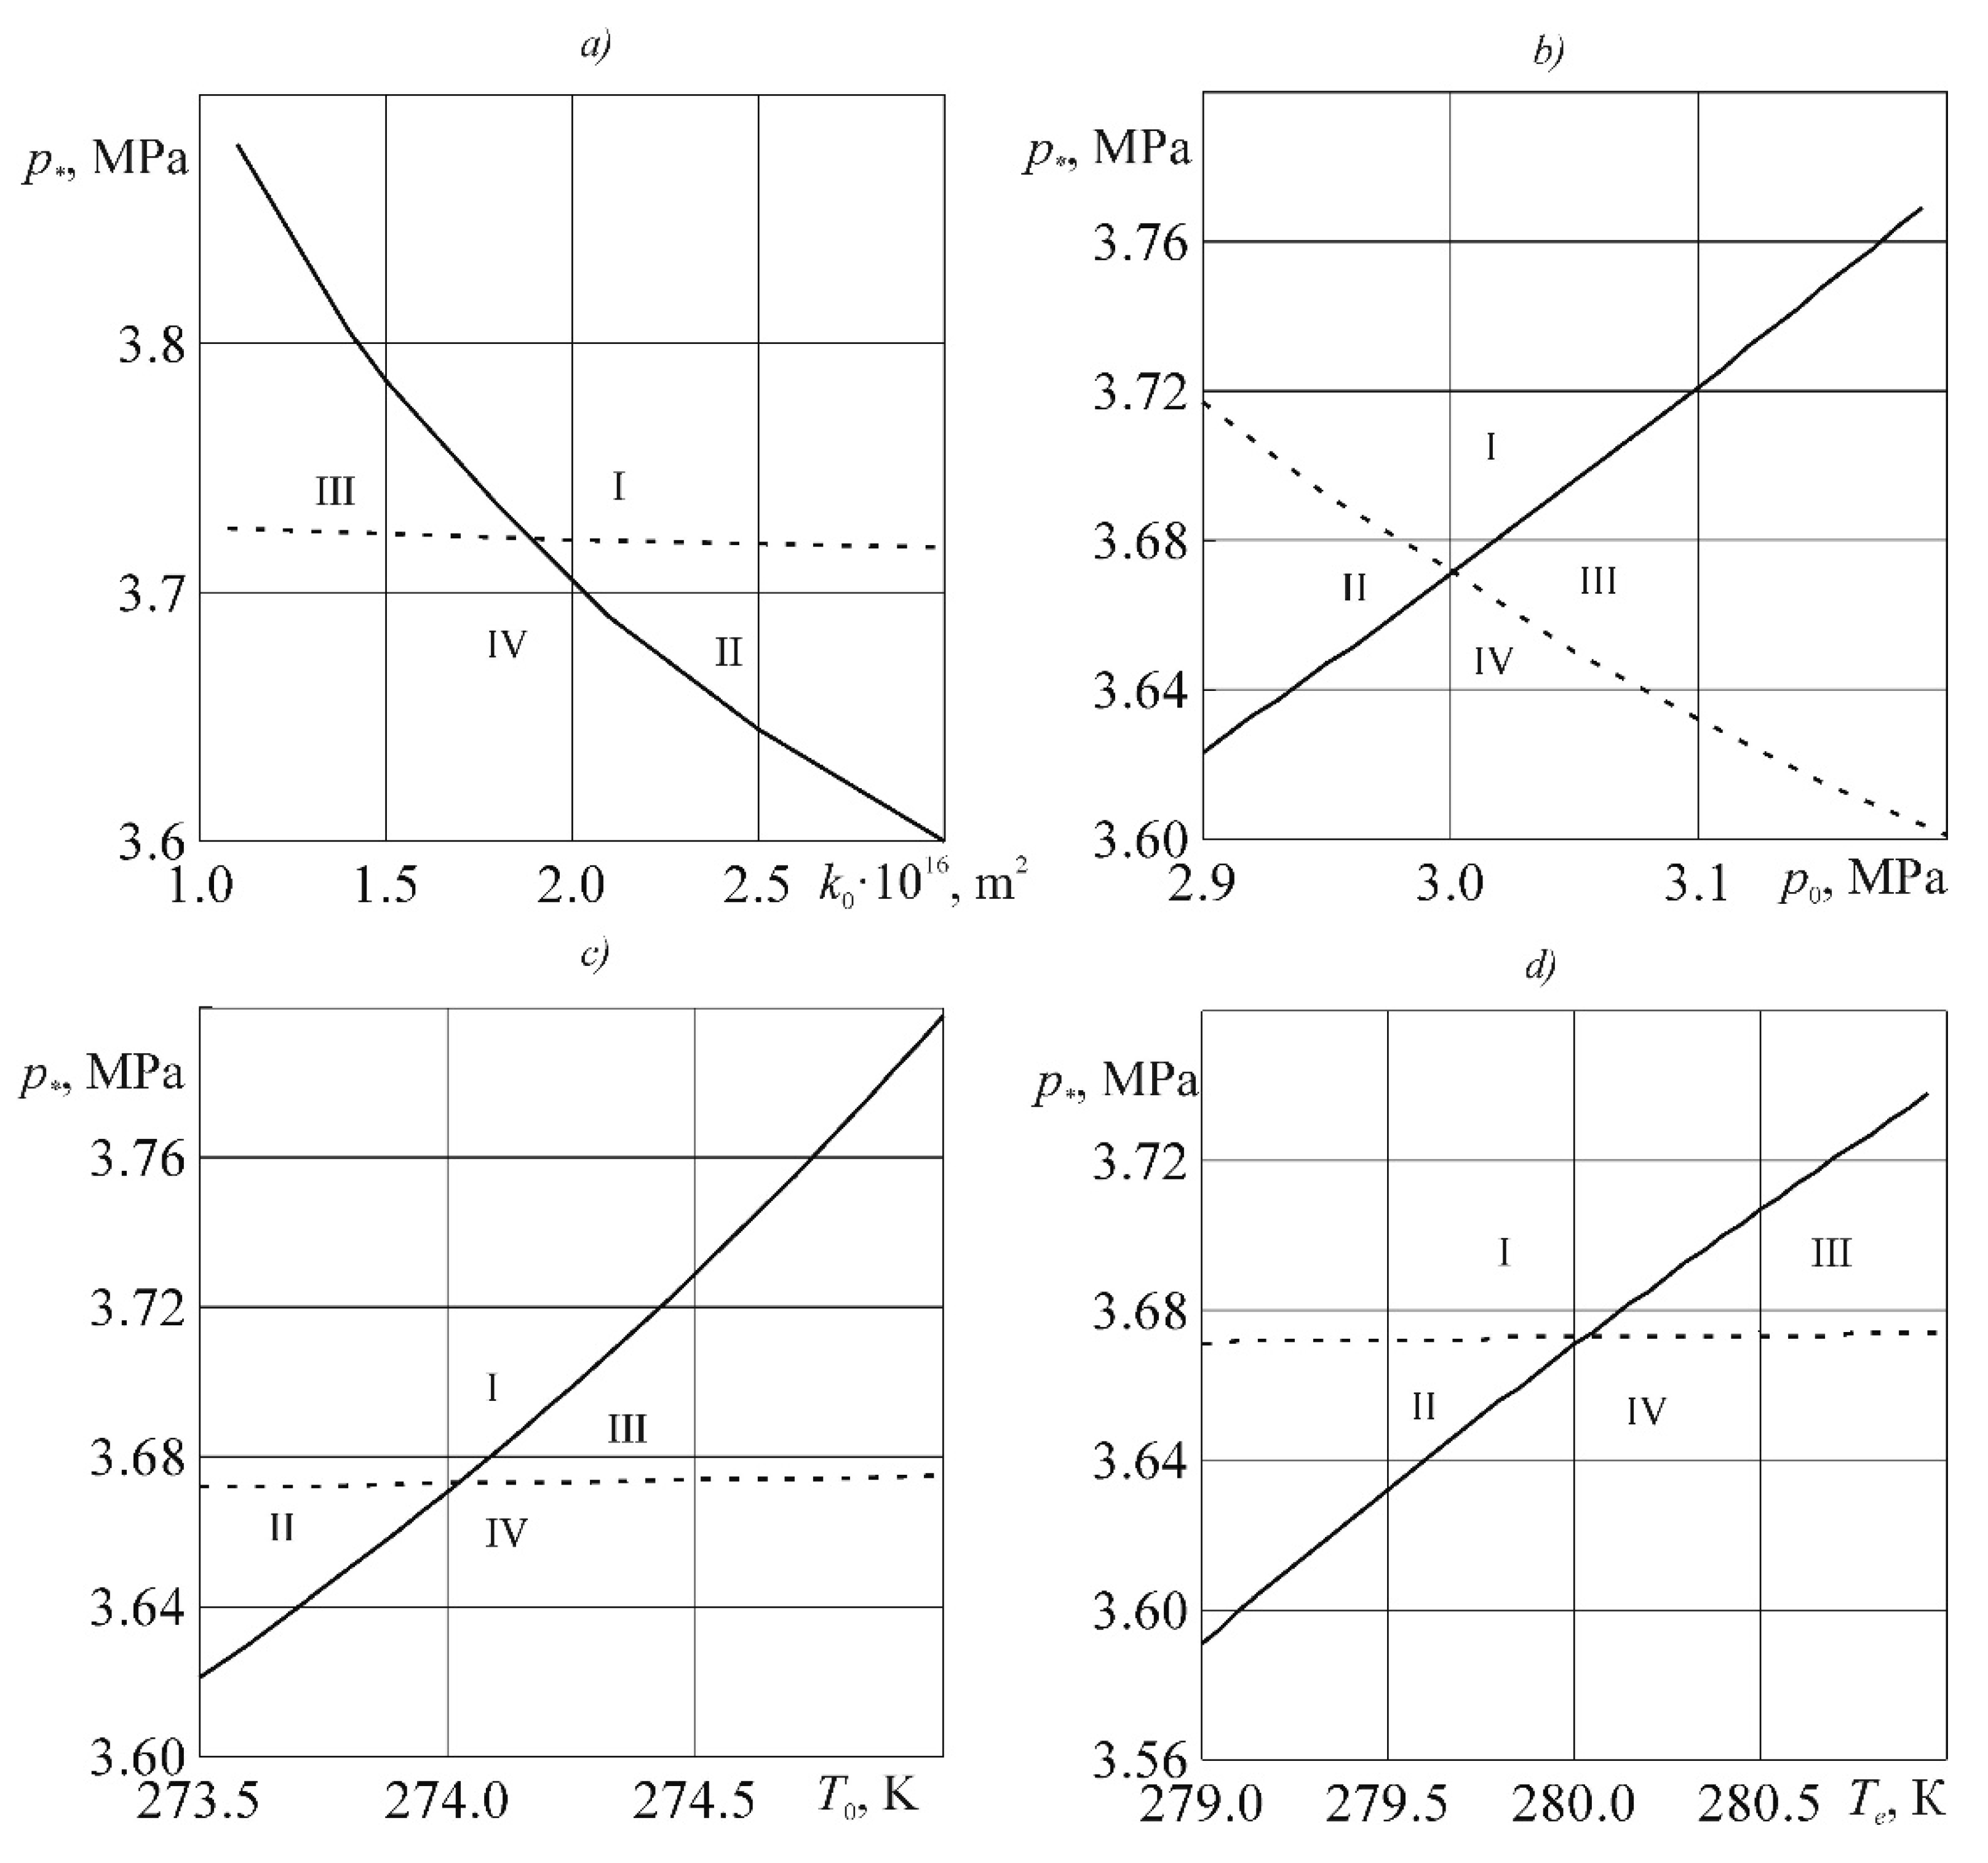
In
Figure 7 for time of
t = 20 days, the dependences of the limiting values of injection pressure
p*, separating modes with boiling and without boiling of carbon dioxide (dashed line) and modes with and without dissociation of methane gas hydrate (solid line) on the permeability of the porous medium (a), the pressure value at the right boundary of the reservoir (b), from the initial temperature of the reservoir (c) and from the injection temperature (d). The dashed line corresponds to the equilibrium boiling pressure of liquid CO
2.
Figure 7 shows four regions. In region I, there is no dissociation of CH
4 hydrate and the CO
2 boiling mode is present. This mode is implemented at high values of injection pressure. In region II, solutions are located without dissociation of CH
4 hydrate and with CO
2 boiling. This mode is typical for highly permeable reservoirs, for reservoirs with low pressure at the right boundary, also when there is a low temperature of injected liquid and low initial reservoir temperature. Region III corresponds to the mode of the process with the dissociation of CH
4 hydrate and without boiling of CO
2. This mode is typical for low-permeable reservoirs and high values of pressure at the right reservoir boundary. This mode is also implemented at high values of the injection temperature and of the initial temperature of the reservoir. In region IV, solutions are located with the dissociation of CH
4 hydrate and with boiling of CO
2. This mode is implemented at low values of injection pressure.


 ,
, 


