Predicting Fire Brigades Operational Breakdowns: A Real Case Study
by
 , ,
, ,
Selene Cerna
1,* ,
,
Christophe Guyeux
1 ,
,
Guillaume Royer
2,
Céline Chevallier
2 and
Guillaume Plumerel
2 1
Femto-ST Institute, University of Bourgogne Franche-Comté, UBFC, CNRS, 90000 Belfort, France
2
SDIS25—Service Départemental d’Incendie et de Secours du Doubs, 25000 Besançon, France
*
Author to whom correspondence should be addressed.
Mathematics 2020, 8(8), 1383; https://doi.org/10.3390/math8081383
Submission received: 3 July 2020
/
Revised: 30 July 2020
/
Accepted: 11 August 2020
/
Published: 18 August 2020
(This article belongs to the Special Issue New Trends in Machine Learning: Theory and Practice)
Abstract
:Over the years, fire departments have been searching for methods to identify their operational disruptions and establish strategies that allow them to efficiently organize their resources. The present work develops a methodology for breakage calculation and another for predicting disruptions based on machine learning techniques. The main objective is to establish indicators to identify the failures due to the temporal state of the organization in the human and vehicular material. Likewise, by forecasting disruptions, to determine strategies for the deployment or acquisition of the necessary armament. This would allow improving operational resilience and increasing the efficiency of the firemen over time. The methodology was applied to the Departmental Fire and Rescue Doubs (SDIS25) in France. However, it is generic enough to be extended and adapted to other fire departments. Considering a historic of breakdowns of 2017 and 2018, the best predictions of public service breakdowns for the year 2019, presented a root mean squared error of 2.5602 and a mean absolute error of 2.0240 on average with the XGBoost technique.
1. Introduction
Around the world, several fire departments suffer the consequences of maintaining a reduced or constant budget in the face of the linear growth of their workload over the years. Moreover, under certain conditions (such as in the face of a pandemic) the growth could be exponential. For this reason, it is necessary to analyze the variables that must be considered for the reorganization of human, material, and financial resources. Starting with establishing indicators that allow for the identification of the current state and monitoring the improvement process, consequently, leads to better decisions in the management of the budget and operational needs.
A good starting point is the prediction of interventions [1,2,3]. Knowing the possible future accidents that firefighters will attend to, would help in estimating the workload they would have in a given future time horizon. It would allow to know the future areas or populations at risk. It would provide too statistics on care facilities with an increase in demand. Furthermore, it would help to reasonably establish new strategies, i.e., allocation of human and technical material, to avoid service disruptions. Or in the worst case, to quickly regain operational stability.
However, firefighters have a great responsibility, which is public safety, and a technical study on fault detection and prediction in the fire service would help in determining the future and current operational efficiency and resilience. By means of performance indicators, generated when developing a breakdown calculation strategy, it would be possible to discover the lack of engines, the lack of firemen and the lack of skills that firemen must have in order to handle a given engine, i.e., to know the current technical state of a service center, and together with the prediction of breakdowns using machine learning techniques, statistics could be obtained about the centers that will be relatively inefficient or that will have problems in the availability of resources in a future time. Therefore, establish a necessary budget for the acquisition of new materials and allocation of resources according to the need of the fire department or each branch (service center).
The present work is a case study conducted with the support of the Doubs Fire and Rescue Department (SDIS 25), France. The objective is to establish a process to identify disruptions for years 2017, 2018, and 2019, calculate their types and times at each relief center, and determine the availability of resources at any given time. In addition, develop a mathematical model that allows an optimal search for an adapted engine available in a specific center and time. Furthermore, finally, to forecast the breakdowns for the months of 2019 by using machine learning techniques. This methodology could be applied to other fire brigades, depending on their data, which would help to improve the quality of the service provided.
The current paper is structured as follows: Section 2 makes a brief description of the contributions of the related works, Section 3.1 describes the breakdown calculation process, detailing the data used, the process flow diagram, and the model created to optimize the search for available adapted armament. Section 3.2 exposes the pre-processing of data performed to operational breaks, i.e., the collection of data, its standardization, and the division of data to be trained and tested. In addition, a brief description of the techniques used for forecasting and the Bayesian optimization applied to find the best hyper-parameters of each model are detailed. Section 4 presents the results and discussions on the calculation of breakdowns, as well as on the predictions obtained and their models. Finally, Section 5 shows our conclusions. Table 1 presents the abbreviations and the acronyms that will be used in the present paper.
2. Related Work
To the author’s knowledge, there is no research work on the specific task of detecting breakdowns and their forecasting in the fire service. On the other hand, we found works related such as [4], where the future efficiency service, of Tainan County Fire Department in Taiwan, was analyzed and then improved by allocating resources according to future production trends. For this, the Data Envelopment Analysis (DEA) and Group-number Efficiency Scale Approach (GESA) techniques were used with input variables as the number of on-duty personnel, on-duty cost, number of fires engines and vehicle maintenance fee. In 2020, Morello et al. [5] developed seven econometric models for fire prediction in the Brazilian Amazon with the aim of establishing suppression policies for forest fires. Four of the models with the lowest RMSE obtained a percentage error of no more than 29%. Likewise, the study revealed that spatial and temporal changes in fires were influenced by economic, institutional, climatic and physical factors, i.e., deforested areas, protected areas, degraded forests, GDP, temperature, precipitation, soil quality, among others.
Similarly, for the case of increased demand for ambulances, where the literature is more extensive, one can find [6], where a tool is proposed that, through simulations of responses to fires and emergencies, optimizes the location of vehicles and their dispatch to an emergency. In 2016, Dibene et al. [7] developed a modification for the Double Standard Model (DSM) applied to the location problem of ambulances of the Red Cross of Tijuana, Mexico, using integer linear programming. In 2019 [8], using data from the Emergency Medical Service of Lisboa, Portugal, a mathematical model was presented that integrates the dispatch and relocation decisions with a heuristic method applied during the relocation process, where the main objective is to maximize deployment coverage. In [9], models with different machine learning techniques were built to predict the daily demand for ambulances in Singapore. The dataset contained real ambulance and demographic data from 2006 to 2016. The authors claimed that the most important features were the total demand in the last 30 days and 7 days, and the best results were obtained with the LightGBM technique.
Furthermore, works like [10,11] propose approaches for optimal resource allocation in the face of disasters. The first develops a graph model for the study area, where each node represents a number of localized resources, and a mathematical model that describes the region and the dynamics of the detected fires. The authors conclude that the real-time resource allocation strategy allows for a greater decrease in the burned area compared to a greedy heuristic strategy, where resources are allocated when the nearest fire has been completely extinguished. Furthermore, the second article proposes a stochastic integer programming model, considering different forest fire scenarios with the objective of minimizing the cost produced by the suppression of the fire, the damaged areas and the number of people at risk. However, the model makes assumptions that in real life would be more complex to implement. Moreover, our research group developed a methodology for predicting interventions using Long-Short Term Memory (LSTM) [12], where internal variables such as dates and number of incidents occurred, and external variables such as weather, traffic, holidays, among others, were included. In addition, data were normalized, features were selected using Mutual Information (MI) and a genetic algorithm was used for model selection. The results showed an accuracy of 55.41% with a margin of error less or equal to one. In the search for a better prediction of the incidents, the performances of LSTM and Extreme Gradient Boosting (XGBoost) were compared [1], more external variables were added for the pattern recognition, reaching an accuracy of 76.94% with an error margin of incidents using the XGBoost technique. During data analysis over the years, an almost linear increase in the interventions was discovered, which shows the increase in workload and suggests that under a constant budget more breaks in service could tend to occur. To deepen the search, comparisons were made with XGBoost, Adaptive Boosting (AdaBoost) and Gradient Boosting [13], as these techniques have shown to be very effective in modeling high non-linear behavior. Furthermore, it was studied several ways of building a Multilayer Perceptron (MLP) neural network for predicting interventions [3], taking into consideration hyper-parameters such as the number of layers and their corresponding number of neurons, the optimizer and the activation function. What is more, the anonymization techniques were also tested. In [2] the interventions with victims were anonymized through k-anonymity and Differential Privacy techniques in order to predict the daily interventions in number and type for the two big cities of the region under study. The authors concluded that differential confidentiality produced more accurate results. Furthermore, in [14], the authors proposed a methodology to privately collect the number of firemen interventions per location. The employed technique allowed to estimate the number of interventions per region for each day respecting privacy. The latter estimation (synthetic data) was then used for predicting the number of interventions per region using XGBoost. It was showed that using anonymized data can still guarantee good estimations comparing with the raw dataset.
3. Methodology
This section sets out the methodology applied for the breakage calculation. The result together with other explanatory variables, that will be described in the subsection Predicting breakdowns, will serve as input for the prediction of operational disruptions for the SDIS25 in the 12 months of the year 2019.
3.1. The Breakage Calculation Process
The operational breakdown is defined by the SDIS25, taking into account the momentary operational load of a sector (and possibly neighbouring sectors), as the inability to provide assistance within the time limits meeting the objectives set. In the following subsections, the process of the breakdown calculation is described in detail.
3.1.1. Overview
The information provided by the SDIS25 for the break calculation is from the years 2017 to 2019. As a first analysis, the types of interventions analyzed were Rescue people (RP) and Fire (FR). Figure 1 shows the process of rupture calculation which is composed of 3 stages:
- Stage 1:
- a
- Identify all the interventions that occurred in Doubs region by the SDIS25 fire department. This is because there are interventions that happened outside the region in aid of other fire departments.
- b
- Determine their location in order to recognize the 3 main areas defined by the SDIS25, namely: zone 1 (Z1), zone 2 (Z2), and zone 3 (Z3). These zones determine the time limit that an Adapted Engine (AE) and a Non-Adapted Engine (NAE) take to reach the scene. The relationship between the cities in the region and the zones is based on the Deployment Plan (DP) designed by the fire department for easy recognition of the centers that will have to respond to an emergency in that zone.
- c
- Finally, we obtain a filtered list of the interventions that will enter in the next stage.
- Stage 2:
- a
- The interventions enter in the breakdown calculation, but first it is validated if all the necessary information is present, such as: the beginning and end of the intervention, the engine used, the participating firemen, the departure and return times.
- b
- In conjunction with other data such as the history of the firefighters’ and engines’ departures, administrative data such as the availability times of the professional and volunteer firefighters, as well as their skills and the DP that allows the identification of the first centers to respond to incidents, are used during the calculation.
- c
- Finally, all processed interventions are obtained.
- Stage 3: The results provide statistics on the response capacity of the branches of the SDIS25, which are preferably displayed on maps by sector, where a sector is the area covered by a service center. These will be described in more detail in the Section 4.1.
The process allows us to know the current technical status of each branch and of the SDIS25 in general. Thus, the sectors that present more ruptures can be visualized to take action in the management of their resources. If, for example, the resources of a temporarily inefficient center were reduced, this would have serious consequences for public safety in a given time.
3.1.2. Data Sources
An essential part of the breakdown calculation is having the data necessary to obtain more detailed statistics. At the same time, it allows us to know the environment, i.e., the capacity of human and material resources that each center has, and how it is or would be affected with the increase or decrease of resources in a future optimization. Thus, we could provide sufficient resources to an affected branch and increase the efficiency of its rescue and relief capacity.
The dataset considers:
Geographically:
- a
- The coordinates of the location of the interventions.
- b
- The coordinates of the location of the centers.
- c
- Shape files of the geometries of each city in the department of Doubs. A city contains 0 or more districts. In total, 573 cities and 440 districts were counted.
- d
- Deployment plan that provides a list of the cities and their districts in the region. Each city and district has an assigned zone (Z1, Z2, and Z3). The zone provides the time limits that a center and its engines have to reach the site. These deadlines depend on the type of engine AE or NAE. The time limits for both types of intervention are the same and are described in Table 2. A NAE in Z1 has 10 min to reach the scene and 20 min in Z2 and Z3. However, the time for an AE depends on whether a NAE arrived at the scene first. For example, in Z2, the AE has 25 min to arrive at the scene if there was a NAE before it, otherwise its time is reduced to 20 min.
Administratively:
- a
- Records of interventions. They contain an identifier, the beginning, the arrival at the place of the first adapted engine and the end of the intervention.
- b
- Records of engine departures. They contain the identifier and type of intervention, the service center, the engine registration number, the type of engine, the date and time when the engine receives the intervention alert, the departure of the engine, the arrival at the site, the departure to the hospital and the end of its mission.
- c
- Records of agent departures. They contain the same characteristics of the records described above, including the agent’s identifier and full name.
- d
- Records of agents’ availability schedule.
- e
- Records of agents’ skills obtained over the years to operate an engine, depending on whether the agent is professional or voluntary.
- f
- Records from centers that include the number and quantity of engines they own.
3.1.3. Diagram of the Calculation Process
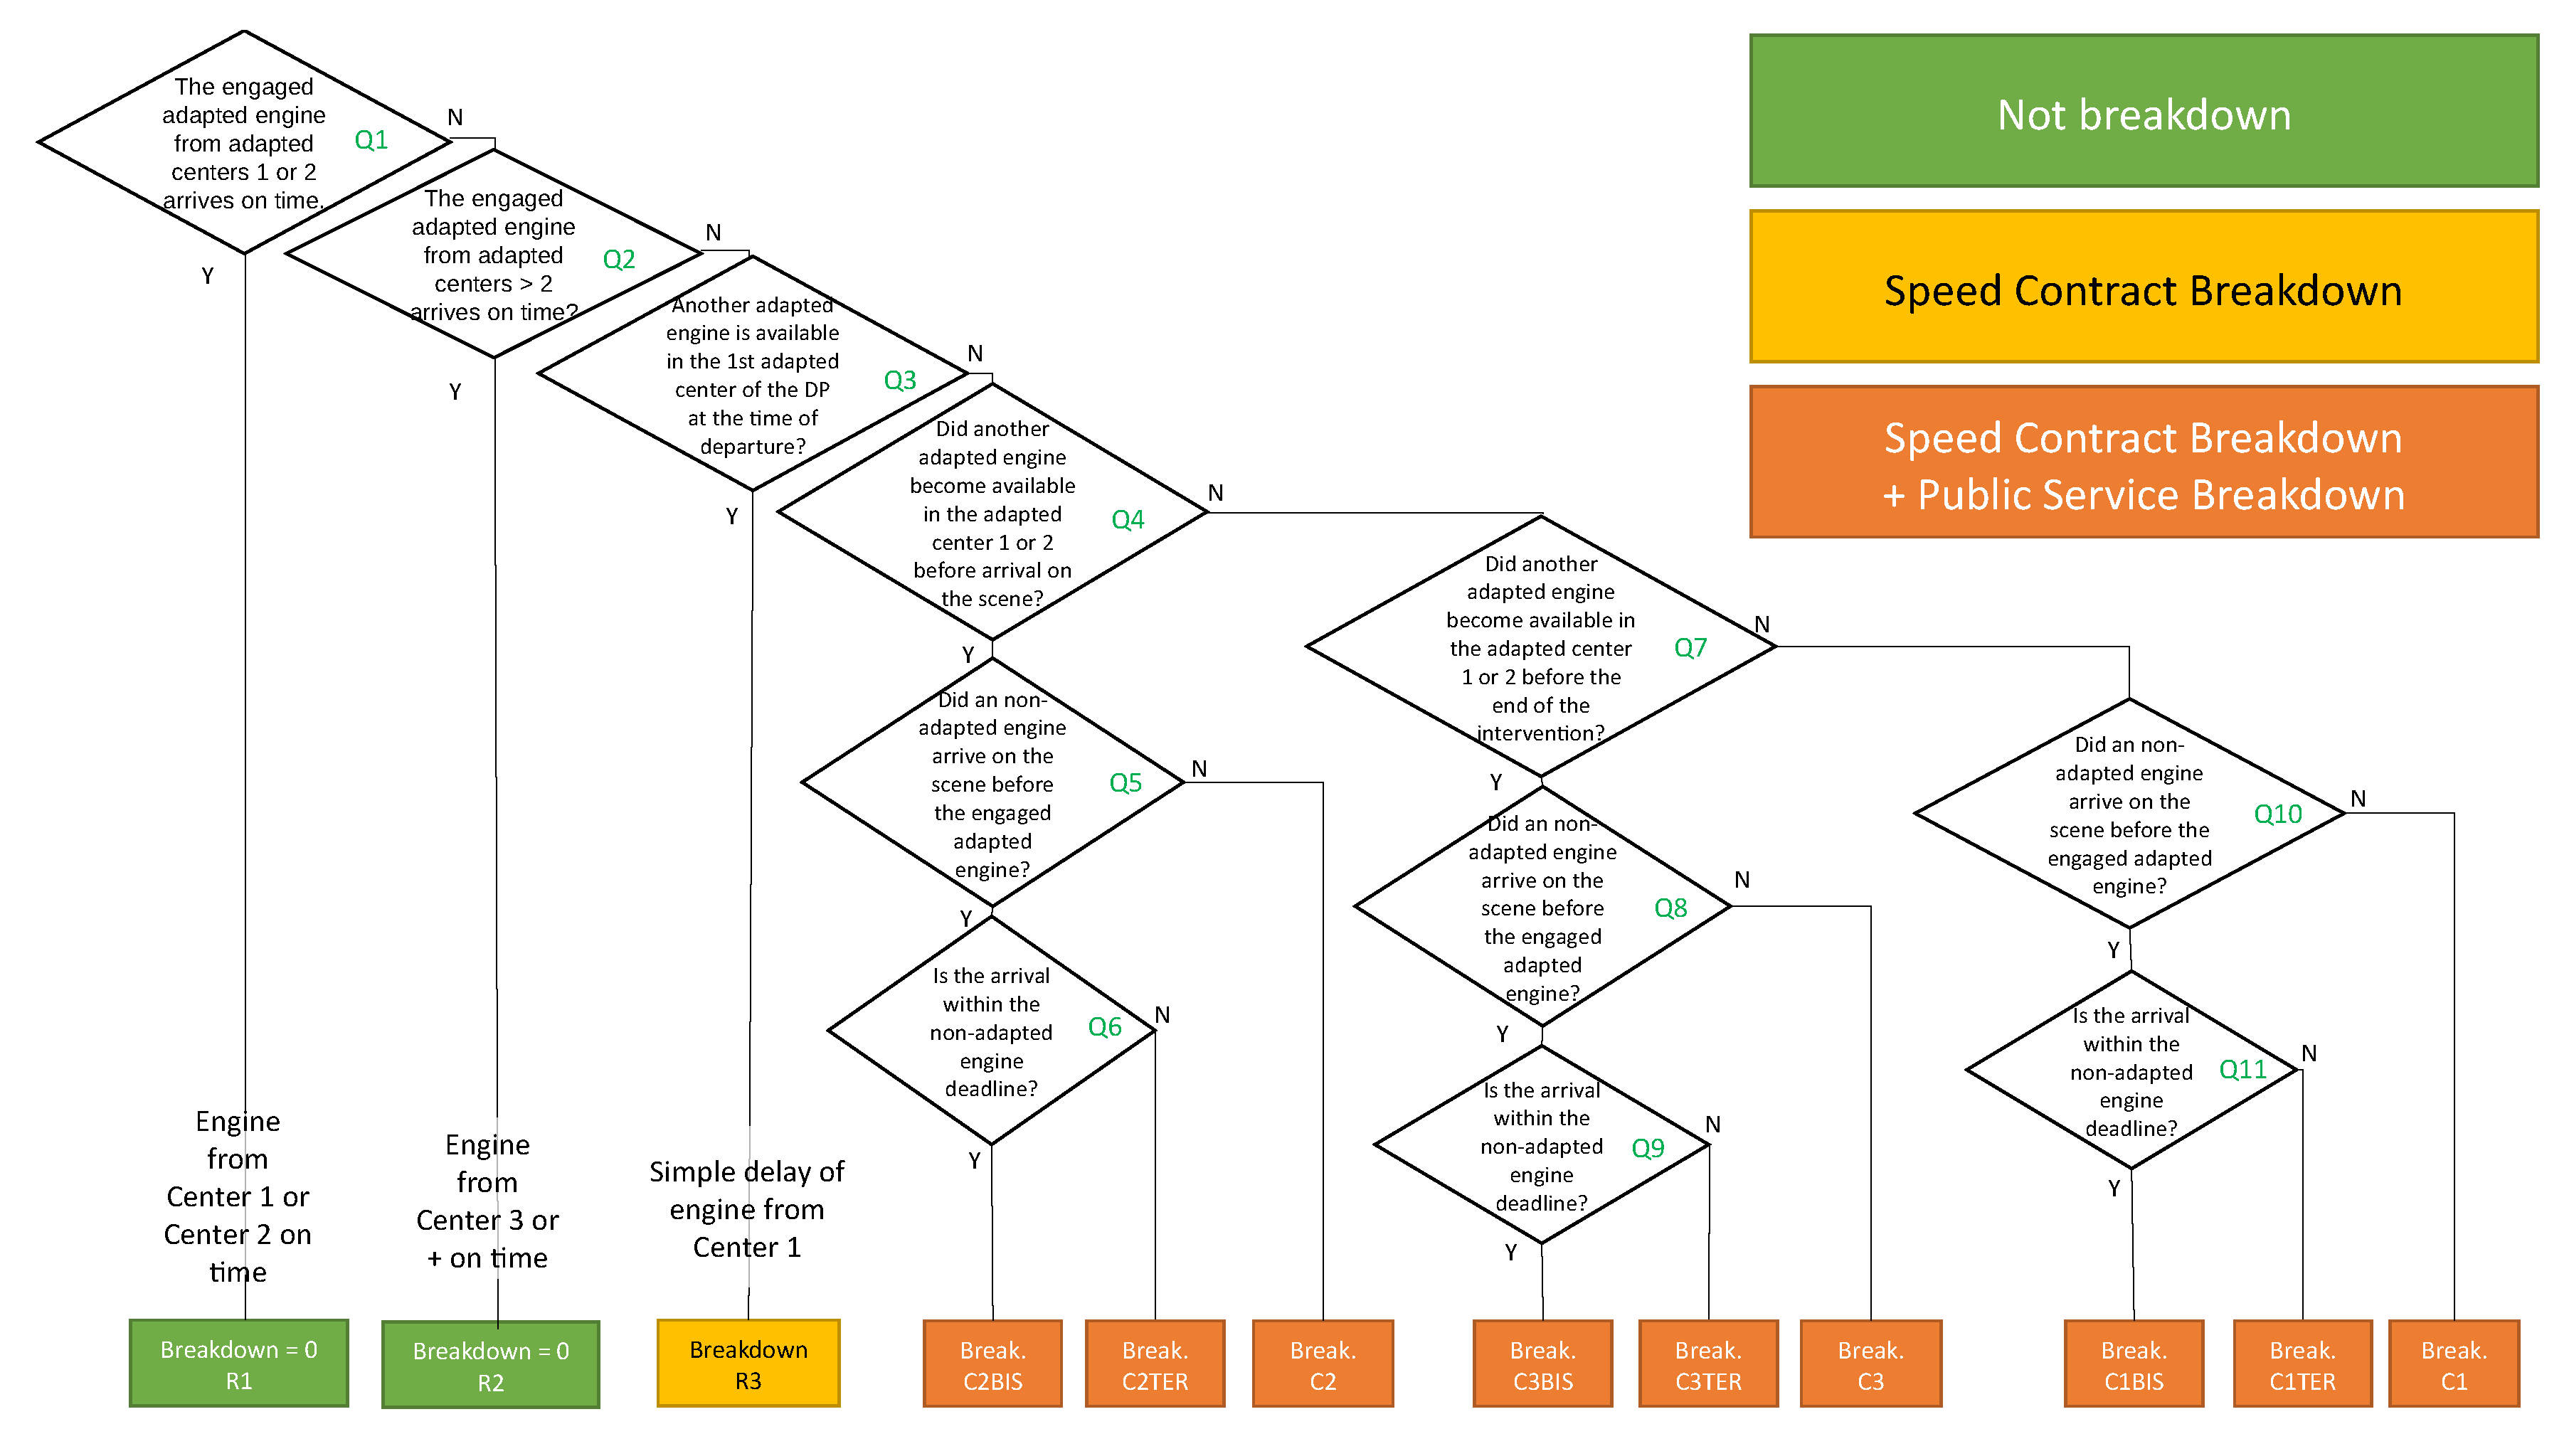
In order to process the interventions and to know if ruptures occurred, an algorithm based on the flow chart in Figure 2 was developed.
An adapted engine is said to be available when it has the number of agents required to depart. Agents must have certain skills to handle the engine. The skills depend on the type of intervention and the engine selected. For illustration purposes the most representative skills are: Driver (DR), Chief Guard (CG), Team Leader (TL) and Crew Member (CM). For an RP intervention, the necessary skills are DR, CG, and CM. Furthermore, for a FR intervention, they are: DR, CG, TL, and CM.
There are several types of centers that SDIS25 commands in Doubs. For our analysis, we have only considered adapted centers. A center or branch is adapted when it has engines adapted to the types of intervention analyzed. From here on we will use the word center to refer to an adapted center.
There are two types of breakdowns: Speed Contract Breakdown, it is when the engine and agents arrive at the scene outside the time limits defined in Table 2, for internal reasons (may be due to a delay in departure) or external reasons (may be due to vehicle congestion on the route); and Public Service Breakdown, is when the centers do not have sufficient resources at the time of an intervention to cover a subsequent intervention.
Interventions are classified as R1 and R2 when there was no breakdown. Furthermore, as R3 when there was an adapted engine available in reserve but the team involved in the current intervention arrived late to the scene.
Both types of ruptures can occur at the same time, and they are classified in nine cases. C2BIS, C2TER and C2 cases occur when there was no other adapted engine available at the first or second center between departure and arrival at the scene. This indicates that there was a lack of engine or agents available for a subsequent intervention. The sub-classification is given by answering the questions whether or not there was a NAE before the EA and whether both arrived within their defined time frames. C3BIS, C3TER, and C3 cases are produced because there was no adapted engine available between arrival at the scene and before the end of the intervention. The sub-classification is as described previously. C1BIS, C1TER, and C1 cases are the worst case scenarios, because they indicate that until the end of an intervention that can last on average almost 2 h, there were no resources available at the first or second center to ensure the safety and well-being of the population of a given locality.
For each breakdown case in the flow chart, a calculation of the breakdown time was designed. For a more simplified illustration, we will describe the general idea as follows:
- a
- The data needed to calculate the breakdown time are: the time when the alert is received, the time of the arrivals of the AE and NAE to the scene, and the time when the center 1 or 2 has an AE available.
- b
- Given an intervention, there is a breakdown in the speed contract when the engaged AE or NAE has exceeded the time limit for arriving at the area, described in Table 2. Therefore, the difference between these two is the breakdown time.
- c
- Given an intervention, the public service breakdown time is the period in which a center does not have reserve resources. The breakdown time is the difference between the time at which a center receives the alert to attend the intervention plus the time limit set out in Table 2 for the engaged AE with or without a NAE and the time at which the center has an AE available again.
In fact, the result of this process provides detailed information on the cities and districts where the most breakdowns occurred, areas that may be difficult to access and that may require a closer center or to find a best route to arrive. It also provides us with statistics by type of intervention, which allows us to recognize the lack of a specific material. It generates statistics on the first call center that was partially under-resourced and the second call center that was unable to cover the first center. Provides information about the lack of a specific engine or firefighter and their skills. In summary, this allows us to analyze and determine the problems that the center deal with. Consequently, it would allow us to optimize the distribution of resources in a more accurate way, and to increase the operational capacity of the centers according to the need.
3.1.4. Search Optimization for Available Agents and Engines
During the calculation of the public service ruptures, in each intervention processed, an adapted engine available at center 1 or center 2 had to be validated and retrieved in a certain period of time. As explained in the previous section, to assemble the equipment and ensure the availability of the center, an adapted engine should be available with the agents and their corresponding skills to operate the engine. Performing a search of this size among thousands of firefighters and various skills that fit various types of AEs requires a large consumption of resources and time, since we would have to try many combinations until we find one feasible.
For this reason, it was necessary to model a method for search optimization. The created model was built with the GEKKO library from Python [15], using the Mixed Integer Nonlinear Programming solver. It is described as follows:
where: is a Boolean matrix representing the ability i which has an available agent j, is a Boolean vector that represents if an agent j was selected (it takes value 1) or not (it takes value 0) to depart in mission with a specific AE, represents the minimum number of agents required per skill for the AE to depart in mission.
Notice that the aim is not to minimize an objective function, but to quickly find a feasible solution that we know exists after having previously defined the restrictions to enter the process, i.e., we established the constraint solver to compute an arbitrary solution within the space of feasible solutions and not as an optimization mechanism. Hence, the objective function is just a constant (zero) independently of the solution.
Given an adapted engine and knowing that an agent can have several skills at the same time, some of the principal restrictions were: the number of available agents must be greater or equal to the minimum number of agents required to depart. At least one of the available agents must have the ability to be a driver (DR) for a specific AE. The skills found in the available agents must cover the required skills. For a clearer view of the model, an example is shown as follows:
Let us imagine that an intervention is of the RP type, there are 10 firefighters available at the moment and the equipment needs to be assembled for an adapted engine: Rescue and Victim Assistance Vehicle (RVAV). This engine needs 3 agents: at least 1 agent with the skill DR, at least 1 agent with the skill CG and at least 1 agent with the skill CM. Then, the system would be:
Each row of the Boolean matrix corresponds to a skill (DR, CG and CM) and each column represents an available agent. Together they symbolize the skills per agent. The vector column x represents the firefighters or agents that will be chosen and the vector on the right side shows the number of agents needed per skill.
This allows us to rebuild an armament in a specific time and ensure the availability of an adapted resource in reserve in case of a new emergency.
3.2. Predicting Breakdowns
The disruptions calculated so far allow us to examine the current state of efficiency of each centre according to its resources. More generally, they allow us to know the breakdowns of the SDIS25 and their trends over the last 3 years in the Doubs region. Likewise, if we predict the ruptures for the coming months, we will have a broader view of what they will face if there is no acquisition or reorganization of the current resources, in order to protect the well-being of the population. Therefore, based on Machine Learning techniques and together with other internal and external variables, it will be possible to forecast the breakdowns for the coming months.
The set of tests are the 12 months of the year 2019 and the training set will start with the years 2017 and 2018, and according to the month predicted the training set will increase. Furthermore, the breakdowns are grouped by day. Although the data set is small at the moment, the predictions made are a first approach before continuing with resource optimization by center, which is beyond the scope of this article and is a future work. In addition, the present work develops predictions for disruptions of type: Public Service. This type of disruption is an indicator for the recognition of lack of technical material, i.e., lack of engines and trained agents in a given period. The predictions will be the total number of service public breakdowns that the SDIS25 will have for each month of 2019.
3.2.1. Data Pre-Processing
In order to populate our data set, extract more characteristics from the explanatory variables and normalize them to assist in convergence, we performed data pre-processing.
The data collected cover internal variables such as: the number of engines available per day, the number of firefighters who worked on a given day, and breakdowns that occurred in Doubs region. In previous articles [3,13,14], several models were constructed for the prediction of interventions. Therefore if we know the future interventions with a reasonable accuracy, these can be used as input data for the prediction of breakdowns. In our tests, the number of interventions per day is included in the data set as an explanatory variable.
Furthermore, external variables was added such as: meteorological data (temperature, pressure, barometric trend, humidity, dew point, precipitation, wind speed, wind direction, gust speed, and type of weather) from Météo-France [16], obtained each 3 h; epidemiological statistics on diarrhea, flu, and chickenpox from Sentinelles network [17], obtained weekly; the prediction of the level of traffic for each day from Bison-Futé [18], forecast by year; and the distance between the planet Earth and the Moon to analyze possible correlations (e.g., between solar flares and fires due to electrical incidents), obtained by day from Skyfield [19]. Besides, time variables were included such as: day, day in the year, day in the week, month and year; and time indicators such as weekend, beginning and end of month, beginning and end of year.
Numerical data such as meteorological variables except for barometric trend and type of weather, epidemiological data, distance to the moon, day, day in the week, day in the year, month and year were standardized with the RobustScaler method from the Scikit-Learn library in Python [20], where the data are centered before scaling. Categorical data such as traffic indicators, barometric trend and type of weather were encoded using the One-Hot-Encode method, also from Scikit-Learn. Finally the target variable was not encoded, because better results were obtained without its coding.
The breakdowns were grouped by day, as well as all other variables. Those numerical variables collected by hour were averaged over a day, and from the categorical ones their mode was calculated. The breakdowns for the years 2017 and 2018, 730 samples in total, were used during the training to predict the month of January 2019; the breakdowns for 2017–2018 and January 2019 were used to predict February 2019, and so on, i.e., a model is generated for each month of the year 2019.
3.2.2. Modelling with Machine Learning Techniques
The baseline model was constructed by calculating the average daily public service breakdowns in each month for the years 2017 and 2018. Furthermore, other models were developed with the techniques:
- a
- Extreme Gradient Boosting (XGBoost), recognized for its high parallel processing capacity and robustness. Besides that its objective function considers the loss function and also a regulator to minimize the complexity of the model [21].
- b
- Multilayer Perceptron (MLP), taken from the implementation made in the Scikit-Learn library. It is a feedforward artificial neural network [22], consisting of a set of units, called neurons, organized in input, hidden or intermediate, and output layers that are interconnected. The neurons are activated by an activation function like the Rectified Linear Unit (ReLu), which will be used in our models. The information is learned through an optimization algorithm such as Adaptive Moment Estimation (Adam) [23], also used in the present work.
- c
- d
- Support Vector Machine (SVM), taken from the Scikit-Learn library. Its main goal is to find a hyper-plane that better divides a data set into classes. It is also applied to regression problems, using for example the Epsilon-Support Vector Regression method [26].
- e
- Random Forest (RF), from the Scikit-Learn library. This is an ensemble learning method, which randomly generates several decision trees in parallel with subsets of the samples. A set of trees forms a random forest. In the case of regression, the result is given by the average of individual trees [27].
Since a wide variety of hyper-parameter configurations are presented in each technique, we opted for Bayesian Optimization (BO) to guide the learning of our models [28]. Bayesian Optimization allows for overall optimization of black box functions. As it is described in [29], BO creates a probabilistic substitute model, i.e., there is a preliminary distribution that describes how the behavior of the unknown objective function apparently is, this allows to create a model that describes the data generation. The model selects the following configuration that maximizes the acquisition function. The acquisition function allows the exploration and exploitation of the search space and is cheaper to evaluate than the black box function. In the present work, the library [30] was used for the Bayesian Optimization.
4. Results and Discussion
4.1. Results and Discussion of the Breakdowns Calculation
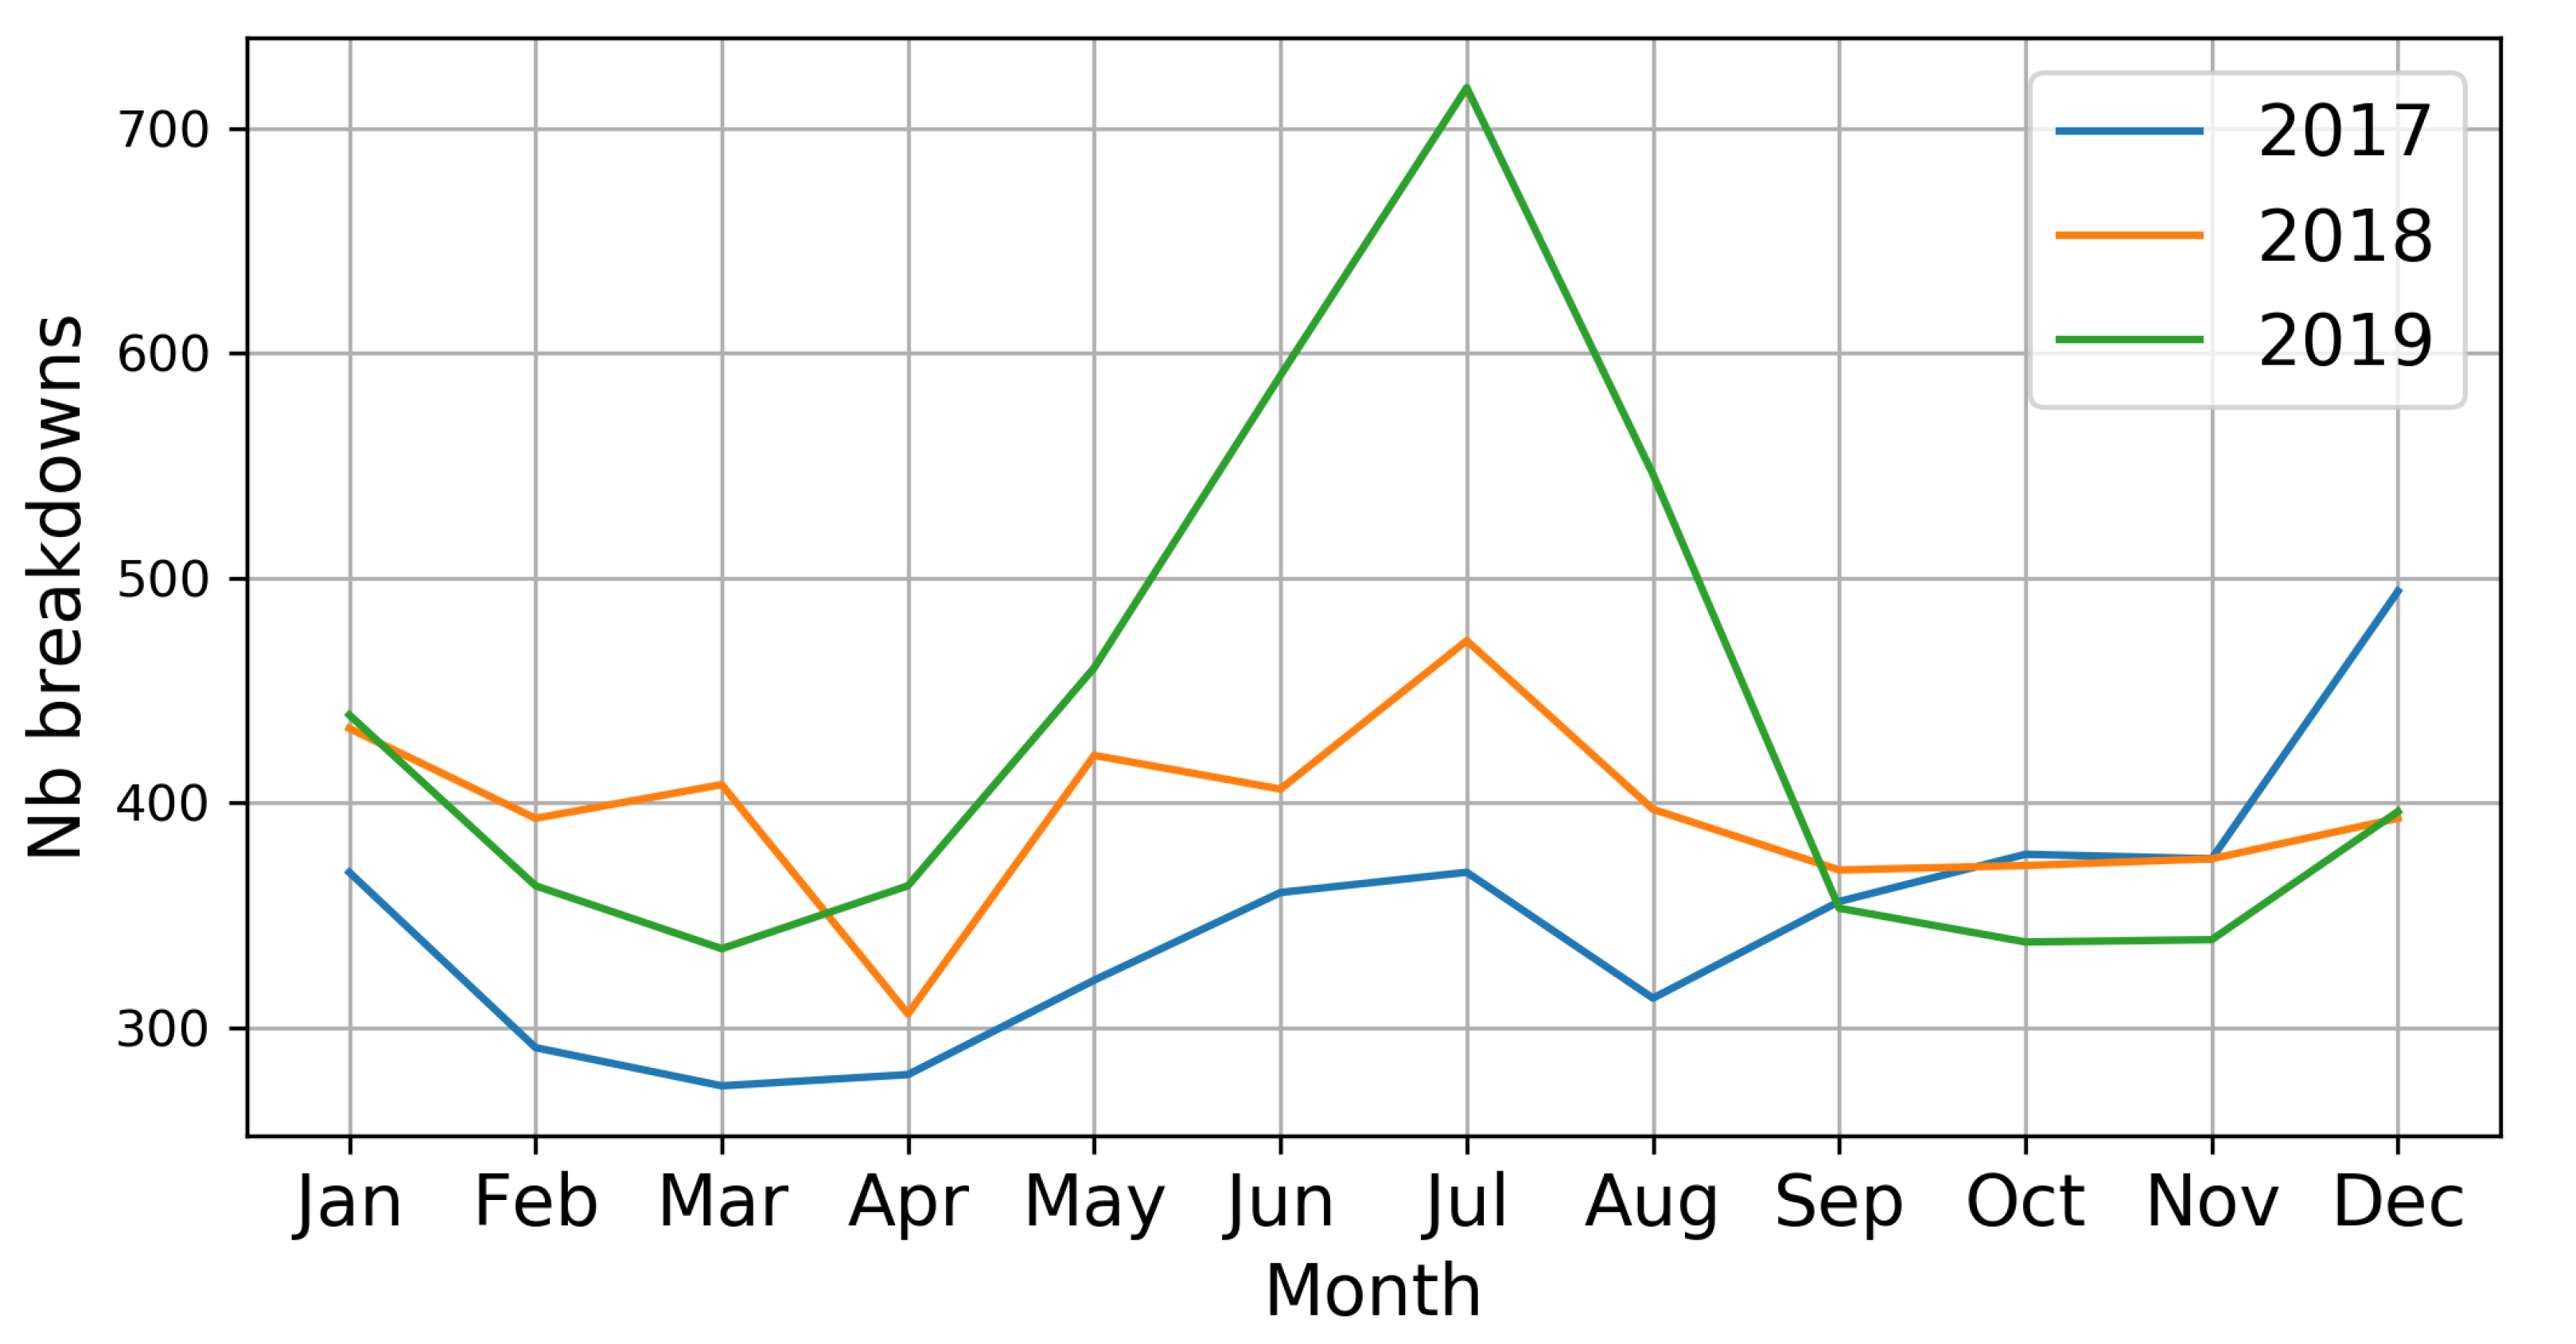
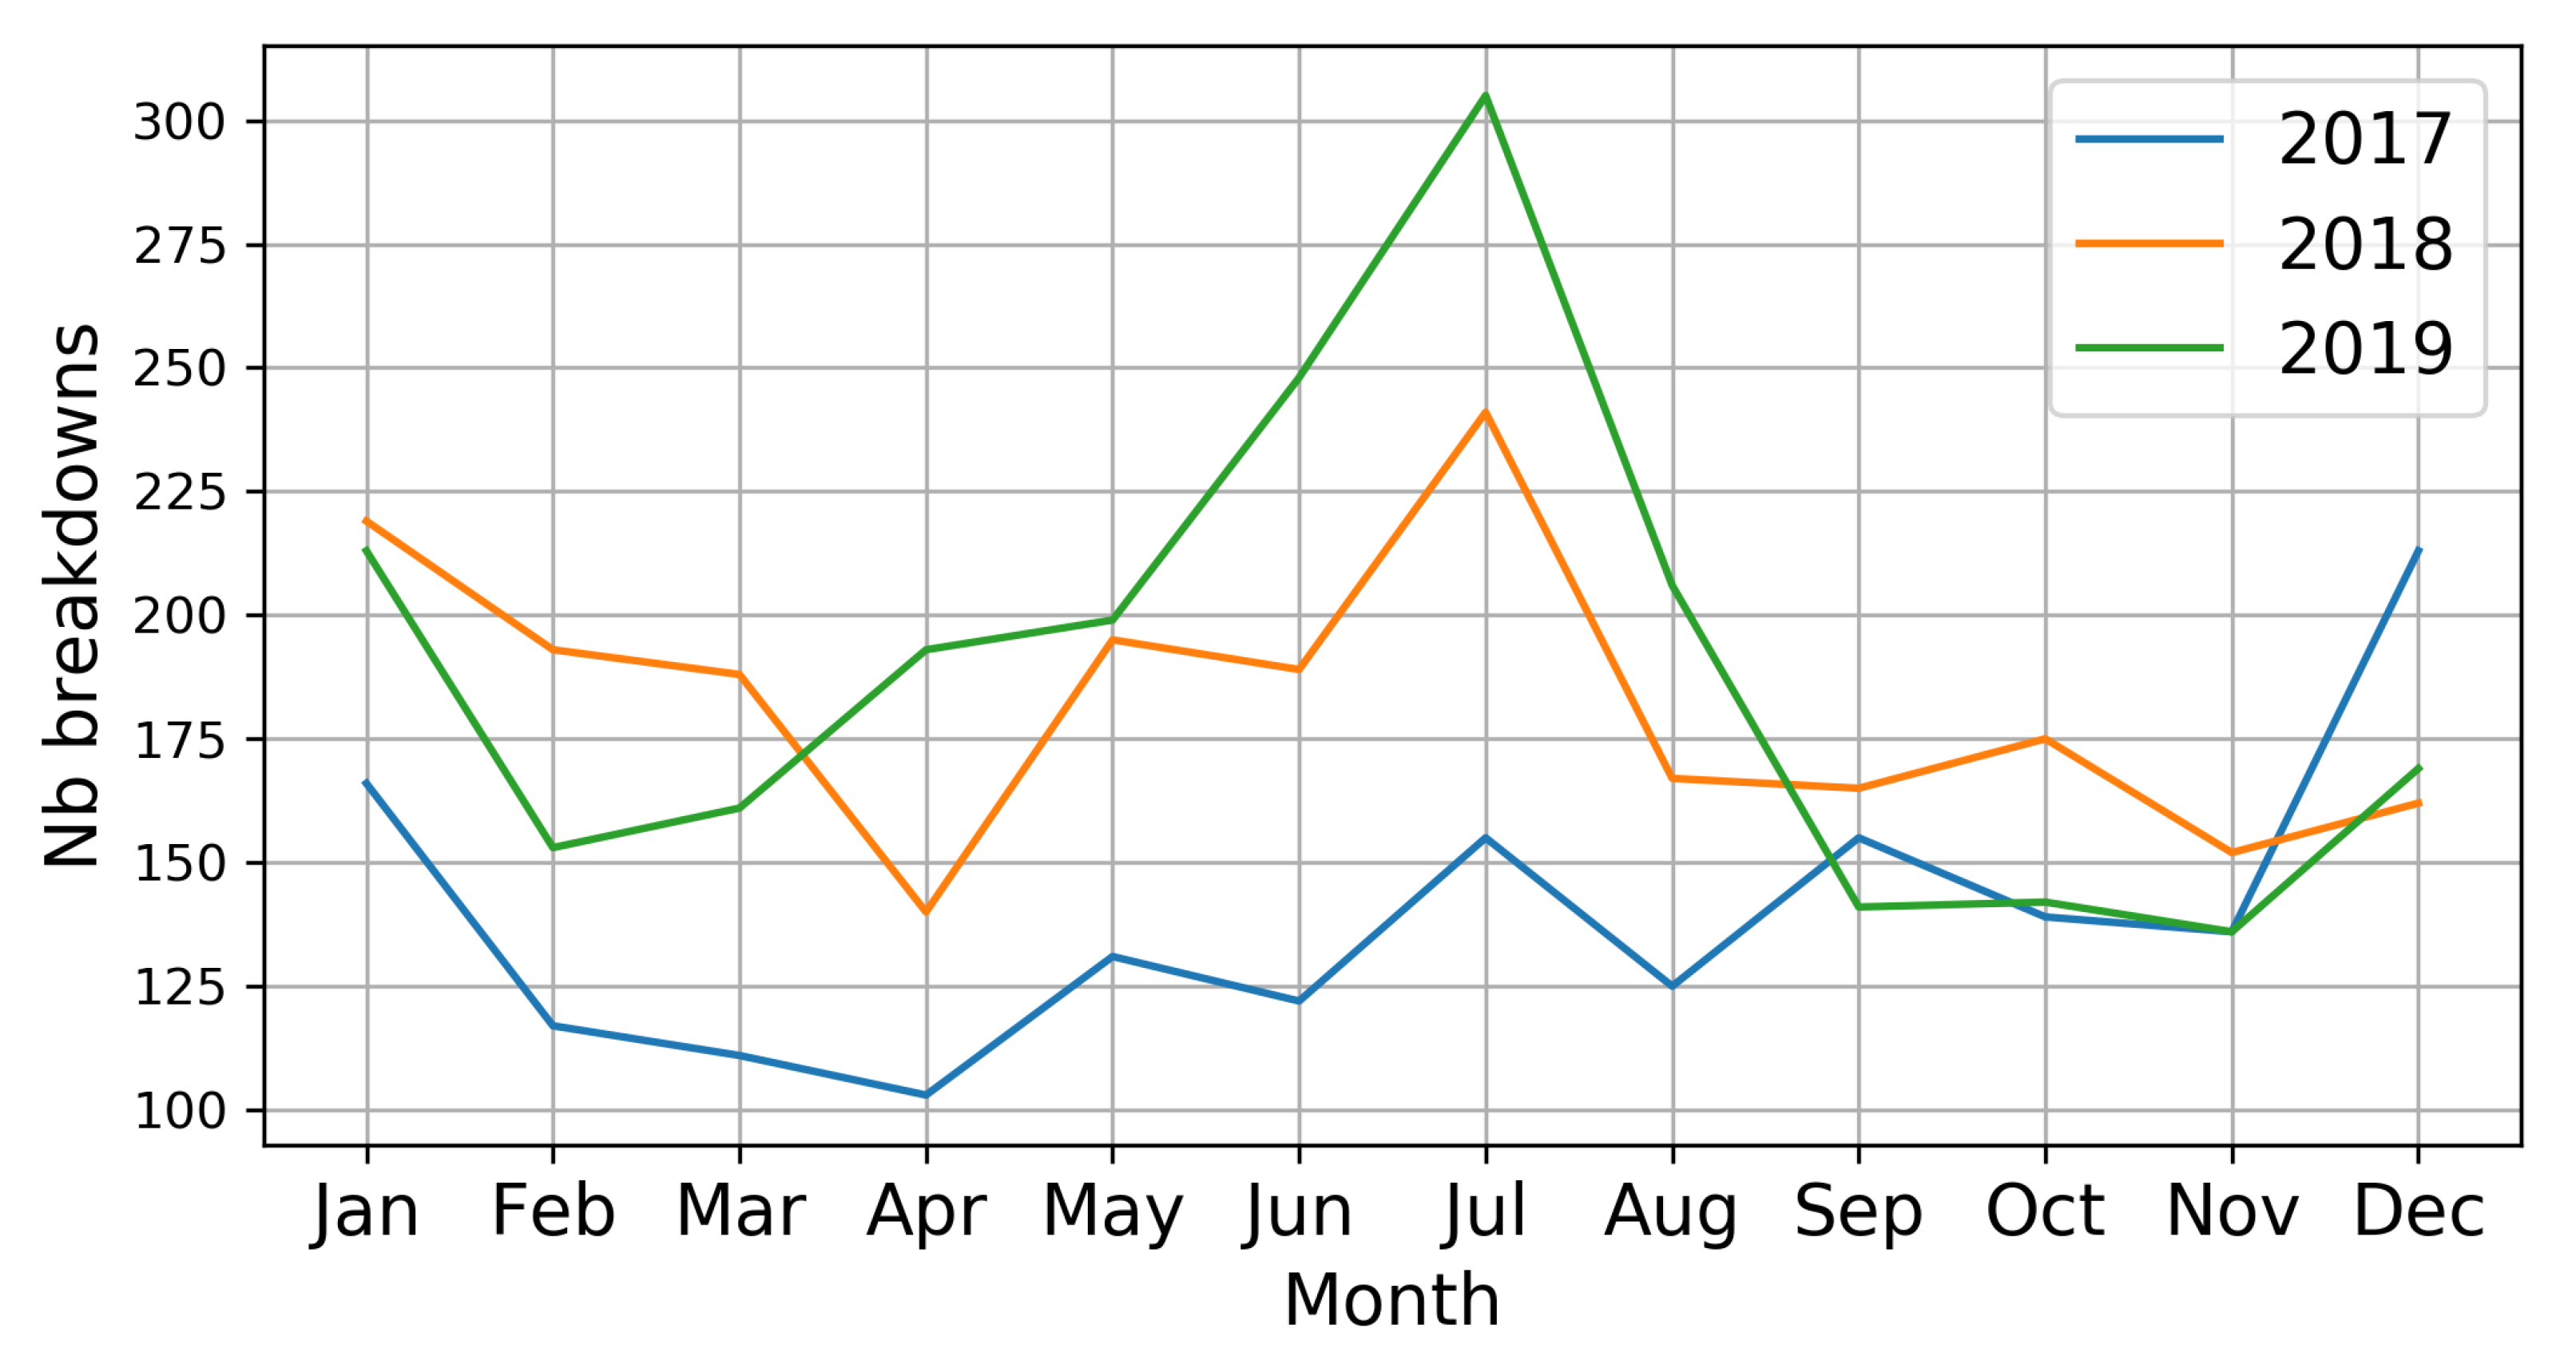
Figure 3 and Figure 4 show the number of disruptions of speed contract and of public service respectively for each month of the 3 years. Table 3 describes statistical information of the public service breakdowns over the 3 years, where Nb is the number of disruptions, Mean is the average of the disruptions and Std is the standard deviation. Figure 5 presents the causes of public service ruptures for each month of 2019. Figure 6 and Figure 7 show the Doubs map and the Rescue People and the Fire public service disruptions respectively, by sector of each adapted center for 2019.
As can be seen in Figure 3 and Figure 4, both show an increase in ruptures over the years. The number of breakdowns to the speed contract reaches a peak around 700, while public service breakdowns reach around 300, both in the year 2019. May, June, July, and August are the months with the most ruptures, mainly July; this is due to the fact that in this month are holidays in the region and there are less agents in the centers. Furthermore, being holidays also predisposes to have more interventions, since they are closely related to human activity, such as traffic accidents or drowning in swimming pools.
However, we will give priority to the analysis of public service ruptures in this study, as it allows us to better examine resource failures in the fire department. In Table 3, it can be seen that the highest number of breaks occurred in July 2019, followed by July 2018 and December 2017. Furthermore, there is an increment in the daily average of public service disruptions in the month of July from 5 to 9.83, almost double. Although the number of interventions (filtered) carried out in July were 2525, 2883, and 2193 for 2017, 2018, and 2019 respectively, and their daily averages were: 81.45, 93, and 70.74 for the 3 years in the same order and respectively, this shows that in July 2019 there were fewer interventions but more ruptures. It can be deduced the need to predict interventions and breakdowns in a given time horizon in order to establish strategies on the reorganization of resources.
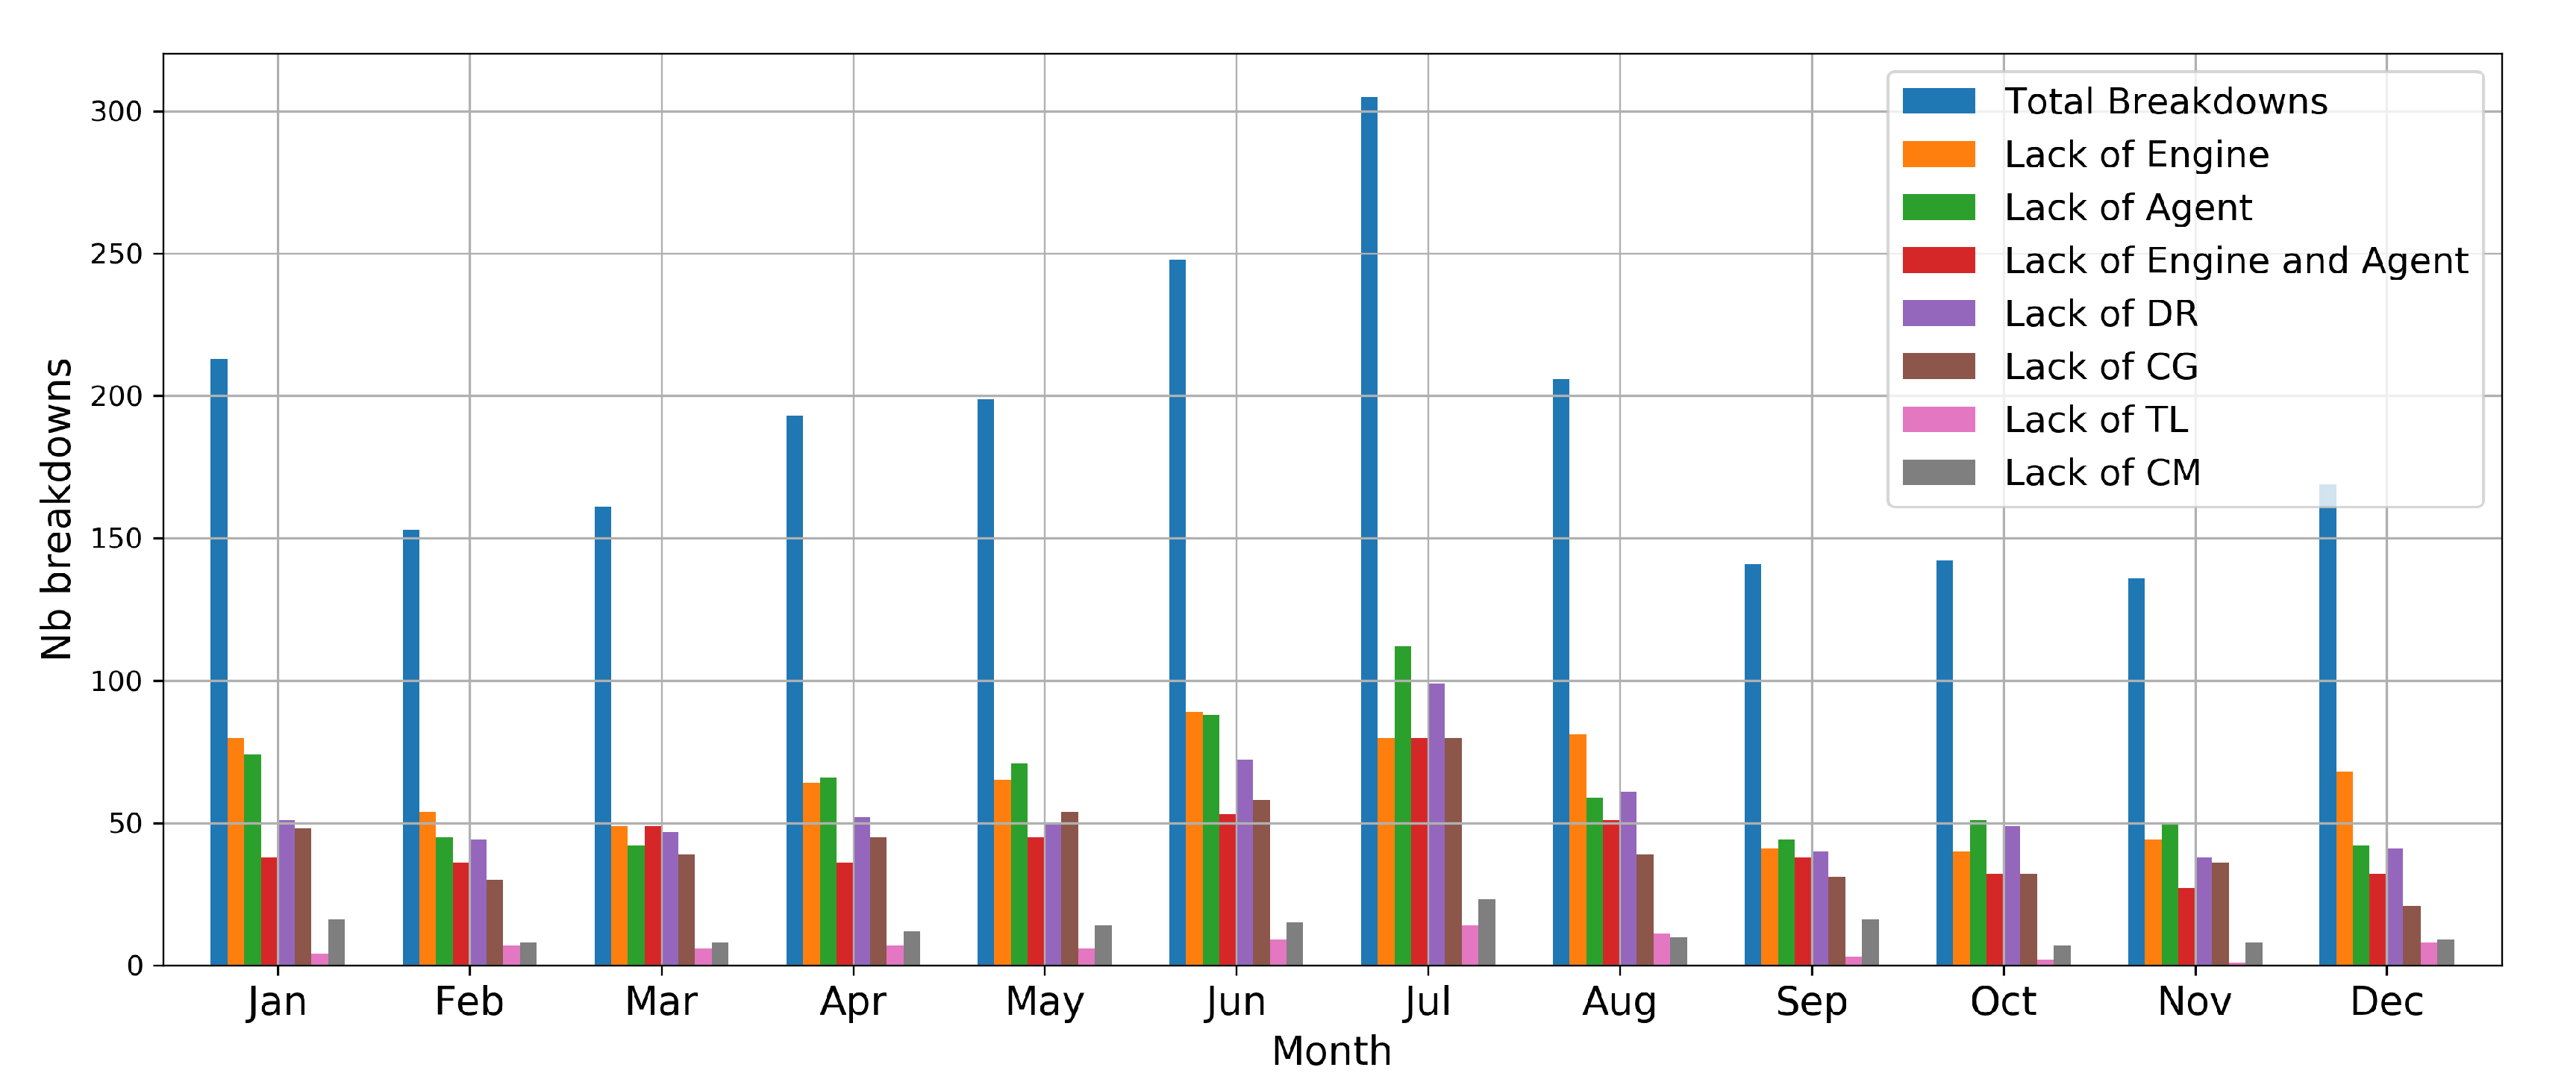
The flow chart used for the breakdown calculation also allows us to identify the causes of the service public breakdowns, since by answering “No, there is not an adapted engine available”, we go in depth and qualify according to availability, if it was due to the lack of engine, agents, or both. Furthermore, if it was due to the lack of agents, it is examined what type of skill was missing, the result is shown in Figure 5. Here, continuing with the month of July, more than 100 observed disruptions were due only to the absence of agents and approximately 80 due to the lack of vehicles and agents at the same time. Most of the breakdowns that did not present agents are due to the absence of the DR skill and to a lesser degree the TL skill. On the other hand, the months of January and June also show a high number of breakdowns, however the cause is due to the insufficiency of available engines.
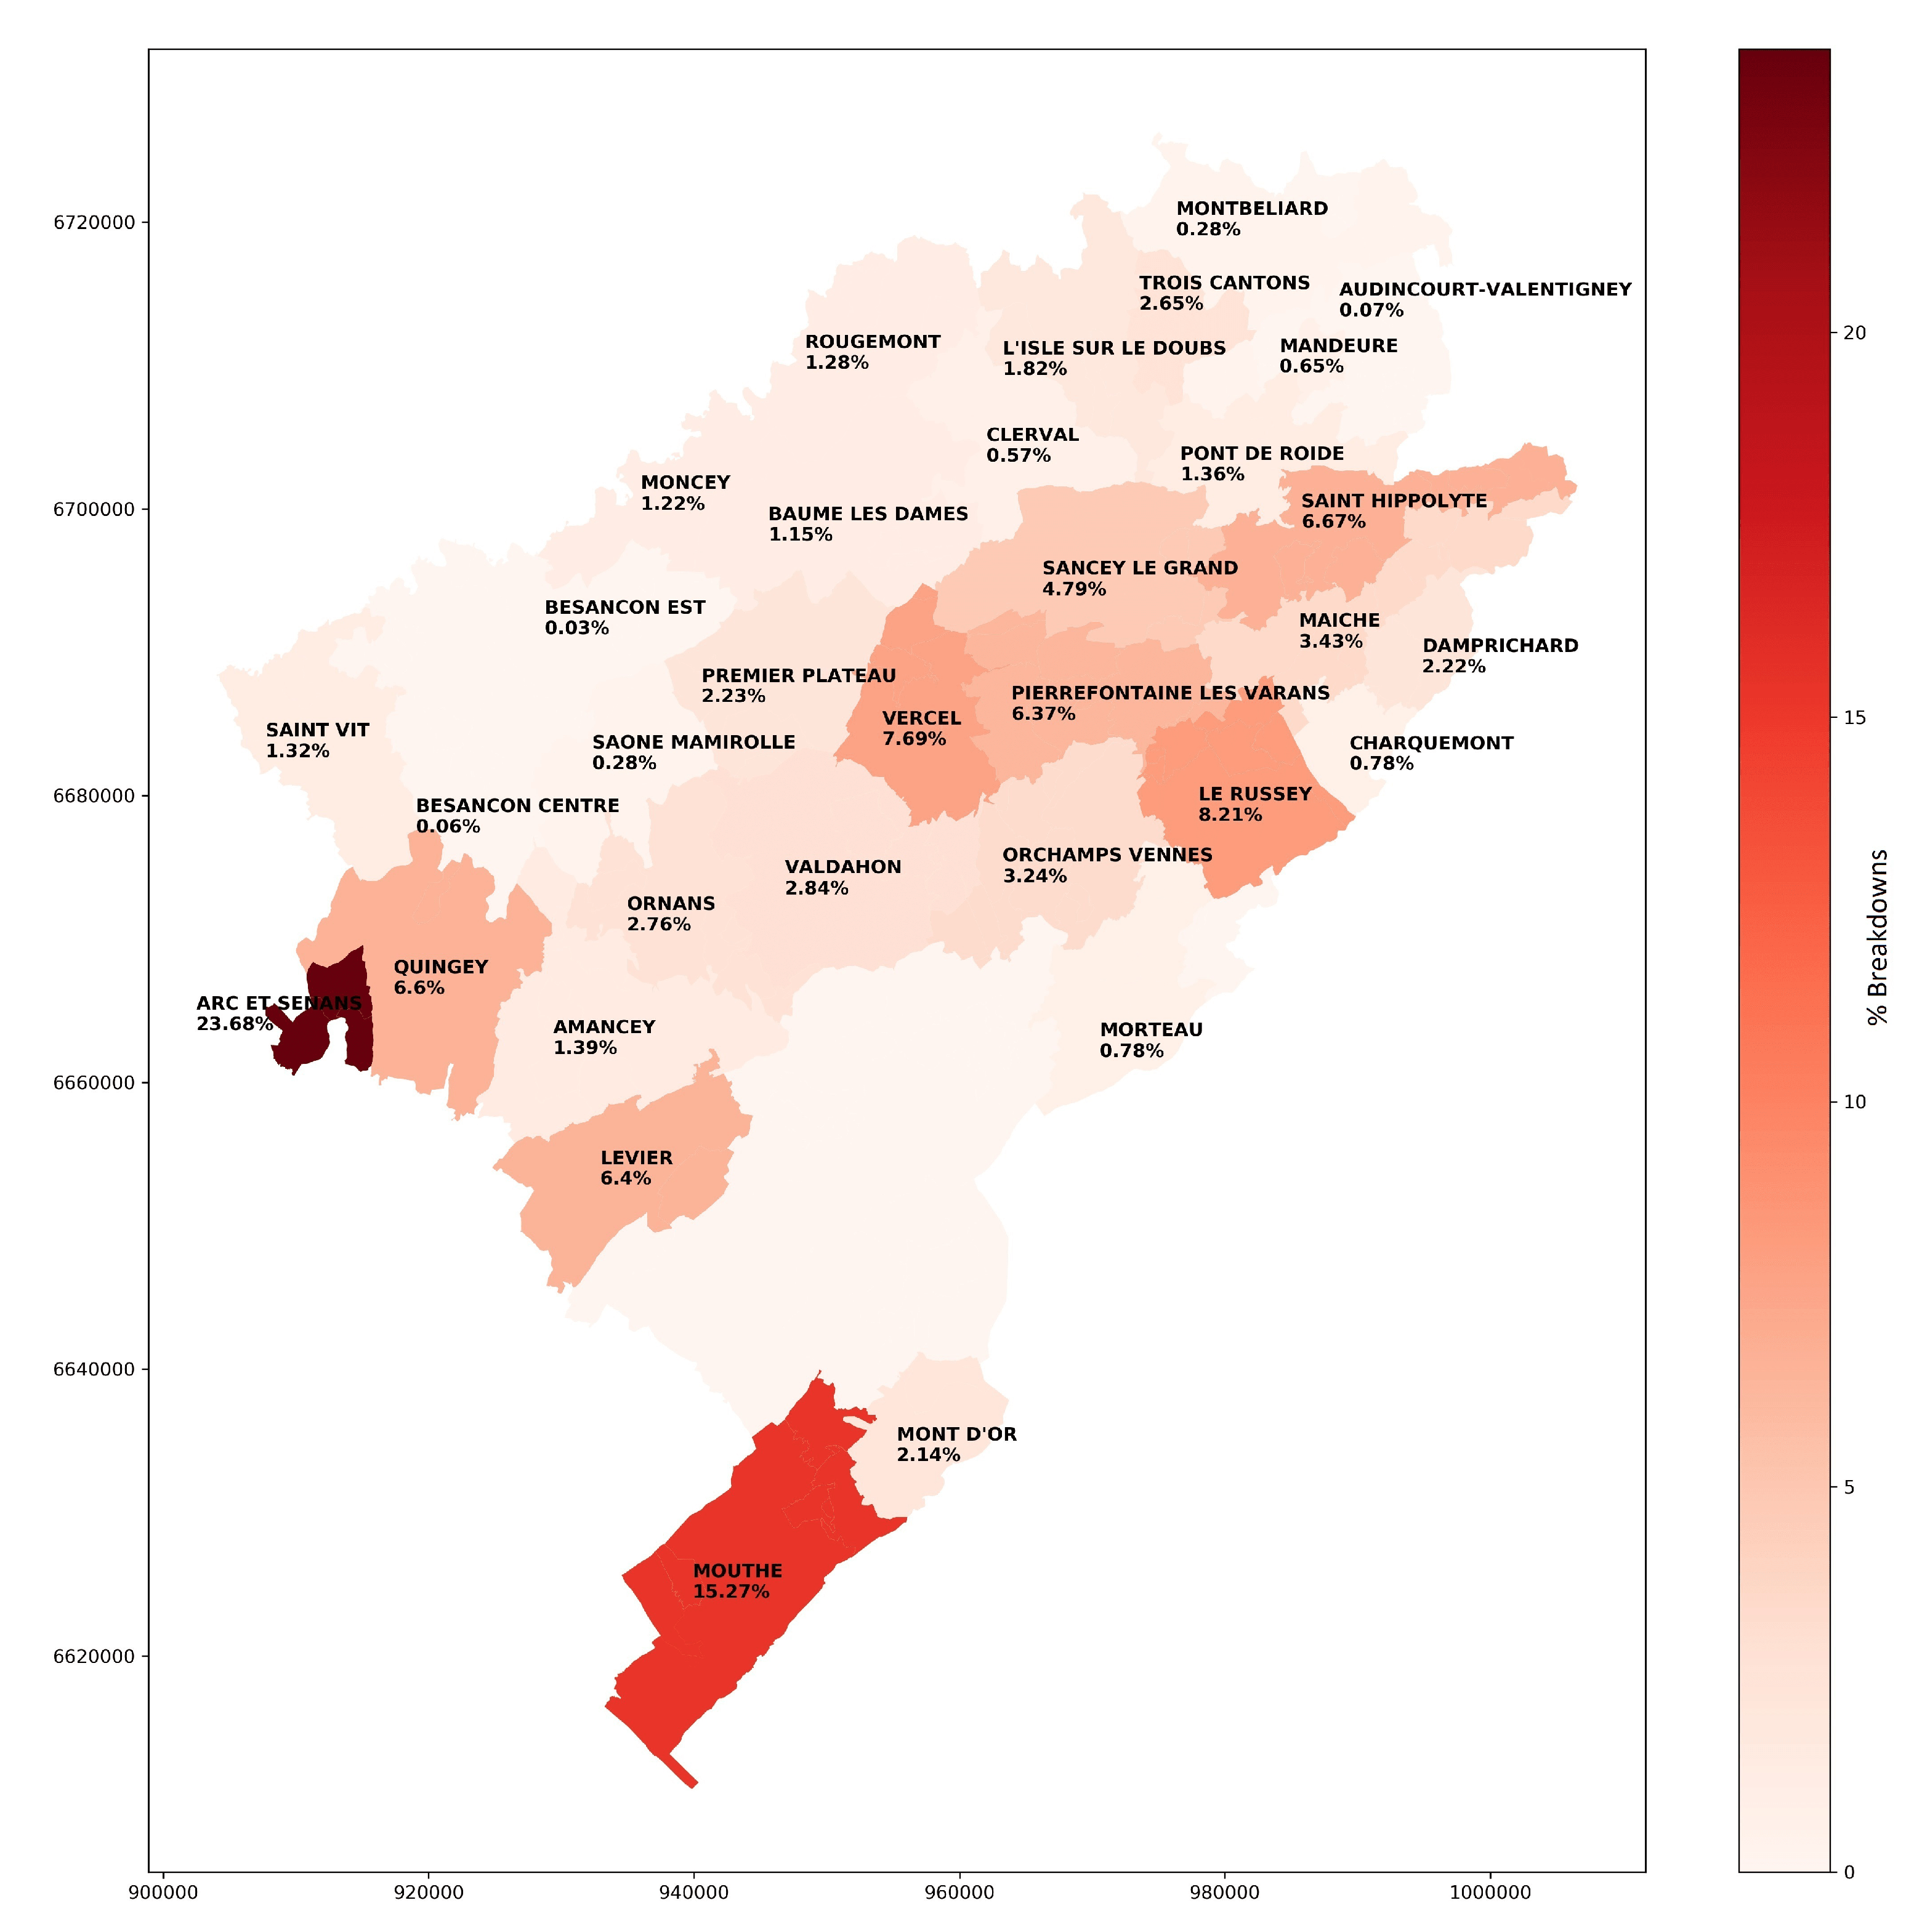
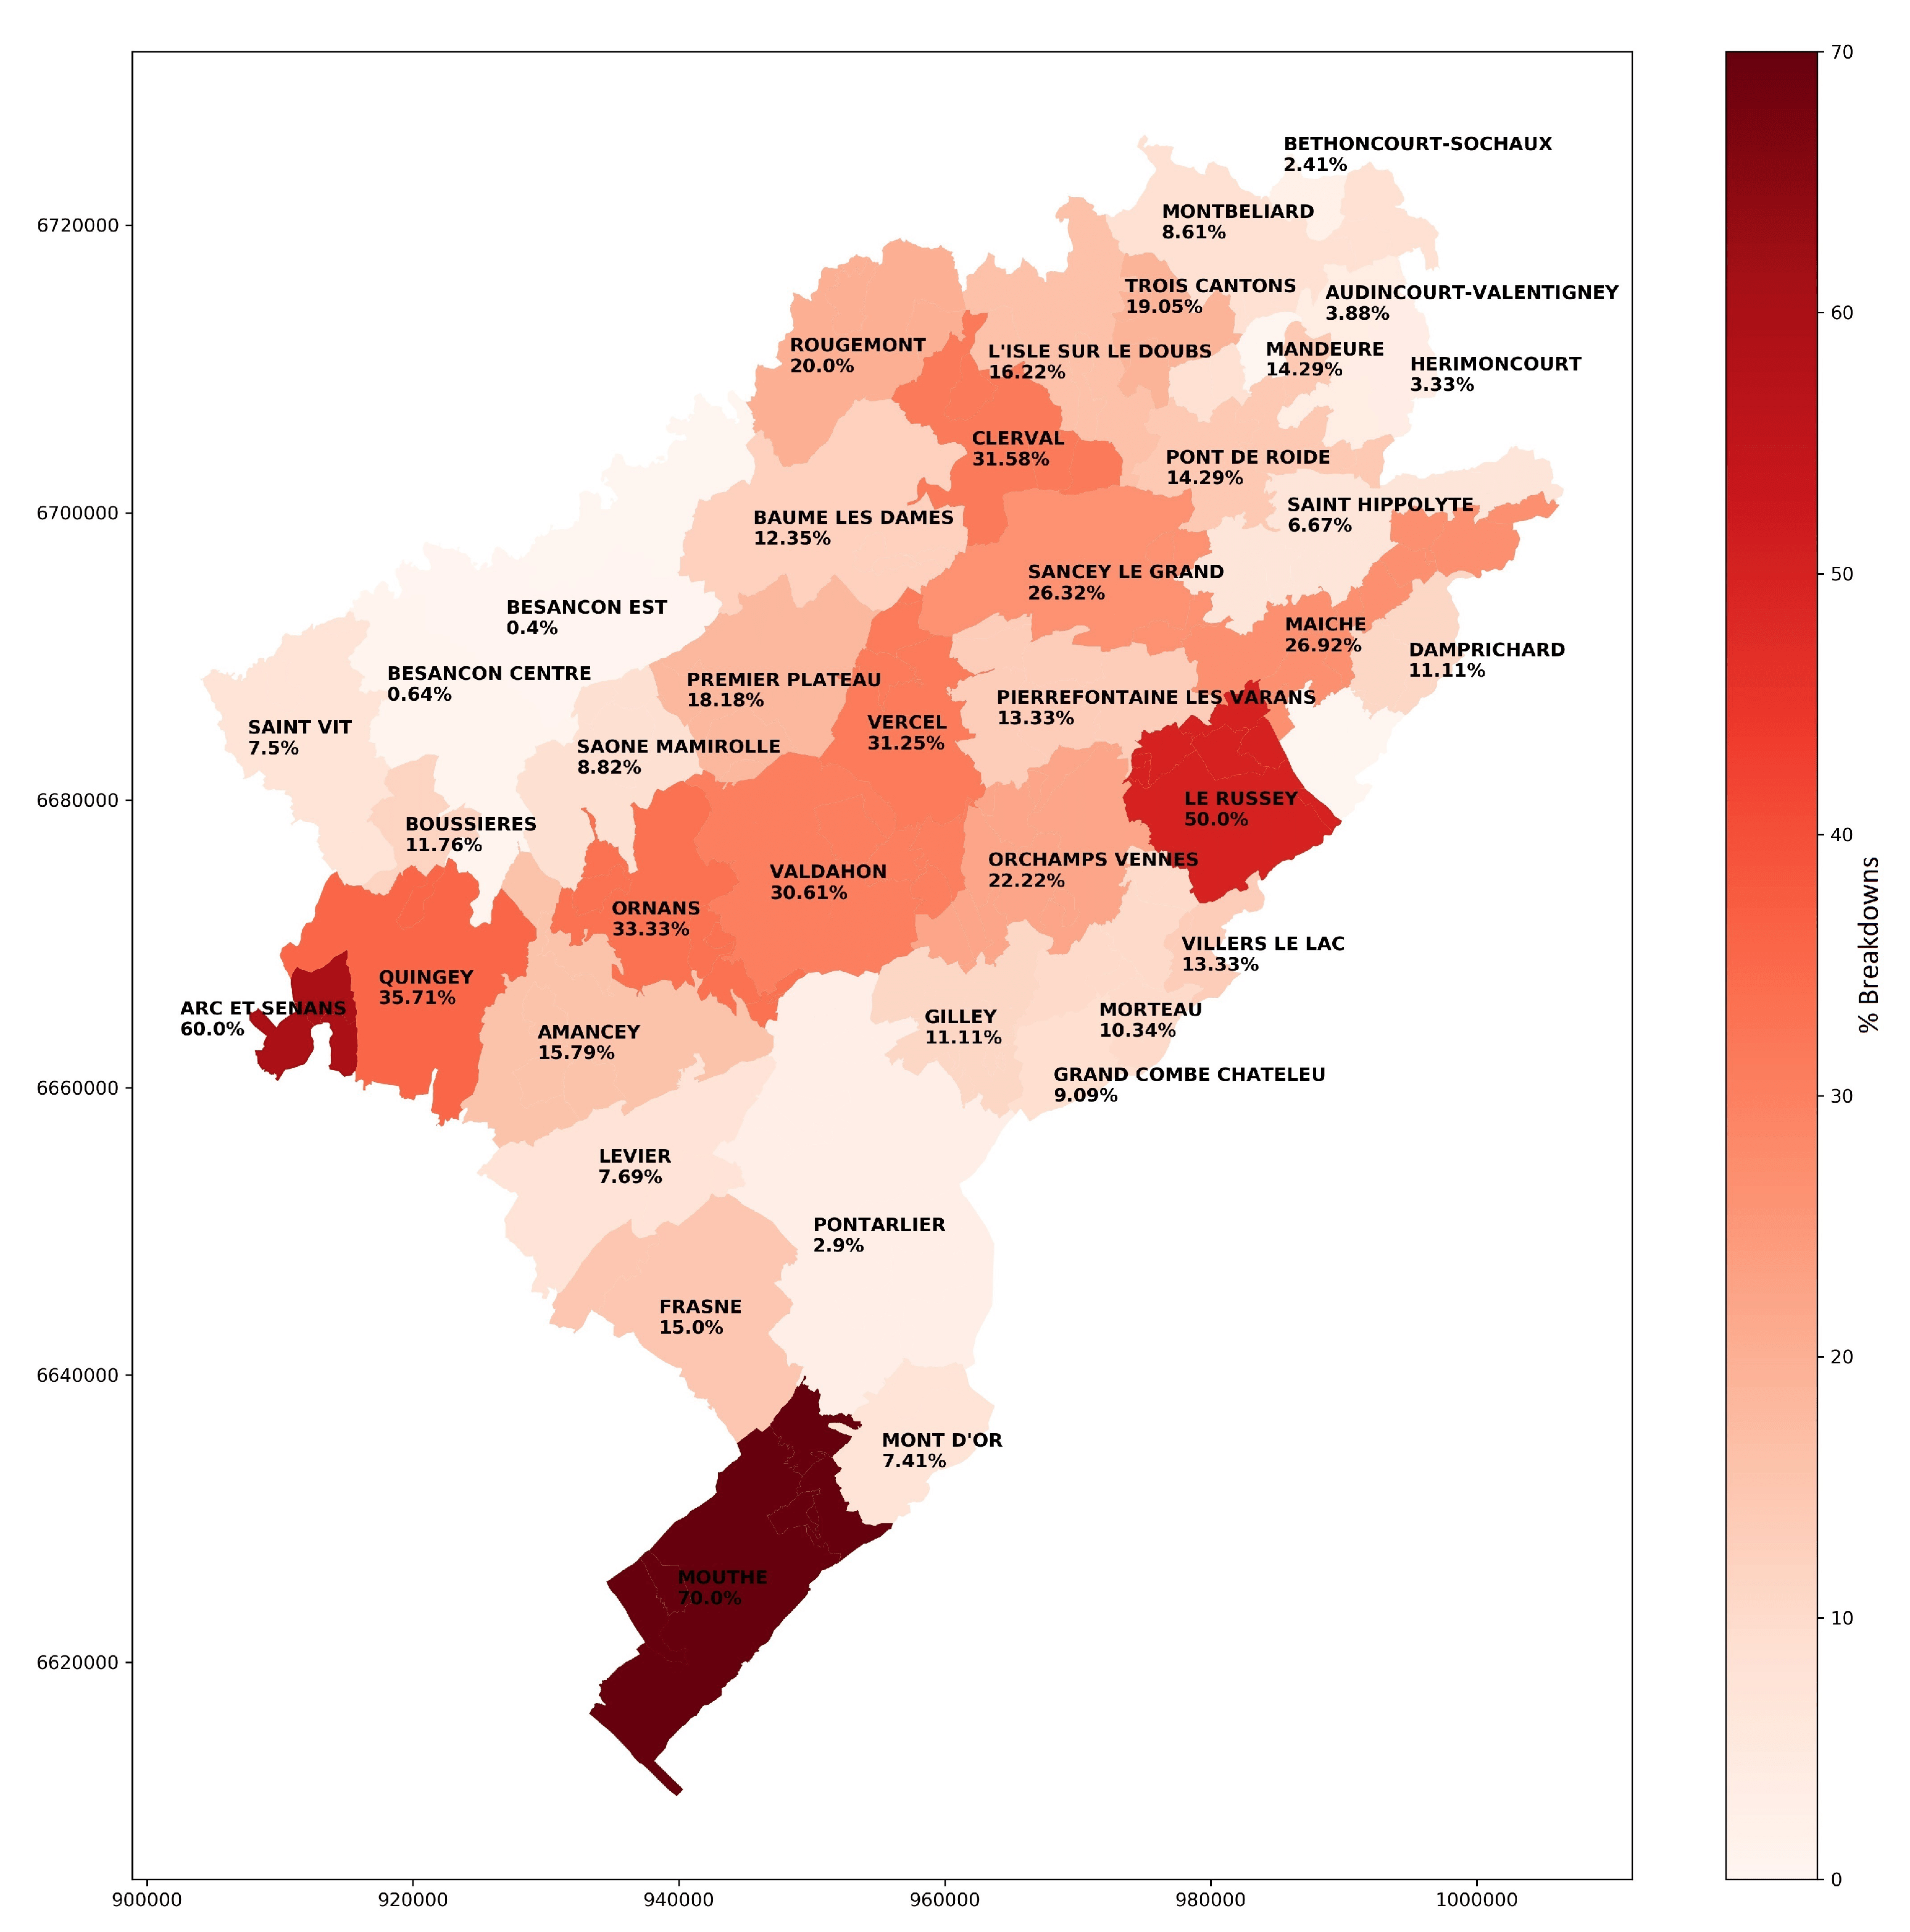
The visual representation given in Figure 6 and Figure 7 details the sectors concerned and their command centres throughout the Doubs department. The maps show a higher percentage of FR type ruptures compared to RP type ruptures. In both types, the sites most affected are Mouthe and Arc-Et-Senans. Likewise, the Le Russey site has more FR type ruptures than RP type ones. In this way, we can identify which areas have more breaks by type, the center in charge, and the type of resources most needed. Thus, we can make decisions to improve the arming capacity of each center and as a consequence increase their efficiency and minimize the risks faced by firefighters.
4.2. Results and Discussion of the Operational Breakdowns Prediction
In this section we describe and discuss the obtained results for the predictions of operational breaks of the type of public service. Table 4 shows the Root Mean Square Error (RMSE) and the Mean Absolut Error (MAE) metrics of the predictions made for each month of 2019 with each technique. In the last row the averages are calculated in general, this allows us to identify the technique with better results. Table 5 shows the configurations of the best models with the XGBoost technique for each month of 2019. Table 6 presents the RMSE and MAE metrics calculated based on standardized breakdowns with the Scikit-Learn MinMaxScaler method. Thus, it is possible to compare which month is presenting a poor model and analyze it. Figure 8 compares the daily predictions of public service breakdowns and the real number of them for each month in 2019.
In the search for a technique that best models our data, from Table 4, we deduce that our baseline model is surpassed by all the other 5 techniques. For each technique, the BO was configured with 300 initial points, 100 iterations and the exploration strategy called Upper Confidence Bound (UCB). Most of the best models for each month were built with the XGBoost technique, which obtained on average an RMSE of 2.5602 and MAE of 2.0240. The grid defined for BO applied to XGBoost used the bounds: max_depth between 1 and 10, learning_rate between 0.05 and 1, estimators between 50 and 500, subsample between 0.5 and 1, and colsample_bytree between 0.5 and 1. The best hyper-parameters achieved are described in Table 5, considering as objective function the regression with squared loss. In addition, the second best technique was MLP with an RMSE of 2.6804 and a MAE of 2.0791. Its grid for BO considered the following bounds: hidden_layer_sizes between 50 and 900 neurons, learning_rate_init between 0.0001 and 0.1, max_iter between 0.05 and 0.5, tol between 0.00001 and 0.01, momentum between 0.00001 and 0.01, alpha between 0.00001 and 0.01, and by default the activation function ReLu, solver Adam and learning_rate constant. If we look in more detail, May and September are better modeled with MLP, and the month of August with RF, since they have a lower RMSE. Of course, there is a need to experiment with other machine learning techniques.
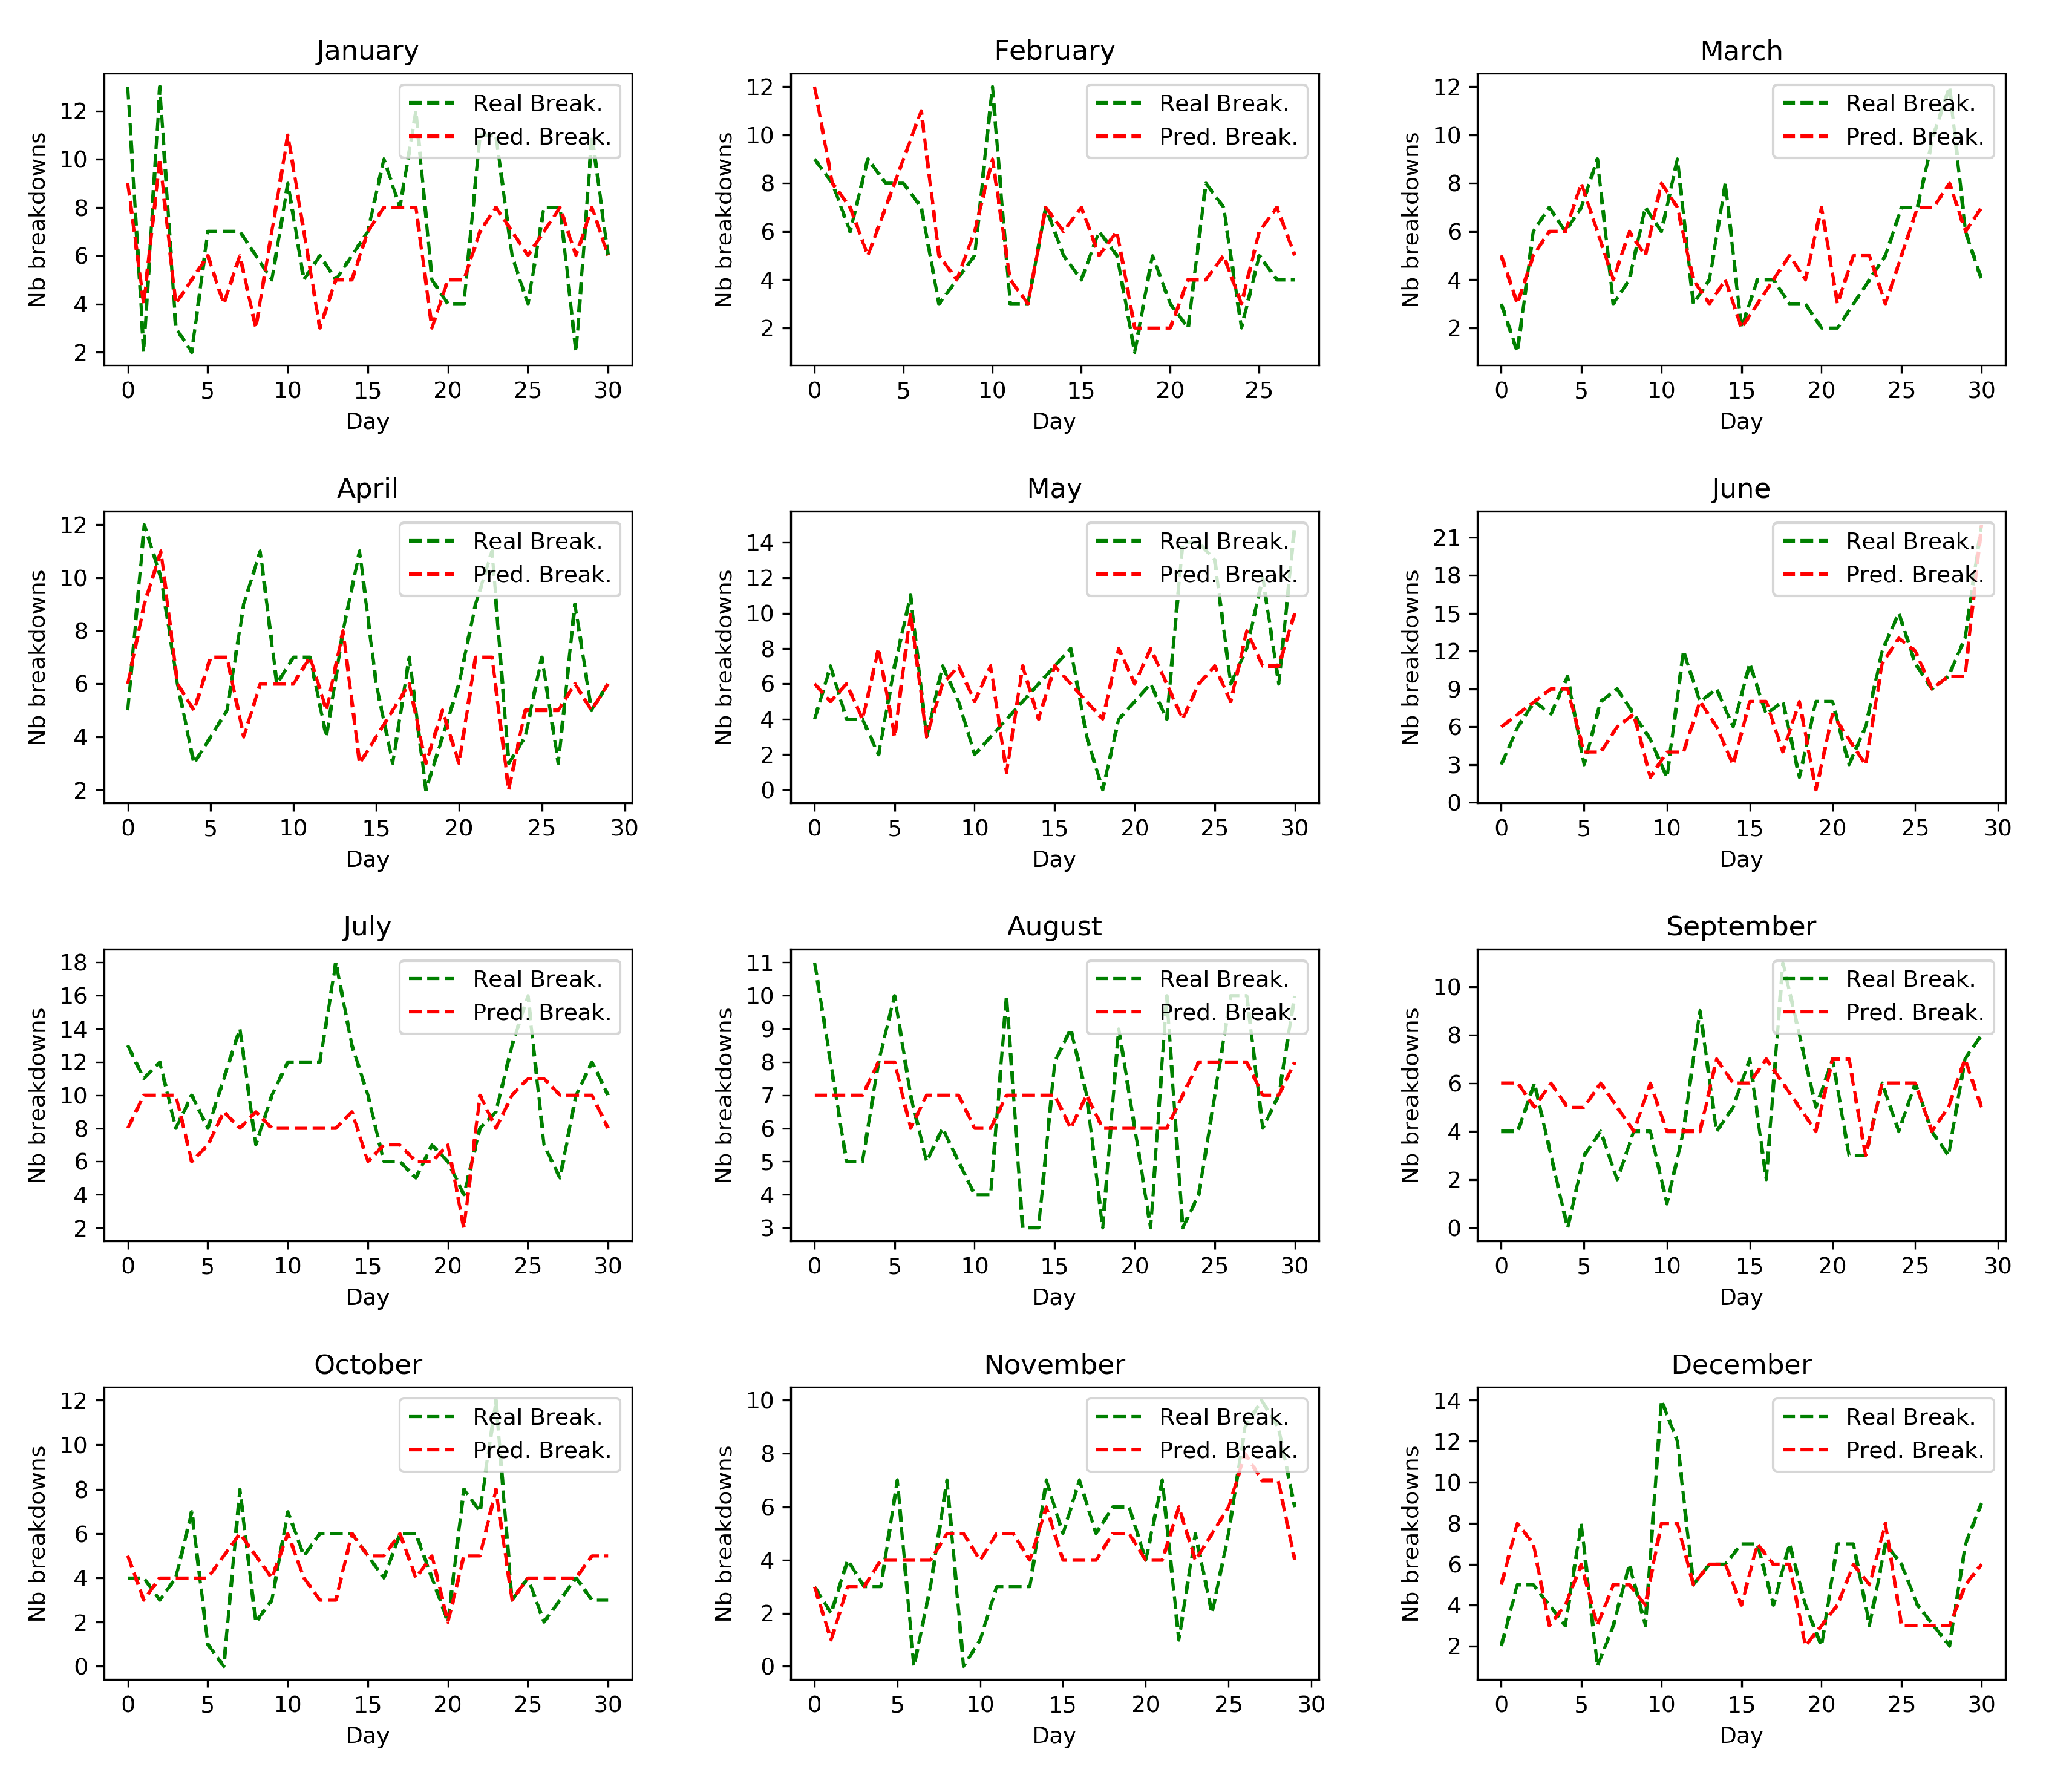
On the other hand, the models built with the best technique until now, which is XGBoost, for May, June and July have an RMSE greater than 3, which does not necessarily indicate that they are the months with the worst models. From Table 3, it is deduced that they are the 3 months with the highest standard deviation and this is reflected when visualizing the predictions in Figure 8, we observe that they are the months with the highest frequency of highest peaks. For this reason, and in order to compare our predictions between months, the breakdowns were standardized between 0 and 1. Using MinMaxScaler, the true breakdowns are fitted and the predicted disruptions are transformed according to the scale defined by the true ones, the results can be seen in Table 6. From Table 6, we conclude that actually the model for June is one of the best compared to the other months and this can be visually validated in Figure 8, as well as the month of August in which it is possible to see clearly an underfitting during the learning. Thus, we can identify the months that produce predictions with little precision and study them to know their causes, i.e., recognize which more internal and external variables should be added in the modeling process to improve the predictions. For this, it is necessary to analyze what events tend to occur on those dates in the region and in the fire department.
In this way, the forecast gives us a better view of possible future disruptions in the service of firefighters, in order to make more accurate decisions about the reorganization or acquisition of resources, depending mainly on the predicted number of interventions, the armament available in a certain time and the monthly period.
5. Conclusions
This study deals with the prediction of operational disruptions per month, more specifically public service breakdowns, with the main objective of knowing the future possible failures in the organization’s efficiency and being able to counteract them by developing strategies that optimize the allocation of human and material resources. For the breakdowns calculation, a methodology was developed that allowed the establishment of indicators of the type of rupture and the level of rupture. At the same time, a mathematical model was built to optimize the search for an adapted armament available in a given center and time, taking into consideration the necessary skills of one agent per adapted engine. Consequently, it was possible to identify the causes of the breakdowns, whether it was due to an insufficient number of engines or to a lack of agents and their skills in handling an engine.
We selected the public service ruptures to make the predictions since by their definition they represent the consequences of the temporary state of the resources assigned in each centre. Although these historical data of calculated public service ruptures are small for the moment, we built prediction models for each month including external variables such as meteorological, epidemiological, traffic, among others; and internal variables such as the number of engines and agents available per day, as well as the number of interventions, considering that these will be provided by another prediction model that is being worked on, as can be found in [2,12,13]. The technique that provided the best results was XGBoost, followed by MLP.
Thus, it is possible to recognize the sectors and their command centers with the highest number of failures by type of intervention. In fact, in practice, this would allow the centers to be strengthened so that they are prepared for any disaster in any area. For instance, in urbanized areas, fire centers have more armament, but there are delays in arriving at the scene, which may be due to traffic, lack of available armament, or perhaps the poorly location of the centers; and in rural areas, centers are smaller and have few or no professional firefighters and the same with the adapted engines since incidents are fewer but not absent. The indicators would help to define the increase or decrease in the number of engines according to the RP or FR intervention that occurs most in the sector of a center; increasing the number of professional firefighters (defined schedule) or volunteers (dynamic working hours); or perhaps there are enough firefighters but they do not have the necessary training to face the interventions, for example, FR interventions require six or four firefighters depending on the engine, while a RP intervention requires three. Besides, to drive an FR engine, it is needed a license different than the RP engine license. On the other hand, the prediction of breakdowns reinforces the strategies developed, since it considers the workload that will be carried out in the coming days together with the organization of the armament currently available. In this way, the resources could be reorganized in some sectors without the need to acquire new ones, the response with an adapted armament to an incident would be more effective and immediate, the victims would be attended to as soon as possible, the damaged areas and material losses would be reduced, maximizing the economic benefits, and not only the security and the welfare of the population would be guaranteed, but also firefighters would be protected against the risks of interventions.
For future work, there is much to develop and test. For example, creating artificial data using methods such as Adaptive Synthetic Sampling Method (ADASYN) and making predictions of breakdowns by center; making forecasts using time series techniques; testing other time horizons for data aggregation; as well as developing methodologies that recommend strategies for the organization or acquisition of vehicles and firefighters, for instance by combining meta-heuristics or using Bayesian optimization. Finally, adapt the breakdown calculation algorithm for other fire departments in France and in the world.
Author Contributions
Conceptualization, G.R., C.C., G.P. and S.C.; Methodology, G.R., C.C. and S.C.; Software, S.C. and C.G.; Validation, C.C., G.P. and S.C.; Formal Analysis, C.C. and S.C.; Investigation, G.R., C.C. and S.C.; Resources, G.R., C.C. and G.P.; Writing—Original Draft Preparation, S.C. and C.G.; Visualization, C.C. and S.C.; Supervision, G.R. and C.G. All authors have read and agreed to the published version of the manuscript.
Funding
This research received no external funding.
Acknowledgments
This work was funded by SDIS du Doubs, with the support of the French Ministry of Higher Education and Research (managed by the National Association of Research and Technology (ANRT) for the CIFRE thesis (N 2019/0372).
Conflicts of Interest
The authors declare no conflict of interest.
References
- Cerna, S.; Guyeux, C.; Arcolezi, H.H.; Couturier, R.; Royer, G. A Comparison of LSTM and XGBoost for Predicting Firemen Interventions. In Trends and Innovations in Information Systems and Technologies; Springer International Publishing: Cham, Switzerland, 2020; pp. 424–434. [Google Scholar] [CrossRef]
- Couchot, J.F.; Guyeux, C.; Royer, G. Anonymously forecasting the number and nature of firefighting operations. In Proceedings of the 23rd International Database Applications & Engineering Symposium on—IDEAS19, Athens, Greece, 10–12 June 2019; ACM Press: New York, NY, USA, 2019. [Google Scholar] [CrossRef]
- Guyeux, C.; Nicod, J.M.; Varnier, C.; Masry, Z.A.; Zerhouny, N.; Omri, N.; Royer, G. Firemen Prediction by Using Neural Networks: A Real Case Study. In Advances in Intelligent Systems and Computing; Springer International Publishing: Cham, Switzerland, 2019; pp. 541–552. [Google Scholar] [CrossRef]
- Lan, C.H.; Chuang, L.L.; Chen, Y.F. Performance efficiency and resource allocation strategy for fire department with the stochastic consideration. Int. J. Technol. Policy Manag. 2009, 9, 296. [Google Scholar] [CrossRef] [Green Version]
- Morello, T.F.; Ramos, R.M.; Anderson, L.O.; Owen, N.; Rosan, T.M.; Steil, L. Predicting fires for policy making: Improving accuracy of fire brigade allocation in the Brazilian Amazon. Ecol. Econ. 2020, 169, 106501. [Google Scholar] [CrossRef]
- Bjarnason, R.; Tadepalli, P.; Fern, A.; Niedner, C. Simulation-based Optimization of Resource Placement and Emergency Response. In Proceedings of the IAAI, Pasadena, CA, USA, 14–16 July 2009. [Google Scholar]
- Dibene, J.C.; Maldonado, Y.; Vera, C.; de Oliveira, M.; Trujillo, L.; Schütze, O. Optimizing the location of ambulances in Tijuana, Mexico. Comput. Biol. Med. 2017, 80, 107–115. [Google Scholar] [CrossRef] [PubMed]
- Carvalho, A.; Captivo, M.; Marques, I. Integrating the ambulance dispatching and relocation problems to maximize system’s preparedness. Eur. J. Oper. Res. 2020, 283, 1064–1080. [Google Scholar] [CrossRef]
- Lin, A.X.; Ho, A.F.W.; Cheong, K.H.; Li, Z.; Cai, W.; Chee, M.L.; Ng, Y.Y.; Xiao, X.; Ong, M.E.H. Leveraging Machine Learning Techniques and Engineering of Multi-Nature Features for National Daily Regional Ambulance Demand Prediction. Int. J. Environ. Res. Public Health 2020, 17, 4179. [Google Scholar] [CrossRef]
- Fiorucci, P.; Gaetani, F.; Minciardi, R.; Sacil, R.; Trasforini, E. Dynamic resource allocation for forest fire risk management. In Proceedings of the 15th International Workshop on Database and Expert Systems Applications, Zaragoza, Spain, 30 August–3 September 2004; IEEE: Piscataway, NJ, USA, 2004. [Google Scholar] [CrossRef]
- Zhou, S.; Erdogan, A. A spatial optimization model for resource allocation for wildfire suppression and resident evacuation. Comput. Ind. Eng. 2019, 138, 106101. [Google Scholar] [CrossRef]
- Cerna, S.; Guyeux, C.; Arcolezi, H.H.; Lotufo, A.D.P.; Couturier, R.; Royer, G. Long Short-Term Memory for Predicting Firemen Interventions. In Proceedings of the 6th International Conference on Control, Decision and Information Technologies (CoDIT 2019), Paris, France, 23–26 April 2019. [Google Scholar] [CrossRef] [Green Version]
- Cerna, S.; Guyeux, C.; Arcolezi, H.H.; Royer, G. Boosting Methods for Predicting Firemen Interventions. In Proceedings of the 2020 11th International Conference on Information and Communication Systems (ICICS), Bangkok, Thailand, 15–16 December 2020; pp. 001–006. [Google Scholar]
- Arcolezi, H.H.; Couchot, J.F.; Cerna, S.; Guyeux, C.; Royer, G.; Al Bouna, B.; Xiao, X. Forecasting the Number of Firefighters Interventions per Region with Local-Differential-Privacy-Based Data. Comput. Secur. 2020, 96, 101888. [Google Scholar] [CrossRef]
- Beal, L.; Hill, D.; Martin, R.; Hedengren, J. GEKKO Optimization Suite. Processes 2018, 6, 106. [Google Scholar] [CrossRef] [Green Version]
- Météo-France. Données Publiques. Available online: https://donneespubliques.meteofrance.fr/?fond=produit&id_produit=90&id_rubrique=32 (accessed on 2 July 2020).
- Sentinelles. Le Réseau Sentinelles. Available online: https://www.sentiweb.fr/?page=table (accessed on 2 July 2020).
- Bison-Futé. Les Prévisions de Trafic. Available online: https://www.bison-fute.gouv.fr (accessed on 2 July 2020).
- Rhodes, B. Skyfield: High precision research-grade positions for planets and Earth satellites generator. arXiv 2019, arXiv:1907.024. [Google Scholar]
- Pedregosa, F.; Varoquaux, G.; Gramfort, A.; Michel, V.; Thirion, B.; Grisel, O.; Blondel, M.; Prettenhofer, P.; Weiss, R.; Dubourg, V.; et al. Scikit-learn: Machine Learning in Python. J. Mach. Learn. Res. 2011, 12, 2825–2830. [Google Scholar]
- Chen, T.; Guestrin, C. XGBoost: A Scalable Tree Boosting System. In Proceedings of the 22nd KDD ’16 ACM SIGKDD International Conference on Knowledge Discovery and Data Mining, San Francisco, CA, USA, 13–17 August 2016; ACM: New York, NY, USA, 2016; pp. 785–794. [Google Scholar] [CrossRef] [Green Version]
- Graves, A. Supervised Sequence Labelling with Recurrent Neural Networks; Springer: Berlin/Heidelberg, Germany, 2012. [Google Scholar]
- Kingma, D.P.; Ba, J. Adam: A Method for Stochastic Optimization. arXiv 2014, arXiv:1412.6980. [Google Scholar]
- Karabatsos, G. Fast Marginal Likelihood Estimation of the Ridge Parameter(s) in Ridge Regression and Generalized Ridge Regression for Big Data. arXiv 2014, arXiv:1409.2437. [Google Scholar]
- Bishop, C.M. Pattern Recognition and Machine Learning (Information Science and Statistics); Springer: Berlin/Heidelberg, Germany, 2006. [Google Scholar]
- Chang, C.C.; Lin, C.J. LIBSVM. ACM Trans. Intell. Syst. Technol. 2011, 2, 1–27. [Google Scholar] [CrossRef]
- Breiman, L. Random Forests. Mach. Learn. 2001, 45, 5–32. [Google Scholar] [CrossRef] [Green Version]
- Wu, J.; Chen, X.; Zhang, H.; dong Xiong, L.; Lei, H.; Deng, S. Hyperparameter Optimization for Machine Learning Models Based on Bayesian Optimization. J. Electron. Sci. Technol. 2019, 17, 26–40. [Google Scholar]
- Shahriari, B.; Swersky, K.; Wang, Z.; Adams, R.P.; de Freitas, N. Taking the Human Out of the Loop: A Review of Bayesian Optimization. Proc. IEEE 2016, 104, 148–175. [Google Scholar] [CrossRef] [Green Version]
- Nogueira, F. Bayesian Optimization: Open Source Constrained Global Optimization Tool for Python. 2014. Available online: https://github.com/fmfn/BayesianOptimization (accessed on 2 July 2020).
Figure 1.
Breakage calculation overview. In blue, it shows the interventions that will be processed; in green, the historical records of geographical and administrative variables; and in red, the interventions that resulted in breakdowns.
Figure 1.
Breakage calculation overview. In blue, it shows the interventions that will be processed; in green, the historical records of geographical and administrative variables; and in red, the interventions that resulted in breakdowns.
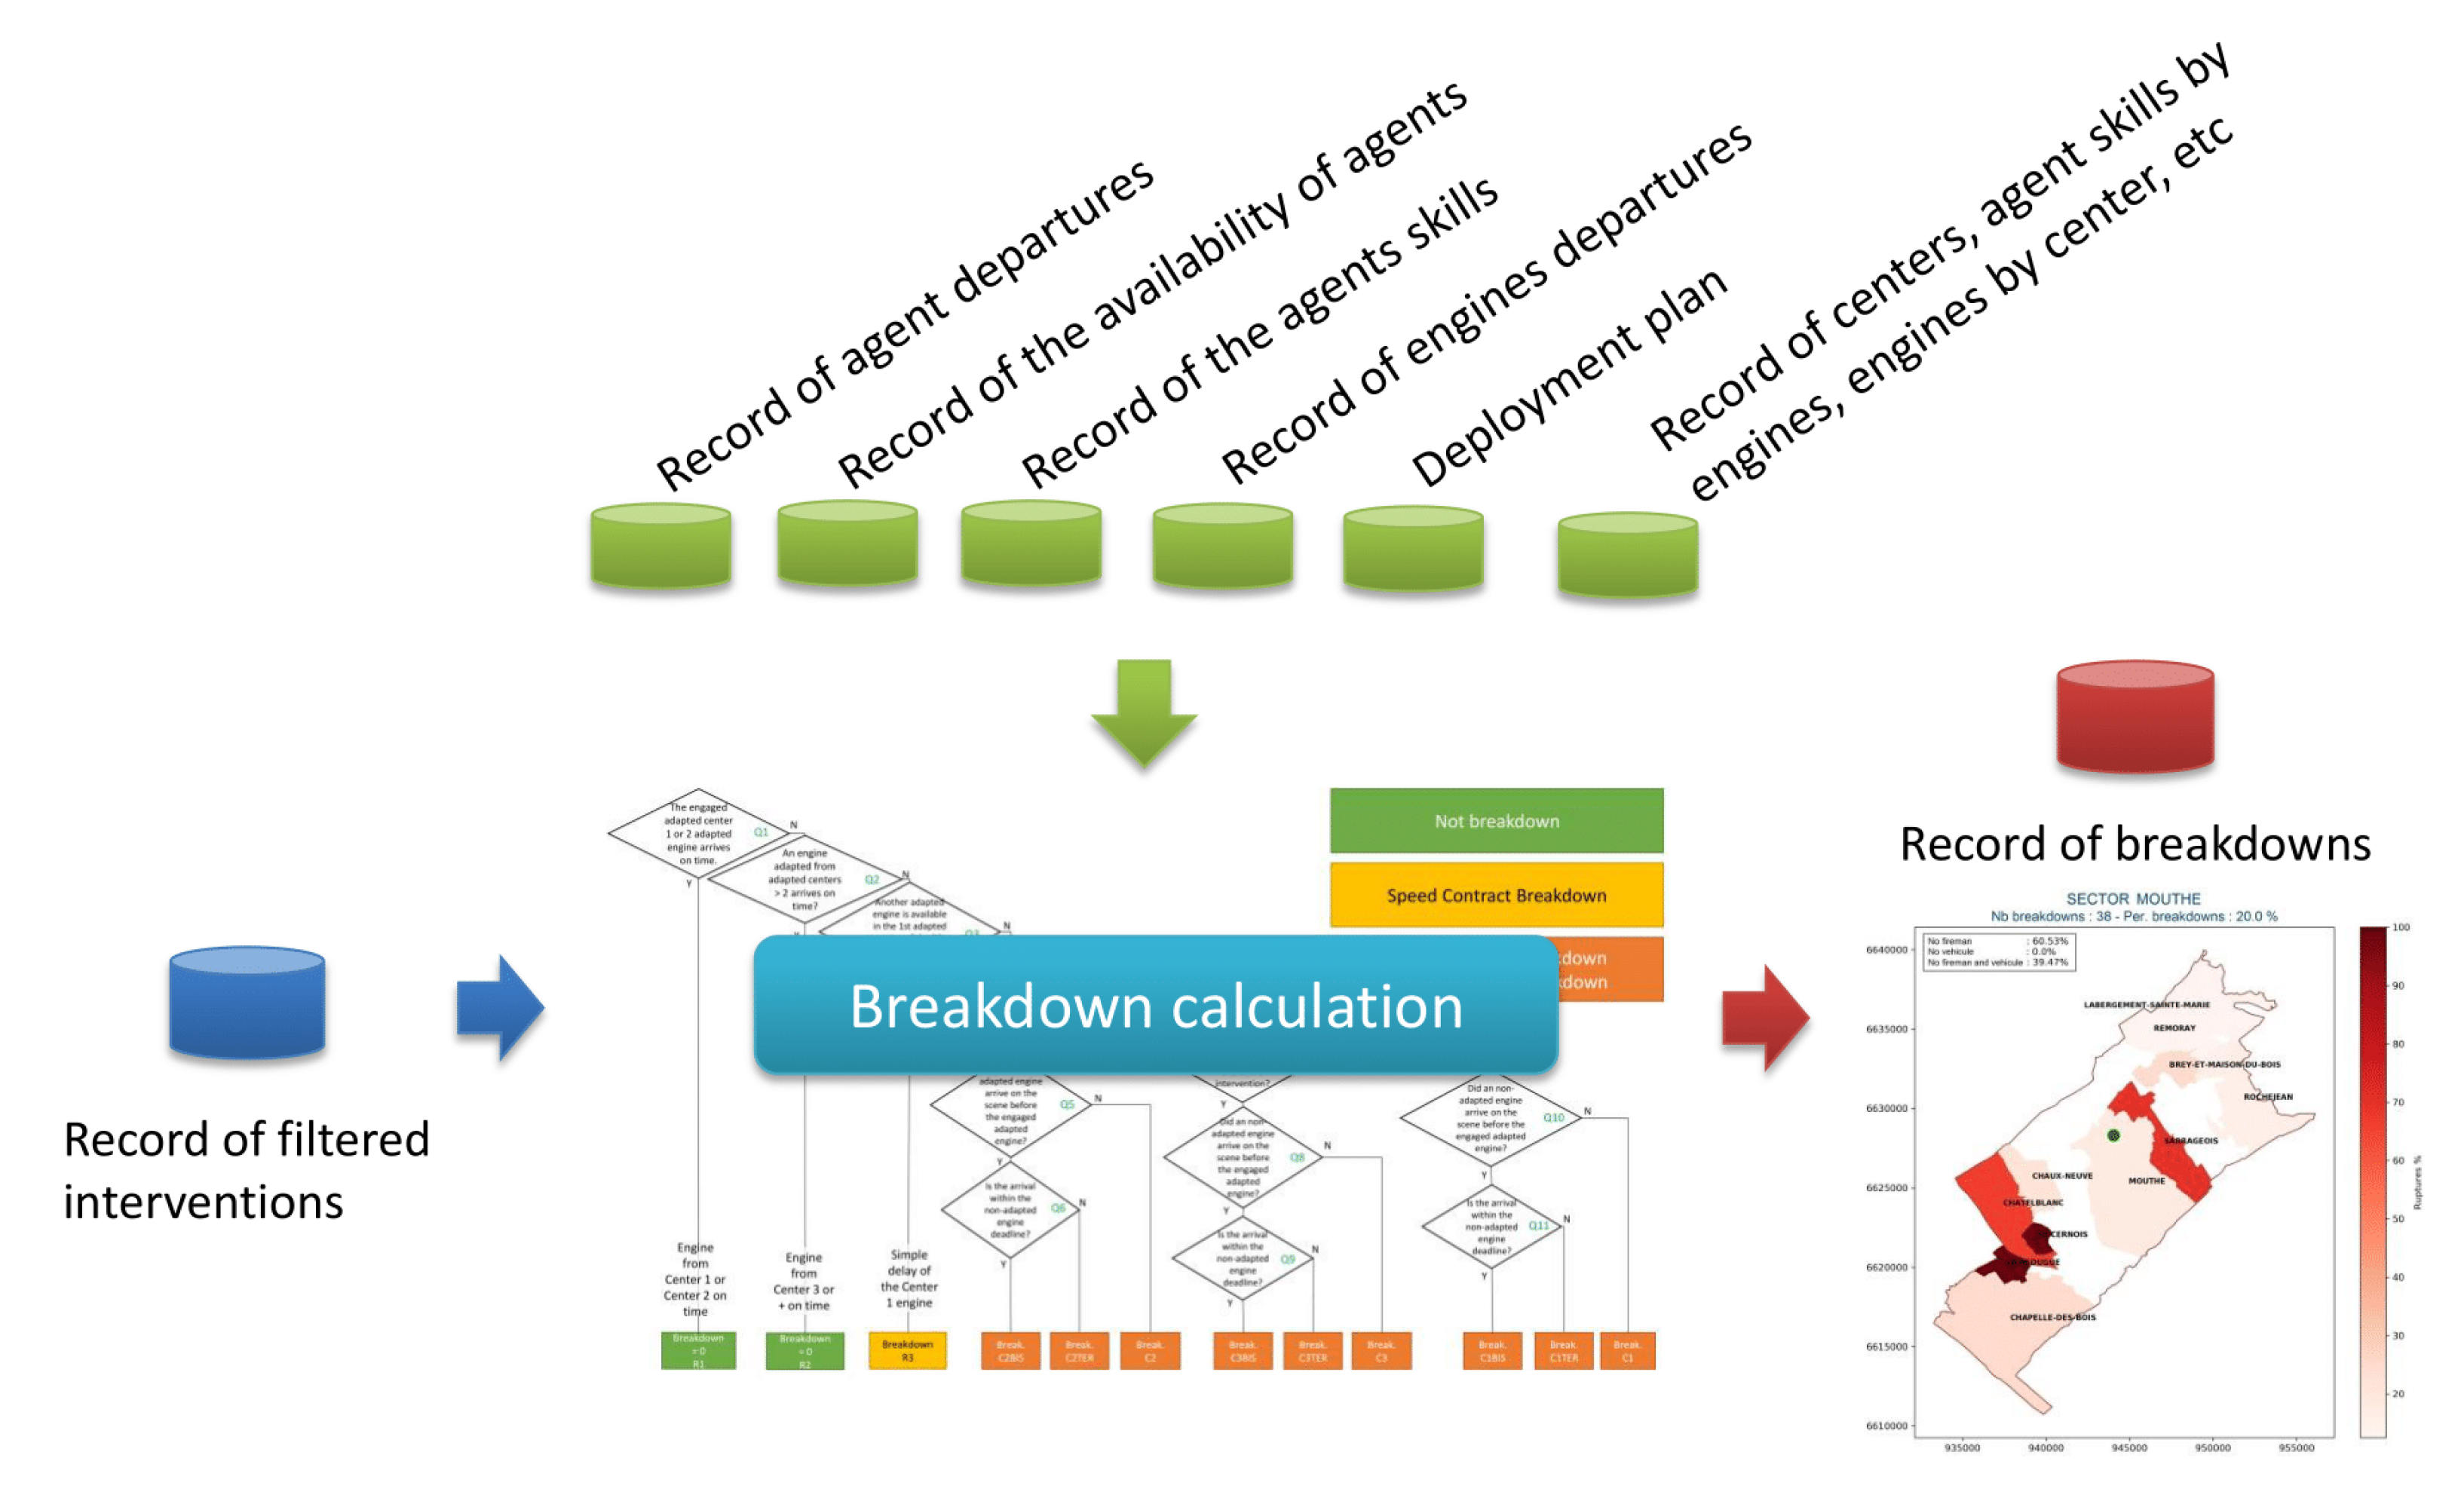
Figure 2.
Breakdown calculation. It shows the process by which the breakage level of an intervention is calculated, where the answers at each level can be Y = yes, N = no.
Figure 2.
Breakdown calculation. It shows the process by which the breakage level of an intervention is calculated, where the answers at each level can be Y = yes, N = no.

Figure 3.
Speed contract breakdowns 2017–2019.

Figure 4.
Public service breakdowns 2017–2019.

Figure 5.
Public service breakdowns by month in 2019.

Figure 6.
Map of Doubs 2019—Public service breakdowns of rescue people type by sector.

Figure 7.
Map of Doubs 2019—Public service breakdowns of fire type by sector.

Figure 8.
Predictions of public service breakdowns using the best XGBoost model by month for 2019.


Table 1.
List of abbreviations and acronyms used in the present paper.
| Category | Abbreviation/Acronym | Definition |
|---|---|---|
| Analysis metrics | Nb | Number of Breakdowns |
| Std | Standard Deviation | |
| Engines | AE | Adapted Engine |
| NAE | Non-Adapted Engine | |
| Engine for RP | RVAV | Rescue and Victim Assistance Vehicle |
| Evaluation metrics | MAE | Mean Absolute Error |
| RMSE | Root Mean Squared Error | |
| Files | DP | Deployment Plan |
| Fireman skills | CG | Chief Guard |
| CM | Crew Member | |
| DR | Driver | |
| TL | Team Leader | |
| Techniques for modeling | AdaBoost | Adaptive Boosting |
| Adam | Adaptive Moment Estimation | |
| BO | Bayesian Optimization | |
| BRR | Bayesian Ridge Regression | |
| DEA | Data Envelopment Analysis | |
| DSM | Double Standard Model | |
| GESA | Group-number Efficiency Scale Approach | |
| MLP | Multilayer Perceptron | |
| ReLu | Rectified Linear Unit | |
| RF | Random Forest | |
| SVM | Support Vector Machine | |
| UCB | Upper Confidence Bound | |
| XGBoost | Extreme Gradient Boosting | |
| Types of interventions | FR | Fire |
| RP | Rescue People | |
| Zones | Z1 | Zone 1, Urban |
| Z2 | Zone 2, Semi-urban | |
| Z3 | Zone 3, Rural |
Table 2.
Defined time delay limit for a NAE and an AE according to the target area.
| Zone | Non-Adapted Engine | Adapted Engine | |
|---|---|---|---|
| Without Non-Adapted Engine | With Non-Adapted Engine | ||
| Z1 | 10 | 10 | 10 |
| Z2 | 20 | 20 | 25 |
| Z3 | 20 | 20 | 25 |
Table 3.
Statistical information on public service breakdowns by month from 2017 to 2019.
| Month | 2017 | 2018 | 2019 | ||||||
|---|---|---|---|---|---|---|---|---|---|
| Nb | Mean | Std | Nb | Mean | Std | Nb | Mean | Std | |
| January | 166 | 5.3548 | 2.9789 | 219 | 7.0645 | 4.0475 | 213 | 6.8710 | 3.1082 |
| February | 117 | 4.1786 | 1.5823 | 193 | 6.8928 | 2.7299 | 153 | 5.4643 | 2.5282 |
| March | 111 | 3.5806 | 1.9472 | 188 | 6.0645 | 3.6450 | 161 | 5.1935 | 2.6079 |
| April | 103 | 3.4333 | 1.9610 | 140 | 4.6667 | 2.4267 | 193 | 6.4333 | 2.7530 |
| May | 131 | 4.2258 | 2.4978 | 195 | 6.2903 | 2.5927 | 199 | 6.4194 | 3.7996 |
| June | 122 | 4.0667 | 2.3228 | 189 | 6.3000 | 3.2470 | 248 | 8.2667 | 4.0819 |
| July | 155 | 5.0000 | 2.9621 | 241 | 7.7742 | 3.8497 | 305 | 9.8387 | 3.3029 |
| August | 125 | 4.0323 | 2.2787 | 167 | 5.3870 | 2.9803 | 206 | 6.6451 | 2.5595 |
| September | 155 | 5.1667 | 2.3816 | 165 | 5.5000 | 2.9749 | 141 | 4.7000 | 2.3826 |
| October | 139 | 4.4839 | 2.0230 | 175 | 5.6452 | 1.9269 | 142 | 4.5806 | 2.3932 |
| November | 136 | 4.5333 | 2.6297 | 152 | 5.0667 | 2.5811 | 136 | 4.5333 | 2.6043 |
| December | 213 | 6.8710 | 3.2203 | 162 | 5.2258 | 2.9915 | 169 | 5.4516 | 2.8265 |
Table 4.
Predictions of public service breakdowns by month for 2019.
| Month | Baseline | XGBoost | MLP | BRR | SVM | RF | ||||||
|---|---|---|---|---|---|---|---|---|---|---|---|---|
| RMSE | MAE | RMSE | MAE | RMSE | MAE | RMSE | MAE | RMSE | MAE | RMSE | MAE | |
| January | 3.4641 | 2.7097 | 2.2930 | 1.9032 | 2.5209 | 2.0323 | 2.8455 | 2.3548 | 3.5058 | 2.6774 | 2.7591 | 2.1290 |
| February | 3.5355 | 2.9286 | 2.0529 | 1.6429 | 2.2520 | 1.7857 | 3.2950 | 2.7857 | 2.4128 | 1.8214 | 2.2678 | 1.8571 |
| March | 3.6056 | 2.9355 | 2.0791 | 1.6774 | 2.2433 | 1.7419 | 2.3071 | 1.8387 | 2.5400 | 2.0645 | 2.2860 | 1.8065 |
| April | 3.9115 | 3.2333 | 2.6013 | 1.9000 | 2.6141 | 2.0333 | 2.9665 | 2.3333 | 3.0768 | 2.4000 | 2.8925 | 2.2333 |
| May | 4.1697 | 2.9354 | 3.6544 | 2.8387 | 3.6323 | 2.6774 | 3.8646 | 2.8065 | 3.9595 | 2.8387 | 3.9226 | 2.8710 |
| June | 5.1897 | 4.1333 | 3.0332 | 2.2667 | 3.3166 | 2.4000 | 4.5753 | 3.8000 | 5.0133 | 3.8667 | 3.7283 | 2.9000 |
| July | 4.9416 | 3.9677 | 3.4827 | 2.8387 | 4.0081 | 3.2258 | 5.0609 | 4.0645 | 5.2976 | 4.2581 | 4.5791 | 3.6774 |
| August | 3.8813 | 3.2580 | 2.4561 | 2.0968 | 2.4822 | 2.0323 | 2.7474 | 2.2581 | 2.6396 | 2.2581 | 2.4363 | 2.0645 |
| September | 3.2352 | 2.5333 | 2.5949 | 2.0000 | 2.1909 | 1.6667 | 2.7447 | 2.2000 | 2.3381 | 1.8667 | 2.6394 | 2.1667 |
| October | 2.9182 | 2.3226 | 2.0320 | 1.5484 | 2.1627 | 1.5806 | 2.4626 | 1.8710 | 2.3280 | 1.8065 | 2.2361 | 1.7097 |
| November | 2.3664 | 1.8000 | 2.2583 | 1.8333 | 2.3594 | 1.9667 | 2.6708 | 2.2667 | 2.5298 | 2.0667 | 2.2876 | 1.8333 |
| December | 4.0040 | 3.2581 | 2.1850 | 1.7419 | 2.3827 | 1.8065 | 2.8793 | 2.2258 | 2.6881 | 2.0000 | 2.2504 | 1.6451 |
| Average | 3.7686 | 3.0013 | 2.5602 | 2.0240 | 2.6804 | 2.0791 | 3.2016 | 2.5671 | 3.1941 | 2.4937 | 2.8571 | 2.2411 |
Table 5.
Hyper-parameters of the best XGBoost model by month for 2019.
| Hyper-Parameter | Jan. | Feb. | Mar. | Apr. | May | Jun. | Jul. | Aug. | Sep. | Oct. | Nov. | Dec. |
|---|---|---|---|---|---|---|---|---|---|---|---|---|
| max_depth | 9 | 2 | 4 | 5 | 9 | 3 | 3 | 3 | 9 | 9 | 2 | 9 |
| n_estimators | 285 | 70 | 194 | 154 | 57 | 75 | 483 | 50 | 426 | 215 | 267 | 91 |
| learning_rate | 0.2711 | 0.3870 | 0.1624 | 0.5487 | 0.7399 | 0.8119 | 0.8929 | 0.05 | 0.1666 | 0.3346 | 0.7157 | 0.5107 |
| subsample | 0.5059 | 0.6634 | 0.5051 | 0.5314 | 0.7921 | 0.9333 | 0.9987 | 0.7310 | 0.5301 | 0.8417 | 0.9836 | 0.8275 |
| colsample_bytree | 0.6431 | 0.8463 | 0.5308 | 0.6080 | 0.5302 | 0.6975 | 0.7269 | 0.5 | 0.9437 | 0.9253 | 0.9446 | 0.7428 |
Table 6.
Metrics of the best XGBoost model with scaled breakdowns predictions by month for 2019.
| Metric | Jan. | Feb. | Mar. | Apr. | May | Jun. | Jul. | Aug. | Sep. | Oct. | Nov. | Dec. |
|---|---|---|---|---|---|---|---|---|---|---|---|---|
| RMSE | 0.2085 | 0.1866 | 0.1890 | 0.2601 | 0.2436 | 0.1517 | 0.2488 | 0.3070 | 0.2359 | 0.1693 | 0.2258 | 0.1681 |
| MAE | 0.1730 | 0.1494 | 0.1525 | 0.1900 | 0.1892 | 0.1133 | 0.2028 | 0.2621 | 0.1818 | 0.1290 | 0.1833 | 0.1340 |
© 2020 by the authors. Licensee MDPI, Basel, Switzerland. This article is an open access article distributed under the terms and conditions of the Creative Commons Attribution (CC BY) license (http://creativecommons.org/licenses/by/4.0/).
Share and Cite
MDPI and ACS Style
Cerna, S.; Guyeux, C.; Royer, G.; Chevallier, C.; Plumerel, G. Predicting Fire Brigades Operational Breakdowns: A Real Case Study. Mathematics 2020, 8, 1383. https://doi.org/10.3390/math8081383
AMA Style
Cerna S, Guyeux C, Royer G, Chevallier C, Plumerel G. Predicting Fire Brigades Operational Breakdowns: A Real Case Study. Mathematics. 2020; 8(8):1383. https://doi.org/10.3390/math8081383
Chicago/Turabian StyleCerna, Selene, Christophe Guyeux, Guillaume Royer, Céline Chevallier, and Guillaume Plumerel. 2020. "Predicting Fire Brigades Operational Breakdowns: A Real Case Study" Mathematics 8, no. 8: 1383. https://doi.org/10.3390/math8081383
Note that from the first issue of 2016, this journal uses article numbers instead of page numbers. See further details here.