Article

Myocardial Fibrosis in a 3D Model: Effect of Texture on Wave Propagation

by
Arsenii Dokuchaev
1,
Alexander V. Panfilov
2,3,* and
Olga Solovyova
1,3,*
1
Institute of Immunology and Physiology, Ural Branch of Russian Academy of Sciences, Ekaterinburg 620049, Russia
2
Department of Physics and Astronomy, Ghent University, Krijgslaan 281, 9000 Gent, Belgium
3
Laboratory of Computational Biology and Medicine, Ural Federal University, Ekaterinburg 620075, Russia
*
Authors to whom correspondence should be addressed.
Mathematics 2020, 8(8), 1352; https://doi.org/10.3390/math8081352
Submission received: 21 July 2020 / Revised: 6 August 2020 / Accepted: 7 August 2020 / Published: 12 August 2020
(This article belongs to the Special Issue Mathematical Modelling in Biomedicine)

Abstract

:
Non-linear electrical waves propagate through the heart and control cardiac contraction. Abnormal wave propagation causes various forms of the heart disease and can be lethal. One of the main causes of abnormality is a condition of cardiac fibrosis, which, from mathematical point of view, is the presence of multiple non-conducting obstacles for wave propagation. The fibrosis can have different texture which varies from diffuse (e.g., small randomly distributed obstacles), patchy (e.g., elongated interstitional stria), and focal (e.g., post-infarct scars) forms. Recently, Nezlobinsky et al. (2020) used 2D biophysical models to quantify the effects of elongation of obstacles (fibrosis texture) and showed that longitudinal and transversal propagation differently depends on the obstacle length resulting in anisotropy for wave propagation. In this paper, we extend these studies to 3D tissue models. We show that 3D consideration brings essential new effects; for the same obstacle length in 3D systems, anisotropy is about two times smaller compared to 2D, however, wave propagation is more stable with percolation threshold of about 60% (compared to 35% in 2D). The percolation threshold increases with the obstacle length for the longitudinal propagation, while it decreases for the transversal propagation. Further, in 3D, the dependency of velocity on the obstacle length for the transversal propagation disappears.

1. Introduction

Non-linear waves of electrical excitation propagate through the heart and initiate cardiac contraction. Myocardial tissue consists of inter-connected excitable cells—cardiomyocytes forming so-called myocardial fibers ensuring prevailing conducting pathways in the tissue. In normal myocardium, the electrical wave propagation is about 2–3 times faster in the longitudinal direction of the myocardial fibers than in the transversal directions. From a mathematical point of view, the electrical waves belong to a large class of waves in the Reaction–Diffusion systems which are widely studied in applied mathematics [1]. The structural properties of the myocardium are accounted in the models as electro-diffusion anisotropy of the medium with higher diffusion coefficient along the myofiber direction. In many forms of heart disease, normal wave propagation is disturbed by an excessive growth of the fraction of connective tissue within myocardium including inexcitable cells—fibroblasts and myofibroblasts. This pathological condition is called cardiac fibrosis.
Cardiac fibrosis is a common attribute of myocardial diseases of different etiology such as ischaemic cardiomyopathy and myocardial infarction, dilated cardiomyopathy, aortic stenosis, hypertrophic cardiomyopathy, and myocarditis [2]. Fibrosis is shown to be a predictor of adverse outcomes, including heart failure, ventricular arrhythmias, sudden cardiac death and all-cause mortality [3]. Fibrosis affects excitation propagation in the tissue creating inexitable obstacles, and zones of increasing heterogeneity and reduced conduction velocity in the myocardium. This may essentially increase the risk of arrhythmia induction and sustaining [4]. Experimental studies show that the frequency of ventricular arrhythmias linearly increases with fibrosis density [5]. On the other hand, fibrotic connective tissue is much stiffer than myocardium that reduces contractile performance of the tissue [6].
The pattern and distribution of fibrosis differ between conditions and vary from reversible diffuse forms to irreversible replacement fibrosis [7]. There are several types of fibrosis with varying texture between diffuse, patchy, and focal forms [4]. In diffuse fibrosis, small obstacles are randomly distributed between cardiomyocytes. In interstitial and patchy fibrosis, there are more structured non-conducing (low-conducting) obstacles elongated in form of stria or patches separating myocardial fibers. The latter fibrosis textures were shown to be even more arrhythmogenic than compact fibrosis due to the zig-zag conduction allowing micro-reentry to arise in the tissue [8].
Mathematical models were used to study effects of fibrosis on the myocardial excitation, and its role in the arrhythmia onset [9,10,11,12,13,14,15,16]. As any mathematical model is an idealisation of reality, representation of fibrosis in such studies was also simplified. The most important effect of fibrosis is that fibroblasts are inexcitable cells. Thus most of the studies considered cardiac tissue in the presence of fibrosis as a mixture of excitable cells (myocytes) described by non-linear differential equations coupled to each other by the diffusion operator describing electrical current between coupled myocytes. The fibrotic cells were mainly considered as obstacles [17,18], i.e., cells through which electrical currents from myocytes cannot flow and thus these cells were described as internal boundaries with no-flux boundary conditions [19].
Most modelling research has been devoted to the effects of diffuse or compact fibrosis. Effects of the diffuse fibrosis in the myocardium were considered by A. Panfilov’s group on simplified models of cardiac tissue [17,18], as well as on modern ionic models [9]. In these studies, the domain representing cardiac tissue consisted of rectangular (squared or cubic) cells which with some probability were assigned to be excitable myocytes or inexcitable obstacles simulating fibroblasts. It was shown that two-dimensional biophysical models of myocardial tissue, in spite of their simplicity, allow one to find out main scenarios of fibrosis consequences, namely, the progressive slowing down of the wave propagation velocity, fractalization of its front and more irregular propagation of the excitation wave, and even predict the conditions for the break-up of spiral waves, i.e., in the settings of intact myocardium—the transition from tachycardia to life-treating fibrillation. It was found that if external impulse stimulation was applied to the fibrous tissue, the tendency to arrhythmias increased with an increase in the degree of tissue fibrosis [18]. Further studies showed that one of the most important factors influencing the occurrence of arrhythmias was the spatial heterogeneity of fibrosis [10].
Local (compact) fibrosis, as a rule, is associated with development of a myocardial post-infarction scar that replaces cardiomyocytes. The role in the onset and dynamics of arrhythmias of post-infarction scar simulated as a compact inexcitable area in myocardial tissue and its border zone simulated as a surrounding excitable tissue with impaired properties (reduced tissue conductivity and/or cellular excitability) was considered in the framework of computer modeling [20,21,22]. A case of compact fibrosis represented by a small number of large inexcitable regions in myocardial tissue was studied in paper [23].
Another approach used to study cardiac fibrosis in computational models is to simulate the electrical coupling between myocytes and fibroblasts. Works using this approach were performed in papers [24,25,26] showing emergence of complex dynamics of spiral waves and increase in the likelihood of arrhythmias depending on the fibroblasts properties and degree of coupling between myocytes and fibroblasts. A series of works was performed by N. Trayanova’s group, which demonstrates the effect of myofibroblast density on the probability of arrhythmia (see, for example, [27]). The role of increasing amount of fibroblasts coupled to cardiomyocytes in induction of atrial fibrillations was studied in [21].
Effects of more complex structures of fibrosis formed of interstitial stria surrounding myofibers either randomly or being organized in patchy areas that may replace a large fraction of myocardial tissue have not been sufficiently studied neither in experiment nor in simulations. Role of the texture and type of fibrosis in the rhythm disturbances and the risk of their complications is not quantitatively evaluated. One of the first works demonstrating the importance of the texture and the characteristic dimensions of unexcitable obstacles in the tissue for the onset of spiral waves was the work of A. Pertsov’s group (see [28]). In our recent study, [29], we made a first attempt to study the effects of fibrotic texture representing some features of interstitial fibrosis with primarily linear accumulations of collagen separating bundles of myocytes with little alteration in the alignment of myocytes or bundles [30]. One of main features of this pattern is that inexcitable inclusions to cardiac tissue here have some directional dependency laying between myofibers. In idealised representation they can be seen as thin elongated obstacles directed along cardiac fibers. In [29], we considered case of parallel fibers, thus texture of linear inexcitable elements which all have the same orientation and we studied propagation in such 2D models of myocardium for wave along this direction (longitudinal) and perpendicular to it (transversal) propagation. Main findings of this study revealed an opposite change in the conduction velocity (CV) with the obstacle length depending on the direction of the wavefront propagation. The CV increases with obstacle length if the excitation propagates along the obstacle strips, while the CV decreases under transverse wavefront propagation. This causes increasing tissue anisotropy with obstacle elongation [28]. This effect was explained by zig-zag propagation in the tissue with more short excitation path along the obstacles than across. The 2D model we used has natural limitations not allowing the wave to propagate in the third spacial direction transverse to the longitudinal coordinate of the obstacles. In this article, we extend our study of structured fibrosis to 3D myocardial tissue models and analyze if the third spatial dimension and the depth of the 3D tissue volume affect the characteristics of the excitation wave and the arrhythmogenic power of the fibrosis.
In particular, the aim of this paper is to study in detail effects of randomly generated textures of fibrosis with various lengths and percentages of obstacles on wave propagation in cardiac tissue slab of various depth.

2. Materials and Methods

2.1. Electrophysiology Model

To describe propagation of the excitation wave in the myocardial tissue we used a 3-dimensional monodomain formulation:
C m V t = D 2 V I i o n ,
where V is transmembrane potential, D —electro-diffusion matrix for anisotropic tissue, in this study we considered D constant, I i o n —sum of all transmembrane ionic currents, described with biophysically detailed cardiac action potential model TP06 [31].
Initial conditions were set as the rest potential V = V r e s t for the cardiac tissue. Boundary conditions were formulated as the no flux through the boundaries:
n V = 0 ,
where n —is the normal to the boundary.
The problem was solved in a 3D cuboid simulating myocardial slab with inclusions of structured fibrosis. Fibrosis elements of the tissue were simulated as non-conducting inexcitable obstacles and considered as the boundaries (no flux) for the myocardial elements.

Numerical Methods

To solve the problem (1) and (2) we used a finite-difference method with 18-point stencil discretization scheme as described in [32] with 0.25 mm for the spatial step and 0.02 ms for the time step.
Rush-Larsen formalism [33] was used for TP06 gating variables integration.

2.2. Fibrosis Pattern Generation

We considered 3D finite-difference mesh as matrix X × Y × Z (where X, Y, Z are the numbers of elements in x, y and z direction) with each element to be either excitable myocardial tissue or inexcitable fibrosis. In general we used matrices 200 × 200 × 10 elements (or 50 mm × 50 mm × 2.5 mm) in size, but we also considered matrices with 200 × 200 × Z elements, where Z might be 1, 2, 3 or 5.
Similarly to Nezlobinsky et al. [29], we uniformly distributed fibrosis elements and varied length of elements (in x-axis direction) and density of elements distribution. To distribute fibrosis elements through the mesh we implemented two approaches. Fibrosis pattern was generated in the same manner as described in [29], namely, we subdivided each X × Y × Z matrix in x or y direction into Y · Z or X · Z rows with size 1 × 200 × 1 or 200 × 1 × 1 respectively. Then we subdivided each row into blocks of length n and assign it as fibrotic with a probability p. This approach allowed us to set fibrosis percentage precisely close to desired value.
Examples of wave propagation in a myocardial slab with fibrosis of different texture are shown in Figure 3. Upper panels A-B show an example of elongated fibrosis texture with linear 3 × 1 × 1 elements of 3 x-node length occupying 60% of the tissue volume. Panel A shows the wave propagation in the longitudinal direction of the fibrotic obstacles, panel B shows the wave in the transversal direction. Bottom panel C shows an example of the diffuse fibrosis texture of the same density. Details on the wave dynamics are described in the Results section.

2.3. Shortest Path Calculation

The shortest possible path of excitation propagation between the opposite sides of the myocardial cuboid was calculated to demonstrate the zig-zag propagation through the fibrotic texture with elongated obstacles. We used iterative multi-dimensional binary dilation routine. Figure 1 shows and 2D example of our algorithm. Firstly, we mark an initial side of the mesh (all cells in left lateral surface except fibrosis) as “activated” and applied 3D binary dilatation operation until at least one cell on the opposite side of mesh becomes “activated” (see Figure 1A). Then, starting from this early approached cell on the opposite side (if there were several points we randomly picked one single point), we repeated this procedure in backward direction. The number of dilation iterations was taken as the length of shortest possible path for excitation propagation (see Figure 1B). Very first activated opposite cells for both steps were then used to calculate the trace of the shortest path.
To trace the shortest possible path we build an undirected graph connecting neighbouring “active” cells in the fibrosis matrix and then breadth-first search algorithm with cells obtained on previous step assigned to be source and target nodes was used. An example of the shortest possible path trace is shown in Figure 2.

3. Results

We evaluated properties of the excitation wave propagating either in the longitudinal direction of the fibrosis stria (along the long face of the strips in the direction of horizontal axis x) and across them (transversal, along axis y). We varied several parameters: (1) the depth of the myocardial slab from monolayer, which is equivalent 2D tissue to a 3D multilayer slab (2, 3, 5 and 10 layers); (2) the length of fibrosis stria from random 0.25 mm cubic elements simulating diffuse fibrosis (number of nodes n = 1 on axis x) to 1.0 × 0.25 × 0.25 mm3 strips ( n = 4 ) elongated along axis x; (3) the density of the fibrosis from 10 to 60%.

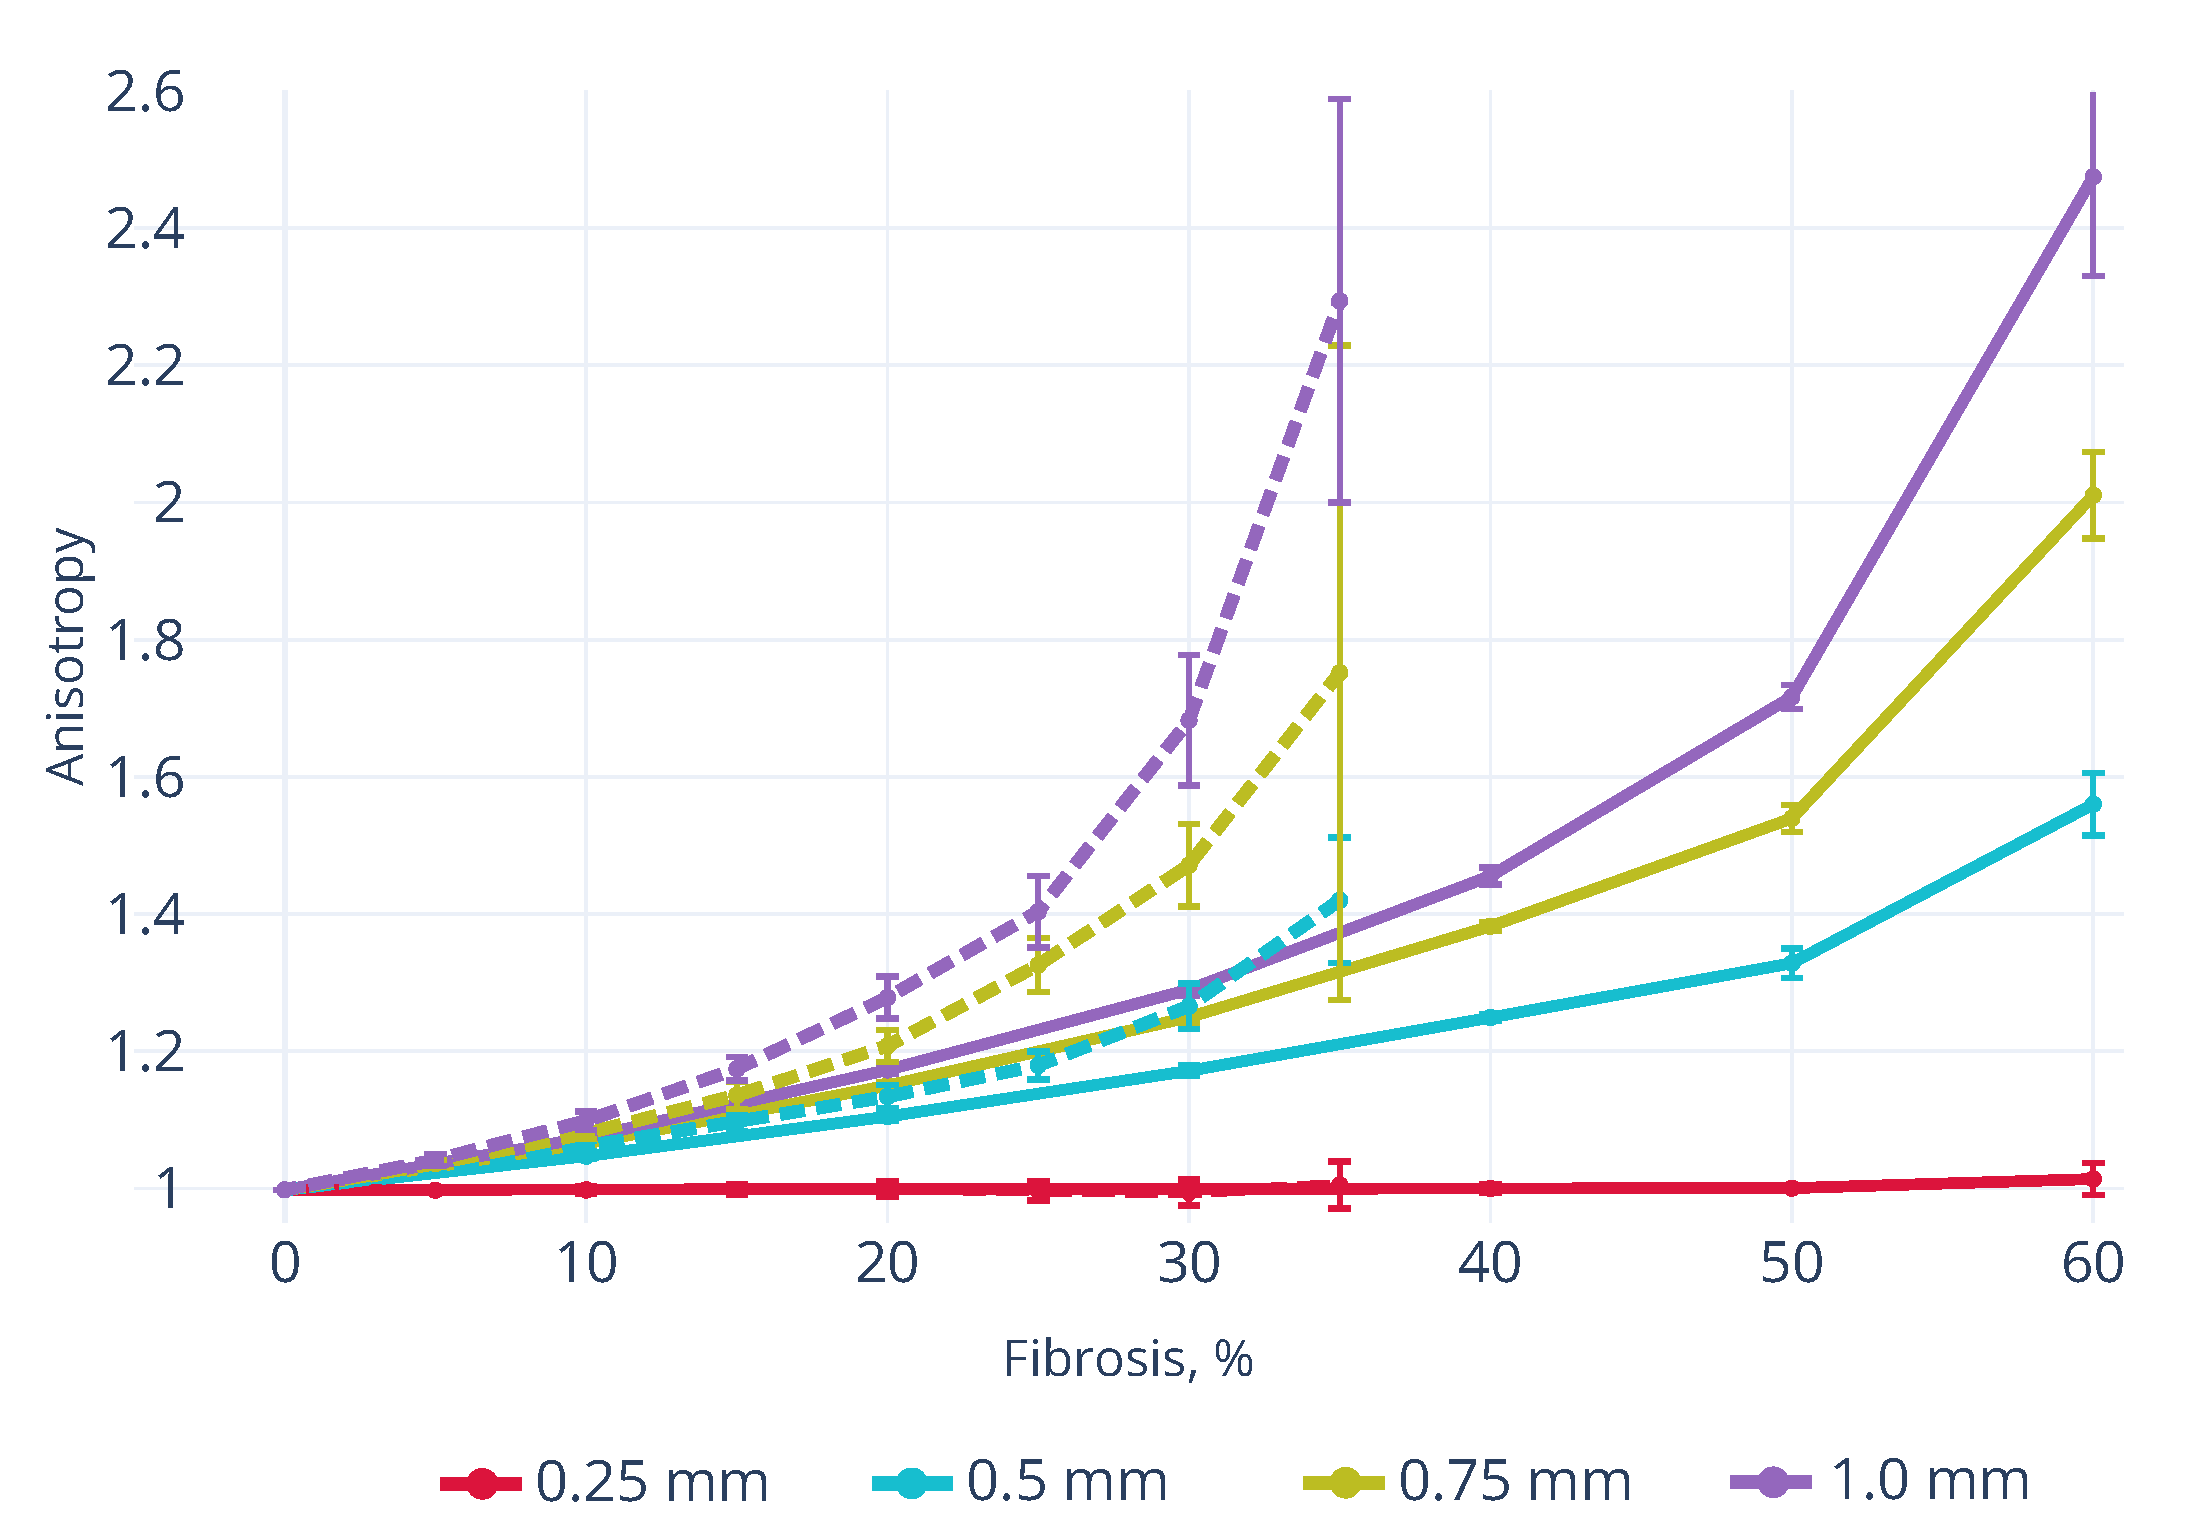
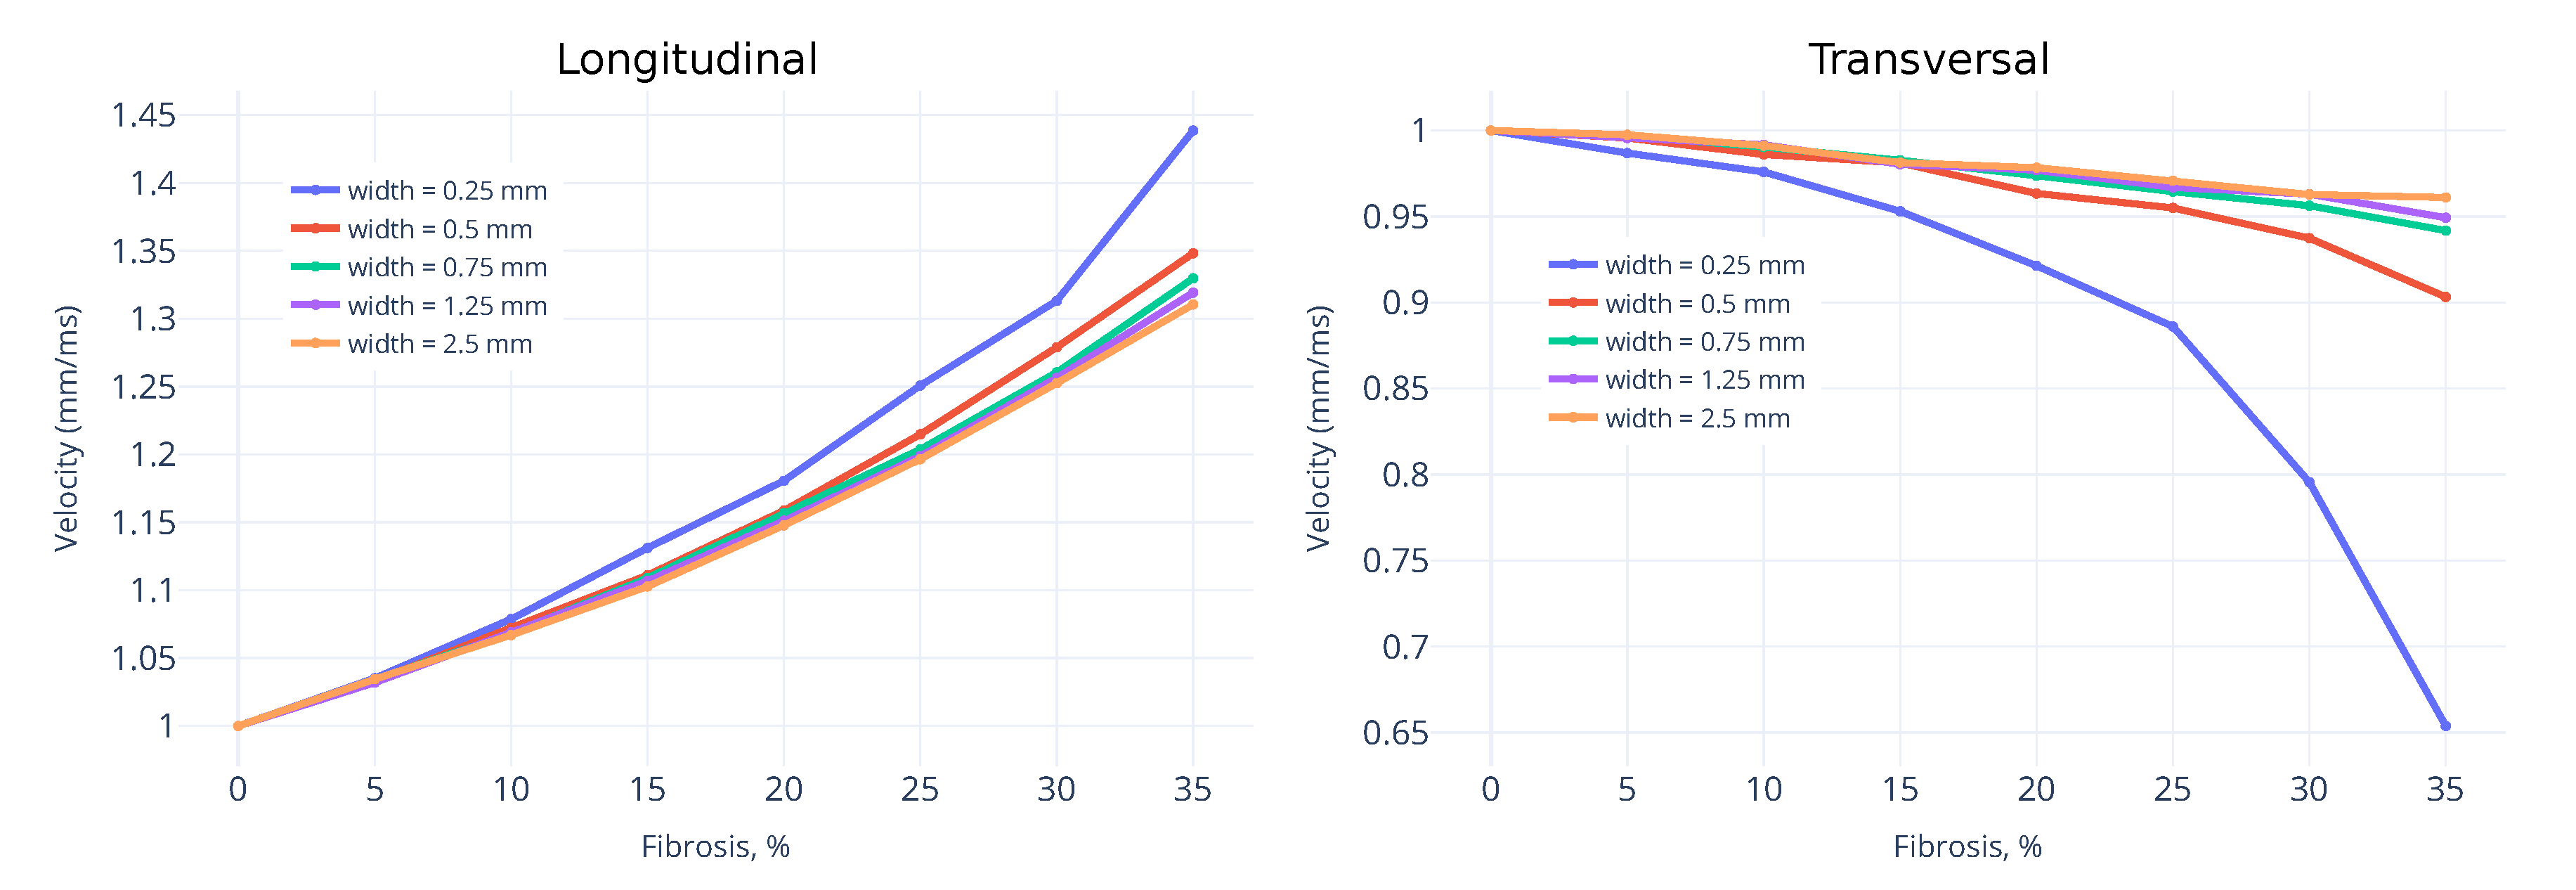
3.1. Wavefront Velocity Depends on Fibrosis Fraction and Propagation Direction

Representative simulations of the wave propagation in the longitudinal and transverse directions in the 3D myocardial volume with structural fibrosis of 60% density formed of linear 3 × 1 × 1 elements of 3 x-node length are shown in Figure 3. We compare propagation of the wave initiated by the stimulation on the left lateral surface and spreading along the obstacle elongation (see panel A) or on the upper lateral surface and travelling across the obstacles (panel B). We see that the wavefront has a complex shape due to interaction with obstacles. We also see that the wave propagates along the obstacles about two times faster than across them. For example, 50 ms after stimulation the wave propagated at a distance of approximately 25 mm for the longitudinal direction. However, for the transversal propagation the wavefront covered about 16 mm of the tissue. Panel C shows wave propagation in the model with diffuse fibrosis of the same density initiated on the upper surface of the volume. Here, average dynamics of the wave does not depend on the direction as the fibrotic elements are cubic. The conduction velocity at diffuse fibrosis is much slower than that at the longitudinal wavefront direction for the elongated obstacles, and is near to that for the transversal wavefront direction (CV = 0.29 mm/ms in panel C versus 0.48 mm/ms in panel A, and 0.24 mm/ms in panel B).
Figure 4 shows the dependence of the conduction velocity (CV) on the percentage of the fibrosis for textures with 0.25 to 1 mm long elements (n = 1, 2, 3, 4 x-nodes). Upper panels A, B show the results we obtained in a 3D monolayer of the tissue (0.25 mm depth, 1 z-layer). As this case is equivalent to 2D model, we use it as a reference for comparison of 2D and 3D models, in particular with the results reported earlier [29]. We see that the velocity significantly decreases with an increase in the fibrosis percentage. For the diffuse fibrosis (n = 1) the velocity does not depend on the direction of activation (see red lines in Figure 4) and is used as the reference to compare with results for structural fibrosis. In the monolayer model, elongation of obstacles has a pronounced opposite effect on the longitudinal and transversal CV with increasing longitudinal velocity with obstacle length but decreasing transversal velocity.
Middle C, D panels in Figure 4 show the results obtained in the multilayer tissue of the 2.5 mm depth (10 z-layers). It is seen that qualitative effects of fibrosis density and obstacle length on the CV are similar to that of the monolayer model. At the same time, the tissue depth allowing excitation to propagate around obstacles in the additional transversal direction (z-axis). It differently affect the longitudinal and transversal propagation. We see a significant effect of the obstacle length on the longitudinal CV similar to monolayer case, while the transversal CV in the ten-layer tissue model is almost independent of the obstacle length in contrast to the monolayer model.
Therefore, the texture of fibrosis produces anisotropic propagation with increasing longitudinal/transversal anisotropy ratio with the density of fibrosis and obstacle length. This is illustrated in Figure 5. The anisotropy ratio in multilayer model reaches 2:1 with increase in the fibrosis density, the dependency is steeper at longer obstacles and more steep in the monolayer vs. multilayer models. The dependency is non-linear at higher than 25% fibrosis percentage.

3.2. Wave Propagation Stopping Depends on the Tissue Depth, Fibrosis Percentage and Wavefront Direction

The CV dependencies in Figure 4 are spanned for different ranges of fibrosis percentage for monolayer models (panels A,B) and multilayer models (panels C,D), indicating different percolation threshold for 2D and 3D cases. The fibrosis percentage in the monolayer models is limited by 35%, after which the wave cannot propagate anymore, while in the multilayer models the wave propagates for the fibrosis density up to 55%. Close to percolation threshold we observed a steep increase in the variability of CV for both models (see increasing STD whiskers on the curves in Figure 4). For example, in the monolayer models with 35% fibrosis and three-node long obstacles, coefficient of variability in CV is of 21.8% for the longitudinal direction and 11.5% for the transverse direction. In the multilayer models with 60% fibrosis and three-node long obstacles the coefficients of variability in CV are 1.8% and 3.6% respectively.
Figure 6 characterizes the percolation threshold statistically: it shows the fraction of models with failed wave propagation depending on the fibrosis percentage in the mono- (upper panels) and multilayer (lower panels) model. Here, we used the binary dilation method to analyze if the wave is able to approach the opposite side of the tissue volume (see Methods section for detail) and counted a number of models with propagation failing. The dependencies are approximated by logistic Hill curves.
It is seen that the curves are right-shifted for longitudinal wavefront (left panels) compared to transversal wavefront (right panels) and in the multilayer models (lower panels) compared to monolayer models (upper panels). This means that the probability of excitation failure is higher for for the transversal versus longitudinal wavefront propagation and in the monolayer against multilayer tissue. Moreover, the curves shift in the opposite directions for the longitudinal and transversal propagation when the obstacle length is increasing.
We see that for the longitudinal propagation the probability of excitation failure decreases while for the transversal propagation the probability of excitation failure increases with increase in the obstacle length.
To clarify these results further we show the dependencies of the percolation threshold FP 95 (i.e., fibrosis percentage where propagation failure occurs for 95% of models) on the obstacle length for the longitudinal and transversal propagation in the mono- and multilayer models (Figure 7). It is seen that FP 95 is much higher in the multilayer (upper lines) compared to the monolayer (lower lines) models, and FP 95 is higher for the longitudinal wavefront direction (solid lines) compared to the transversal (dotted lines). For longitudinal wave direction the minimal FP 95 is observed for the diffuse fibrosis and FP 95 is about 43% for the monolayer models and FP 95 and is about 65% for the multilayer models. For transversal propagation the minimal FP 95 is lower than the minimal FP 95 for the longitudinal propagation. It is observed for the fibrosis of 4-node long and FP 95 is about 35% for the monolayer models and FP 95 and is about 60% for the multilayer models. Note, that in Figure 4 and Figure 5 we considered the latter fibrosis percentages as upper limits for the mono- and multilayer models.

3.3. Effects of Fibrosis on the Conduction Velocity Depends on the Tissue Depth

In Figure 8 we compare effects of obstacle length on the CV in the ten-layer models (red lines) with that in the mono-layer models at 35% fibrosis. We see that the length of the obstacle substantially affects longitudinal propagation and the dependency in 3D is similar to that in 2D. However, for the transversal propagation the velocity is almost independent on the obstacle length in 3D.
To quantify further effects of the tissue depth on the degree of CV change with the length of fibrosis obstacles, we demonstrate the ratio of the average CV for the models with 1 mm (n = 4) obstacle length to the model of diffuse fibrosis of the same percentage (Figure 9) at different thickness of the tissue (number of layers is 1, 2, 3, 5, and 10). We see big change in velocity between 1 and 2 layers. However starting from 3-layer thick tissue, the curves become independent of the number of layers. So, for both wavefront directions the thickness when 3D effects become dominating is about 0.5 mm.

3.4. Shortest Path for Wave Propagation Depends on the Obstacle 0 and the Tissue Depth

In paper [29], we explained an opposite effect of increasing obstacle length on the longitudinal and transverse propagation velocity by a zig-zig propagation [8]. It was characterized by estimating the shortest path length between opposite boundaries of the medium. Here, we use the similar approach and calculate the shortest path from one to the opposite face of the 3D myocardial slab in the longitudinal and transverse direction (see Methods section in detail). As shown in Figure 2 the path is more straight and short in the longitudinal direction and it is more complex and long in the transverse direction. The distribution of the shortest path length for the 3D mono- (upper panels) and multilayer models (lower panels) for the same fibrosis density of 30% for obstacle length n = 4 in comparison with diffuse fibrosis with n = 1 are shown in Figure 10. It is seen that the average path is much shorter for the longitudinal wavefront direction than that for the diffuse fibrosis and the latter is shorter than the path for the transversal wavefront direction. Interestingly, for a particular texture shown in Figure 2 the ratio of conduction velocities in the longitudinal and transversal directions is 2.47, which is reasonably close to the ratio of average path lengths (2.23). Note that the average path length almost does not change with the tissue depth for the longitudinal wavefront direction. In contrast, the average path for the transverse direction essentially shortens in the multilayer tissue (116.71 for transverse fibrosis of n = 4 node length and 30% density. see Figure 10) coming closer to the value for the average value for the diffuse fibrosis models.

4. Discussion

In this paper, we extended our previous study on the effects of fibrosis texture on wave propagation in cardiac tissue by transition from 2D to 3D models with varying depth of the myocardial slab. First, we checked if the effects we observed in the 2D models are reproduced in the 3D formulations of a monolayer model with 1 node depth of the tissue. Then, we increased the number of layers in the slab to evaluate effects of the third spatial dimension on the properties of the wave in the fibrosis textures of various densities and obstacle elongation. The simple model of straight elongated obstacle stria in the myocardial tissue were considered as a simplified representation of interstitial fibrosis [8] localized between myocardial fibers replacing part of cardiomyocytes. To evaluate effects of obstacle elongation in comparison with more rounded small elements of the diffuse fibrosis, we varied the obstacle length considering the texture with fibrosis strips of equal length. Then, we varied fibrosis percentage in a rather wide range to approach such density where excitation wave stopped due to obstacle texture blocking the propagation at a certain distance from the initially stimulated area.
We show that the elongation of obstacles has a substantial effect on the waves. It results in anisotropic wave propagation in which the velocity of the longitudinal propagation increases with increasing elongation, while the velocity of the transversal direction decreases (Figure 4). The extent of the effect increases with the fibrosis percentage and with the the obstacle length.
We found that qualitative effects of the fibrosis texture are similar in the 3D and 2D models of the tissue, which validates main predictions based on the 2D models and allows one to translate them into the more adequate 3D settings. At the same time we showed that the effects of fibrosis in the 3D tissue are less expressed due to additional spacial dimension transversal to the obstacle elongation that allows the wave to find more ways to bypass the fibrotic obstacles. The effects of the third tissue dimension are more pronounced for the transversal wavefront direction increasing the conduction velocity in the 3D multilayer models compared to monolayer models and making almost negligible difference between the CV at various obstacle lengths at the same fibrosis percentage (Figure 4).
We showed that in 3D tissue the dependencies of the tissue anisotropy on the fibrosis density are much less steep (Figure 5), so the higher fibrosis percentage is needed to approach the same extent of anisotropy as produced by the 2D models. For instance, an anisotropy of 2:1 was approached at about 30% fibrosis in the monolayer models while the same anisotropy was demonstrated in the models of 60% fibrosis in ten-layer deep models.
We showed that threshold fibrosis density for conduction block is also about twice higher in the 3D multilayer models as compared to the monolayer models (see Figure 7). Of note, the threshold fibrosis density increases with obstacle elongation for the longitudinal wavefront direction, while decreases for the transversal direction that makes much less percentage of fibrosis to be more dangerous.
The geometric approach we used here for determining the shortest path of the wave is the main approach which was used in most of the papers on fibrosis [12,13,19,34]. In real myocardial tissue, the path of the wave is governed by the dynamic electrotonic load (source-sink relationship), which can affect the propagation up to producing local blocks in spite of the geometrical connectivity [3]. In our previous work [29] we specially analyzed if the geometry consideration only is sufficient to estimate the path and to discriminate the cases of different elongation of the fibrosis elements. We performed additional simulations initiating a propagation wave by point stimulation at one boundary and calculating its shortest path to the opposite boundary. We found that the source-sink relationship slightly increases the path of zig-zag propagation as compared to percolation path for both the longitudinal and transversal wavefront direction, and an increase in the transversal path was about 15%, while for the longitudinal only about 3%. We also found that the ratio of the average path lengths and the ratio of the conduction velocities (anisotropy) in the longitudinal and transversal directions were almost the same for a particular fibrosis texture. Thus, we showed that the percolation path provided a good estimate for the real path of the wave and the difference in the geometry-based paths at fibrosis of different textures reflects adequately the real difference rather underestimating it quantitatively.
These simulations suggest that the severity of the fibrosis effects on the myocardial tissue is essentially dependent on the local density of the fibrosis and its orientation relative to the myocardial fibers that can vary depending on the tissue depth and orientation of the myofibers within the heart chambers.
Our research is a computation prediction on some 3D effects of fibrosis texture on wave propagation. It would be interesting to compare it with available experimental data. There is a lot of experimental data which qualitatively confirms the results of our study. In many papers and in various preparations it was shown that fibrosis decreases the conduction velocity of the wave propagation (see reviews [3,4]). Further in [35] it was shown that increased interstitial fibrosis affects transverse conduction much more than the longitudinal conduction. Further, one of our results is a complex shape of the wave in the presence fibrosis (Figure 3) is also qualitatively confirmed in [36], where it was shown that increased fibrosis has also been associated with heterogeneioty of conduction. It was shown in patients with dilated cardiomyopathy that the amount of myocardial fibrosis correlated with the severity of abnormal propagation [30].
However, currently quantitative comparison is impossible. This is because it is challenging to create cardiac tissues with controlled textures of fibrosis in which length interstitial stria gradually changes. However, we think that using modern technologies of cardiac cell co-cultures [37] and/or optogenetics [38] it will be possible to mimic multiple elongated obstacles with controlled length and study wave propagation there. There are also recent developments which allow construction of such 3D preparations [39]. It would be interesting to use these technologies to study wave propagation in such experimental systems and compare it with the predictions of our modelling.
Our approach has several limitations.
The major limitation is that we studied models of idealised fibrosis formed by linear inexcitable obstacles of the same length. The geometry and texture of fibrosis in real tissue is much more complex on many aspects. Fibrosis can be formed not only by fibroblasts, but also by myofibroblasts, which are much larger in size. Substantial amounts of collagen are present in fibrotic cardiac tissue and have different space scale and organisation than fibroblasts. Further, direction, size and shape of fibrotic inclusions are not so regular as we assumed in our paper. It would be interesting to perform studies on realistic textures of cardiac fibrosis in the human heart similar to those from [40] obtained for 3D tissue [41] using computational approaches presented in study [42,43]. Further, a novel approach of modelling which takes into account shapes of cardiac cells can be an interesting tool to better represent fibrosis textures [26]. In this paper we studied effects of fibrosis texture on the wave propagation. It would be also interesting to study effects of fibrosis texture on the onset and properties of cardiac arrhythmias which either occur due to re-entry mechanism of abnormal propagation related to the structural abnormality of the tissue [44] or due to ectopic activity related to the abnormal depolarization-repolarization of cardiac cells [45].
We considered 3D isotropic tissue without taking into account pre-excisting anysotrophy of myocardium due to myofiber structure with different electro-diffusion along and across the fibers. This is also the task for our future studies on realistic textures of cardiac fibrosis.

Numerical Implications for Fibrosis Modelling

Currently two main approaches are used to represent fibrotic remodeling: (1) modification of the diffusion tensor in the regions where fibrosis is present [20] and (2) introduction of real obstacles or internal boundary conditions (this study, [19]). Although, in our view approach (2) can potentially better represent texture of the tissue and better reproduce mechanisms of initiation of arrhythmias, its numerical implementation is much more challenging. In our paper we used approach (2), however, our approach can also be applied for simulations performed using approach (1) in combination with patient specific data in the following way. For some patients with cardiac myopathy a biopsy of endocardial tissue is often taken. The bioptic tissue can be studied using histological methods and a patient specific texture of fibrosis for this given patient is available. This texture can be input to computer and fibrotic tissue can be modelled as obstacles, as we did in our paper. Then we can compute the velocities of propagation for wave in three orthogonal directions and based on that calculate diffusion coefficients as well as a rule for their modification. We illustrate it with a specific example. We generated a fibrotic texture in a small 3D patch of cardiac tissue (Supplementary Materials Figure S1). The preexisting anisotropy was 1:0.5:0.5 with respect to velocity. From studies of wave propagation in 3 orthogonal direction we found that for given fibrosis texture (50% fibrosis produced by obstacles of 0.75 mm × 0.25 mm) decrease in velocities can be reproduced by decrease in diffusion coefficient by 1.75, 2.08, 2.08 for the longitudinal and 2 transversal directions. Thus if one wants to introduce effect of such fibrosis to the large scale model, the diffusion coefficients in fibrotic regions should be reduced by such factors, e.g., instead of 1:0.25 :0.25 one should use 0.57:0.12:0.12.
In conclusion, in 3D idealised models for human myocardial tissue, we showed that inexcitable fibrotic elements produce anisotropy of cardiac tissue that depends on the fibrosis percentage, obstacle elongation and tissue depth. The anisotropy results from zig-zag propagation depending on the elongation of fibrosis elements. We showed that a threshold fibrosis density to stop excitation propagation depends on the obstacle length and tissue depth.

Supplementary Materials

The following are available online at https://www.mdpi.com/2227-7390/8/8/1352/s1, Figure S1: Electrical wave propagation in a model with structural fibrosis and a reduced model simulating propagation timing in the fibrosis tissue. Table S1: Electro-diffusion coefficients (D), anisotropy (longitudinal to transverse ratio) and conduction velocity (CV) in the models with structural fibrosis and corresponding reduced model.

Author Contributions

Conceptualization, A.V.P. and O.S.; methodology, A.D. and A.V.P.; software, A.D.; simulations, A.D.; analysis, A.D., A.V.P. and O.S.; writing—original draft preparation, A.D., A.V.P., O.S.; writing—review and editing, A.V.P. and O.S.; visualization, A.D. All authors have read and agreed to the published version of the manuscript.

Funding

A.D., A.V.P. and O.S. were funded by the Russian Foundation for Basic Research (#18-29-13008). A.V.P. and O.S. were funded by RF Government Act #211 of 16 March 2013 (agreement 02.A03.21.0006). A.D. and O.S. work was carried out within the framework of the IIP UB RAS theme No. AAAA-A18-118020590031-8. A.V.P. was partially funded by BOF Ghent University.

Acknowledgments

We are thankful to Timur Nezlobinsky for help in setting up of computations.

Conflicts of Interest

The authors declare no conflict of interest.

Abbreviations

The following abbreviations are used in this manuscript:
CVConduction velocity

References

  1. Volpert, A.; Volpert, V.; Volpert, V. Traveling Wave Solutions of Parabolic Systems: Translations of Mathematical Monographs; American Mathematical Society: Providence, RI, USA, 1994; Volume 140. [Google Scholar]
  2. Bing, R.; Dweck, M.R. Myocardial fibrosis: Why image, how to image and clinical implications. Heart 2019, 105, 1832–1840. [Google Scholar] [CrossRef] [PubMed] [Green Version]
  3. Nguyen, T.P.; Qu, Z.; Weiss, J.N. Cardiac fibrosis and arrhythmogenesis: The road to repair is paved with perils. J. Mol. Cell. Cardiol. 2014, 70, 83–91. [Google Scholar] [CrossRef] [PubMed] [Green Version]
  4. De Jong, S.; Van Veen, T.A.; Van Rijen, H.V.; De Bakker, J.M. Fibrosis and cardiac arrhythmias. J. Cardiovasc. Pharmacol. 2011, 57, 630–638. [Google Scholar] [CrossRef]
  5. Stein, M.; Noorman, M.; van Veen, T.A.; Herold, E.; Engelen, M.A.; Boulaksil, M.; Antoons, G.; Jansen, J.A.; van Oosterhout, M.F.; Hauer, R.N.; et al. Dominant arrhythmia vulnerability of the right ventricle in senescent mice. Heart Rhythm 2008, 5, 438–448. [Google Scholar] [CrossRef] [PubMed]
  6. Jugdutt, B.I. Ventricular remodeling after infarction and the extracellular collagen matrix. Circulation 2003, 108, 1395–1403. [Google Scholar] [CrossRef] [Green Version]
  7. Travers, J.G.; Kamal, F.A.; Robbins, J.; Yutzey, K.E.; Blaxall, B.C. Cardiac fibrosis. Circ. Res. 2016, 118, 1021–1040. [Google Scholar] [CrossRef] [Green Version]
  8. De Bakker, J.M.; Van Capelle, F.J.; Janse, M.J.; Tasseron, S.; Vermeulen, J.T.; De Jonge, N.; Lahpor, J.R. Slow conduction in the infarcted human heart: `Zigzag’ course of activation. Circulation 1993, 88, 915–926. [Google Scholar] [CrossRef] [Green Version]
  9. Ten Tusscher, K.H.; Panfilov, A.V. Influence of diffuse fibrosis on wave propagation in human ventricular tissue. Europace 2007, 9 (Suppl. 6), 38–45. [Google Scholar] [CrossRef]
  10. Kazbanov, I.V.; Ten Tusscher, K.H.; Panfilov, A.V. Effects of heterogeneous diffuse fibrosis on arrhythmia dynamics and mechanism. Sci. Rep. 2016, 6, 1–14. [Google Scholar] [CrossRef] [Green Version]
  11. Alonso, S.; Bär, M. Reentry near the percolation threshold in a heterogeneous discrete model for cardiac tissue. Phys. Rev. Lett. 2013, 110, 158101. [Google Scholar] [CrossRef]
  12. Alonso, S.; dos Santos, R.W.; Bär, M. Reentry and ectopic pacemakers emerge in a three-dimensional model for a slab of cardiac tissue with diffuse microfibrosis near the percolation threshold. PLoS ONE 2016, 11, e0166972. [Google Scholar] [CrossRef] [PubMed] [Green Version]
  13. Vigmond, E.; Pashaei, A.; Amraoui, S.; Cochet, H.; Hassaguerre, M. Percolation as a mechanism to explain atrial fractionated electrograms and reentry in a fibrosis model based on imaging data. Heart Rhythm 2016, 13, 1536–1543. [Google Scholar] [CrossRef] [PubMed]
  14. McDowell, K.S.; Vadakkumpadan, F.; Blake, R.; Blauer, J.; Plank, G.; MacLeod, R.S.; Trayanova, N.A. Mechanistic inquiry into the role of tissue remodeling in fibrotic lesions in human atrial fibrillation. Biophys. J. 2013, 104, 2764–2773. [Google Scholar] [CrossRef] [PubMed] [Green Version]
  15. Krueger, M.W.; Rhode, K.S.; O’Neill, M.D.; Rinaldi, C.A.; Gill, J.; Razavi, R.; Seemann, G.; Doessel, O. Patient-specific modeling of atrial fibrosis increases the accuracy of sinus rhythm simulations and may explain maintenance of atrial fibrillation. J. Electrocardiol. 2014, 47, 324–328. [Google Scholar] [CrossRef]
  16. Varela, M.; Colman, M.A.; Hancox, J.C.; Aslanidi, O.V. Atrial heterogeneity generates re-entrant substrate during atrial fibrillation and anti-arrhythmic drug action: Mechanistic insights from canine atrial models. PLoS Comput. Biol. 2016, 12, e1005245. [Google Scholar] [CrossRef] [Green Version]
  17. ten Tusscher, K.H.; Panfilov, A.V. Influence of nonexcitable cells on spiral breakup in two-dimensional and three-dimensional excitable media. Phys. Rev. E Stat. Phys. Plasmas Fluids Relat. Interdiscip. Top. 2003, 68, 2–5. [Google Scholar] [CrossRef] [Green Version]
  18. ten Tusscher, K.H.W.J.; Panfilov, A.V. Wave propagation in excitable media with randomly distributed obstacles. Multiscale Model. Simul. 2005, 3, 265–282. [Google Scholar] [CrossRef] [Green Version]
  19. Mendonca Costa, C.; Prassl, A.J.; Weber, R.; Campos, F.O.; Prassl, A.J.; Dos Santos, R.W.; Sanchez-Quintana, D.; Ahammer, H.; Hofer, E.; Plank, G.; et al. An efficient finite element approach for modeling fibrotic clefts in the heart. IEEE Trans. Biomed. Eng. 2014, 61, 900–910. [Google Scholar] [CrossRef]
  20. Arevalo, H.J.; Vadakkumpadan, F.; Guallar, E.; Jebb, A.; Malamas, P.; Wu, K.C.; Trayanova, N.A. Arrhythmia risk stratification of patients after myocardial infarction using personalized heart models. Nat. Commun. 2016, 7, 11437. [Google Scholar] [CrossRef]
  21. Gao, Y.; Gong, Y.; Xia, L. Simulation of atrial fibrosis using coupled myocyte-fibroblast cellular and human atrial models. Comput. Math. Methods Med. 2017, 2017. [Google Scholar] [CrossRef]
  22. Mangion, K.; Gao, H.; Husmeier, D.; Luo, X.; Berry, C. Advances in computational modelling for personalised medicine after myocardial infarction. Heart 2018, 104, 550–557. [Google Scholar] [CrossRef] [PubMed] [Green Version]
  23. Majumder, R.; Pandit, R.; Panfilov, A.V. Turbulent electrical activity at sharp-edged inexcitable obstacles in a model for human cardiac tissue. Am. J. Physiol. Heart Circ. Physiol. 2014, 307, H1024–H1035. [Google Scholar] [CrossRef] [PubMed] [Green Version]
  24. Nayak, A.R.; Shajahan, T.K.; Panfilov, A.V.; Pandit, R. Spiral-wave dynamics in a mathematical model of human ventricular tissue with myocytes and fibroblasts. PLoS ONE 2013, 8. [Google Scholar] [CrossRef] [PubMed] [Green Version]
  25. Sridhar, S.; Vandersickel, N.; Panfilov, A.V. Effect of myocyte-fibroblast coupling on the onset of pathological dynamics in a model of ventricular tissue. Sci. Rep. 2017, 7, 1–12. [Google Scholar] [CrossRef] [Green Version]
  26. Kudryashova, N.; Nizamieva, A.; Tsvelaya, V.; Panfilov, A.V.; Agladze, K.I. Self-organization of conducting pathways explains electrical wave propagation in cardiac tissues with high fraction of non-conducting cells. PLoS Comput. Biol. 2019, 15, e1006597. [Google Scholar] [CrossRef] [Green Version]
  27. McDowell, K.S.; Arevalo, H.J.; Maleckar, M.M.; Trayanova, N.A. Susceptibility to arrhythmia in the infarcted heart depends on myofibroblast density. Biophys. J. 2011, 101, 1307–1315. [Google Scholar] [CrossRef] [Green Version]
  28. Pertsov, A.M. Scale of Geometric Structures Responsible for Discontinuous Propagation in Myocardial Tissue. In Discontinuous Conduction in the Heart; Futura Publishing Company: Armonk, NY, USA, 1997. [Google Scholar]
  29. Nezlobinsky, T.; Solovyova, O.; Panfilov, A.V. Anisotropic conduction in the myocardium due to fibrosis: The effect of texture on wave propagation. Sci. Rep. 2020, 10, 764. [Google Scholar] [CrossRef]
  30. Anderson, K.P.; Walker, R.; Une, P.; Ershler, P.R.; Lux, R.L.; Karwandee, S.V. Myocardial electrical propagation in patients with idiopathic dilated cardiomyopathy. J. Clin. Investig. 1993, 92, 122–140. [Google Scholar] [CrossRef] [Green Version]
  31. ten Tusscher, K.H.W.J. Alternans and spiral breakup in a human ventricular tissue model. AJP Heart Circ. Physiol. 2006, 291, H1088–H1100. [Google Scholar] [CrossRef]
  32. Tusscher, K.H.W.J.T.; Panfilov, A.V. Modelling of the ventricular conduction system. Prog. Biophys. Mol. Biol. 2008, 96, 152–170. [Google Scholar] [CrossRef]
  33. Rush, S.; Larsen, H. A practical algorithm for solving dynamic membrane equations. IEEE Trans. Biomed. Eng. 1978, BME-25, 389–392. [Google Scholar] [CrossRef] [PubMed]
  34. Bub, G.; Shrier, A.; Glass, L. Spiral wave generation in heterogeneous excitable media. Phys. Rev. Lett. 2002, 88, 058101. [Google Scholar] [CrossRef] [PubMed]
  35. Spach, M.S.; Miller, W.T.; Dolber, P.C.; Kootsey, J.M.; Sommer, J.R.; Mosher, C.E. The functional role of structural complexities in the propagation of depolarization in the atrium of the dog. Cardiac conduction disturbances due to discontinuities of effective axial resistivity. Circ. Res. 1982, 50, 175–191. [Google Scholar] [CrossRef] [PubMed] [Green Version]
  36. Li, D.; Fareh, S.; Leung, T.K.; Nattel, S. Promotion of atrial fibrillation by heart failure in dogs. Circulation 1999, 100, 87–95. [Google Scholar] [CrossRef] [PubMed] [Green Version]
  37. Zlochiver, S.; Muñoz, V.; Vikstrom, K.L.; Taffet, S.M.; Berenfeld, O.; Jalife, J. Electrotonic myofibroblast-to-myocyte coupling increases propensity to reentrant arrhythmias in two-dimensional cardiac monolayers. Biophys. J. 2008, 95, 4469–4480. [Google Scholar] [CrossRef] [Green Version]
  38. Majumder, R.; Feola, I.; Teplenin, A.S.; de Vries, A.A.; Panfilov, A.V.; Pijnappels, D.A. Optogenetics enables real-time spatiotemporal control over spiral wave dynamics in an excitable cardiac system. eLife 2018, 7, 1–17. [Google Scholar] [CrossRef]
  39. Zuppinger, C. 3D cardiac cell culture: A critical review of current technologies and applications. Front. Cardiovasc. Med. 2019, 6, 1–9. [Google Scholar] [CrossRef] [Green Version]
  40. Pope, A.J.; Sands, G.B.; Smaill, B.H.; LeGrice, I.J. Three-dimensional transmural organization of perimysial collagen in the heart. Am. J. Physiol. Heart Circ. Physiol. 2008, 295, H1243–H1252. [Google Scholar] [CrossRef]
  41. Glashan, C.A.; Androulakis, A.F.; Tao, Q.; Glashan, R.N.; Wisse, L.J.; Ebert, M.; De Ruiter, M.C.; Van Meer, B.J.; Brouwer, C.; Dekkers, O.M.; et al. Whole human heart histology to validate electroanatomical voltage mapping in patients with non-ischaemic cardiomyopathy and ventricular tachycardia. Eur. Heart J. 2018, 39, 2867–2875. [Google Scholar] [CrossRef] [Green Version]
  42. Keldermann, R.H.; Ten Tusscher, K.H.; Nash, M.P.; Hren, R.; Taggart, P.; Panfilov, A.V. Effect of heterogeneous APD restitution on VF organization in a model of the human ventricles. Am. J. Physiol. Heart Circ. Physiol. 2008, 294, 764–774. [Google Scholar] [CrossRef] [Green Version]
  43. Keldermann, R.H.; Ten Tusscher, K.H.; Nash, M.P.; Bradley, C.P.; Hren, R.; Taggart, P.; Panfilov, A.V. A computational study of mother rotor VF in the human ventricles. Am. J. Physiol. Heart Circ. Physiol. 2009, 296. [Google Scholar] [CrossRef] [PubMed] [Green Version]
  44. Panfilov, A.; Keener, J. Re-entry in an anatomical model of the heart. Chaos Solitons Fractals 1995, 5, 681–689. [Google Scholar] [CrossRef]
  45. Vandersickel, N.; Kazbanov, I.V.; Nuitermans, A.; Weise, L.D.; Pandit, R.; Panfilov, A.V. A study of early afterdepolarizations in a model for human ventricular tissue. PLoS ONE 2014, 9, e84595. [Google Scholar] [CrossRef]
Figure 1. An example of the shortest path calculation routine. (A) Left lateral side of the myocardial slab is marked as “activated” and multiple dilation operations are performed. Wave propagates from left to right. Green color indicates activated cells, white and black indicate non-activated cells and fibrosis elements respectively. Red ellipse indicates the very first activated cell on the right side. (B) Starting from the right side activated cell, a number of the dilation operations is performed until any of left side cells is activated. This number N of dilation iterations is taken as the length of the shortest propagation path for the given fibrosis texture. Here, blue color shows activated cells. Red ellipse indicates the very first activated cell on the left side.
Mathematics 08 01352 g001
Figure 2. Traces of the shortest possible path of excitation propagation in the longitudinal (A) and transversal (B) directions in the model of 60% fibrosis with 4-node length elements.
Mathematics 08 01352 g002
Figure 3. Electrical wave propagation in models with structural (panels A,B) and diffuse (panel C) fibrosis. Panels A,B show a myocardial slab with elongated fibrosis texture of linear 3 × 1 × 1 elements of 3 x-node length. Wave propagation in the 3D myocardial slab was initiated on the left lateral surface of the cuboid for the longitudinal propagation (panel A) and on the upper lateral surface for the transversal propagation (panel B). The red color shows activated cells, the gray color indicates non-activated cells and transparent cells within the gray zone indicates fibrosis. Fibrosis density is 60%. Snapshots of excitation propagation are shown at 50 (left panels) and 100 ms (right panels) after excitation onset. The figure illustrates faster excitation propagation for the wavefront co-directed along the elongation of the fibrosis elements. In this case (panel A, longitudinal wavefront), about two times larger part of the myocardial volume is activated at the certain time moments as compared to the wave propagation across the fibrosis elongation (panel B, transversal wavefront). Panel C shows wave propagation in the model with 60% diffuse fibrosis. Here, excitation wave is initiated at the upper surface, and is independent of the wavefront direction. The conduction velocity at diffuse fibrosis is much slower than that at the longitudinal wavefront direction for the elongated obstacles, and is near to that for the transversal wavefront direction (CV = 0.29 mm/ms in panel C versus 0.48 mm/ms in panel A, and 0.24 mm/ms in panel B).
Mathematics 08 01352 g003
Figure 4. Conduction velocity (CV) depending on the fibrosis area in the longitudinal (left) and transversal (right) wavefront directions in a 3D monolayer of 0.25 mm depth (upper, A,B) and a multilayer myocardial slab of 2.50 mm depth (middle, C,D). Error bars show the standard deviation (STD) of the CV in 20 fibrosis pattern samples for each obstacle length. E-F Average wavefront velocities normalized by the values at the diffuse fibrosis of the same percentage for the 3D monolayer (dashed lines) and multilayer models (solid lines).
Mathematics 08 01352 g004
Figure 5. Ratio in the conduction velocity between the longitudinal and transversal wavefront direction as a characteristic of the fibrotic texture anisotropy. Dotted lines show the ratio in the monolayer models, solid lines—in the multilayer models. Error bars show STD for the same model groups as in Figure 4.
Mathematics 08 01352 g005
Figure 6. Fraction of models with failed wave propagation depending on the fibrosis percentage in the mono- (upper panels) and multilayer (lower panels) tissue for longitudinal (panels A,C) and transversal (panels B,D) wavefront direction. Dots show percentage of models, solid lines show approximation by logistic curves.
Mathematics 08 01352 g006
Figure 7. A threshold fibrosis percentage (FP 95 ) for 95% of models with conduction block depending on the fibrosis obstacle length for longitudinal (solid lines) and transversal (dotted lines) wavefront direction in the monolayer (lower red lines) and multilayer (upper blue lines) models.
Mathematics 08 01352 g007
Figure 8. Dependence of the conduction velocity on the obstacle length in mono- (n = 1, blue lines) and multilayer (n = 10, red lines) models at 35% fibrosis for longitudinal (Left) and transversal (Right) wavefront direction.
Mathematics 08 01352 g008
Figure 9. Ratio in the conduction velocities between the average CV for the model with fibrosis of 1 mm (n = 4) obstacle length and the model of diffuse fibrosis (n = 1) of the same percentage. (Left) longitudinal wavefront direction. (Right) transversal direction. The curves show dependences of the ratio on the fibrosis percentage at varying tissue depth from 0.25 to 2.5 mm (1 to 10 z-layers).
Mathematics 08 01352 g009
Figure 10. Normalized histograms of the shortest path for the longitudinal propagation and transversal propagation for n = 4 node length fibrosis and for n = 1 diffuse fibrosis of the same 30% density in the monolayer (upper) and multilayer (lower) models. 5000 shortest possible trajectories calculated in 5000 fibrosis matrices are used for each histogram.
Mathematics 08 01352 g010

