Article

Application of the Kernel Density Function for the Analysis of Regional Growth and Convergence in the Service Sector through Productivity

by
Ronny Correa-Quezada
1,
Lucía Cueva-Rodríguez
2,
José Álvarez-García
3,* and
María de la Cruz del Río-Rama
4
1
Department of Economics, Universidad Técnica Particular de Loja (UTPL), Loja 11-01-608, Ecuador
2
Researcher and Consultant in Economics and Business, Loja 11-01-608, Ecuador
3
Financial Economy and Accounting Department, Faculty of Business, Finance and Tourism, University of Extremadura, 10071 Cáceres, Spain
4
Business Management and Marketing Department, Faculty of Business Sciences and Tourism, University of Vigo, 32004 Ourense, Spain
*
Author to whom correspondence should be addressed.
Mathematics 2020, 8(8), 1234; https://doi.org/10.3390/math8081234
Submission received: 23 June 2020 / Revised: 24 July 2020 / Accepted: 24 July 2020 / Published: 27 July 2020
(This article belongs to the Special Issue Mathematical Modeling of Socio-Economic Systems)

Abstract

:
The aim of this research work is to analyze growth and convergence processes in the service sector and its large groups, market, and non-market services, at the regional level in Ecuador by taking the labor productivity variable as a reference. The methodology used is an analysis of distributive dynamics of the data, applying the non-parametric method of Kernel density functions from a mathematical economics approach. The results obtained show that the service sector has non-alarming levels of inequality, its trend over time is increasing. When disaggregating the data, it was observed that non-market services show a rapid growth in inequality. In contrast, market services show greater stability during the period analyzed. Regarding intra-distribution dynamics for the service sector and its subsectors, in the long term, poor regions improve, while rich regions deteriorate. However, deterioration of advanced regions is less intense in non-market services.

1. Introduction

Historically, economic development was based on production generated by the agricultural and mining sector, later and for decades, manufacturing production began to play an important role in economic analysis [1,2]; consequently, analysts and policy makers had little or no concern about services, as the participation of this sector in the economy was not representative, since it was not considered adequate to generate wealth and economic development [3]. However, the continuous expansion of services in recent decades has changed the traditional economic structure. In this regard, Maroto-Sánchez [4] states that, at the beginning of the 21st century, heavily industrialized economies became “service economies”.
According to Bonet [5], the sectoral structures of developing economies have also reflected outsourcing; thus, as nations show greater economic development, the sectoral composition is experiencing significant tertiary participation. According to the World Development Indicators available from the World Bank [6], in 2017, the added value of services as a percentage of gross domestic product (GDP) for the group of low-income countries was 38%, middle-income countries register 54%, and high-income countries 70%. In the Ecuadorian case, that same year (2017), the share of the added value of services in GDP was 51%. These figures clearly suggest that the sectoral structure has changed, aimed at the relevance of tertiary activities.
Undoubtedly, the Ecuadorian economy is not the exception. Therefore, and based on the above, it is of interest for this research to study growth and convergence processes at the regional level in the tertiary sector, taking the productivity variable as a reference. In this regard, the aim is to analyze whether low productivity provinces are growing faster than high productivity provinces (convergence hypothesis). Although traditionally convergence studies have been carried out with aggregate variables such as GDP per capita, the most recent studies have already focused on analyzing the hypothesis of labor productivity convergence disaggregated at the sectoral level, although emphasizing on the manufacturing sector [7]. Therefore, the novelty of this study lies in filling the gap of investigating growth and convergence through the labor productivity variable in the tertiary sector, as well as using the Kernel method that allows for the development of models to predict the spatial behavior of the dependent variable, which is dependent on the independent ones.
Regarding the concept of convergence, according to Rabanal [8], convergence is understood as the inverse relationship between the growth rate of per capita income and its initial value, for a given set of regions and in a given period of time. The conventional way of analyzing and measuring convergence had limitations, in this regard, and to summarize, Quah [9,10] points out that the results in favor of the convergence hypothesis are a consequence of the classic Galton fallacy and that the repetitive 2% convergence rate throughout many studies is the result of a unit root process. In this context, Quah [10] suggests performing an analysis of the evolutionary dynamics of distribution data as an alternative.
Therefore, non-parametric techniques analyze the distribution of sector productivity data in 21 of the 24 Ecuadorian provinces. The provinces of Santa Elena, Santo Domingo de los Tsáchilas, and Galápagos have been omitted, the first two provinces because they were founded in 2007 and, therefore, quantitative information is incomplete. Regarding Galapagos, its exclusion responds to the fact that it is located outside the continent, so it does not generate spatial effects. To enrich the study, following the International Standard Industrial Classification (ISIC), tertiary information is broken down into subsectors, market, and non-market services. Market services refer to services that are sold at a certain price and enable to generate profits or economic benefits; on the contrary, non-market services (or not intended for sale) are non-profit tertiary activities that are provided free or almost free [11].
This work is developed in 5 sections. Section 1 corresponds to the Introduction, where the context under which the interest to carry out this research is outlined and the objective is also discussed. The theoretical framework is reviewed in Section 2; where several contributions are made in terms of growth and convergence, such as: traditional concepts and methods of measuring convergence together with its limitations and alternatives (non-parametric techniques), empirical evidence was also carried out. The methodology is discussed in Section 3, where the indicators with their respective calculation formulas and the equations that enable to study the different types of convergence are described in detail. The results are discussed in the penultimate section and finally, the conclusions are explained in Section 5.

2. Theoretical Framework

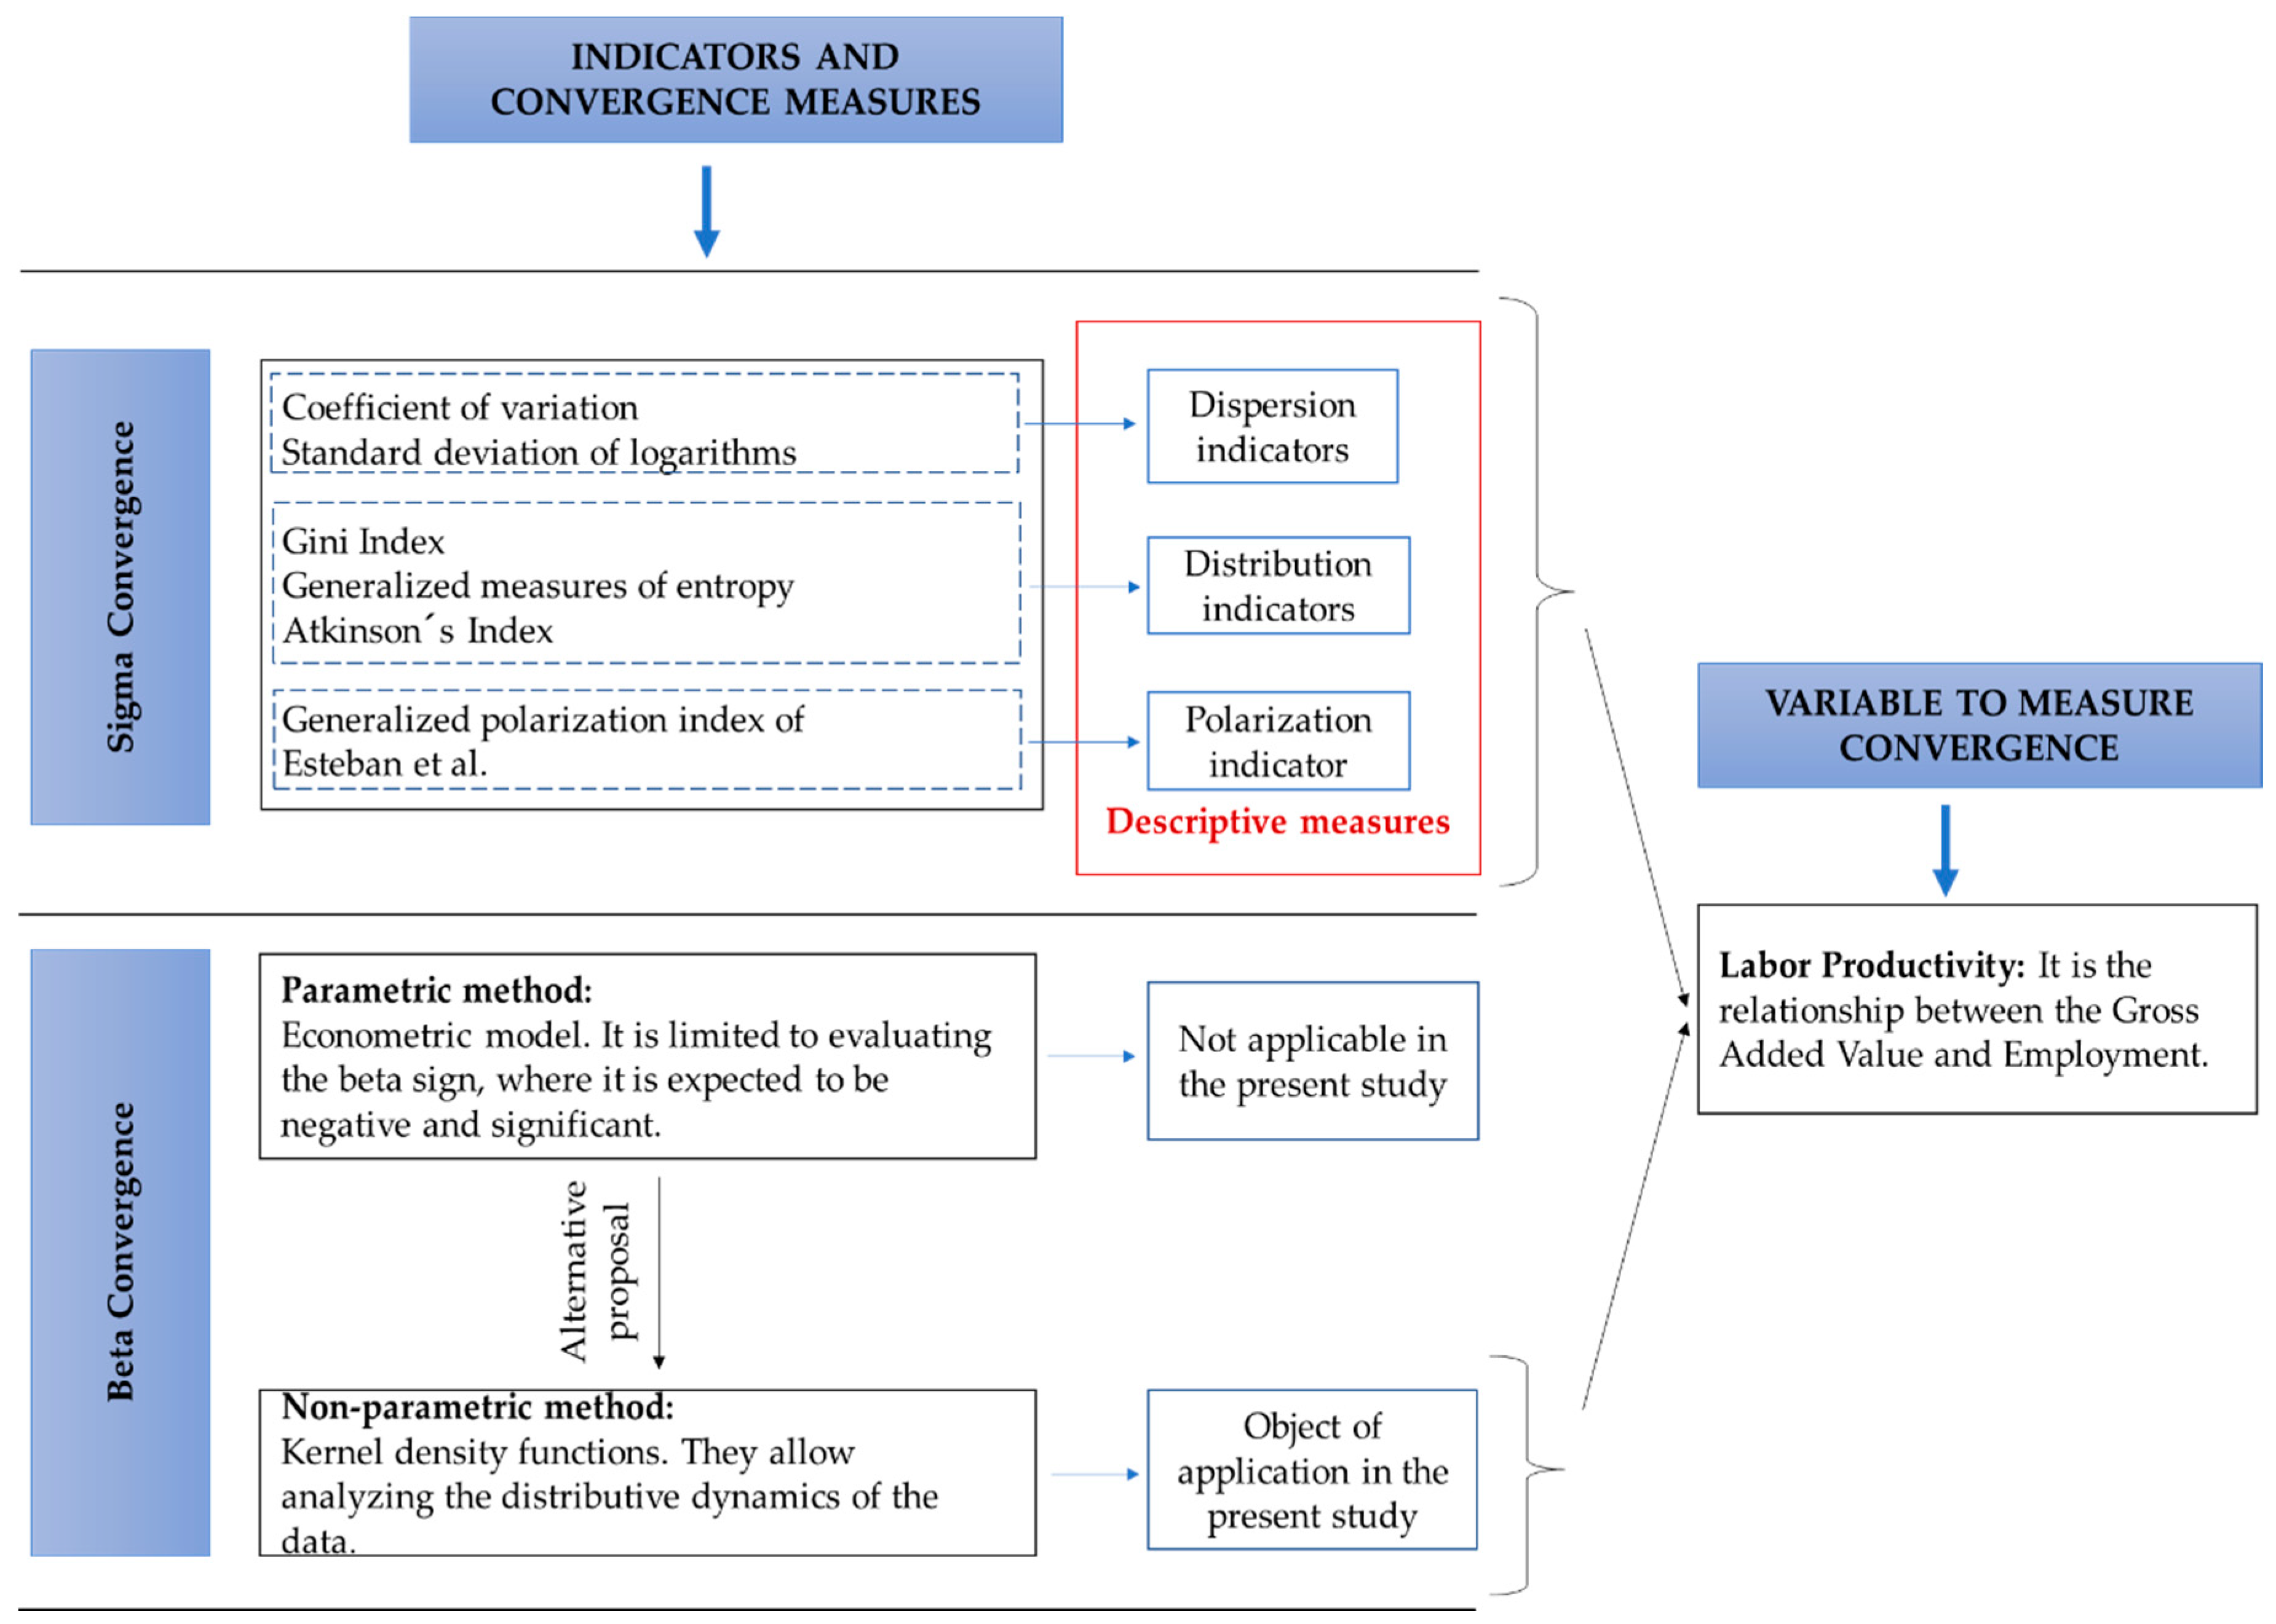
2.1. Dispersion and Distribution Measures to Address Convergence

Before considering convergence, which is described in Section 2.2, the indicators and the variable that will address this concept are described. Figure 1 summarizes the components and the corresponding relationships. Sigma convergence is usually measured by the coefficient of variation and the standard deviation of the logarithms. These indicators allow to examine the dispersion of the data; the smaller they are, the lower the variability of the series and, therefore, the greater the representativeness of their mean. In terms of convergence, the dispersion in the variable of interest, in this case labor productivity, is expected to decrease over time.
The dispersion analysis is complemented by distribution indicators, which allow measuring inequality; therefore, the Gini index (values between 0 and 1, where 0 represents perfect equality and 1 perfect inequality), generalized measures of entropy (the generalized entropy index varies between zero and infinity, reflecting 0 maximum equality), and index are analyzed Atkinson’s (takes values between 0 and 1, where 0 corresponds to maximum equality and 1 to maximum inequality) [8]. Finally, given the compatibility between the decrease in inequality and highly polarized regions, the generalized polarization index (PEGR) is incorporated [8,10]. The calculation of each of these indicators to measure sigma convergence is justified because they are complementary (dispersion, distribution, and polarization) for the calculation of sigma convergence. A more detailed description of their calculation is discussed later in the Methodology.
Regarding beta convergence, this is usually studied through the estimation of an econometric model [8]. However, given the limitations that this method presents [9,10] and that will be presented in more detail later, in the present investigation, the application of an alternative non-parametric proposal is chosen, specifically, the Kernel density curves, which allow analyzing the distributive dynamics of the data. Sigma convergence and beta convergence are evaluated using the variable “labor productivity”.

2.2. Economic Growth and Convergence

The theory of economic growth is usually constructed taking two different approaches as references, which are exogenous and endogenous growth models. In the first approach, Solow [12] and Swan [13] independently developed the neoclassical model. These authors argued that economic growth depends on the intensity of the use of production factors and that in the long term, only the exogenous factor would explain economic growth; their model predicts economic convergence. On the other hand, in the endogenous growth model, its precursors, Romer [14] and Lucas [15] state that the source of long-term growth is determined within the model itself (endogenous variables), and its approach suggests economic divergence, that is, a gap between economies.
Focusing on the convergence hypothesis, certain neoclassical models such as Solow’s [12], maintain that, if the different regions or countries reach a minimum level of development, this will lead them to growth convergence and therefore, in their growth income and product per capita levels [16]. This premise is verified by Barro and Sala-i-Matin [17], who observed that poor regions in several countries grow in per capita terms faster than rich regions and therefore, tend to converge. This relationship is known as absolute convergence.
In the empirical literature regarding growth and convergence, some types of convergence have been proposed. Before specifying them, it is important to know what is meant by convergence. According to Rabanal [8] (p. 116), it is “a proposition according to which there is an inverse relationship between the growth rate of per capita income and its initial level, for a given set of regions or countries and a specific period of time”. Economic convergence can be absolute (or unconditional) and conditional.
According to Galor [18], convergence is absolute when economies converge with each other, regardless of initial conditions, while conditional convergence occurs when per capita income converges between economies that have similar structural characteristics (technology, preferences, etc.), regardless of the initial conditions [19]. In other words, the convergence process is verified in a group of countries that have similar characteristics [20]. According to Barro, Sala-i-Martin, Robinson, and De Espinoza [21], conditional convergence is applied when the growth rate of an economy is related to the distance between the product level and its own stationary state.
In addition to new concepts, by taking the studies of Abramovitz [22], Baumol [23], Romer [14], and Lucas [15] as reference, Barro and Sala-i-Martin [24] proposed two new concepts, sigma convergence (σ) and beta convergence (β). The former measures the transverse dispersion of per capita income, that is, if there is a decrease in time, it is called sigma convergence. The latter is related to the absolute convergence hypothesis and is limited to evaluating the beta sign in an econometric model, where it is expected to be negative and significant. Despite the fact that σ convergence and β convergence are related, they are not the same [16]. β convergence is considered a necessary but not sufficient condition of σ convergence [8].
Quah [9,10] points out some inconsistencies of traditional analysis of convergence. It is demonstrated that the negative correlation observed in the cross-section estimates for the convergence hypothesis are the result of the classic Galton fallacy, but not of the characteristics on the relevant hypothesis (convergence). Furthermore, it is observed that the repeated convergence of 2% found in several studies is the result of a unit root process.
In general, Quah’s criticism maintains that, by focusing on the evolution of one economy compared to another (convergence mechanism), it is not identified how an economy evolves regarding its history (growth mechanism). When the convergence and growth mechanisms are identified, it is possible to identify polarization, persistence, and stratification processes, that is, convergence clubs; this is important because the convergence mechanism can be compatible with highly polarized regional economies [25].
Therefore, this research takes up the non-parametric proposal inspired by an alternative methodology developed by Quah in order to analyze distributive dynamics of productivity data of the service sector and its large groups, market, and non-market services, at the regional level.

2.3. Subsection

In an international context, the literature on growth and convergence is extensive [26,27,28,29,30,31,32,33,34,35]. According to Willington [36], following Baumol [23], empirical evidence on this subject has expanded rapidly, with new criticisms emerging, both theoretical and empirical, while proposing new alternative estimation methods. For Cuervo [37], the great diversity of studies on territorial economic convergence and divergence that exist in Latin America is justified by the political and academic interest that was generated by the work of Barro and Sala-I-Martin and also by some investigations promoted by organizations such as the Inter-American Development Bank (IDB).
Particularly for the Ecuadorian case, the hypothesis of economic convergence and regional asymmetries has not been studied in depth due to the limitations regarding the information available (data restriction) and a weak tradition of Ecuadorian researchers to carry out spatial analyses [38]. Despite this, there are significant contributions that address the concept of convergence. In this regard, Ramón-Mendieta, Ochoa-Moreno, and Ochoa-Jiménez [39] analyze growth, clusters, and convergence in Ecuadorian provinces for the period 1993–2011. The results suggest that despite having evidence in favor of beta convergence, this was not enough to reduce regional disparities. They conclude by arguing that most of the traditional economic clusters did not move or contract. Therefore, emergence of new regions with considerable economic dynamism has been limited.
Likewise, Ramón-Mendieta and Quintana-Romero [40] examine the economic convergence and divergence process in Ecuadorian provinces from a spatial perspective during the period 1993–2011, through the concepts of sigma convergence and beta convergence proposed by Barro and Sala-i-Martin [17], together with an exploratory analysis of spatial data and a spatial estimate of the convergence equation. The results coincide with those found by Ramón-Mendieta et al. [39], confirming the existence of beta convergence, while for sigma convergence, it is not confirmed, since, despite reducing regional disparities, this trend has not been constant over time. Finally, there has been no significant spatial reconfiguration, given that traditional agglomerations have been maintained.
Szeles and Mendieta Muñoz [41] also verify the economic convergence process in Ecuadorian provinces during the period 2007–2014, using parametric and non-parametric techniques. The results indicate absolute and conditional convergence. Regarding the non-parametric analysis, it suggests that Ecuadorian regions are characterized by strong economic heterogeneity. In addition, distribution of GVA (gross value added) continues to be polarized and the group of the richest provinces grows faster than the rest of the provinces, making it more complex to achieve regional convergence in the coming years.
Later, Arias [42] addresses the convergence hypothesis in his work on structural change and regional inequalities in Ecuadorian provinces, for the period 1993–2014. As a methodology, traditional convergence measurements are used together with an analysis of spatial econometrics. Among his findings, a downward trend in sigma convergence stands out, being more evident in the post-dollarization stage. In addition, when breaking down sigma convergence, a configuration of convergence clubs is observed. Regarding beta convergence, the results confirm absolute convergence and conditional convergence processes, being more evident in the labor productivity variable.
Recently, Flores-Chamba, Correa-Quezada, Álvarez-García, and del Río-Rama [43] analyzed the impact of an increase in public expenditure on the regional convergence process, during the period 2001–2015. In this regard, they verify the beta convergence hypothesis conditioned by variables such as public expenditure or investment in infrastructure and education. The results indicate the presence of a “slight” process of convergence per capita and productivity, although with a significant level of territorial “segregation”. In addition, they argue that the public investment made did not generate any significant increase in the productivity of small and medium-sized provinces, conditioning the sustainability of the process of reducing inequalities at the regional level.
On the other hand, Quintana-Romero et al. [25] examine sectoral growth and convergence processes in the provinces of Ecuador for the period 2007–2014. By using non-parametric methods and considering sectoral productivity as an analysis variable, they observe that inequality in terms of productivity is very high in the agricultural sector, at a medium level in the secondary sector, and is less intense in the tertiary sector. In the long term, they conclude that sectoral inequality decreased. However, they specify that there are two different processes over time, so in the first stage, inequality decreases rapidly, while in the second stage, it even increases, especially in the case of the secondary sector.
With a higher regional disaggregation level, Mendieta [44] tests the hypothesis of conditional convergence in Ecuadorian cantons, whereby one of the findings is the canton annual absolute convergence rate of 1.37%, by including conditioning factors such as the illiteracy rate, percentage of homes with electrical supply, average number of children, agricultural production, manufacturing, production, and remittances as a percentage of gross value added. The convergence rate decreases to 1.12%, indicating that the difference in these variables would explain to a large extent, the slow territorial convergence in the Ecuadorian economy. Similarly, Mendieta and Pontarollo [45] analyze cantonal convergence using spatial econometrics and conclude that there is a convergence process that involves the most developed group of cantons, which has an impact on unbalanced spatial development.

3. Methodology

This section reviews the different formulas and equations which are used to calculate the different types of convergence, some measures of dispersion and inequality and finally, the Kernel estimator of conditional distribution that enables to study the productive structure of the service sector and its large groups, market services, and non-market services. The reference variable is productivity, defined by the relationship between production and employment. Production is represented by the proxy gross value added (GVA) variable, which is available in the Regional Accounts of the Central Bank of Ecuador (BCE) [46]. Regarding employment data, these were obtained from the National Employment, Unemployment and Underemployment Surveys (ENEMDU) available from the National Institute of Statistics and Censuses (INEC) [47]. The information was taken for the 2007–2017 period.

3.1. Sigma Convergence (σ)

The σ convergence was analyzed in this work by using alternative indicators proposed by Ezcurra and Rodríguez-Pose [48], since these, according to the authors, capture the heterogeneity existing in the size of the territorial units by assigning a different weight to each observation corresponding to the relative participation of a region in the total population. These indicators were also used in the studies carried out by Quintana and Asuad [49], Quintana, Prudencio and Salas [50], and Quintana-Romero et al. [25].
(a) Coefficient of variation (C):
c = i = 1 n p i ( x i μ ) 2 μ ,
where:
μ = i = 1 n p i x i ;
p i = population participation of region i in a given year;
x i = per capita income.
(b) Standard deviation of logarithms ( v ):
v = i = 1 n p i ( l o g x i μ ˜ ) 2 ,
where:
μ ˜ = i = 1 n p i l o g x i .
As an alternative to dispersion indicators, distribution indicators are used:
(c) Gini index ( G ):
G = i = 1 n j = 1 n p i p j | x i x j | μ .
(d) Generalized measures of entropy (GE):
G E ( θ ) = { 1 θ ( θ 1 ) i = 1 n p i [ ( x i μ ) θ 1 ] θ 0.1 i = 1 n p i l o g ( μ x i ) θ = 0 i = 1 n p i ( x i μ ) l o g ( x i μ ) θ = 1 .
(e) Atkinson Indices (A):
A ( ε ) = { 1 [ i = 1 n p i ( x i μ ) 1 ε ] 1 1 ε ε 1 1 e x p [ i = 1 n p i ( x i μ ) ] = 1 i = 1 n ( x i μ ) p i ε = 1 .
The dispersion and distribution analysis must be complemented with a polarization analysis, since the reduction in dispersion over time can be compatible with polarization processes, in other words, a decrease in inequality can be observed in highly polarized regions [48]. Consequently, the generalized polarization index of Esteban, Gardín, and Ray [51] is analyzed.
(f) Generalized polarization index of Stephen and others (PEGR):
P E G R ( f , α , ρ * , β ) = j = 1 m k = 1 m p j 1 + α p k | μ j μ k | β ( G ( f ) G ( ρ * ) ) ,
where:
μ j is the average income of group j;
p j is the population participation of group j;
α is social sensitivity to polarization;
ρ * is the number of groups in the partition that are obtained by minimizing the Gini index within each group;
G ( f ) G ( ρ * ) is the grouping error;
β is the sensitivity to error.

3.2. Beta Convergence (β)

Regarding beta convergence, Barro and Sala-i-Martin [17,52] and Barro [53] proposed the following econometric model:
l o g ( y _ i t / y _ ( i , t T ) ) = α + β ( l o g ( y ) _ ( i , t T ) ) + u _ i t ,     u _ i t ~ i i d ( 0 , σ ^ 2 ) ,
β = ( 1 e λ T ) / T .
By solving lambda in Equation (8), the rate of convergence is found:
λ = l o g ( 1 + T β ) / T .
Equation (7) was also estimated by adding other control variables, that is, a multiple regression in which the aggregate independent variables act as a proxy for the stationary state, which is what is known in the classical literature as conditional convergence [54,55]. The traditional way of studying convergence has been subject to criticism by Quah, who not only discussed the limitations in his research, but also an alternative approach.
In this regard, Ezcurra and Rodríguez-Pose [48], by following Quah’s methodology regarding intra-distributive mobility, point out that the distribution of regional per capita income in period t has an associated measure of probability, ϕ t , The aim is to find the rule that describes this process over time, { ϕ t , t 0 } . In other words, the aim is to find out the probability that a region will move from a certain income group to another one over time. Therefore, this can be expressed through a first-order dependency process, such that:
ϕ t + 1 = M ϕ t ,
where, M is a transition probability matrix of a first-order Markov process.
Additionally, if for every s 1 , you have that:
ϕ t + s = ( M s ) ϕ t .
The challenge to this approach is that the temporal process depends solely on the previous period of time, since empirical evidence suggests that long-term per capita income does not follow a first-order stationary Markov process [56].
Therefore, alternatively, it was suggested to condition the income distribution to a given initial level and find an estimator of this conditional distribution [57]. In this regard, Hyndman [58] and Hyndman, Bashtannyk and Grunwald [59] propose using a Kernel estimator of conditional distribution:
f ^ ( y | x ) = j = 1 n w j ( x ) 1 b K ( y Y j y b ) ,
where:
f ^ ( y | x ) is the kernel estimator of conditional density;
K the kernel function;
. is a metric distance;
b controls the smoothing of each conditional density in the direction of y;
w j is estimated:
w j ( x ) = K ( x X j a ) / i = 1 n K ( x X i a ) ,
where a controls the smoothing of each conditional density in the x direction.
The use of non-parametric methods in the study of the convergence hypothesis has advantages over conventional parametric methods. According to Borrayo and Castañeda [60], analyses based on non-parametric techniques allow us to observe the coexistence of processes of persistence, divergence-convergence, and mobility in regional growth. On the other hand, the parametric analysis carried out using regression (beta convergence) is limited and tends to observe the behavior of a representative economy, specifically, it provides information on the transition of an economy towards its own stationary state, but not on the intra-distributive dynamics of regions [61]. For this reason, this study analyses the productivity distribution in the service sector and its large groups, market, and non-market services, through Hyndman’s proposal.

4. Data Analysis and Results

A first image of the behavior of productivity data in the service sector and its large groups is obtained from the analysis of some descriptive statistics. Table 1 provides such information. In this regard, the service sector and market services reached the highest levels of productivity in 2017, while their minimum productivity took place in 2007; regarding non-market services, there was minimum and maximum productivity in 2017. Regarding average productivity, it is higher in non-market services than in market services, both at the beginning and at the end of the period analyzed and, in general, the average productivity in the service sector is higher in 2017 than in 2007.
In terms of dispersion, at the beginning of the analysis period, market services show a greater dispersion compared to non-market services. However, this relationship reverts at the end of the period, when non-market services show a greater dispersion. This information coincides with the coefficient of variation.

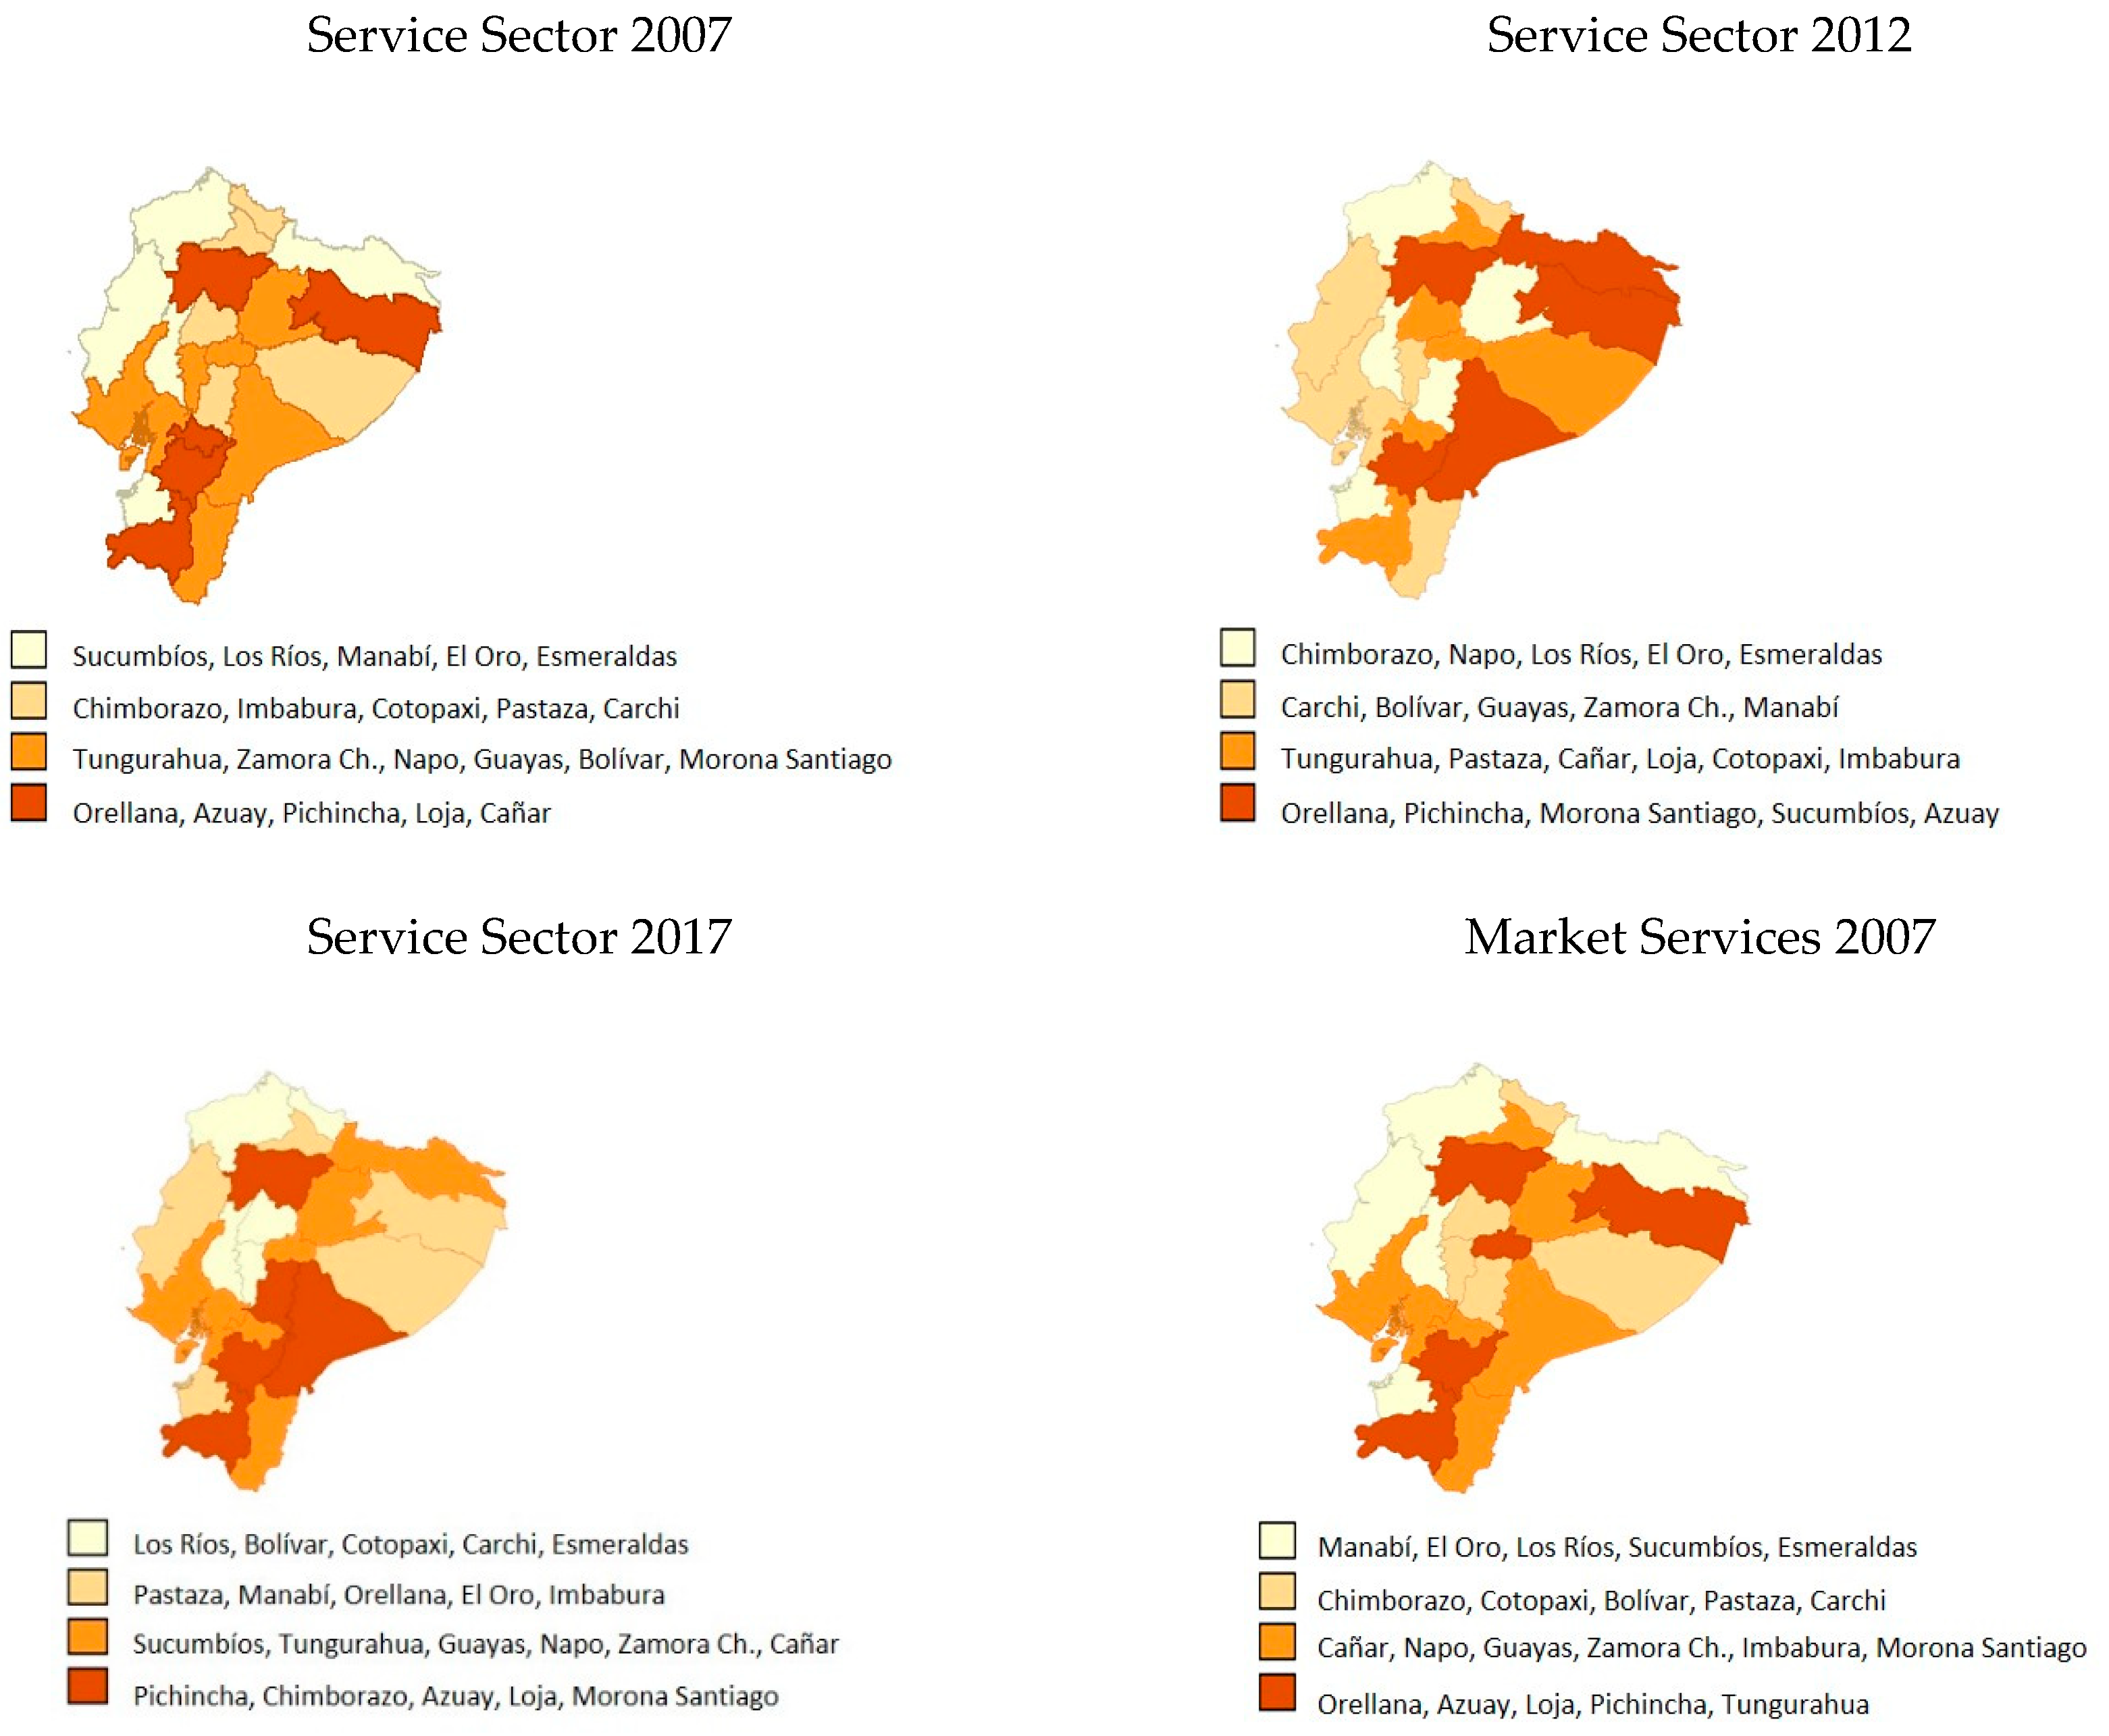
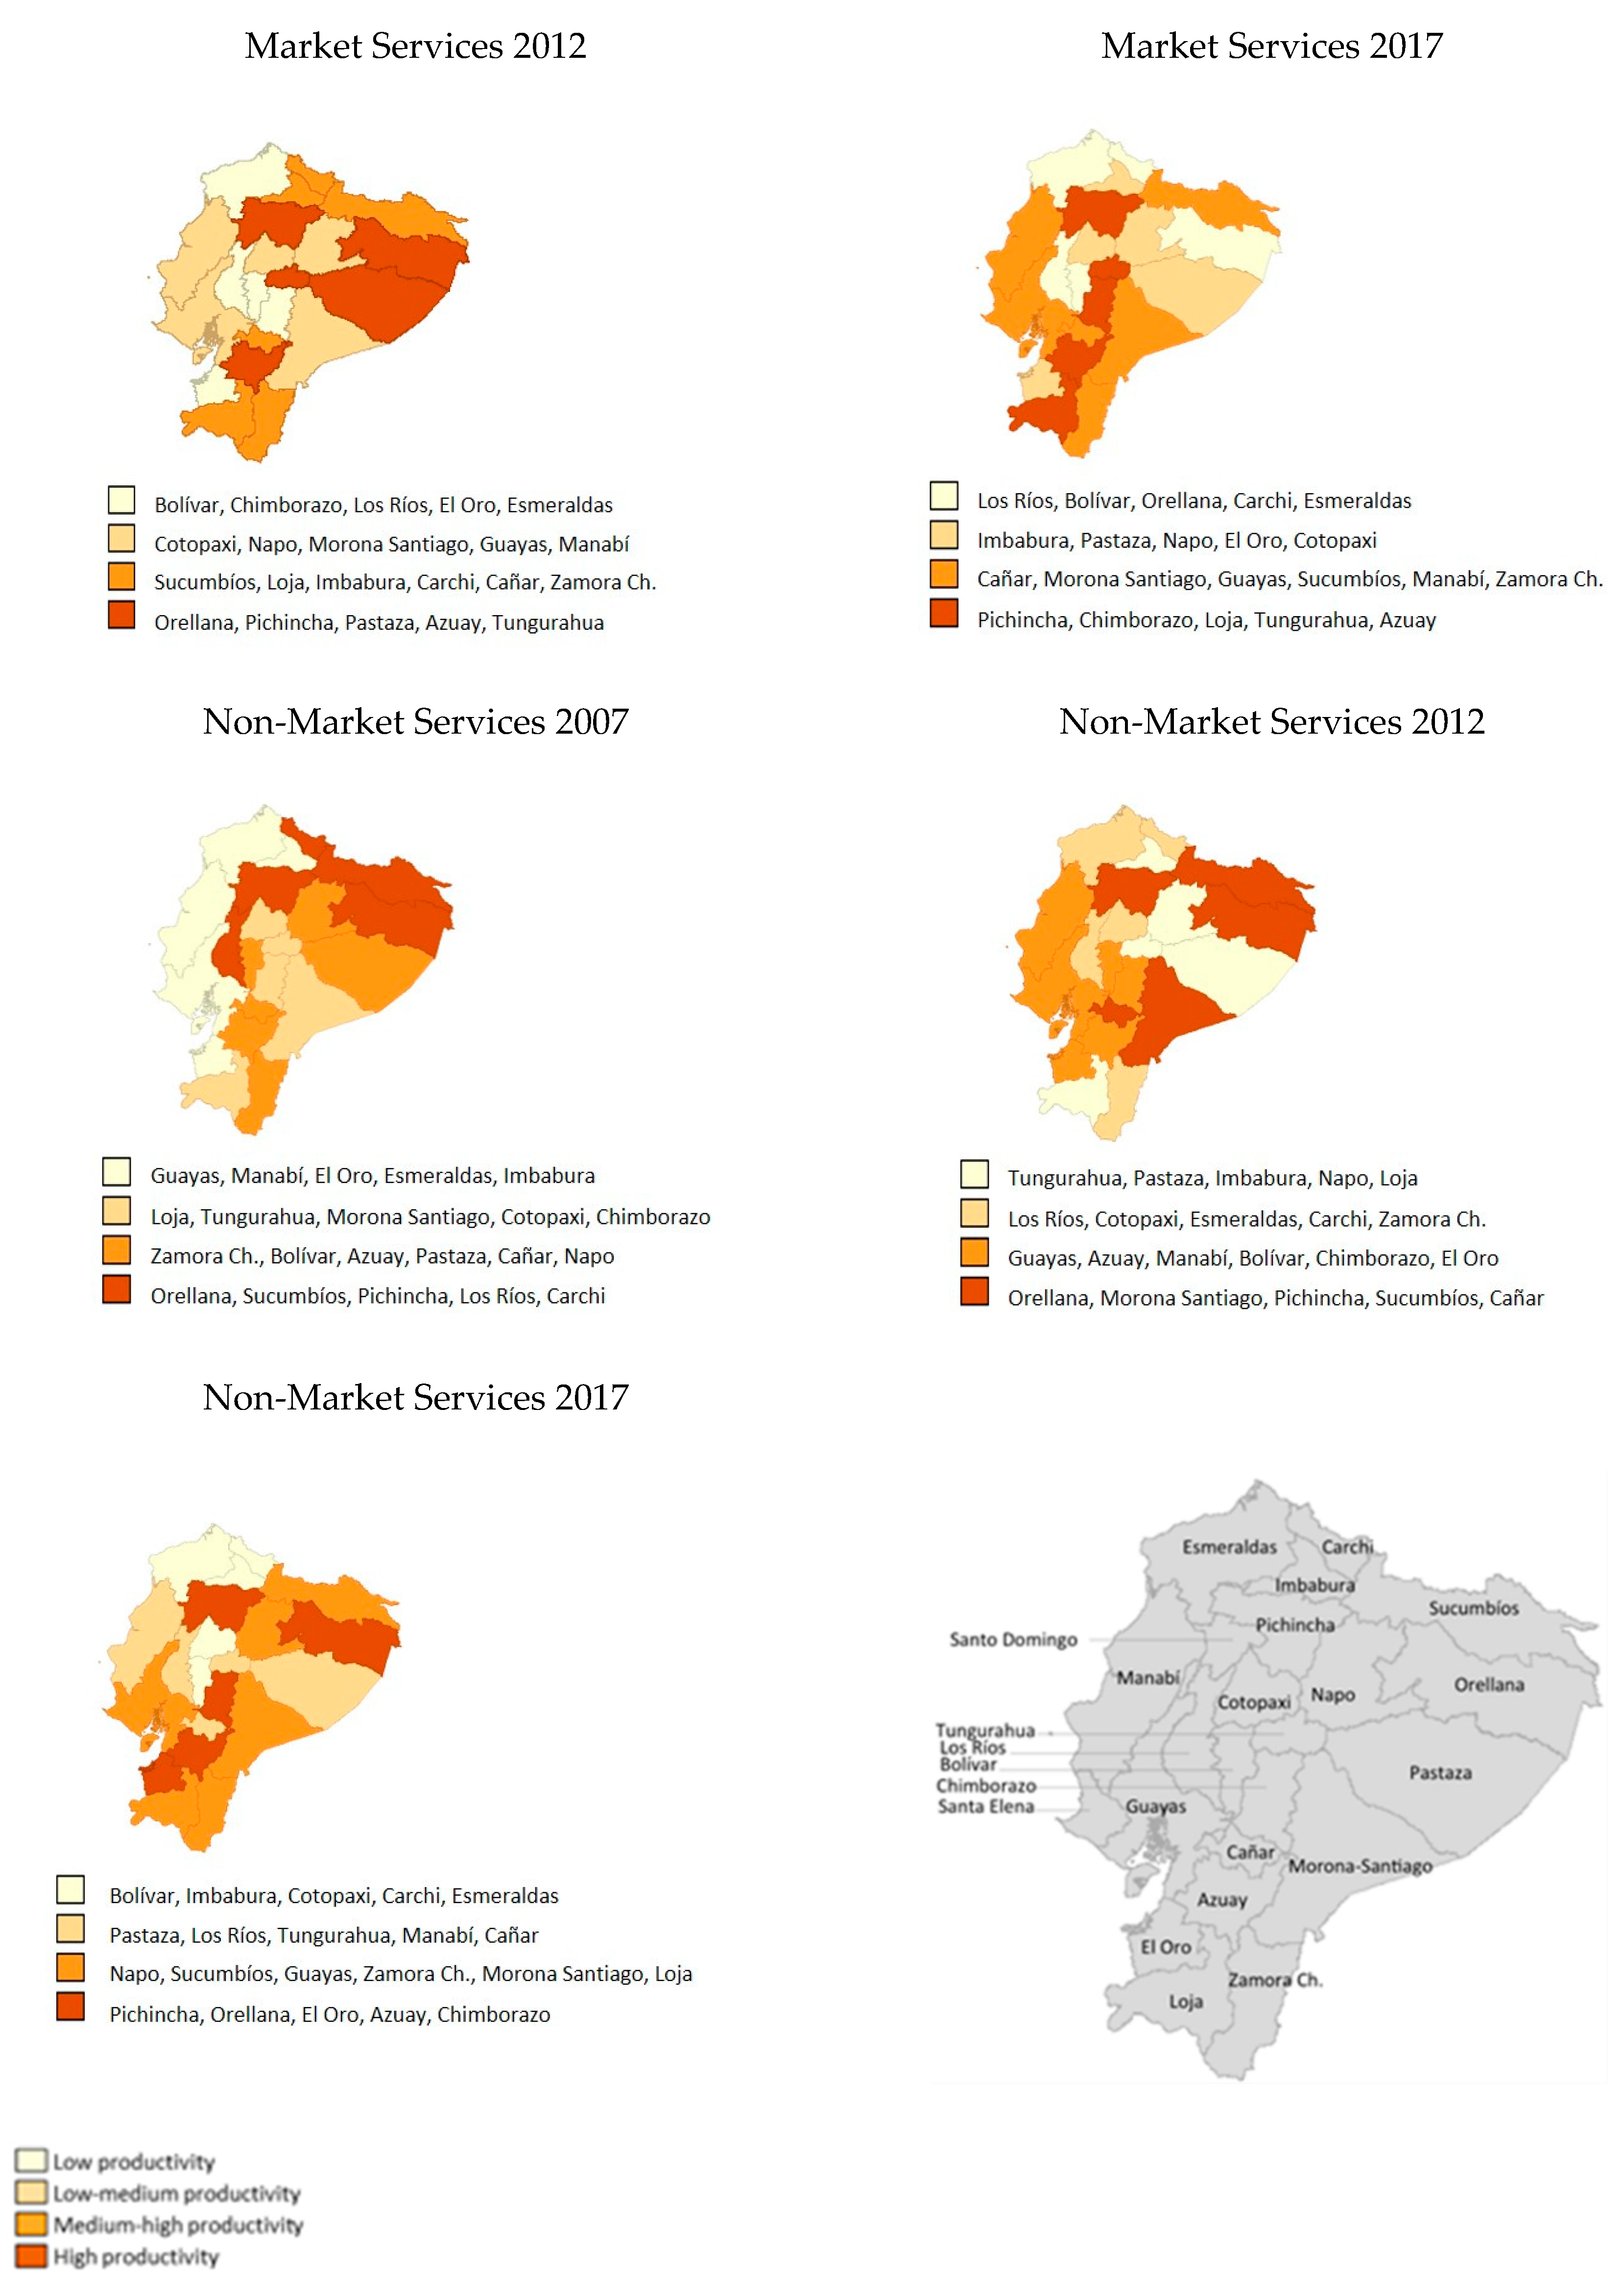
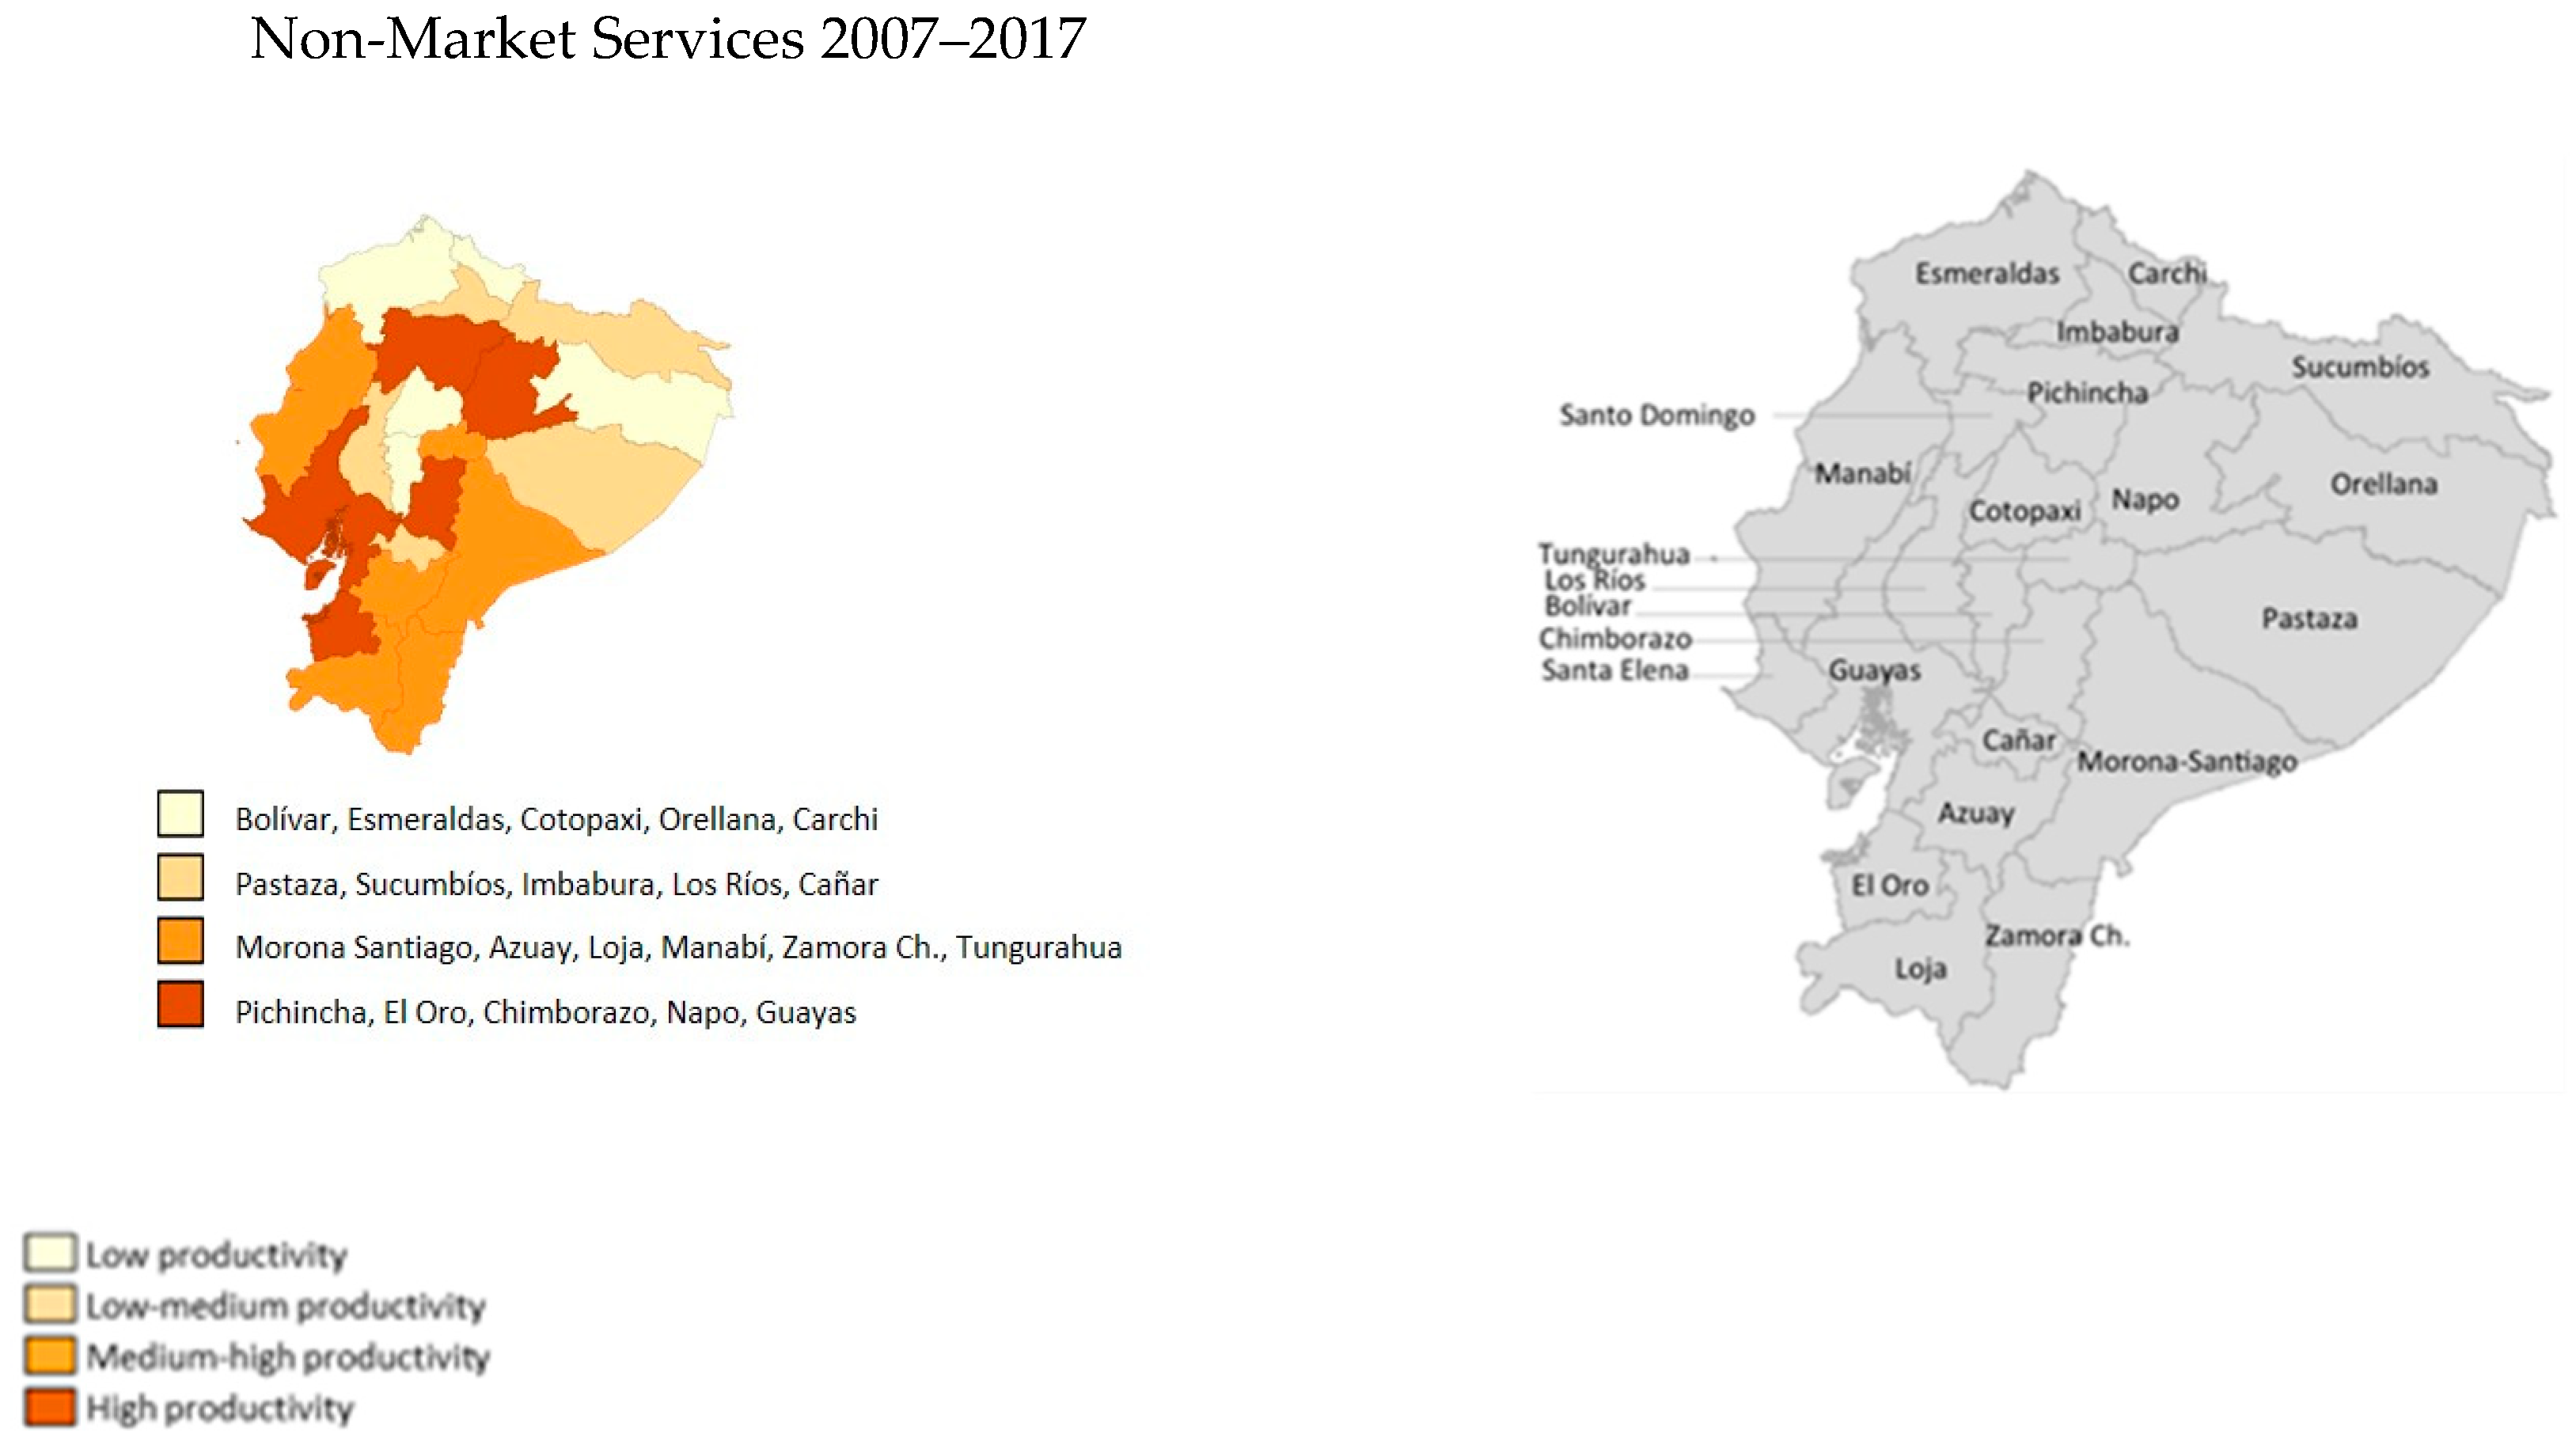
4.1. Sectoral Evolution of Regional Productivity

The sectoral evolution of productivity in Ecuadorian provinces during the study period shows representative shifts (Figure 2). The service sector, initially, showed the strongest productivity levels in the provinces located to the north and south of the Sierra (mountain) region and to the north of the Oriente (east) region. However, at the end of the period, productivity moves to other provinces, mainly located to the south of the aforementioned regions. In market services, at the beginning of the period studied, productivity is concentrated in certain provinces of the Sierra and East regions, in 2017, it is specifically focused on provinces of the Sierra region. As for non-market services, the productivity levels observed in the Costa (coast) region and in certain provinces of the Oriente region cease with time, and at the end of the period analyzed, they are concentrated in provinces of the Sierra and Orellana region (in the Oriente region).
On the other hand, when comparing productivity levels (Figure 1) with their growth rate (Figure 3), it is observed that despite certain provinces having low productivity levels, their growth dynamics is representative, which could suggest that poor provinces are growing faster than rich ones.

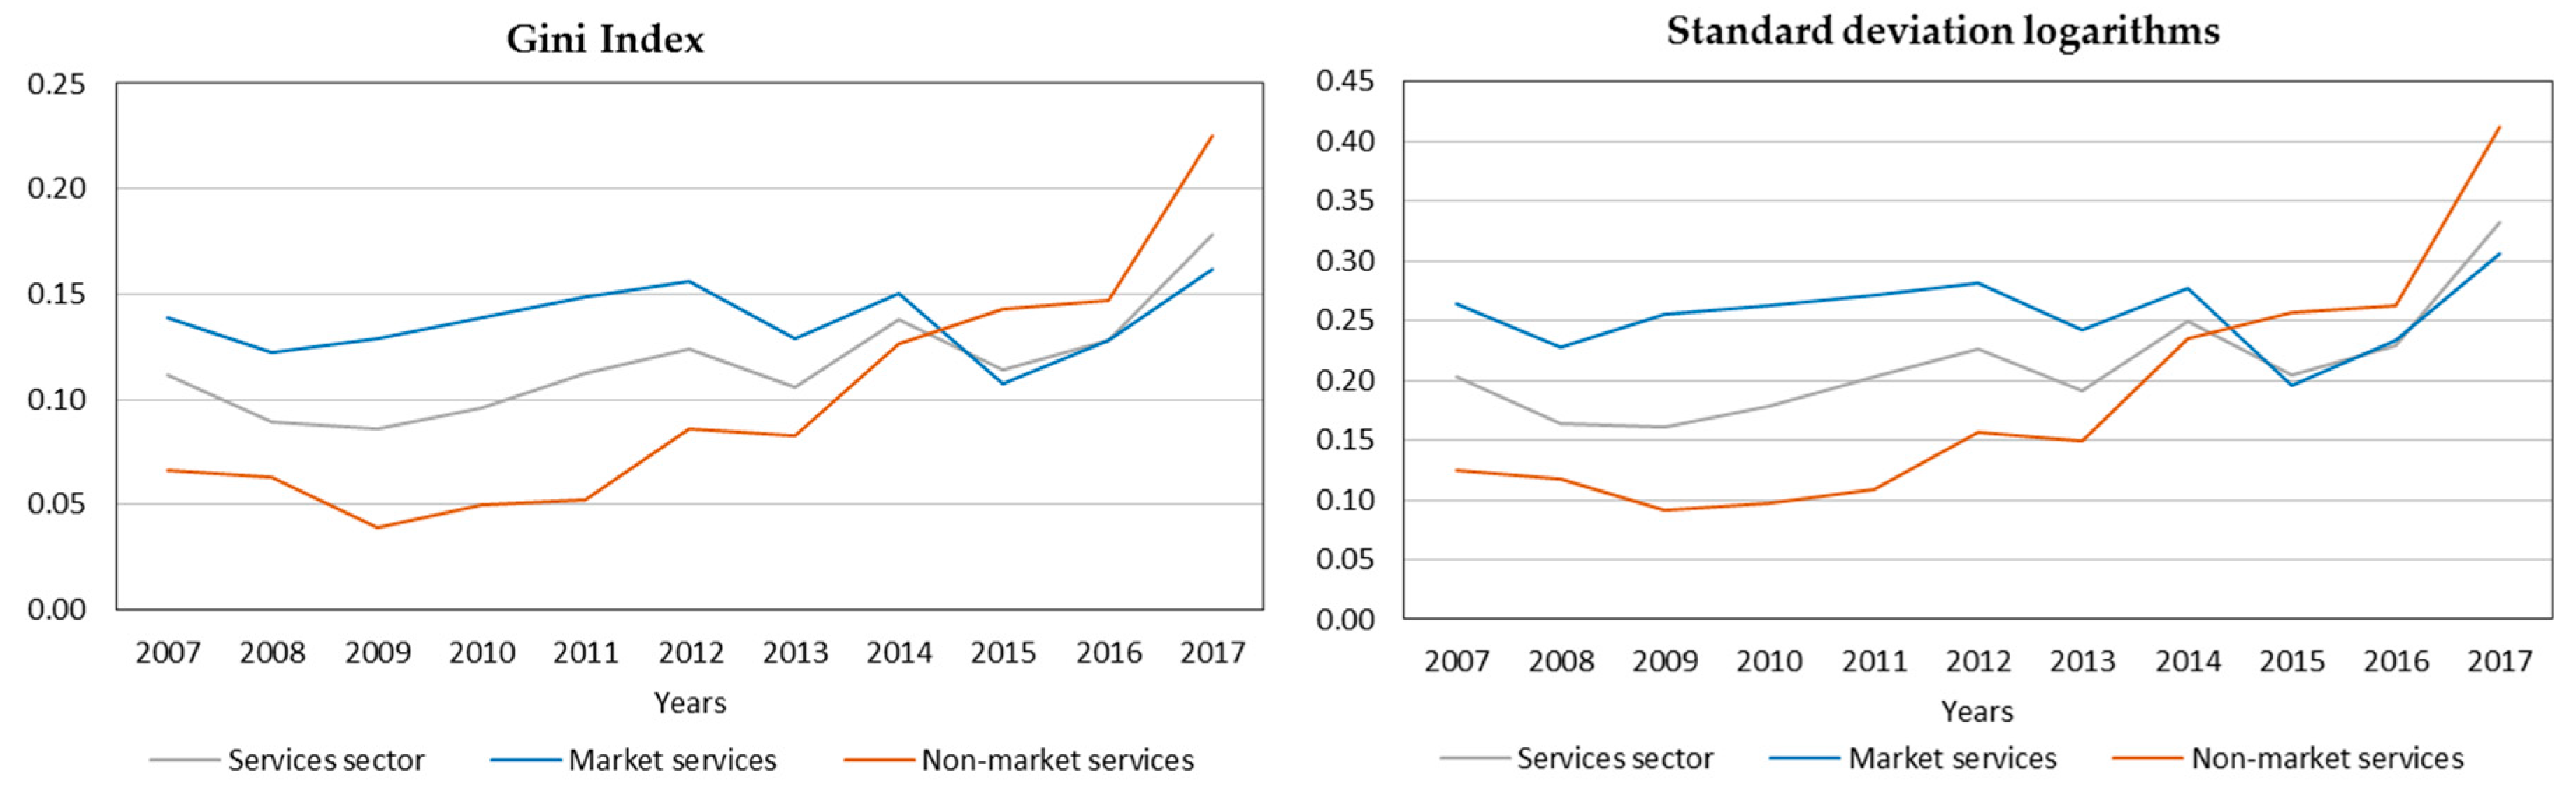
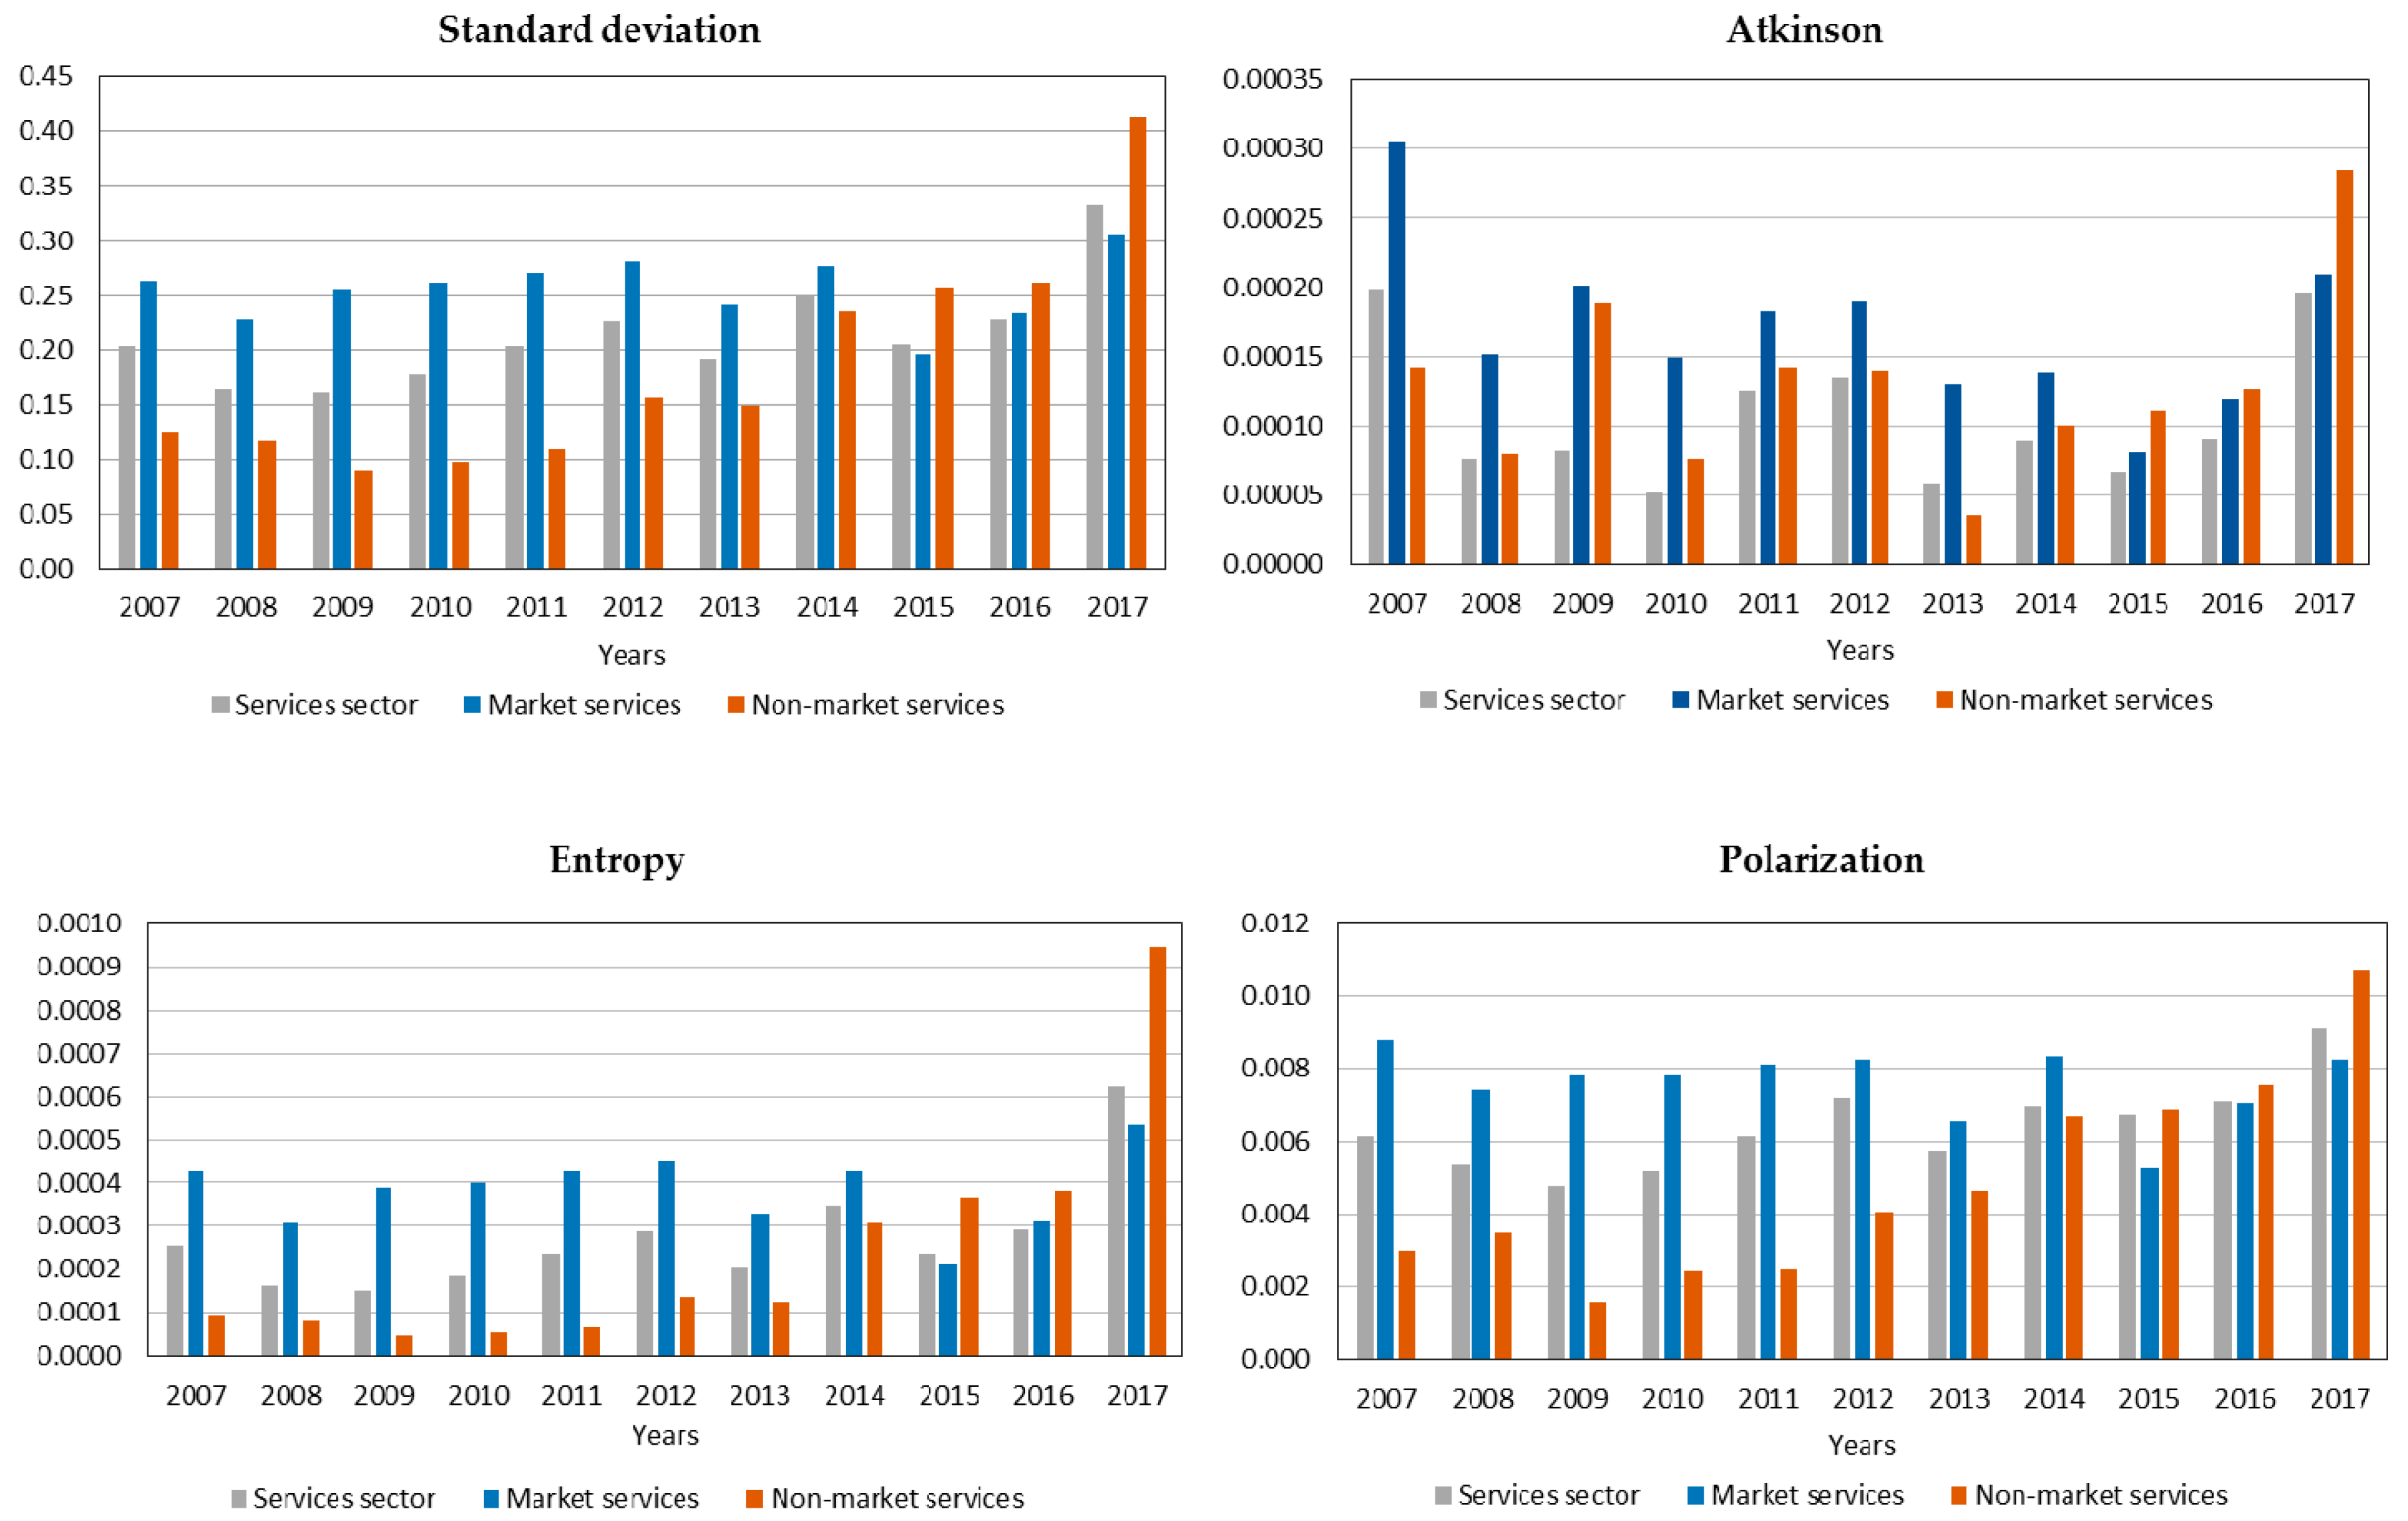
4.2. Gini Index and Sigma Convergence

The results of the analysis of inequality using the Gini index and the study of the sigma convergence hypothesis by means of the evolutionary behavior of the standard deviation of the logarithm of productivity are shown in Figure 4. In general, this sector, the same as its large groups, market, and non-market services, have low inequality levels.
The behavior of the Gini index in the service sector prior to 2015 shows a tendency to decrease, however, from that year the trend reverses. Internally, market services show a more static behavior over time compared to non-market services, which show a rapid growth in inequality. In this regard, between 2014 and 2015, a constant increase in inequality in non-market services converges with market services.
Therefore, after 2015, the growth in inequality observed in the service sector is mainly due to an increase in inequality in non-market services. Regarding the standard deviation, its behavior is similar to the Gini coefficient, which shows that since 2015, dispersion has had a tendency to grow considerably. In general terms, these indicators show that inequality in the service sector and its large groups have increased significantly in the last two years of the period analyzed.
As for the other inequality and polarization indices shown in Figure 5, it can be seen that dispersion until 2015 in market services tends to decrease, later, the trend is reversed; on the other hand, in non-market services, there has been a growing trend since 2007. The regional inequality found in the service sector, despite having low levels, shows an increasing trend over time, being more evident in the non-market service subsector. Regarding the polarization index, it shows a significant increase in non-market services, while in market services, the index is lower at the end of the period analyzed compared to the value initially observed.
Thus, based on the behavior of inequality and polarization indices, it is possible to deduce that in the service sector, in addition to increasing inequality, polarization also increases, and it responds to an increase in polarization in non-market services.

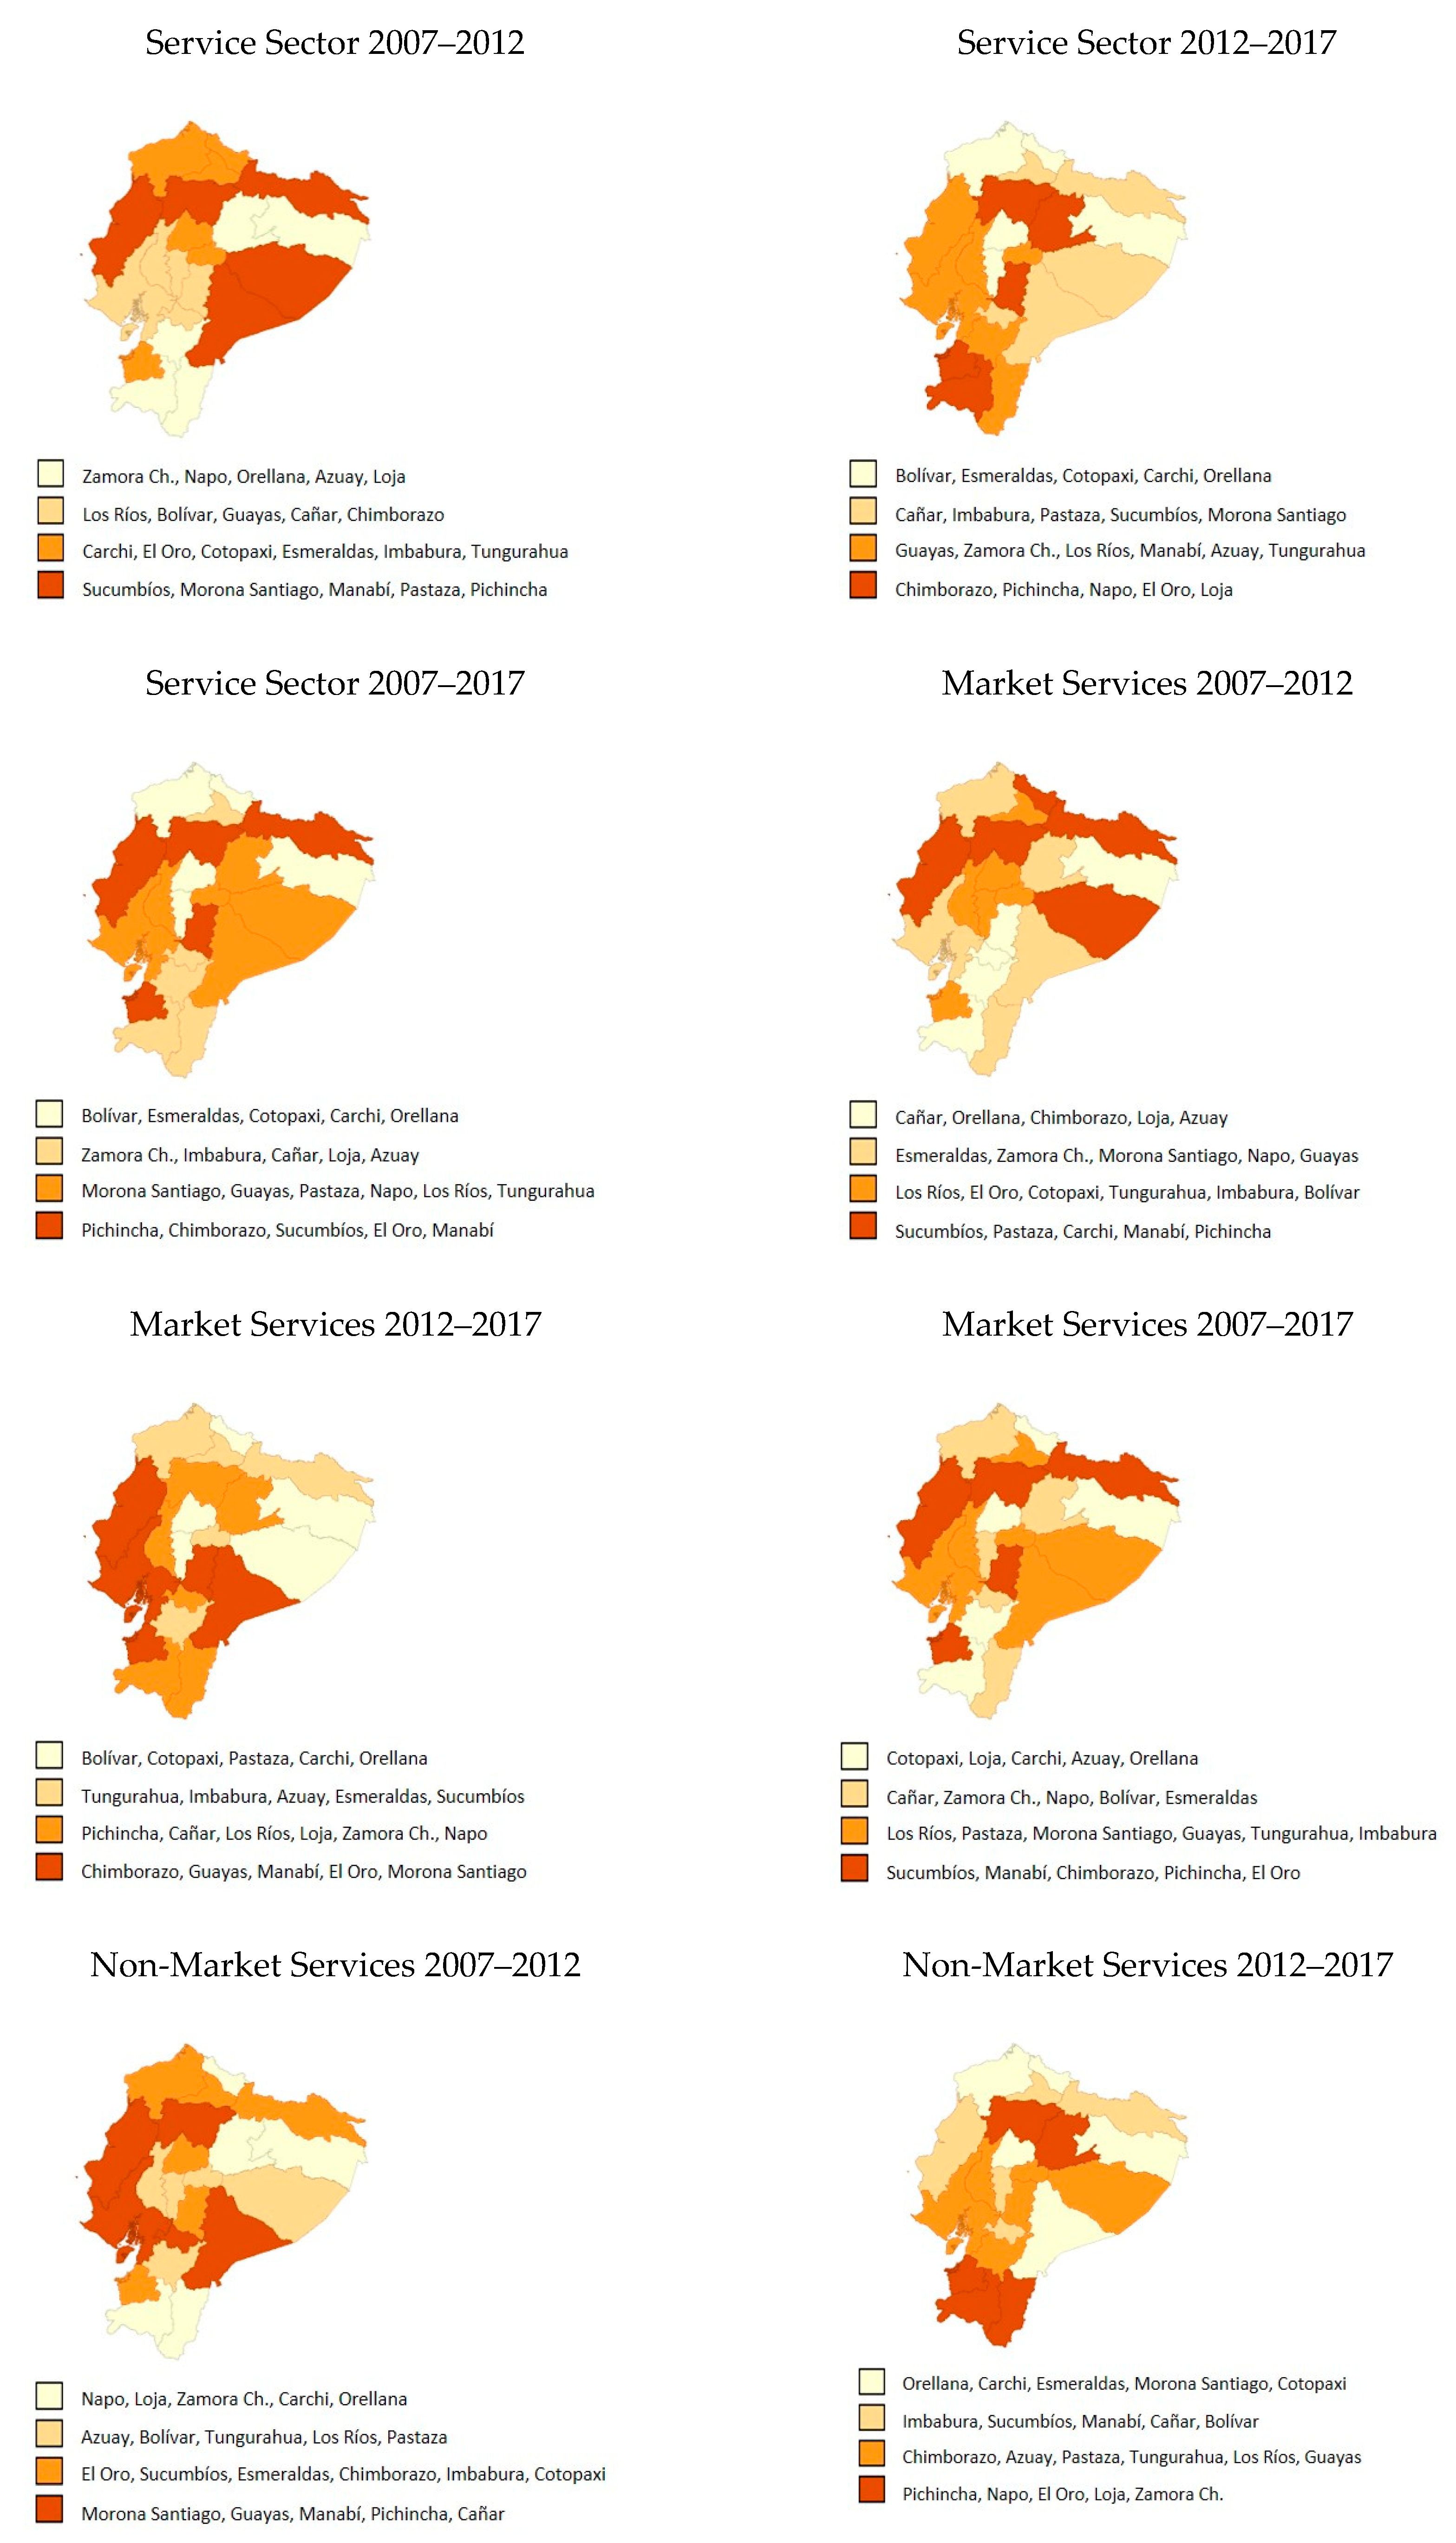
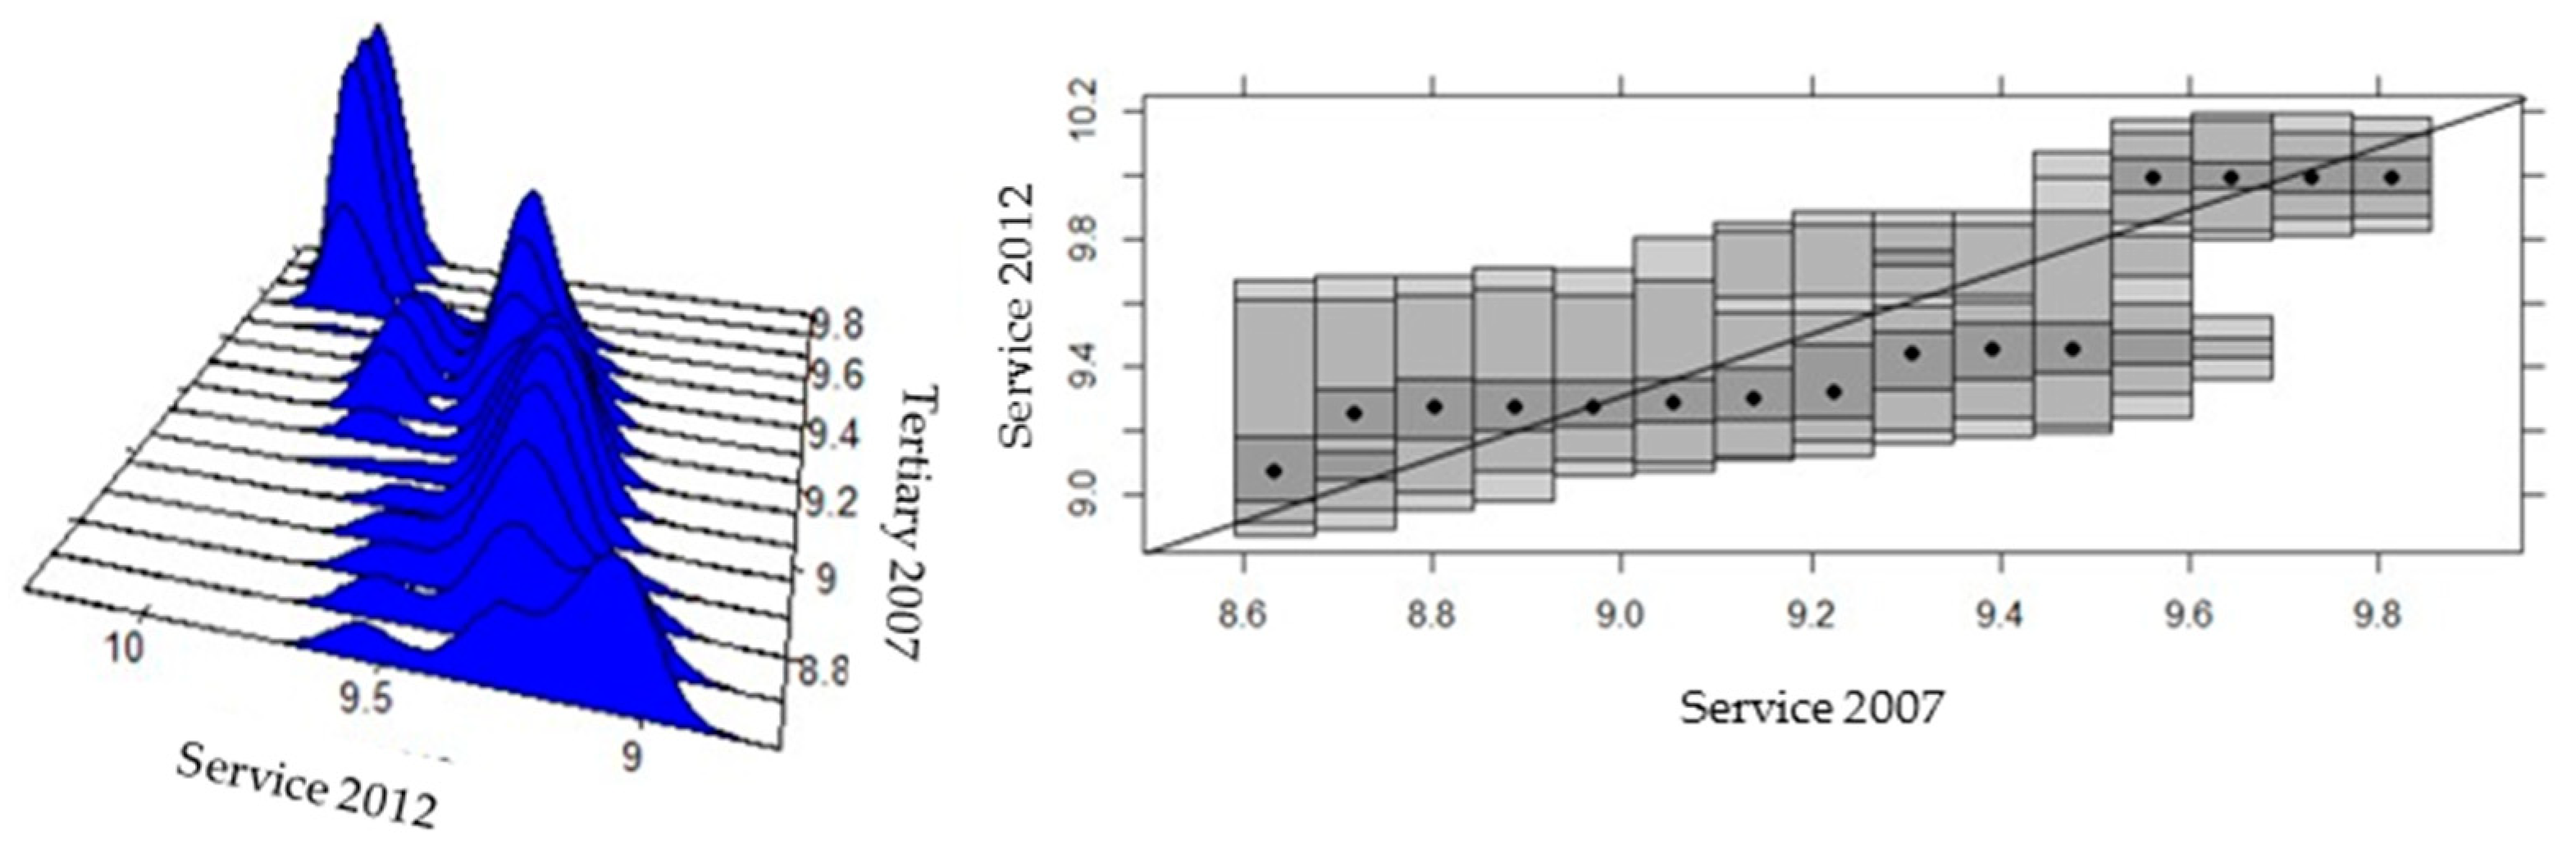
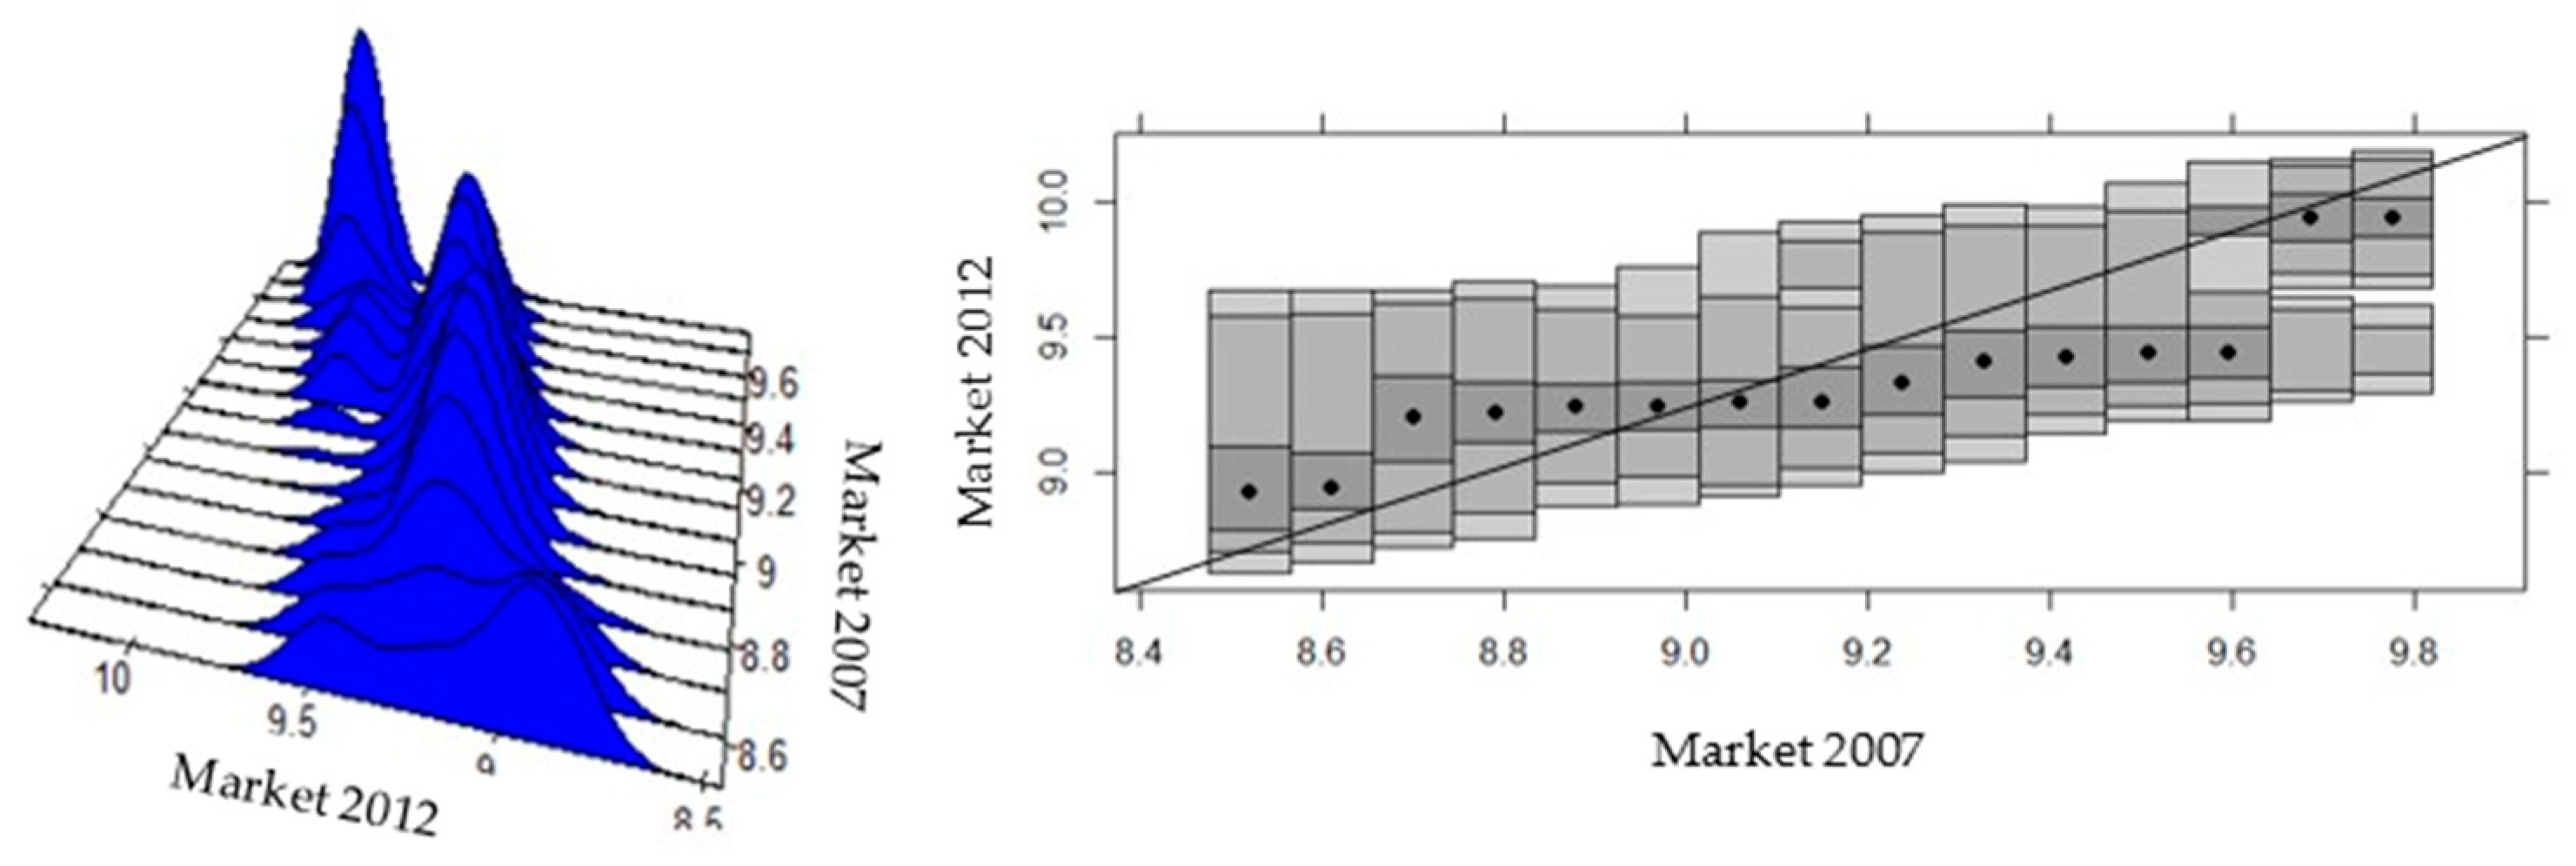
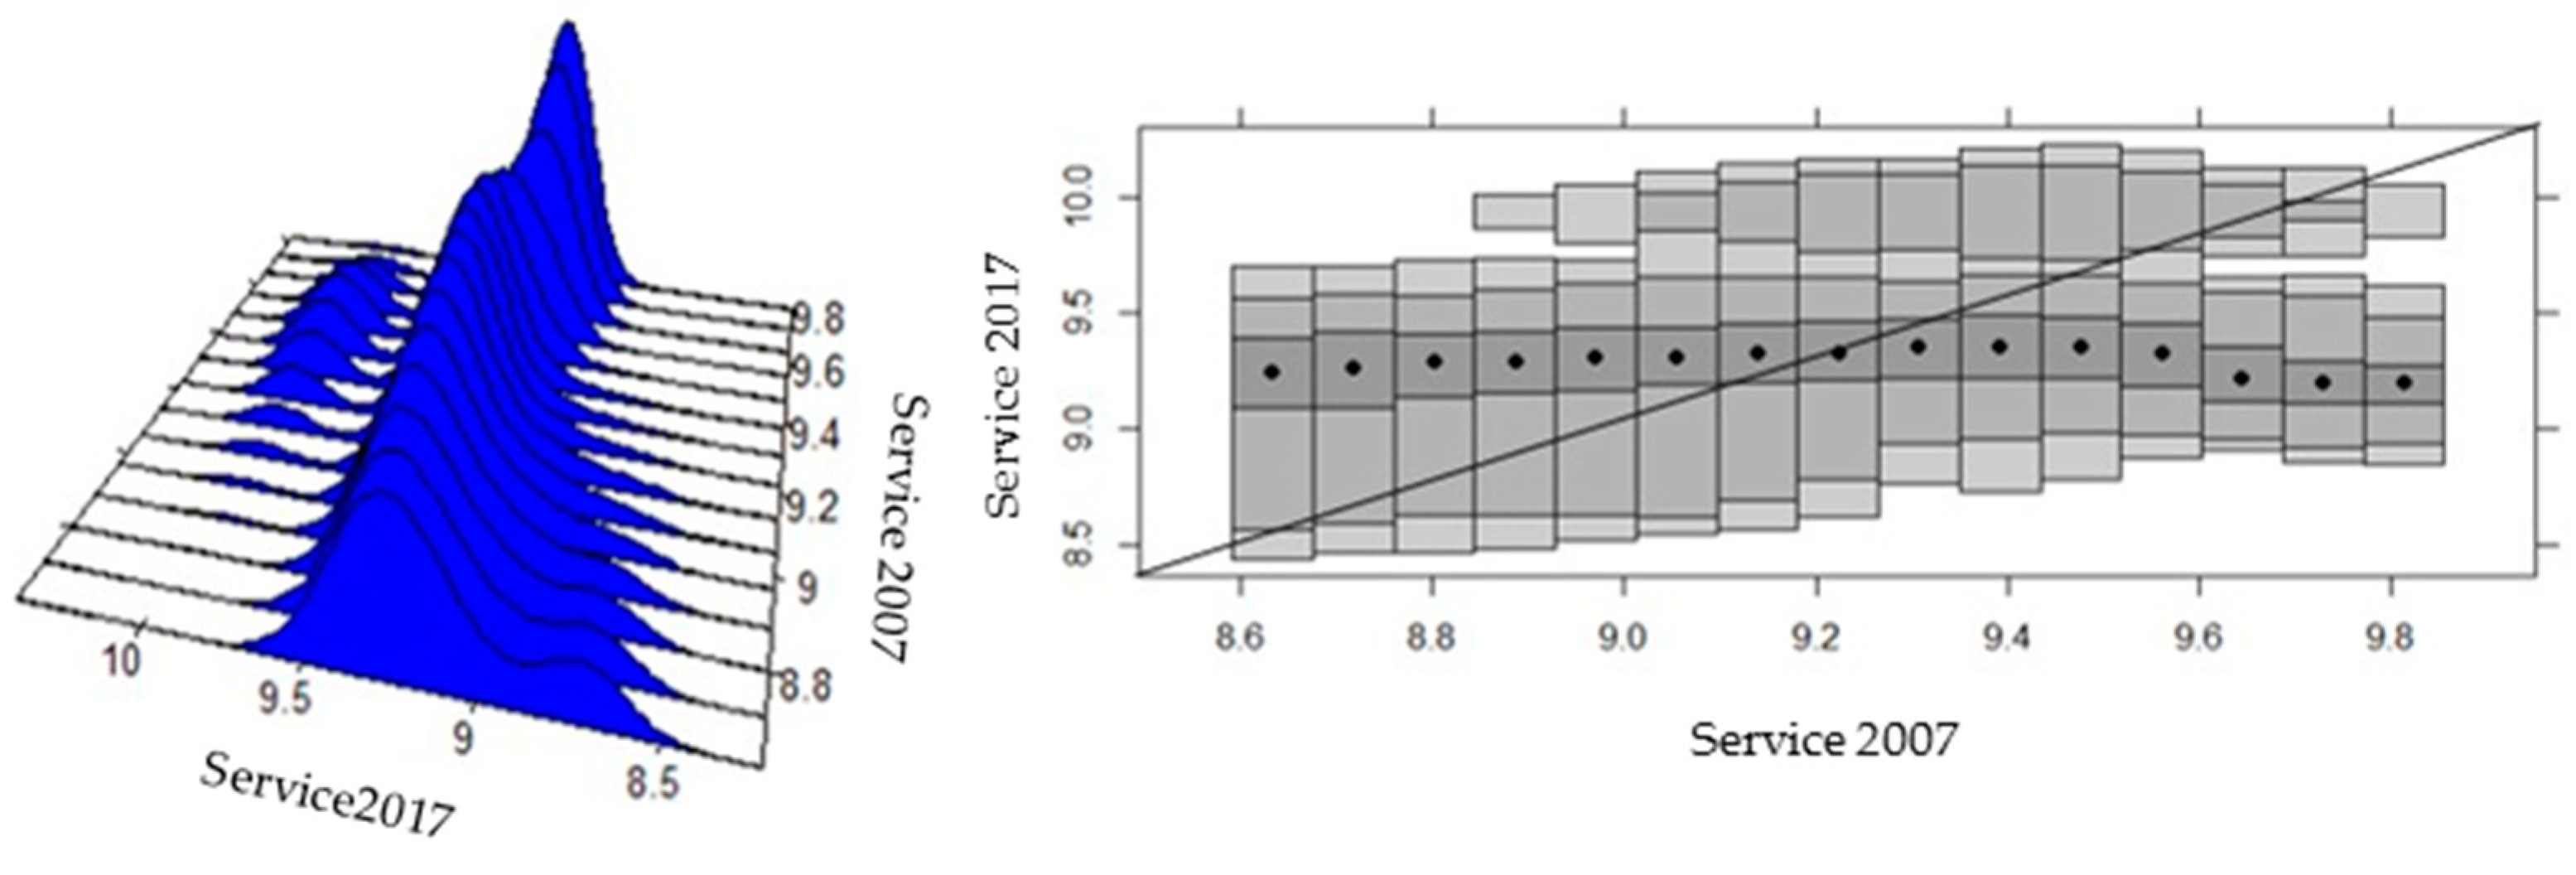
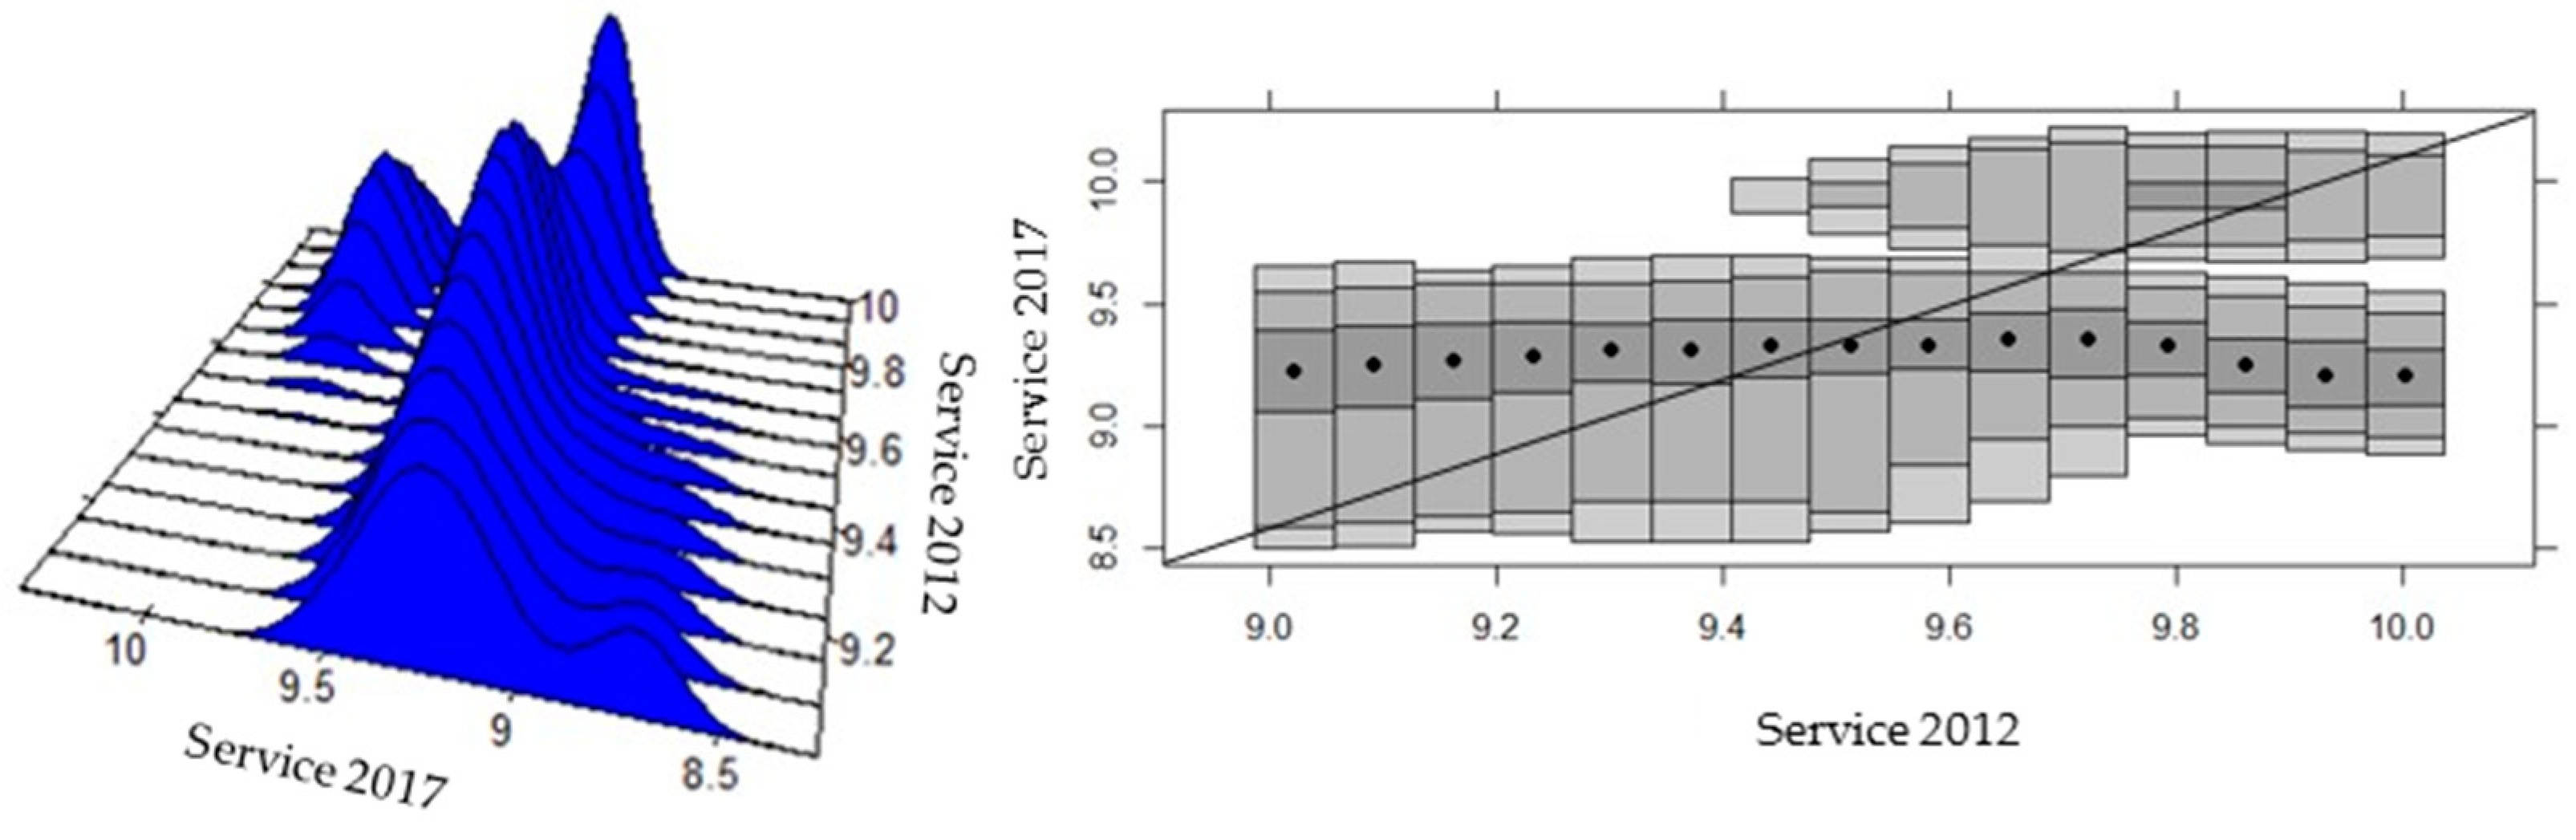
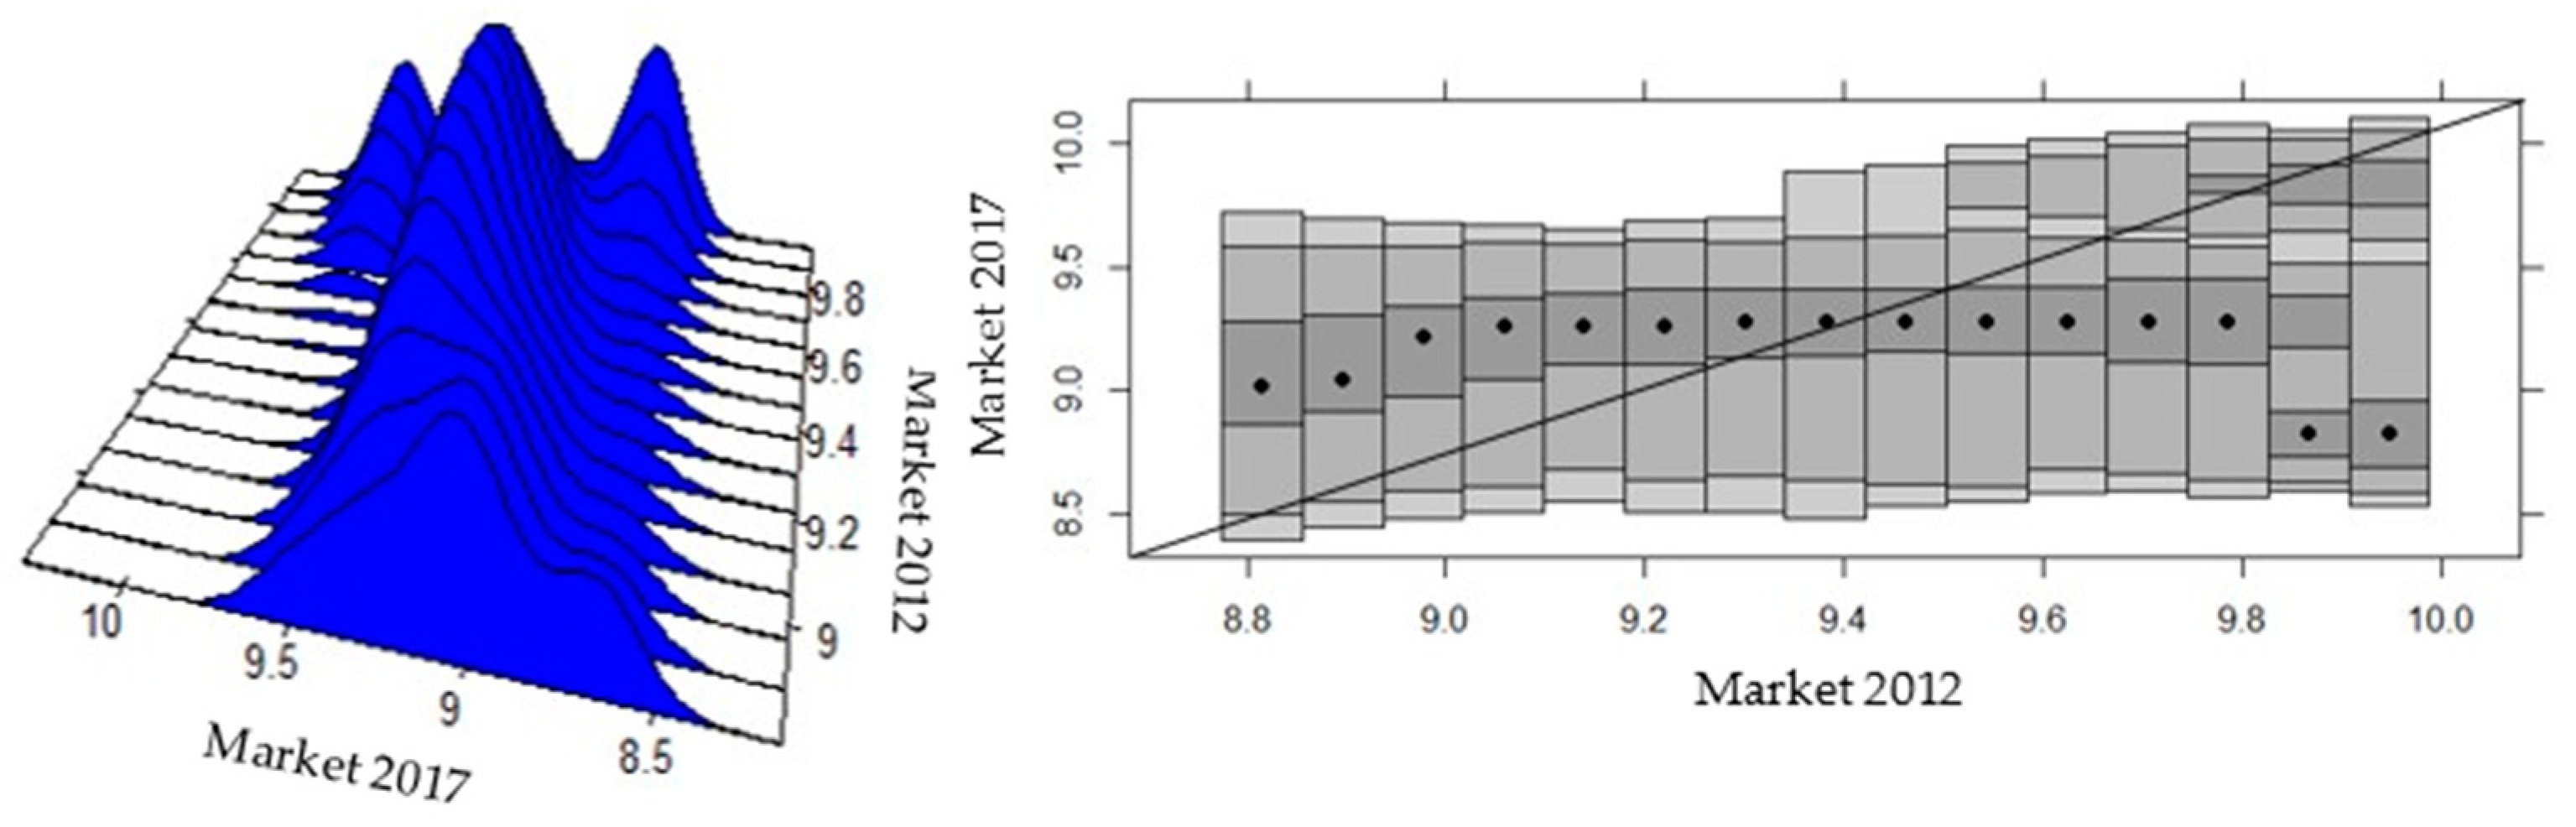
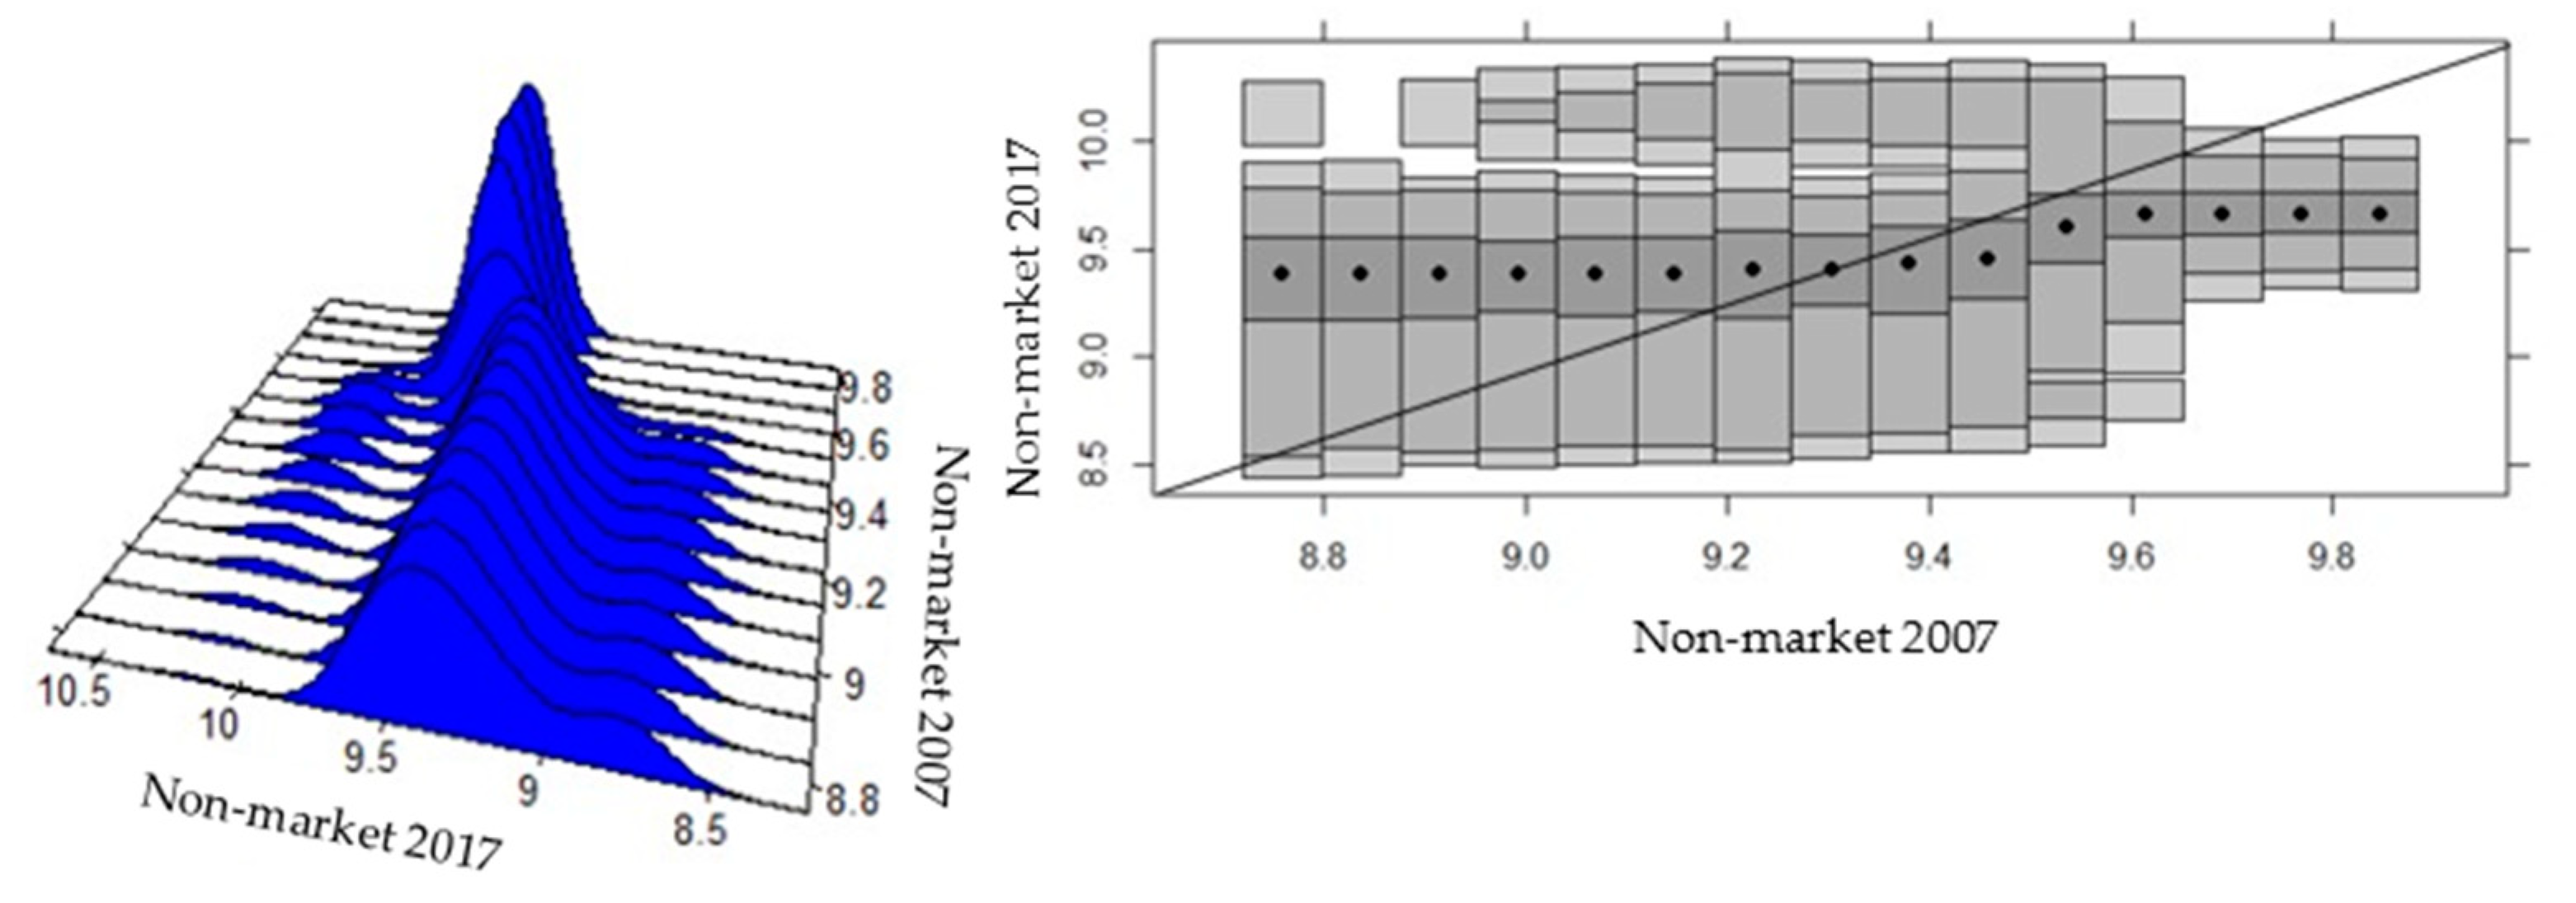
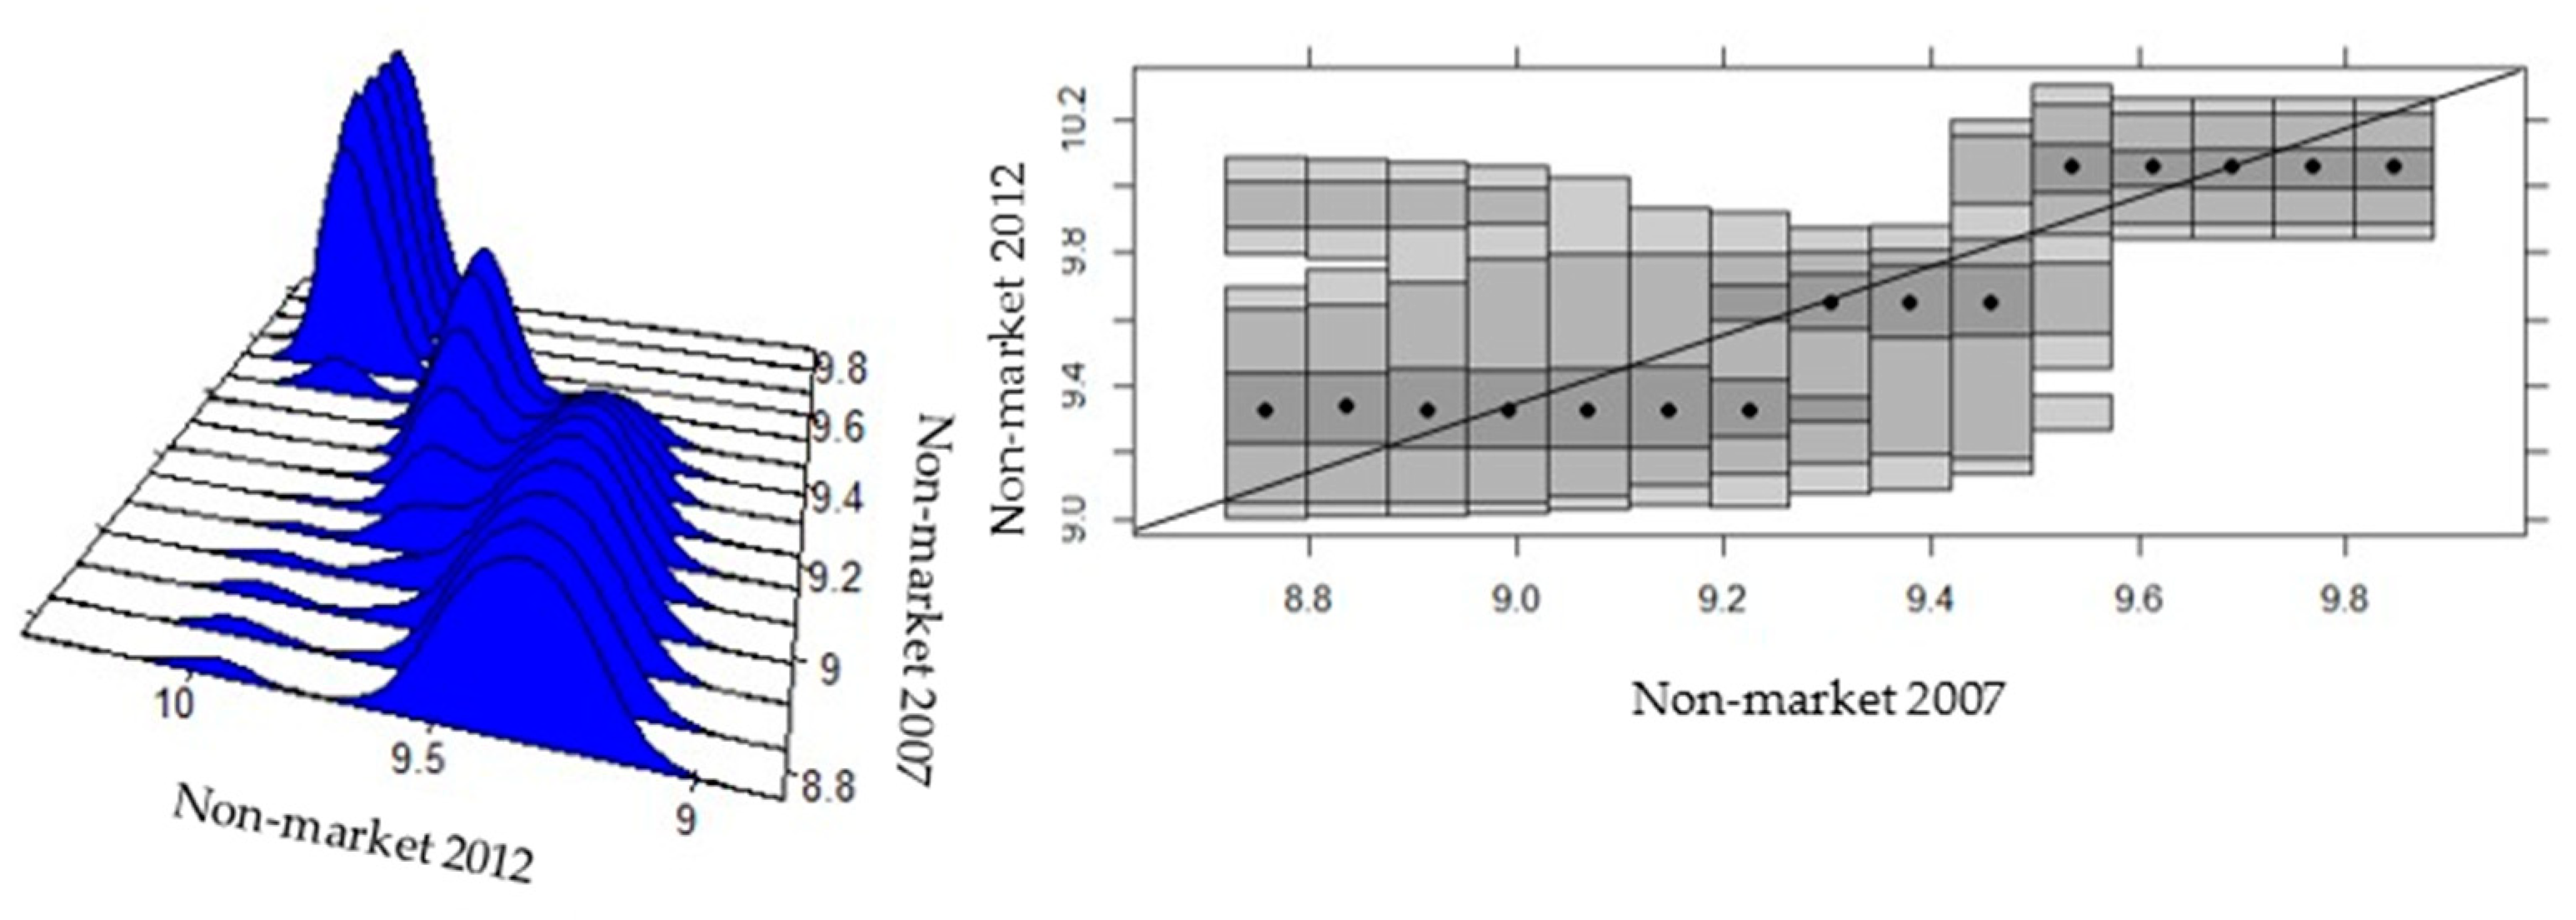
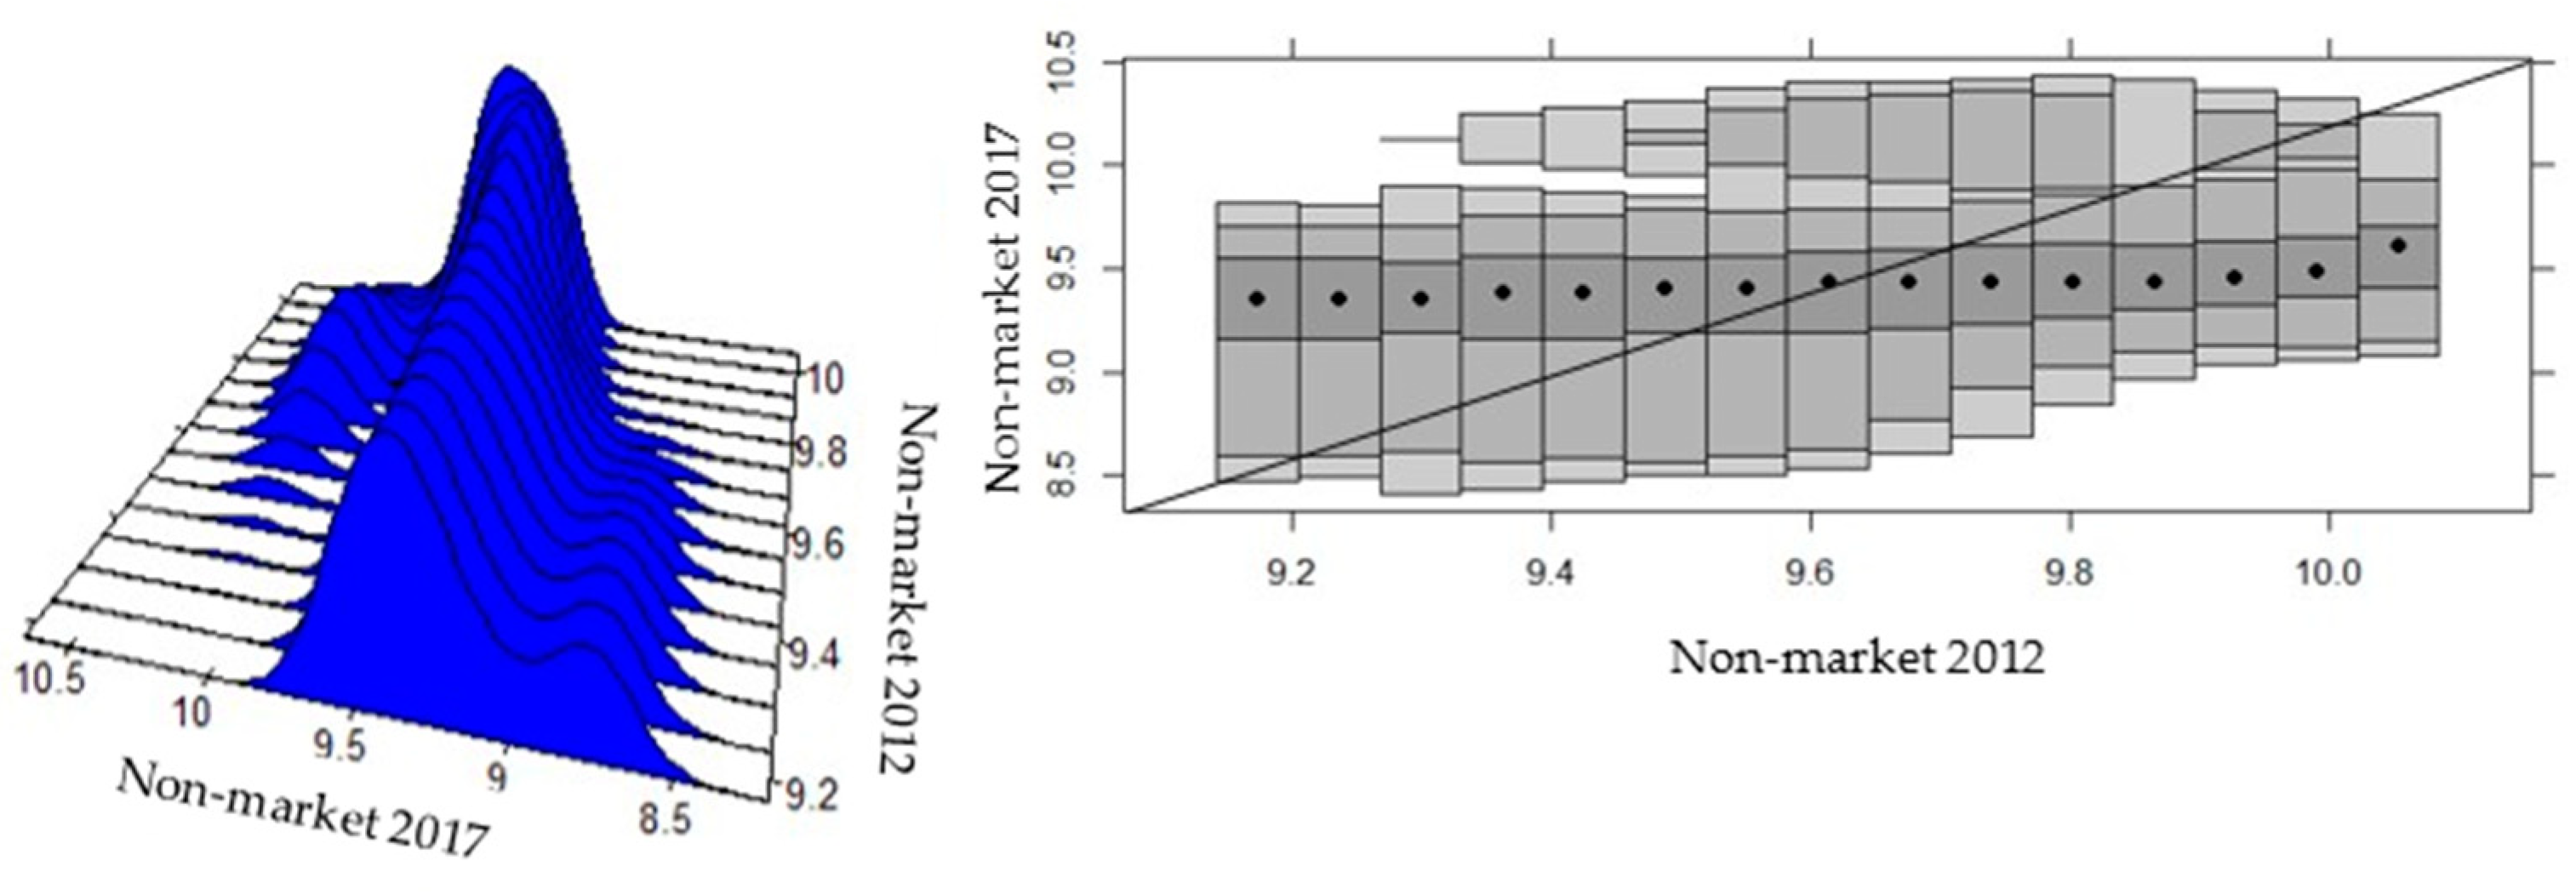
4.3. Beta Convergence and Analysis of Sectoral Intra-Distributive Dynamics in Ecuadorian Provinces

This section shows the results of the estimates made with Hyndman’s routines [62] in the periods 2007–2017, 2007–2012, and 2012–2017 for the service sector and its large groups, market, and non-market services. Two types of graphs are shown in each figure, the first one (left side panel) is known as the stacked conditional density plot (SCD) and allows us to see the different densities of the data of the determining variable, which in this case corresponds to the initial year (beta convergence condition). The second graph (right side panel) shows high density regions (HDR). Each vertical bar represents the conditional density for a given value, the dark shaded region of each bar is a 50% HDR, and the lightest shaded region is a 99% HDR, the mode for each conditional density is shown as a bullet [58].
Intra-distributive dynamics for the service sector in the long term (Figure 6) shows that backward provinces and part of the regions with medium productivity improve, while advanced regions deteriorate sharply, moving away from the main diagonal. In addition, there are bimodal processes in the regions of medium and high productivity that affect the rate of convergence, since among the regions of medium and high productivity, there are regions that grow and others that fall.
By disaggregating the information in subperiods, it is found that during 2007–2012 (Figure 7), backward regions and some of high productivity show an improvement, while the regions of medium productivity and others of high productivity tend to deteriorate. In addition, in low productivity regions, there are processes with three modes and in certain medium productivity regions with bimodal processes. Regarding the second subperiod (Figure 8), low productivity regions and some medium productivity regions improve and, on the contrary, the rest of the regions deteriorate. Likewise, the existence of bimodal processes in both low and high productivity regions affects the convergence process.
In market services (Figure 9) for the 2007–2017 period, it is observed that the most backward regions together with some of medium productivity show a positive evolution in terms of productivity, since they are located above the 45° line. In contrast, the richest regions and others which are at an average threshold, show a significant decline. This behavior explains the low growth of inequality in the market service sector.
In the subperiods, it is evident that poor regions grow between 2007 and 2012, while the rest of the regions tend to fall behind. However, multimodal processes in both rich and poor regions suggest that some of the regions in lower and higher levels improve and others deteriorate (Figure 10). In the period 2012–2017, the most backward regions, together with certain regions of medium productivity, show an improvement. In contrast, the most advanced regions tend to deteriorate; likewise, the convergence process is limited by multimodal processes in both rich and poor regions (Figure 11).
Regarding non-market services, in the long term (Figure 12), the HDR graph shows that low productivity provinces with certain regions of medium productivity show an improvement, while the rest of the regions tend to decrease. Furthermore, it is evident that the presence of bimodal processes in regions of low and medium productivity decreases the rate of convergence (SCD graph).
When examining the data of non-market services in the 2007–2012 period, it is observed that there are certain backward and advanced regions that are improving and others that are declining, which influences the process of reducing regional inequality (Figure 13). During the 2012–2017 period (Figure 14), low productivity regions and part of medium productivity regions improve, while high productivity regions have deteriorated; in terms of convergence, bimodal processes determine the rate of convergence in both periods (2007–2012 and 2012–2017).

5. Conclusions

The growing importance of services in the Ecuadorian sector structure hardly matches the interest by researchers, since there is little research that addresses tertiary activities, even more so from a convergence perspective. In this regard, this work constitutes an important contribution to the empirical evidence related to the tertiary sector. This is due to the fact that not only the service sector is analyzed as a whole, tertiary activities are also disaggregated and grouped into market and non-market services. Furthermore, unlike the abundant empirical literature that focuses on testing the convergence hypothesis in aggregate variables such as GDP per capita, this work focuses on productivity. In addition, a complete picture of the process of regional growth and regional convergence is provided through non-parametric techniques.
The results found in this investigation indicate that the highest productivity levels in the tertiary sector, between 2007 and 2017, move between provinces in the same regions (Sierra and Oriente). When disaggregating tertiary information, high levels of productivity of market services, at the beginning of the period, are located in provinces of the Sierra and Oriente, and at the end of the period, they are grouped only in provinces of the Sierra. Regarding non-market services, the high productivity observed in the Costa and Oriente regions, ceased with time and by 2017, it began to be concentrated in the provinces of Sierra and Orellana (Oriental region). In terms of growth, not all provinces with high productivity had high growth rates. On the contrary, certain backward provinces showed better growth levels.
On the other hand, the coefficient of variation shows that the dispersion in the market services and services sector decreases in the long term, while for non-market services, it increases. The standard deviation of the logarithms, meanwhile, indicates that dispersion in the service sector tends to increase over time. When analyzing this information at the subgroup level, it was found that in non-market services, the increase in dispersion is more marked than in market services. Regarding the Gini index and the generalized measures of entropy, they coincide in showing that the growing inequality in non-market services is more representative than in market services and, therefore, inequality in the service sector increases over the long term; in contrast, according to Atkinson, in the long term, inequality in market services decreases. Finally, the polarization indicator shows an increasing trend over time, being more evident in non-market services.
Despite increasing trends in generalized measures of entropy, Atkinson (measures of inequality) and polarization, these do not translate into large levels of inequality, much less polarization. In general terms, the indicators that allow us to measure sigma convergence, showed that in the long term, the service sector presents slight levels of inequality, which are largely explained by the growing trend of inequality in non-market services. Regarding market services, these are more static over time. The levels of inequality found in services, market, and non-market services, at the end of the analyzed period, are higher than those exposed in 2007.
Regarding the analysis of intra-distribution dynamics, poor regions and certain regions with medium productivity improve considerably in the long term, while rich regions show a strong deterioration. This behavior occurs in the tertiary sector, in market services, and less intensely (regarding the deterioration of rich provinces) in non-market services. By analyzing the information in two subperiods, it was found that during 2007–2012, the provinces with low productivity improved, both in services and market services, while in non-market services, some deteriorated. Regarding rich provinces, in the non-market service and service sector, some improved and others deteriorated, while in market services, all of them decreased. In the second subperiod, 2012–2017, poor regions improved, and conversely, rich regions deteriorated, both in the service sector and in its subsectors.
Finally, after having analyzed the service sector together with its subsectors, market, and non-market services, it can be seen that the inequality levels found are not alarming, but we must therefore, not ignore its importance, since the growing trend in time is clear, particularly in non-market services.

Author Contributions

All authors (R.C.-Q., L.C.-R., J.Ã.-G. and M.d.l.C.d.R.-R.) contributed equally to this work. All authors wrote, reviewed and commented on the manuscript. All authors have read and agreed to the published version of the manuscript.

Funding

This research received no external funding.

Conflicts of Interest

The authors declare no conflict of interest.

References

  1. Bastos, S.Q.D.A.; Perobelli, F.S.; Souza, K.B.D. Analysis of the productive structure of the service sector in countries with different levels of development/Análisis de la estructura productiva del sector servicios en países con diferentes niveles de desarrollo. Rev. CEPAL 2012, 108, 91–113. [Google Scholar]
  2. Flores Sánchez, C.A.; Castillo Ponce, R.A.; Rodríguez Espinosa, M.D.L. The importance of the service sector in the Mexican economy: An analysis of time series/La importancia del sector servicios en la economía mexicana: Un análisis de series de tiempo. Paradig. Econ. 2013, 5, 5–27. [Google Scholar]
  3. Maroto, A. Productivity in the Services Sector. An Applied Economic Analysis /La Productividad en el Sector Servicios. Un Análisis Económico Aplicado (Tesis Doctoral). Ph.D. Thesis, Universidad de Alcalá, Fort Henares, Spain, 2007. [Google Scholar]
  4. Maroto-Sánchez, A. Productivity in the services sector: Conventional and current explanations. Serv. Ind. J. 2012, 32, 719–746. [Google Scholar] [CrossRef]
  5. Bonet, J. The outsourcing of regional economic structures in Colombia/La terciarización de las estructuras económicas regionales en Colombia. Rev. Econ. Rosario 2007, 10, 1–19. [Google Scholar]
  6. World Bank (WB). World Development Indicators. Available online: https://datos.bancomundial.org/ (accessed on 5 April 2020).
  7. Kinfemichael, B.; Morshed, A.M. Unconditional convergence of labor productivity in the service sector. J. Macroecon. 2019, 59, 217–229. [Google Scholar] [CrossRef]
  8. Rabanal, C. Hypothesis on economic convergence: A review of the approaches used/Hipótesis sobre la convergencia económica: Una revisión de los enfoques utilizados. Econ. Adm. 2017, 7, 113–132. [Google Scholar] [CrossRef] [Green Version]
  9. Quah, D. Galton’s fallacy and tests of the convergence hypothesis. Scand. J. Econ. 1993, 552, 427–443. [Google Scholar] [CrossRef]
  10. Quah, D. Empirics for economic growth and convergence. Eur. Econ. Rev. 1996, 40, 1353–1375. [Google Scholar] [CrossRef]
  11. González, M.; Del Río Gómez, C.; Domínguez, J.M. The services: Concept, classification and measurement problems/Los servicios: Concepto, clasificación y problemas de medición. Ekon. Rev. Vasca Econ. 1989, 13, 10–19. [Google Scholar]
  12. Solow, R. A contribution to the theory of economic growth. Q. J. Econ. 1956, 70, 65–94. [Google Scholar] [CrossRef]
  13. Swan, T.W. Economic growth and capital accumulation. Econ. Rec. 1956, 32, 334–361. [Google Scholar] [CrossRef]
  14. Romer, P.M. Increasing returns and long-run growth. J. Political Econ. 1986, 94, 1002–1037. [Google Scholar] [CrossRef] [Green Version]
  15. Lucas, R.E., Jr. On the mechanics of economic development. J. Monet. Econ. 1988, 22, 3–42. [Google Scholar] [CrossRef]
  16. Carrillo Huerta, M.M.; Ceron Vargas, J.A.; Reyes Hernández, M.S. Analysis of Economic Growth/Análisis del Crecimiento Económico (No. 3 330); e-libro Corp.: Madrid, Spain, 2007. [Google Scholar]
  17. Barro, R.J.; Sala-i-Martin, X. Economic Growth; McGraw-Hill: Santa Fe, CDMX, Mexico, 1995. [Google Scholar]
  18. Galor, O. Convergence? Inferences from theoretical models. Econ. J. 1996, 106, 1056–1069. [Google Scholar] [CrossRef]
  19. Esquivel, G. Regional convergence in Mexico, 1940–1995/Convergencia regional en México, 1940–1995. El Trimest. Econ. 1999, 264, 725–761. [Google Scholar]
  20. Mankiw, N.G.; Romer, D.; Weil, D.N. A contribution to the empirics of economic growth. Q. J. Econ. 1992, 107, 407–437. [Google Scholar] [CrossRef]
  21. Barro, R.J.; Sala-i-Martin, X.; Robinson, R.A.; de Espinoza, J.R. Economic Growth/Crecimiento Económico; Reverté: Barcelona, Spain, 2009. [Google Scholar]
  22. Abramovitz, M. Catching up, forging ahead, and falling behind. J. Econ. Hist. 1986, 46, 385–406. [Google Scholar] [CrossRef]
  23. Baumol, W. Productivity growth, convergence and welfare: What the long-run data show. Am. Econ. Rev. 1986, 76, 1072–1085. [Google Scholar]
  24. Barro, R.J.; Sala-i-Martin, X.; Blanchard, O.J.; Hall, R.E. Convergence across states and regions. Brook. Pap. Econ. Act. 1991, 107–182. [Google Scholar] [CrossRef] [Green Version]
  25. Quintana-Romero, L.; Correa-Quezada, R.; Ramón-Mendieta, M.G.; Álvarez-García, J. Sectoral regional growth and convergence in Ecuador: An analysis of the intra-distributive dynamics of productivity. Symmetry 2019, 11, 461. [Google Scholar] [CrossRef] [Green Version]
  26. Barro, R.J. Economic growth and convergence, applied to China. China World Econ. 2016, 24, 5–19. [Google Scholar] [CrossRef]
  27. Ahmad, M.; Hall, S.G. Economic growth and convergence: Do institutional proximity and spillovers matter? J. Policy Model. 2017, 39, 1065–1085. [Google Scholar] [CrossRef] [Green Version]
  28. Borozan, D. Internal migration, regional economic convergence, and growth in Croatia. Int. Reg. Sci. Rev. 2017, 40, 141–163. [Google Scholar] [CrossRef]
  29. Jiang, L.I.U.; Yang, S.H.E.N. Industrial convergence, market segmentation and economic growth. J. Lanzhou Univ. Financ. Econ. 2017, 6, 7–15. [Google Scholar]
  30. Jianyu, C.H.I.; Enshu, G.U. Intellectual property rights protection, economic growth and economic convergence: An empirical study based on panel threshold model. Rev. Econ. Manag. 2017, 4, 2–18. [Google Scholar]
  31. Juknys, R.; Liobikienė, G.; Dagiliūtė, R. Sustainability of economic growth and convergence in regions of different developmental stages. Sustain. Dev. 2017, 25, 276–287. [Google Scholar] [CrossRef]
  32. Åslund, A. What happened to the economic convergence of central and eastern europe after the global financial crisis? Comp. Econ. Stud. 2018, 60, 254–270. [Google Scholar] [CrossRef]
  33. Labella, Á.; Rodríguez-Cohard, J.C.; Sánchez-Martínez, J.D.; Martínez, L. An AHPSort II Based Analysis of the Inequality Reduction within European Union. Mathematics 2020, 8, 646. [Google Scholar] [CrossRef]
  34. Szkutnik, W.; Szkutnik, W. Socio-economic convergence in models of endogeneous economic growth. Ekon. Manaz. Spectr. 2018, 12, 1–14. [Google Scholar]
  35. Vâlsan, C.; Druică, E. Corporate performance and economic convergence between europe and the us: A cluster analysis along industry lines. Mathematics 2020, 8, 451. [Google Scholar] [CrossRef] [Green Version]
  36. Willington, M. An Empirical Analysis of Regional Economic Growth in Argentina/Un Análisis Empírico del Crecimiento Económico Regional en Argentina; Working Document nº14; IERAL, Fundación Mediterránea: Córdoba, Argentina, 1998; pp. 1–54. [Google Scholar]
  37. Cuervo, L.M. Regional convergence and divergence studies in Latin America: Balance and perspectives/Estudios de convergencia y divergencia regional en América Latina: Balance y perspectivas. Investig. Reg. J. Reg. Res. 2004, 5, 29–66. [Google Scholar]
  38. Quintana-Romero, L.; Mendoza, M.A.; Correa-Quezada, R. Ecuadorian regions in the Latin American context/Las regiones ecuatorianas en el contexto Latinoamericano. In Regions and Economy in Ecuador: Growth, Industry, Migration and Employment/Regiones y Economía en el Ecuador: Crecimiento, Industria, Migración y Empleo; Quintana, L., Mendoza, M.A., Correa-Quezada, R., Eds.; In Abya Yala: Quito, Ecuador, 2014; pp. 13–27. [Google Scholar]
  39. Ramón-Mendieta, M.G.; Ochoa-Moreno, W.S.; Ochoa-Jiménez, D.A. Growth, Clusters, and Convergence in Ecuador: 1993–2011. In Regional Problems and Policies in Latin America; Cuadrado-Roura y P. Aroca, J., Ed.; Springer: Berlin/Heidelberg, Germany, 2013; pp. 323–337. [Google Scholar]
  40. Ramón-Mendieta, M.; Quintana-Romero, L. Regional convergence and divergence in Ecuador/Convergencia y divergencia regional en Ecuador. In Regions and Economy in Ecuador: Growth, Industry, Migration and Employment/Regiones y Economía en el Ecuador: Crecimiento, Industria, Migración y Empleo; Quintana, L., Mendoza, M.A., Correa-Quezada, R., Eds.; In Abya Yala: Quito, Ecuador, 2014; pp. 85–105. [Google Scholar]
  41. Szeles, M.R.; Muñoz, R.M. Analyzing the regional economic convergence in Ecuador. Insights from parametric and nonparametric models. Rom. J. Econ. Forecast. 2016, 19, 43–65. [Google Scholar]
  42. Arias, T. Structural Change and Regional Inequalities in Ecuador: 1993–2014/El Cambio Estructural y las Desigualdades Regionales en el Ecuador: 1993–2014. Ph.D. Thesis, University of Alcala, Alcalá de Henares, Spain, 2017. [Google Scholar]
  43. Flores-Chamba, J.; Correa-Quezada, R.; Álvarez-García, J.; del Río-Rama, M.D.L. Spatial Economic Convergence and Public Expenditure in Ecuador. Symmetry 2019, 11, 130. [Google Scholar] [CrossRef] [Green Version]
  44. Mendieta Muñoz, R.M. The Conditional Convergence Hypothesis in Ecuador: An Analysis at the Cantonal Level/La hipótesis de la convergencia condicional en Ecuador: Un análisis a nivel cantonal. Retos Rev. Ciencias Adm. Econ. 2015, 5, 13–25. [Google Scholar]
  45. Mendieta Muñoz, R.; Pontarollo, N. Cantonal convergence in ecuador: A spatial econometric perspective. J. Appl. Econ. Sci. 2016, XI, 107–126. [Google Scholar]
  46. Central Bank of Ecuador (BCE). Regional National Accounts/Cuentas Nacionales Regionales. Available online: https://www.bce.fin.ec/index.php/component/k2/item/293-cuentas-provinciales/ (accessed on 5 April 2020).
  47. National Institute of Statistics and Censuses (INEC). Employment, Unemployment and Underemployment Surveys/Encuestas de Empleo, Desempleo y Subempleo (ENEMDU). Available online: http://www.ecuadorencifras.gob.ec/informacion-historica-de-empleo/ (accessed on 5 April 2020).
  48. Ezcurra, R.; Rodríguez-Pose, A. Measuring the regional divide. In Handbook of Regional Growth and development Theories; Capello, R., Nijkamp, P., Eds.; Edward Elgar Publishing: Cheltenham, UK, 2009; pp. 329–353. [Google Scholar]
  49. Quintana, L.; Asuad, N. Growth, Concentration, Inequality and Regional Policy in Mexico. In Regional Problems and Policies in Latin America; Cuadrado-Roura, J., Aroca, P., Eds.; Springer: London, UK, 2013; pp. 165–195. [Google Scholar]
  50. Quintana, L.; Prudencio, J.; Salas, C. Inequality and Spatial Convergence in the Mexico City Metropolitan Area, 1989-2010. J. Rev. Glob. Econ. 2016, 5, 69–83. [Google Scholar] [CrossRef]
  51. Esteban, J.; Gradín, C.; Ray, D. An extension of a measure of polarization, with an application to the income distribution of five OECD countries. J. Econ. Inequal. 2007, 5, 1–19. [Google Scholar] [CrossRef]
  52. Barro, R.J.; Sala-i-Martin, X. Economic Growth and Convergence Across the United States; Working Paper no. 3419; National Bureau of Economic Research: Cambridge, UK, 1990. [Google Scholar]
  53. Barro, R.J. Economic Growth in a Cross Section of Countries. Q. J. Econ. 1991, 106, 407–443. [Google Scholar] [CrossRef] [Green Version]
  54. Sala-i-Martin, X. The classical approach to convergence analysis. Econ. J. 1996, 1019–1036. [Google Scholar] [CrossRef]
  55. Sala-i-Martin, X. Notes of Economic Growth/Apuntes de Crecimiento Económico; Antoni Bosch Editor: Barcelona, Spain, 2000. [Google Scholar]
  56. Bickenbach, F.; Eckhardt, B. Evaluating the markov property in studies of economic convergence. Int. Reg. Sci. Rev. 2003, 26, 363–392. [Google Scholar] [CrossRef]
  57. Magrini, S. Analysing Convergence Through the Distribution Dynamics Approach: Why and How? In Working Paper Department of Economics; Num. 13 /wp/2007; Ca’ Foscari University of Venice: Venezia, Italy, 2007. [Google Scholar]
  58. Hyndman, R. Computing and graphing highest density regions. Am. Stat. 1996, 50, 120–126. [Google Scholar]
  59. Hyndman, R.; Bashtannyk, D.; Grunwald, G. Estimating and visualizing conditional densities. J. Comput. Gr. Stat. 1996, 5, 315–336. [Google Scholar]
  60. Borrayo López, R.; Castañeda Arriaga, J.M. Dynamic transition analysis: A non-parametric approach applied to the central region of Mexico (1988–2003)/Análisis de transición dinámica: Un enfoque no paramétrico aplicado a la región centro de México (1988–2003). Probl. Desarro. 2011, 42, 7–44. [Google Scholar]
  61. Arbia, G.; Basile, R.; Piras, G. Analyzing intra-distribution dynamics: A reappraisal. In ERSA Conference Papers; (No. ersa06p262); European Regional Science Association: Louvain-la-Neuve, Belgium, 2006. [Google Scholar]
  62. Hyndman, R.J. Hdrcde: Highest Density Regions and Conditional Density Estimation. R Package Version 3.4. Available online: http://pkg.robjhyndman.com/hdrcde (accessed on 5 March 2020).
Figure 1. Indicators, and study variable.
Mathematics 08 01234 g001
Figure 2. Quantiles of provincial productivity 2007, 2012, and 2017. Source: Own elaboration based on the Regional Accounts of the BCE (2017) [46], and ENEMDU Surveys from the INEC [47] (several years).
Mathematics 08 01234 g002aMathematics 08 01234 g002b
Figure 3. Quantiles of the Sectoral Growth Rate 2007, 2012, and 2017. Source: Own elaboration based on the Regional Accounts of the BCE (2017) [46], and ENEMDU Surveys from the INEC [47] (several years).
Mathematics 08 01234 g003aMathematics 08 01234 g003b
Figure 4. Gini index and standard deviation of provincial productivity in Ecuador, period 2007–2017. Source: Own elaboration based on the Regional Accounts of the BCE [46]; ENEMDU surveys from the INEC [47] (several years) and Distributive Analysis Stata Package (DASP).
Mathematics 08 01234 g004
Figure 5. Inequality and polarization indices in provincial sectoral productivity of Ecuador 2007–2017. Source: Own elaboration based on the Regional Accounts of the BCE [46]; ENEMDU surveys from the INEC [47] (several years) and Distributive Analysis Stata Package (DASP).
Mathematics 08 01234 g005
Figure 6. Intra-distribution dynamics of provincial productivity in the service sector, 2007–2017. Source: Own elaboration based on the Regional Accounts of the BCE [46]; ENEMDU surveys from the INEC [47] (several years) and stacked conditional density plot (SCD) in R.
Mathematics 08 01234 g006
Figure 7. Intra-distribution dynamics of provincial productivity in the service sector, 2007–2012. Source: Own elaboration based on the Regional Accounts of the BCE [46]; ENEMDU surveys from the INEC [47] (several years) and stacked conditional density plot (SCD) in R.
Mathematics 08 01234 g007
Figure 8. Intra-distribution dynamics of provincial productivity in the service sector, 2012–2017. Source: Own elaboration based on the Regional Accounts of the BCE [46]; ENEMDU surveys from the INEC [47] (several years) and stacked conditional density plot (SCD) in R.
Mathematics 08 01234 g008
Figure 9. Intra-distribution dynamics of provincial productivity in the market service subsector, 2007–2017. Source: Own elaboration based on the Regional Accounts of the BCE [46]; ENEMDU surveys from the INEC [47] (several years) and stacked conditional density plot (SCD) in R.
Mathematics 08 01234 g009
Figure 10. Intra-distribution dynamics of provincial productivity in the market service subsector, 2007–2012. Source: Own elaboration based on the Regional Accounts of the BCE [46]; ENEMDU surveys from the INEC [47] (several years) and stacked conditional density plot (SCD) in R.
Mathematics 08 01234 g010
Figure 11. Intra-distribution dynamics of provincial productivity in the market service subsector, 2012–2017.Source: Own elaboration based on the Regional Accounts of the BCE [46]; ENEMDU surveys from the INEC [47] (several years) and stacked conditional density plot (SCD) in R.
Mathematics 08 01234 g011
Figure 12. Intra-distribution dynamics of provincial productivity in the non-market service subsector, 2007–2017. Source: Own elaboration based on the Regional Accounts of the BCE [46]; ENEMDU surveys from the INEC [47] (several years) and stacked conditional density plot (SCD) in R.
Mathematics 08 01234 g012
Figure 13. Intra-distribution dynamics of provincial productivity in the non-market service subsector, 2007–2012. Source: Own elaboration based on the Regional Accounts of the BCE [46]; ENEMDU surveys from the INEC [47] (several years) and stacked conditional density plot (SCD) in R.
Mathematics 08 01234 g013
Figure 14. Intra-distribution dynamics of provincial productivity in the non-market service subsector, 2012–2017. Source: Own elaboration based on the Regional Accounts of the BCE [46]; ENEMDU surveys from the INEC [47] (several years) and stacked conditional density plot (SCD) in R.
Mathematics 08 01234 g014
Table 1. Descriptive measures for services and their large groups, 2007–2017.
Descriptive Measures20072017
Total ServicesMarket ServicesNon-Market ServicesTotal ServicesMarket ServicesNon-Market Services
Maximum18.317.618.920.818.725.3
Minimum5.65.06.46.05.86.4
Mean8.18.18.110.610.111.7
Standard deviation2.73.02.63.02.84.1
Coefficient of variation *33.336.831.628.228.034.6
* Variation coefficient (division of the standard deviation by the absolute value of the set mean), a statistical measure of the relative dispersion of a data set. Source: Own elaboration based on the Regional Accounts of the BCE [46]; ENEMDU surveys from the INEC [47] (several years).

