Data-Driven Analytics for Personalized Medical Decision Making
by
 ,
,
Nataliia Melnykova
1, 
Nataliya Shakhovska
1,*, 
Michal Gregus
2,
Volodymyr Melnykov
3,
Mariana Zakharchuk
4 and
Olena Vovk
1 1
Artificial Intelligence Department, Institute of Computer Sciences and Information Technologies, Lviv Polytechnic National University, 79013 Lviv, Ukraine
2
Department of Information Systems, Comenius University in Bratislava, 81499 Bratislava, Slovakia
3
General Surgery Department, Danylo Halytsky Lviv National Medical University, 79010 Lviv, Ukraine
4
Linguistically Education Center, Lviv Polytechnic National University, 79013 Lviv, Ukraine
*
Author to whom correspondence should be addressed.
Mathematics 2020, 8(8), 1211; https://doi.org/10.3390/math8081211
Submission received: 3 July 2020
/
Revised: 15 July 2020
/
Accepted: 20 July 2020
/
Published: 23 July 2020
(This article belongs to the Section Mathematics and Computer Science)
Abstract
:The study was conducted by applying machine learning and data mining methods to treatment personalization. This allows individual patient characteristics to be investigated. The personalization method was built on the clustering method and associative rules. It was suggested to determine the average distance between instances in order to find the optimal performance metrics. The formalization of the medical data preprocessing stage was proposed in order to find personalized solutions based on current standards and pharmaceutical protocols. The patient data model was built using time-dependent and time-independent parameters. Personalized treatment is usually based on the decision tree method. This approach requires significant computation time and cannot be parallelized. Therefore, it was proposed to group people by conditions and to determine deviations of parameters from the normative parameters of the group, as well as the average parameters. The novelty of the paper is the new clustering method, which was built from an ensemble of cluster algorithms, and the usage of the new distance measure with Hopkins metrics, which were 0.13 less than for the k-means method. The Dunn index was 0.03 higher than for the BIRCH (balanced iterative reducing and clustering using hierarchies) algorithm. The next stage was the mining of associative rules provided separately for each cluster. This allows a personalized approach to treatment to be created for each patient based on long-term monitoring. The correctness level of the proposed medical decisions is 86%, which was approved by experts.
1. Introduction
Nowadays, modern medicine is on the verge of change in many countries. It is crucial to support medical decisions regarding analysis and prediction of a patient’s condition at different stages of their treatment. Thus, in recent years health policy has changed in regard to the form of intervention, with the aims of prevention and personalization of medical decisions. Particularly important for the implementation of this policy is the completeness and timeliness of received information about patients and the ability to monitor patients, not only in the hospital. This is why information technology, smart devices, and smart systems are being integrated into medical and social areas [1,2,3].
As an example, the primary healthcare system serves almost 70% of the population, treating about 90% of common and local problems [4]. Consequently, for qualified medical care, it is necessary to develop intelligent systems for personalized treatment decisions. Such intelligent systems will be responsible for collecting, processing, and transmitting a large amount of data using medical records, sets of microcontrollers, communication equipment, and sensors based on Internet of Things (IoT) solutions. Artificial intelligence (AI) will help to solve the preprocessing tasks, such as gap imputation, outlier analysis, complexity reduction, hidden dependency identification [5,6,7]. Artificial intelligence and big data will be used together to improve the prediction accuracy of the spatial and temporal development of a patient’s disease [8,9,10].
Personalized medicine (PM) is supposed to be supported by small and big data (which must become a data-driven process) and to use artificial intelligence technology to help with risk prevention, prediction, and detection, as well as medical intervention. Personalized treatment (PT) is based on existing medical protocols and therapeutic schemes (the list of medicaments and medical manipulations for each type of disease), however it takes into account the individual characteristics of each patient (concomitant pathologies, allergic reactions, current blood pressure and glucose level, etc.). This gives the opportunity to choose the most appropriative medicaments from the list.
The aim of this paper is to develop a novel approach for medical decisions based on an ensemble of clustering methods. The optimal condition of a patient is estimated as the distance between the centroid in a cluster and a particular instance. The list of the most appropriative medicaments is built on separate associative rules for each cluster.
The proposed approach can also be used for processing multidimensional information in structured and semistructured modes in other domains.
The structure of the paper is as follows. The first part, covering the related sources, presents an approach for medical data analysis. Next, the patient data model and a description of the existing dataset are given. An estimation of the quality metrics is provided for the existing method. The novel approach based on an ensemble of clustering methods is developed. The results of the proposed approach are then analyzed. The conclusion section underlines the novelty of the proposed approach.
2. Related Works
Various aspects of medical data processing are highlighted below.
- Diagnosis (classification and prediction) and personalization of treatment.
Bidiuk [11] used decision-tree-based computation procedures and regression approaches to predict missing data and for PM decisions. Dangare [12] obtained similar results for mining of associative rules in medical data. The main disadvantage of these methods is that they only process structured data. This is why medical records without data from sensors and medical devices can be processed.
Bayesian networks, artificial neural networks (ANN), and k-means algorithms are used in [13] for heart disease prediction. However, Bayesian networks are too slow to process large amounts of data or for online diagnostics. This is why Tang [14] developed a method for parallel Bayesian networks. However, even in the case of parallelism, it is advisable to use Bayesian networks in combination with other machine learning methods for multiparameter, large-scale, dynamic medical data flows. The ANN apparatus is commonly used in combination with fuzzy logic for the analysis of various medical data. Thus, in the works of Bodiansky and Perova [15,16,17,18], a system for rapid medical diagnostics based on auto-associative neuro-fuzzy memory was proposed. However, one of the urgent tasks remains, which is to improve the accuracy of the results of the classification problem. In addition, problems related to imbalanced input data and small samples of data collected manually by medical staff impose a number of restrictions on the usage of existing methods and computational intelligence tools to solve such problems [19].
In [20], AI methods in PM are analyzed. The relationship between diseases and their treatments are found. However, these relationships are built on medical protocols, since the proposed approach cannot reduce the list of medicaments.
A previous paper [21] presented the architecture of the support decision medicinal system based on ontology and a personalized data model was given. This model will be extended in this paper using sensor data.
Therefore, for the diagnosis and PM support, a combination of analyzed methods is required.
- Clustering:
Cluster analysis is widely used for outlier detection. The outliers in the medical domain are the differences between optimal patient conditions based on the local protocol and individual features. Some of the simple clustering algorithms are partitioning methods. The k-means algorithm builds k clusters located at large distances from each other. The main type of problems solved by the k-means algorithm is the assumption (hypotheses) of the number of clusters and the diversity of the instances in different clusters. The choice of the k number may be based on the results of previous studies and theoretical considerations [22].
The authors in [23] used the balanced iterative reduction and clustering using hierarchies (BIRCH) algorithm for diabetes detection. For the BIRCH algorithm, the clustering rate increases due to the generalized appearance of clusters. This algorithm implements a two-stage clustering process. During the first stage, a preliminary set of clusters is formed. In the second step, other clustering algorithms suitable for Random Access Memory (RAM) are applied to the detected clusters [23].This algorithm can be used for outlier detection [22,23]. If the dimensions of the data features are very large, e.g., greater than 20, BIRCH is not suitable. At this time, the mini batch k-means algorithm performs better. The complexity of the algorithm is represented as O(n).
The density-based spatial clustering of applications with noise (DBSCAN) method iteratively collects objects that are close to the root objects that can merge several tightly accessible clusters. DBSCAN does not require the number of clusters received to be predefined, unlike partitioning methods [24], although there is a need for guidance on the values of the radius parameters of any object and the minimum number of objects that directly affect the clustering result. The optimal values for these parameters are difficult to determine, especially for multidimensional data spaces [22].
Hierarchical clustering creates a hierarchy of clusters. Each cluster node contains child clusters; cluster descendants divide the vertices belonging to their common ancestor. The main disadvantage is the high complexity of this algorithm [25].
It is very important to reduce the time complexity for large dataset analysis [26]. For example, the Big Cities Health Inventory Data Platform (BCHC Data Platform, https://www.bigcitieshealth.org/city-data) contains over 30,000 data points across more than 50 health, socioeconomic, urban (information from smart sensors), and demographic indicators across 11 categories in the United States. Another example is online monitoring of a patient’s conditions at home. In this case, both structured data (medical records) and streaming data (information from IoT devices) should be analyzed in online mode. Consequently, the parallel processing of information can reduce the time complexity of data preprocessing and processing.
In [27], the unsupervised artificial neural network model is used to extract downstream gas temperature profiles in combustion health monitoring. The variational autoencoders (VAE) belong to the family of generative models. The VAE maximizing likelihood yields an estimated density that always bleeds probability mass away from the estimated data manifold. This is why the dataset should be balanced.
The genetic algorithm in [28] is used for naturalistic driving data analysis and driver behavior mining. This method can also be implemented for patient condition prediction, but it is most important to find a personalization treatment based on outliers and the average conditions for each group of treatments.
Therefore, the search for personalized solutions involves a number of interrelated processes, namely:
- Data collection (physical parameters of the patients) from smart sensors, e.g., electronic glucometers, automatic tonometers, and holters;
- Data consolidation is focused on defining the data models, as well as the formation of data flows in accordance with the defined tasks;
- Data processing consists of validating data and storing data, for example in a database, knowledge base, or data warehouse, while ensuring data protection;
- The data analysis process sorts the data by defined parameters, taking into account cluster analysis data mining methods, including k-means and k-median algorithms, data visualization methods, etc.;
- The forecasting process involves the construction of a test object that allows the use of artificial intelligence methods, including artificial neural networks, decision trees, Bayesian networks, linear regression networks, correlation–regression analysis, and methods for finding associative rules, including the a priori algorithm.
3. Materials and Methods
3.1. Patient Data Model
The patient data were characterized by multidimensionality and heterogeneity, complicating the analysis of patient conditions. This is why it was necessary to formalize the patients’ physical conditions (FC) by the set of parameters A, consisting of time-dependent At and time-independent Ain parameters:
FC = f (A)
The At and Ain sets can intersect.
The analyzed dataset consisted of information for about 36 patients from Lviv hospital, Ukraine. Data were collected during their hospitalization period. The list of time-independent characteristics includes the following:
- ID;
- Gender;
- Age;
- Diagnosis (list of values);
- Active substance (list of values);
- Medicament (list of values; each value is given as a document consisting of indicators, diagnosis, active substances, and contraindications).
The list of time-dependent characteristics includes the following:
- Timestamp;
- Flora (list of values);
- Weight;
- Subdiagnosis (list of values).
These parameters can be presented as a document-oriented graph (Figure 1).
The overall dataset consists of 15,000 records. The medicaments list is based on medical protocols and diagnoses. More than 30 medicaments exist for each diagnosis. The main purpose of the paper is to select the medicaments from this list based on analysis of other characteristics and patient conditions. This will allow personalization of the treatment.
The data processing and analysis for personalized medical solutions, APD, are represented as a pair:
where , is the set of the patient’s physical conditions, A is the set of the patient’s personal data, n is the total number of patient characteristics, and D is the set of personalized decisions.
The physical condition is represented as:
where Vd is the set of the attribute values di according to the treatment protocol. Attributes of the set A are called conditions, D is the solution, and di is the value of the i-th solution obtained from the set D.
The patient condition is equation demonstrated below:
where is the conditions vector of the dimensions of space n, which includes object variables that uniquely determine each condition:
where is the control vector that displays signals affecting the system from the outside through the proposed solutions to determine the therapeutic treatment scheme:
A and B are the parameter matrices, which consist of object parameters [29].
The control vector is presented by binary variables for the following parameters:
- Temperature;
- Blood pressure;
- Blood glucose level;
- Heart rate.
If Si(t) is equal to 1, we should eliminate medicaments with similar contraindicators.
The medical data are represented as a multidimensional dataset. Therefore, the next step is the patient conditional prediction based on time-independent and time-depended characteristics.
3.2. Analysis Based on the Existing Clustering Method
The preprocessing stage allows for better data understanding. The results were obtained in RStudio.
First, the existing clustering methods were used. The k-means algorithm evaluates the shapes of the clusters. This method can also be used to find outliers. The gap statistics method was applied to estimate the most appropriative number of clusters. The best number was equal to three (Figure 2). The total sum of the square value was 43.5%.
Therefore, according to gap statistics, the best number of clusters is three. The shapes of the three clusters are given in Figure 3.
The overlap of the objects is apparent in Figure 3. This is why the fuzzy c-means algorithm was used for future data analysis. Part of the membership function is given below. The minimum difference between values of the membership function for one instance is 0.01. We can see the overlap of the clusters for the following objects:
		 Memberships:
		         1          2          3
		  [3,] 0.16711487 0.35000991 0.48287522
		 [15,] 0.23002867 0.32066047 0.44931086
		 [16,] 0.39445021 0.21628065 0.38926914
		 [22,] 0.38334426 0.32979465 0.28686109
		 [32,] 0.30323223 0.29632674 0.40044103
		 [36,] 0.27174345 0.43061645 0.29764011
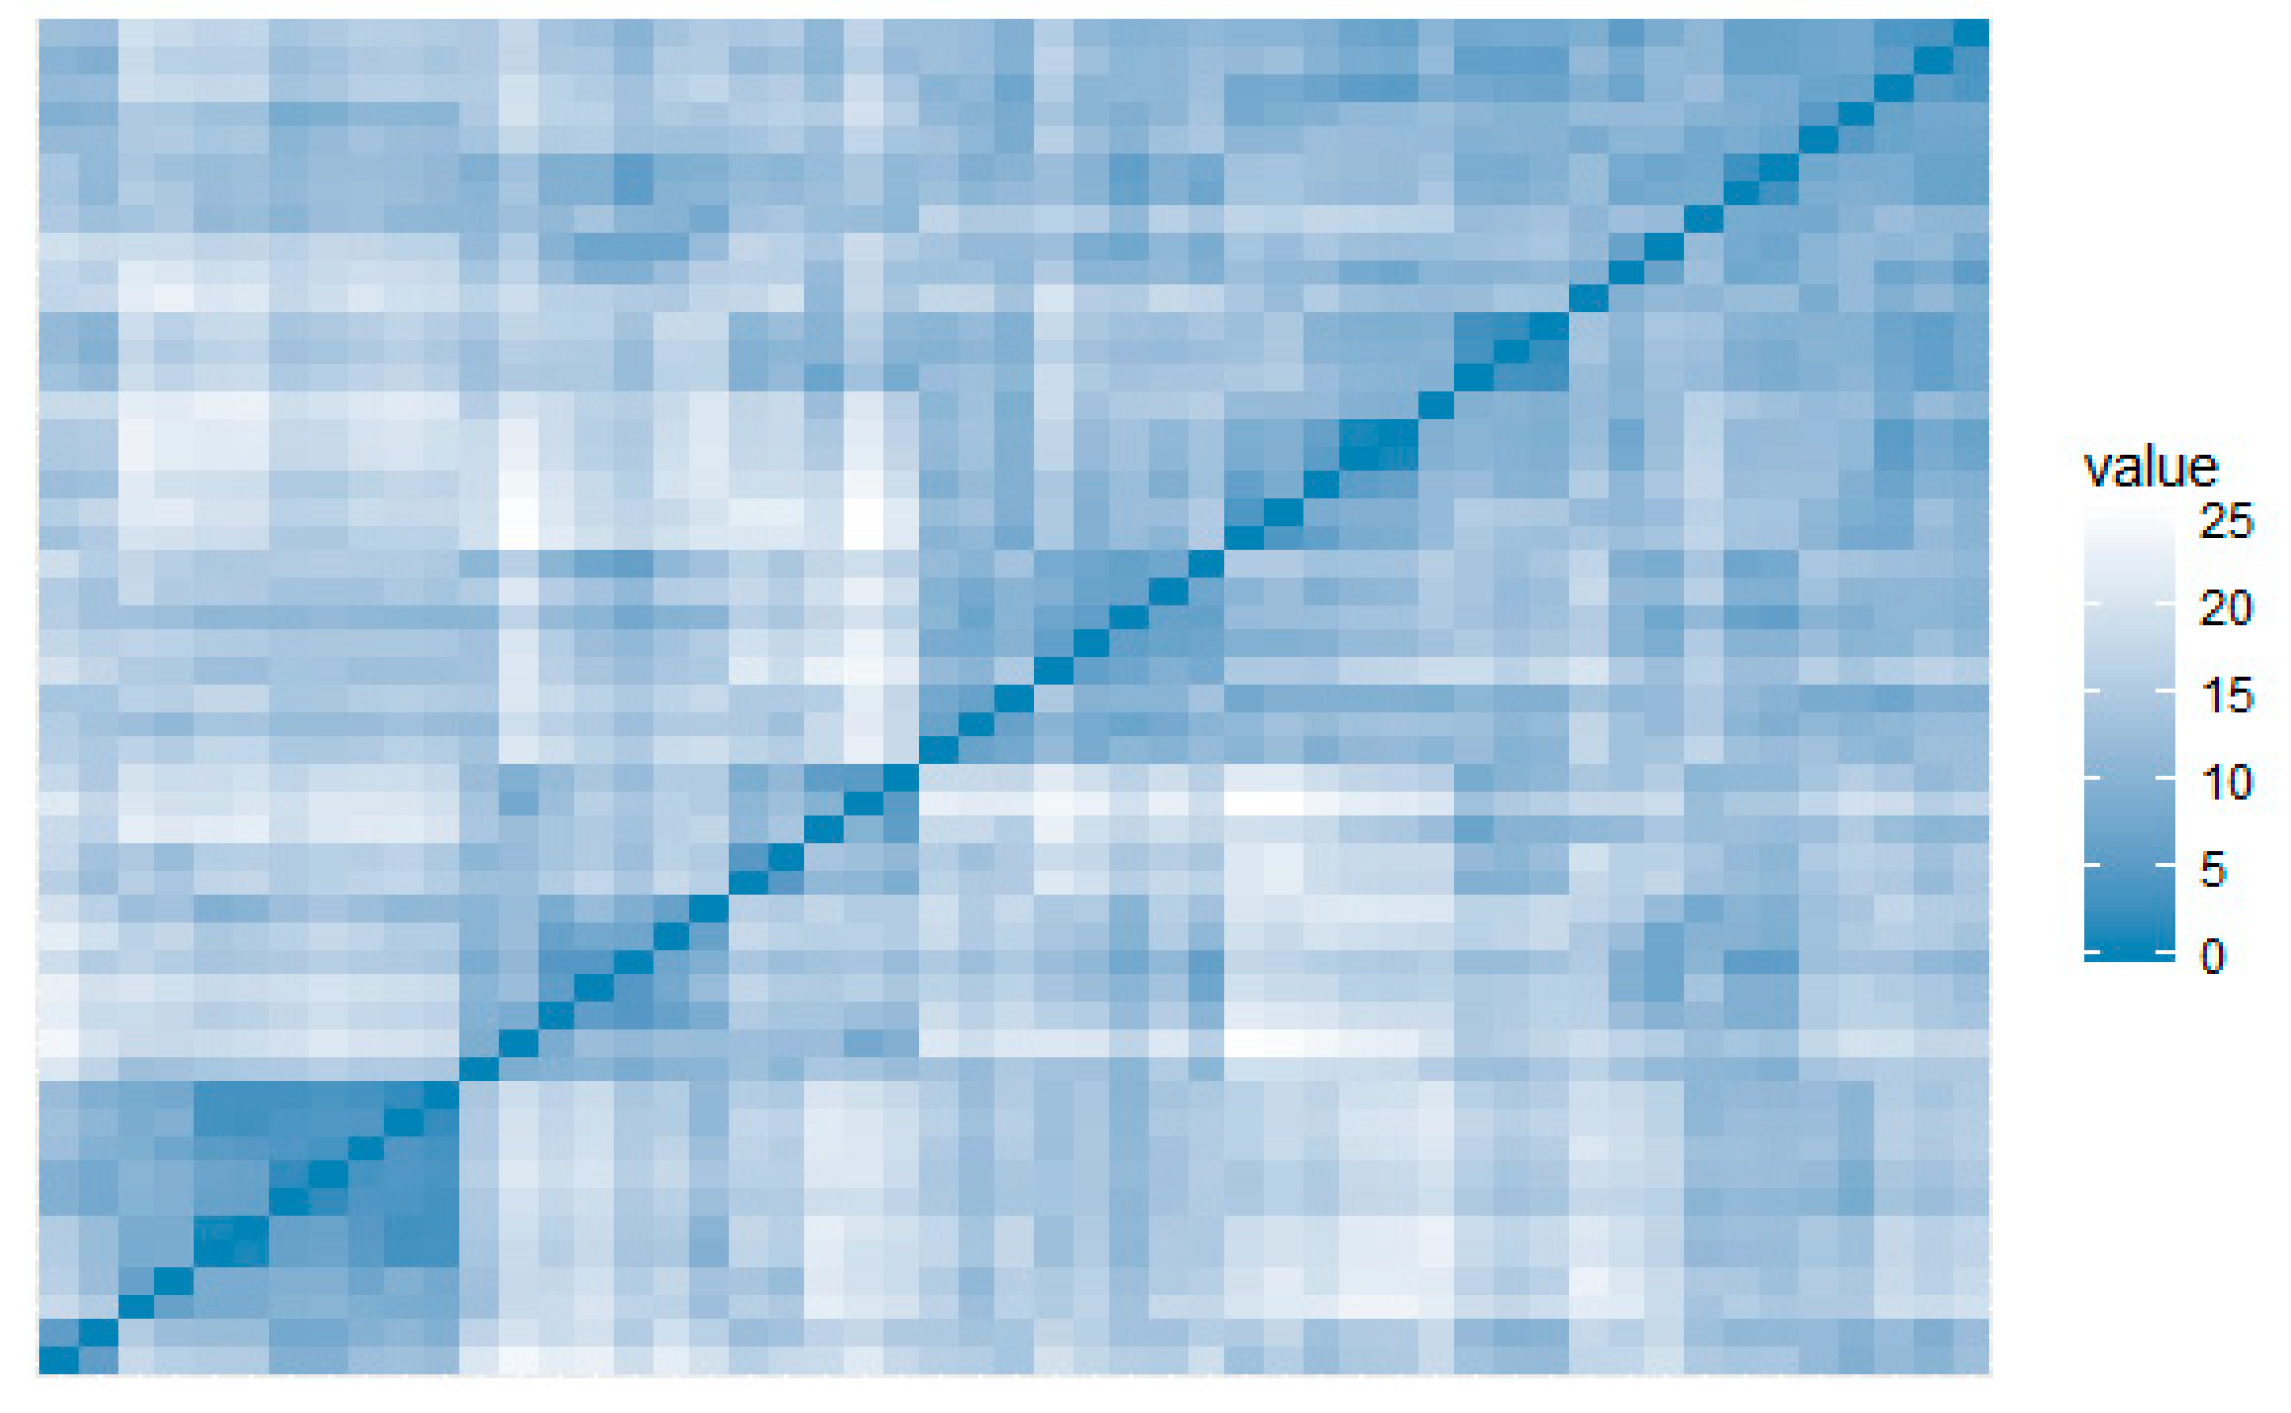
The visual assessment of the cluster tendency (VAT) metric performs an evaluation of the quality of clustering. This highlights opportunities for scaling to bigger datasets [30], making it particularly suitable for IoT scaling applications. VAT did not identify clusters for this dataset, showing low propensity to form groups (Figure 4).
The cophenetic correlation is used for evaluation of hierarchical clustering methods. This is a measure of how faithfully a dendrogram preserves the pairwise distances between the original unmodeled data points. The cophenetic correlation can also be calculated between the original distance matrix and the cophenetic distance matrix, which can serve as a measure of the adequacy of the cluster solution compared to the initial data.
The evaluation of five hierarchical clusters was performed by this indicator, which were compared in the previous section.
		##            Complete Single Average Centroid Ward.D2
		## W-Mantel   0.698  0.541   0.718    0.607   0.698
		## Р-value    0.001  0.001   0.001    0.001   0.001
Thus, in order to find personalized solutions, it is suggested to take into account the average values of a particular cluster, which will determine the optimal conditions of the patient.
By applying the naive Bayes method, the value of the random variable was calculated, achieving an a posteriori maximum for classes 1, 4, and 5 (Table 1).
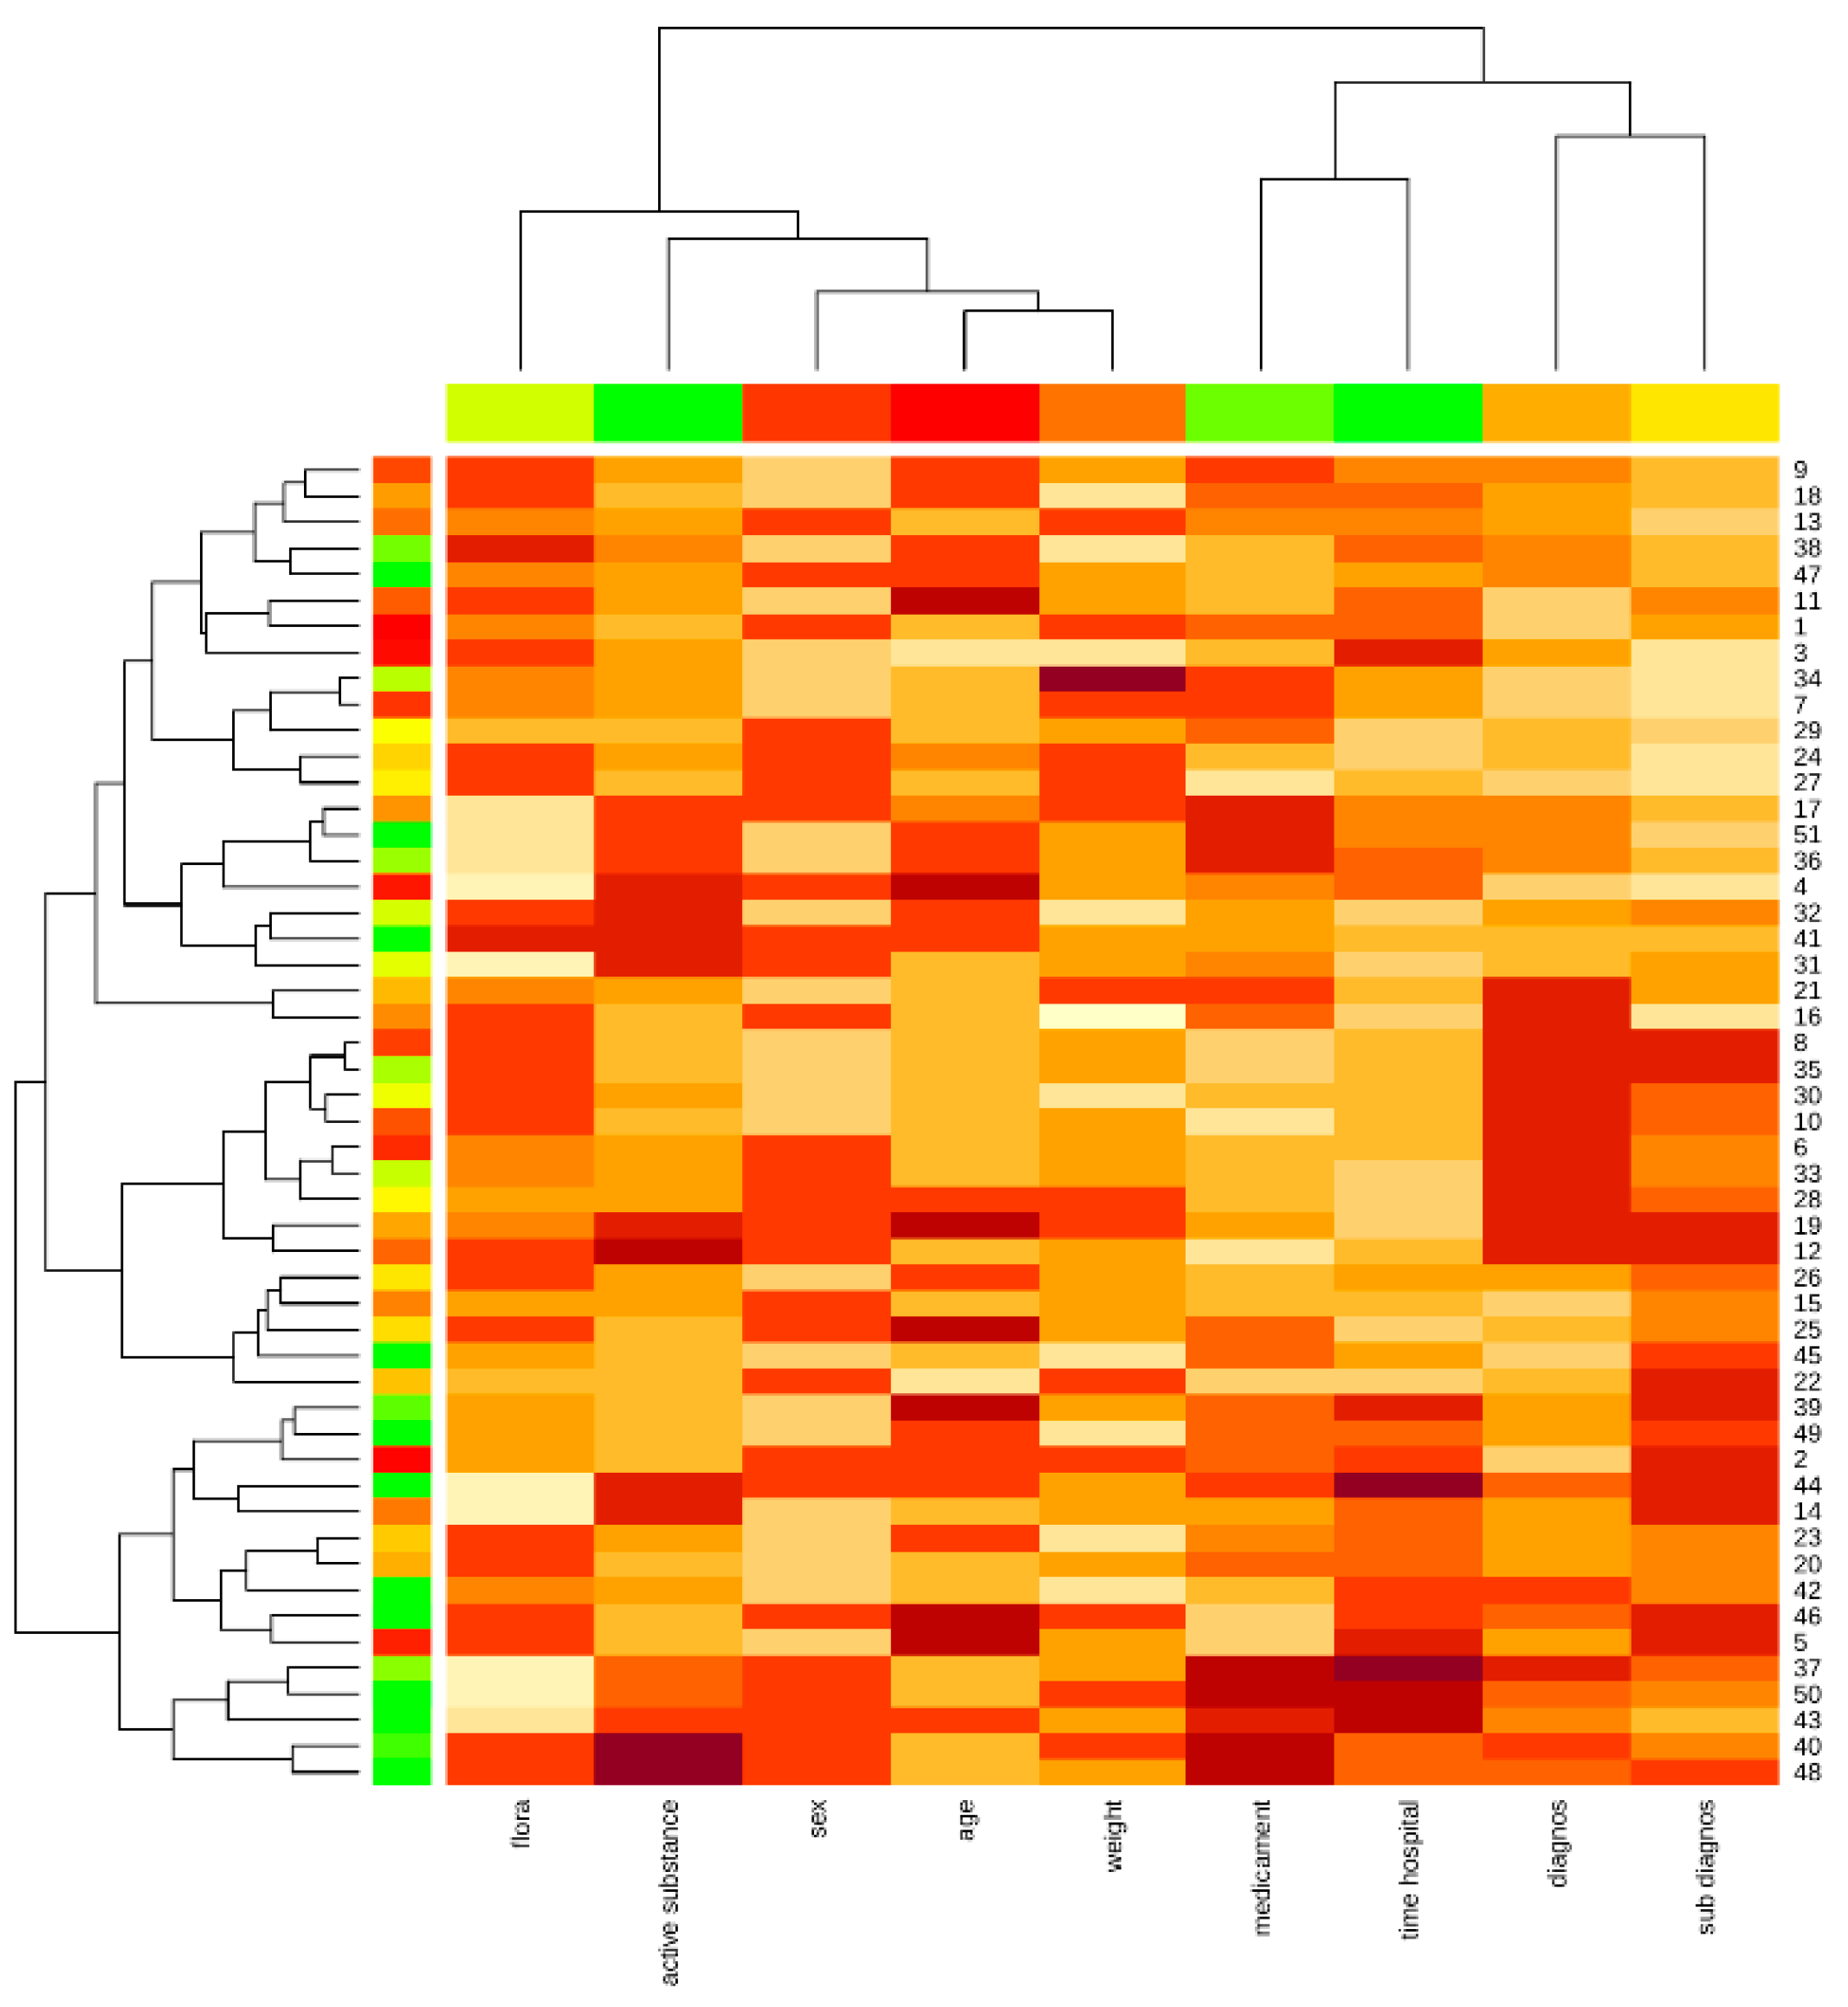
The Kohonen map shows the proximity of the patient’s weight and age attributes, as well as the diagnosis and concomitant diagnosis, medication, and hospital stay, highlighting the affinity of the data and the impact on the object under study (Figure 5).
In summary, the quality metrics for different clustering algorithms are not too high for the analyzed dataset.
3.3. The Proposed Clustering Method
In this paper, an ensemble based on the k-means clustering algorithm was used. The main purpose of the modification was to find the anomalous clusters.
The state space of the object in this study is given as a Euclidean space. This allows the state space to be presented as a multidimensional system in the time domain. In order to describe the relationships between them, it is advisable to analyze the criterion of divergence between patients.
Suppose that a group of instances belonging to class Gi contains M examples. The diagnostic measure of distance is selected and then the distance from point aij to point aim included in the group of verified examples (quadratic measure) is defined as:
where:
Therefore:
where:
Here, is the difference between parameter values, n is the number of parameters, m is the number of patients that are being clustered, and is the normalization factor.
The unequal attributes can have different ranges of represented entities in the selection. This is why the distance can be dependent on attributes with large ranges. Therefore, data must be normalized. The optimal distance to the optimal parameter value can be used for each defined cluster. It is possible to determine the average distance from point aij to points of a training sequence belonging to the :
The following steps present the proposed algorithm (Algorithm 1).
| Algorithm 1. The clustering algorithm (CA). |
| Input data: FC |
| Output data: clustering vector, sum of squares SS by cluster, gravity center vector. |
|
The novelty of the proposed clustering method was in the possibility for parallelized grouping for each clustering number, as well as the new distance measurement. This method is similar to hierarchical clustering because it allows grouping without cluster number initialization. The difference is in the distance evaluation technique, which can find distances between objects, as well as between separated parameters of an object. This is very important for multidimensional datasets. The next advantage compared to hierarchical clustering is the better time complexity. The best time complexity for hierarchical clustering with a heap of the run time for the general case can be reduced to O (n 2 log n). Simultaneously, the time complexity of the proposed method is O (n 2).
3.4. The Algorithm used for Finding Personalized Treatment
The next stage is the detection of outliers. The outliers can affect the clustering results by shifting the cluster centers. However, it is most important to find outliers for personalized treatment. The outliers can be evaluated based on the distance (Equation (9)). Then, relationships between patient parameters, indicators, and contraindicators of medicaments from the recommended list should be found. To do this, the a priori algorithm [31] can be used.
The personalized treatment algorithm is shown below (Algorithm 2).
| Algorithm 2. Finding a personalized treatment (PTA). |
| Input data: FC, clustering vector, gravity center vector. |
| Output data: clustering vector, sum of squares SS by cluster, center of gravity vector. |
|
4. Results
To compare the results with well-known methods, we created three clusters based on the proposed clustering method. The minimum difference between values of the membership function for one instance was 0.23. This value demonstrates that the better clustering result was better than the fuzzy c-means method.
In addition, the Hopkins statistics method [32] was used to assess the quality of the clustering algorithm evaluation (Table 2). The statistics method was used for evaluation of the density-based clustering algorithm.
The Hopkins statistics values greater than 0.5 for objects wi and qi corresponded to the null hypothesis that wi and qi are similar, while the grouped objects were distributed randomly and uniformly. A value of Hind < 0.25 at a 90% confidence level indicates a tendency for data grouping.
Therefore, the Hopkins statistics value of the proposed method is not dominated by the k-means, fuzzy c-means, or Kohonen maps methods for different numbers of clusters. DBSCAN, with an epsilon neighborhood equal to 0.2, also shows good results for small number of clusters.
The Dunn index is defined as the ratio between the minimal intercluster distance and the maximal intracluster distance for algorithm evaluations [33,34]. If the dataset contains compact and well-separated clusters, the diameter of the clusters is expected to be small and the distance between the clusters is expected to be large. Thus, the Dunn index should be maximized. This metric is used for hierarchical clustering analysis with three clusters (Table 3).
Thus, the proposed method is not dominated by other methods based on the Dunn index estimation.
The results of the algorithm for outlier mining and personalization of treatment was evaluated by experts with more than 20 years’ experience in purulent surgical infection of soft tissues and antibiotic therapy in the treatment of diseases caused by purulent surgical infection.
Personalized treatment was proposed for seven out of 36 patients (step 2 of the algorithm). The min_support was set to 40%. The number of frequent rules (relations between time-independent and time-dependent parameters) was nine (step 3). The medicament reduction rate was 52%. The experts confirmed the correctness of medicament treatment for six out of seven patients.
The most important associative rules are given in Table 4.
As a result, the confirmed correctness level of the proposed medical decisions is 86%.
5. Discussion
According to the results of the research, it is possible to point out the significance of such factors as the heterogeneity of data, subjective assessments of psychological indicators, and temporal changes in the characteristics of the general state of the investigated object. The medical data processing also requires the development of appropriate solutions for data collection, transmission, storage, and protection [19,21,32,35]. On one hand, most of analyzed algorithms solve the above problems effectively, but on other hand do not cover the entire list of problems associated with the personalized treatment. In this article, the method of patient clustering is applied. This determines the conditional measure of similarity of the objects, combining them into clusters. The patient’s condition is assumed as the average cluster score. The Euclidean distance is usually used as a measure of proximity. Using the partition clustering method, the number of clusters is unknown and selected by the researcher, while the quality of the clustering depends on the primary separation using the elbow method [23]. Thus, the following disadvantages appear for such methods:
- The specificity of each patient is not taken into account—all users are divided into classes;
- If there is no characteristic value in the cluster, it will not be possible to obtain a recommendation.
The usage of the DBSCAN method shows the absence of densely filled sections of the state space. The correlation between the attributes is negligible.
One of the simplest classification algorithms is the naive Bayes method. However, quite often this works better than algorithms that are more complicated. This method is based on the assumption that all the variables under consideration are independent of each other [14]. In the example given in Table 2, the a posteriori maximum of only a few classes is achieved.
The advantages of this method are as follows:
- Classification, including of many classes, is done quickly;
- When the assumption of independence is fulfilled, the classifier outperforms other algorithms, such as logistic regression, while requiring less training data;
- The algorithm works better with categorical features than continuous ones.
The disadvantages of this method are:
- If there is a value of a categorical type in the test dataset that is not found in the training dataset, the model assigns a zero probability to this value and cannot make a prediction;
- Although the algorithm is a good classifier, the values of predicted probabilities are not always sufficiently accurate.
6. Conclusions
The research was carried out on the development of an intellectual analysis method for medical datasets to solve the problem of object clustering. Consequently, it was compared with existing data mining methods.
It was suggested to determine the average distance between instances of classes in order to find priority signs of influence, which help to detect the best instance state of a cluster.
The formalization of the medical data for personalized solutions supporting the preprocessing stage is proposed in accordance with current standards and pharmaceutical protocols.
The paper proposes the classification of persons by state in order to determine the deviation of the parameters from the average rate of the group. The proposed method made it feasible to create a personalized approach to analyze the conditions and make recommendations for each patient based on long-term follow-up and monitoring under the guidance of a physician.
Appropriately, using the results of the analysis, it becomes possible to predict the optimal general state for a particular person, which will help to improve satisfaction and ensure patient longevity.
Author Contributions
Conceptualization, N.M. and N.S.; methodology, N.M.; software, N.S.; validation, N.M. and V.M.; formal analysis, N.S.; investigation, N.M.; resources, V.M.; data curation, V.M.; writing—original draft preparation, M.Z. and O.V.; writing—review and editing, M.G. and O.V.; visualization, N.M. and M.Z.; supervision, N.S.; project administration, M.G.; funding acquisition, M.G. All authors have read and agreed to the published version of the manuscript.
Funding
This research was partially supported by the Ukrainian Ministry of Science and Innovation, through the Information Technology for Psychophysical Portrait Formation in Stressful Situations project (0120U102194, and Information Technology for Processing Personalized Medical Information project (0119U002257).
Conflicts of Interest
The authors declare no conflict of interest. The funders had no role in the design of the study; in the collection, analyses, or interpretation of data; in the writing of the manuscript, or in the decision to publish the results.
Abbreviations
The following abbreviations are used in this manuscript:
| AI | Artificial Intelligence |
| ANN | Artificial Neural Networks |
| BIRCH | Balanced Iterative Reducing and Clustering using Hierarchies |
| DBSCAN | Density-Based Spatial Clustering of Applications with Noise |
| IoT | Internet of Things |
| PM | Personalized Medicine |
| RAM | Random Access Memory |
| VAT | Visual Assessment of Cluster Tendency Metric |
References
- Waring, J.; Lindvall, C.; Umeton, R. Automated Machine Learning: Review of the State-of-the-Art and Opportunities for Healthcare. Artif. Intell. Med. 2020, 104, 101822. [Google Scholar] [CrossRef]
- Kharkovyna, O. Artificial Intelligence & Deep Learning for Medical Diagnosis. 13 November 2019. Available online: https://towardsdatascience.com/artificial-intelligence-deep-learning-for-medical-diagnosis-9561f7a4e5f/ (accessed on 20 April 2020).
- Ng, M.-F.; Zhao, J.; Yan, Q.; Conduit, G.J.; Seh, Z.W. Predicting the State of Charge and Health of Batteries Using Data-Driven Machine Learning. Nat. Mach. Intell. 2020, 2, 161–170. [Google Scholar] [CrossRef] [Green Version]
- Godman, B.; Wettermark, B.; van Woerkom, M.; Fraeyman, J.; Alvarez-Madrazo, S.; Berg, C.; Bishop, I.; Bucsics, A.; Campbell, S.; Finlayson, A.E.; et al. Multiple policies to enhance prescribing efficiency for established medicines in Europe with a particular focus on demand-side measures: Findings and future implications. Front. Pharmacol. 2014, 5, 106. [Google Scholar] [CrossRef] [PubMed] [Green Version]
- Artificial Intelligence in Medicine | Machine Learning. Available online: https://www.ibm.com/watson-health/learn/artificial-intelligence-medicine (accessed on 20 April 2020).
- Democratizing Data-Driven Medicine. Available online: https://www.sophiage-netics.com/home.html (accessed on 20 April 2020).
- Calvanese, D.; De Giacomo, G.; Lembo, D.; Lenzerini, M.; Poggi, A.; Rosati, R. Calvan with using of fuzzy logic eseand. Ontology-based database access. In Proceedings of the Fifteenth Italian Symposium on Advanced Database Systems, SEBD–2007, Fasano, BR, Italy, 17–20 June 2007; pp. 324–331. [Google Scholar]
- Tkachenko, R.; Izonin, I. Model and Principles for the Implementation of Neural-Like Structures based on Geometric Data Transformations. In Advances in Computer Science for Engineering and Education; ICCSEEA2018; Advances in Intelligent Systems and Computing; Hu, Z.B., Petoukhov, S., Eds.; Springer: Cham, Switzerland, 2019; Volume 754, pp. 578–587. [Google Scholar] [CrossRef]
- Tkachenko, R.; Izonin, I.; Kryvinska, K.; Chopyak, V.; Lotoshynska, N.; Danylyuk, D. Piecewise-linear Approach for Medical Insurance Costs Prediction using SGTM Neural-Like Structure. In Proceedings of the 1st International Workshop on Informatics & Data-Driven Medicine (IDDM 2018), Lviv, Ukraine, 28–30 November 2018; Shakhovska, N., Montenegro, S., Estève, Y., Subbotin, S., Kryvinska, N., Izonin, I., Eds.; pp. 170–179. [Google Scholar]
- Tkachenko, I.; Izonin, P.; Vitynskyi, N.L. Development of the Non-Iterative Supervised Learning Predictor Based on the Ito Decomposition and SGTM Neural-Like Structure for Managing Medical Insurance Costs. Data 2018, 3, 46. [Google Scholar] [CrossRef] [Green Version]
- Telenyk, S.; Czajkowski, K.; Bidiuk, P.; Zharikov, E. Method of Assessing the State of Monuments based on Fuzzy Logic. In Proceedings of the 10th IEEE International Conference on Intelligent Data Acquisition and Advanced Computing Systems: Technology and Applications (IDAACS), Metz, France, 18–21 September 2019; Volume 1, pp. 500–506. [Google Scholar]
- Dangare, C.S.; Apte, S.S. Improved study of heart disease prediction system using data mining classification techniques. Int. J. Comput. Appl. 2012, 47, 44–48. [Google Scholar]
- Vijiyarani, S.; Sudha, S. Disease prediction in data mining technique—A survey. Int. J. Comput. Appli. Inf. Technol. 2013, 2, 17–21. [Google Scholar]
- Tang, Y.; Wang, Y.; Cooper, K.M.; Li, L. Towards big data bayesian network learning—An ensemble learning based approach. In Proceedings of the 2014 IEEE International Congress on Big Data, Anchorage, AK, USA, 27 June–2 July 2014; pp. 355–357. [Google Scholar]
- Mulesa, P.; Perova, I. Fuzzy Spacial Extrapolation Method Using Manhattan Metrics for Tasks of Medical Data Mining. In Proceedings of the 10th International Conference on Computer Science and Information Technologies CSIT’2015, Lviv, Ukraine, 14–17 September 2015; pp. 104–106. [Google Scholar]
- Bodyanskiy, Y.; Perova, I.; Vynokurova, O.; Izonin, I. Adaptive Wavelet Diagnostic Neuro-Fuzzy System for Biomedical Tasks. In Proceedings of the 14th International Conference on Advanced Trends in Radioelectronics, Telecommunications and Computer Engineering (TCSET), Lviv-Slavske, Ukraine, 20–24 February 2018; pp. 20–24. [Google Scholar]
- Perova, I.; Litovchenko, O.; Bodvanskiy, Y.; Brazhnykova, Y.; Zavgorodnii, I.; Mulesa, P. Medical Data-Stream Mining in the Area of Electromagnetic Radiation and Low Temperature Influence on Biological Objects. In Proceedings of the 2018 IEEE Second International Conference on Data Stream Mining & Processing (DSMP), Lviv, Ukraine, 21–25 August 2018; pp. 3–6. [Google Scholar]
- Perova, I.; Bodyanskiy, Y.; Brazhnykova, Y.; Mulesa, P. Neural Network for Online Principal Component Analysis in Medical Data Mining Tasks. In Proceedings of the IEEE First International Conference on System Analysis & Intelligent Computing (SAIC), Kyiv, Ukraine, 8–12 October 2018; pp. 150–154. [Google Scholar]
- Izonin, I. The combined use of the wiener polynomial and SVM for material classification task in medical implants production. Int. J. Intell. Syst. Appl. 2018, 9, 40–47. [Google Scholar] [CrossRef] [Green Version]
- Awwalu, J.; Garba, A.G.; Ghazvini, A.; Atuah, R. Artificial intelligence in personalized medicine application of AI algorithms in solving personalized medicine problems. Int. J. Comput. Theory Eng. 2015, 7, 439. [Google Scholar] [CrossRef] [Green Version]
- Melnykova, N.; Shakhovska, N.; Sviridova, T. The personalized approach in a medical decentralized diagnostic and treatment. In Proceedings of the 2017 14th International Conference the Experience of Designing and Application of CAD Systems in Microelectronics (CADSM), Lviv, Ukraine, 21–25 February 2017; pp. 295–297. [Google Scholar]
- Ramprasanth, H.; Devi, A. Outlier Analysis of Medical Dataset Using Clustering Algorithms. J. Anal. Comput. 2019, 15, 1–9. [Google Scholar]
- Bai, B.M.; Nalini, B.M.; Majumdar, J. Analysis and detection of diabetes using data mining techniques—A big data application in health care. In Emerging Research in Computing, Information, Communication and Applications; Springer: Singapore, 2019; pp. 443–455. [Google Scholar]
- Dudik, J.M.; Kurosu, A.; Coyle, J.L.; Sejdić, E. A comparative analysis of DBSCAN, K-means, and quadratic variation algorithms for automatic identification of swallows from swallowing accelerometry signals. Comput. Boil. Med. 2015, 59, 10–18. [Google Scholar] [CrossRef] [PubMed] [Green Version]
- Cheng, D.; Zhu, Q.; Huang, J.; Wu, Q.; Yang, L. A local cores-based hierarchical clustering algorithm for data sets with complex structures. Neur. Comput. Appl. 2019, 31, 8051–8068. [Google Scholar] [CrossRef]
- Ajayi, A.; Oyedele, L.; Delgado, J.M.D.; Akanbi, L.; Bilal, M.; Akinade, O.; Olawale, O. Big data platform for health and safety accident prediction. World J. Sci. Technol. Sustain. Dev. 2019, 16. [Google Scholar] [CrossRef]
- Martinez-Garcia, M.; Zhang, Y.; Wan, J.; Mcginty, J. Visually interpretable profile extraction with an autoencoder for health monitoring of industrial systems. In Proceedings of the 2019 IEEE 4th International Conference on Advanced Robotics and Mechatronics (ICARM), Toyonaka, Japan, 3–5 July 2019; pp. 649–654. [Google Scholar]
- Martinez-Garcia, M.; Gordon, T. A new model of human steering using far-point error perception and multiplicative control. In Proceedings of the 2018 IEEE International Conference on Systems, Man, and Cybernetics (SMC), Miyazaki, Japan, 7–10 October 2018; pp. 1245–1250. [Google Scholar]
- Melnykova, N. Semantic search personalized data as special method of processing medical information. In Advances in Intelligent Systems and Computing; Springer: Cham, Switzerland, 2017; pp. 315–325. [Google Scholar]
- Havens, T.C.; Bezdek, J.C. An efficient formulation of the improved visual assessment of cluster tendency (iVAT) algorithm. IEEE Trans. Knowl. Data Eng. 2011, 24, 813–822. [Google Scholar] [CrossRef]
- Shakhovska, N.; Kaminskyy, R.; Zasoba, E.; Tsiutsiura, M. Association rules mining in big data. Int. J. Comput. 2018, 17, 25–32. [Google Scholar]
- Hopkins, W.; Marshall, S.; Batterham, A.; Hanin, J. Progressive statistics for studies in sports medicine and exercise science. Med. Sci. Sports Exerc. 2009, 41, 3. [Google Scholar] [CrossRef] [PubMed] [Green Version]
- Arzubov, M.; Shakhovska, N.; Lipinski, P. Analyzing ways of building user profile based on web surf history. In Proceedings of the 2017 12th International Scientific and Technical Conference on Computer Sciences and Information Technologies (CSIT), Lviv, Ukraine, 5–8 September 2017; Volume 1, pp. 377–380. [Google Scholar]
- Garay, A.B.; Contreras, G.P.; Escarcina, R.P. A GH-SOM optimization with SOM labelling and dunn index. In Proceedings of the 2011 11th International Conference on Hybrid Intelligent Systems (HIS), Melacca, Malaysia, 5–8 December 2011; pp. 572–577. [Google Scholar]
- Cui, X.; Yang, S.; Wang, D. An algorithm of apriori based on medical big data and cloud computing. In Proceedings of the 2016 4th International Conference on Cloud Computing and Intelligence Systems (CCIS), Beijing, China, 17–19 August 2016; pp. 361–365. [Google Scholar]
Figure 1.
An example of a document-oriented graph.
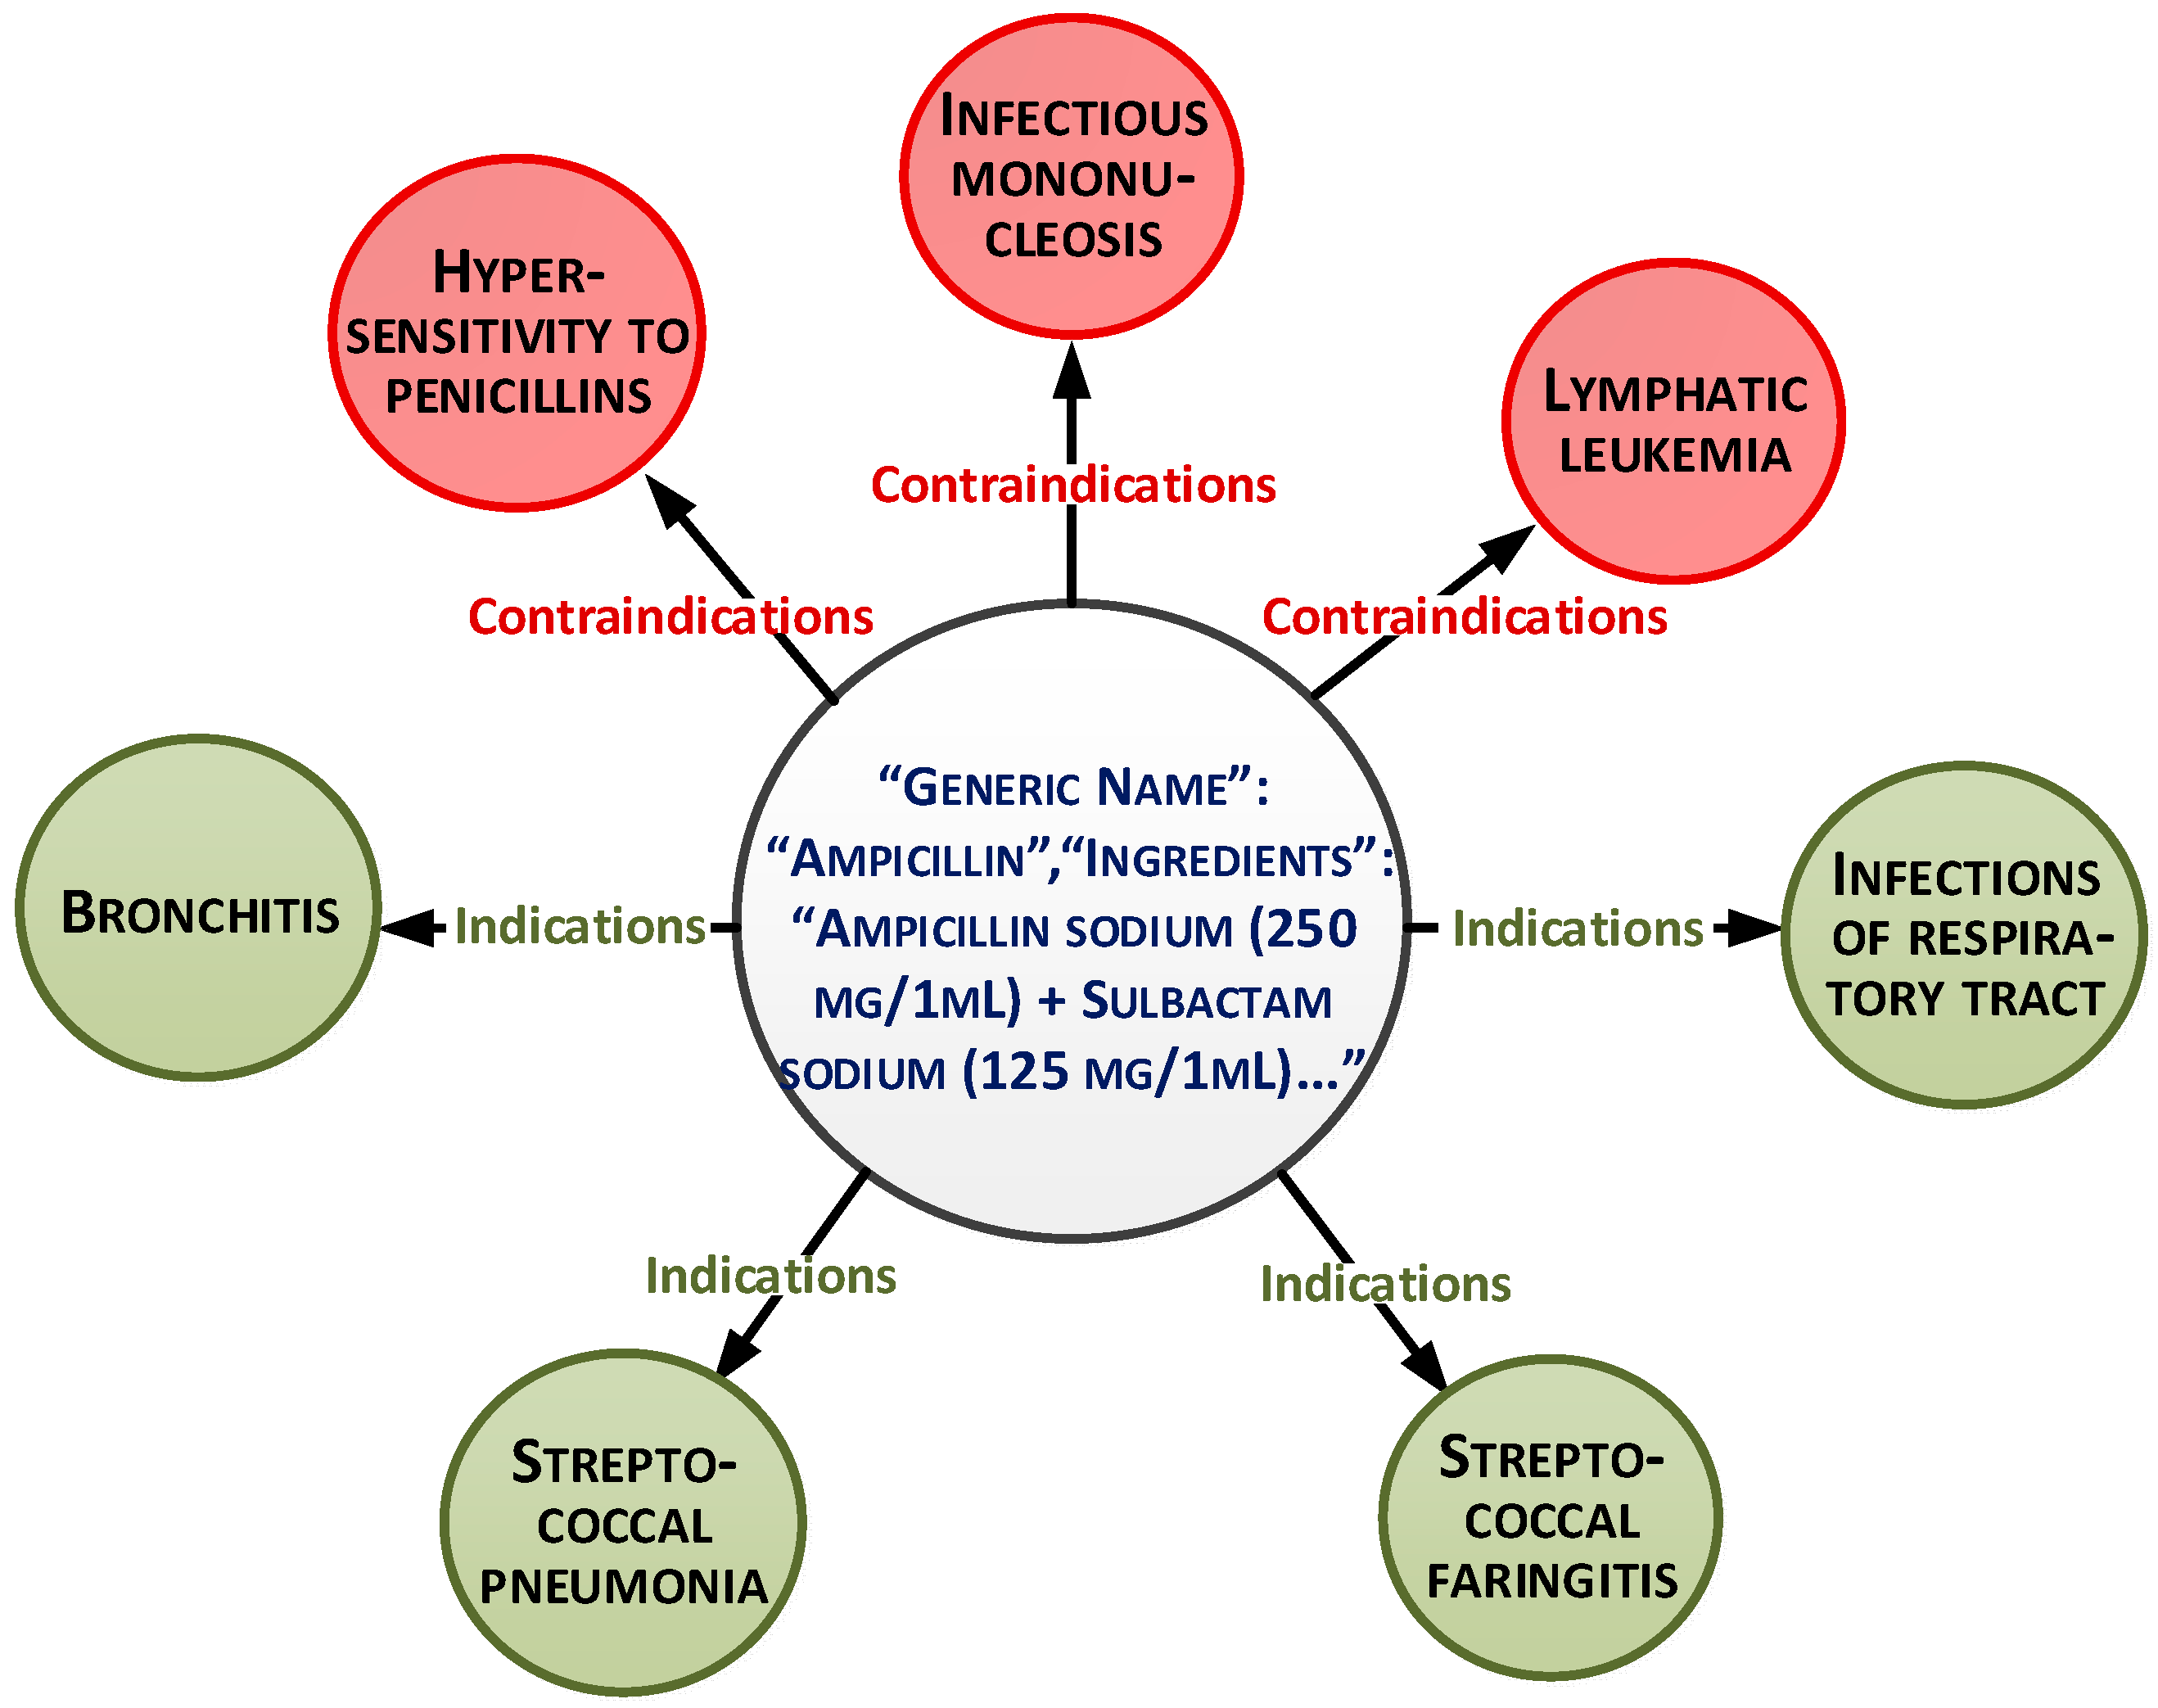
Figure 2.
Applying the gap statistics method to find the optimal number of clusters.
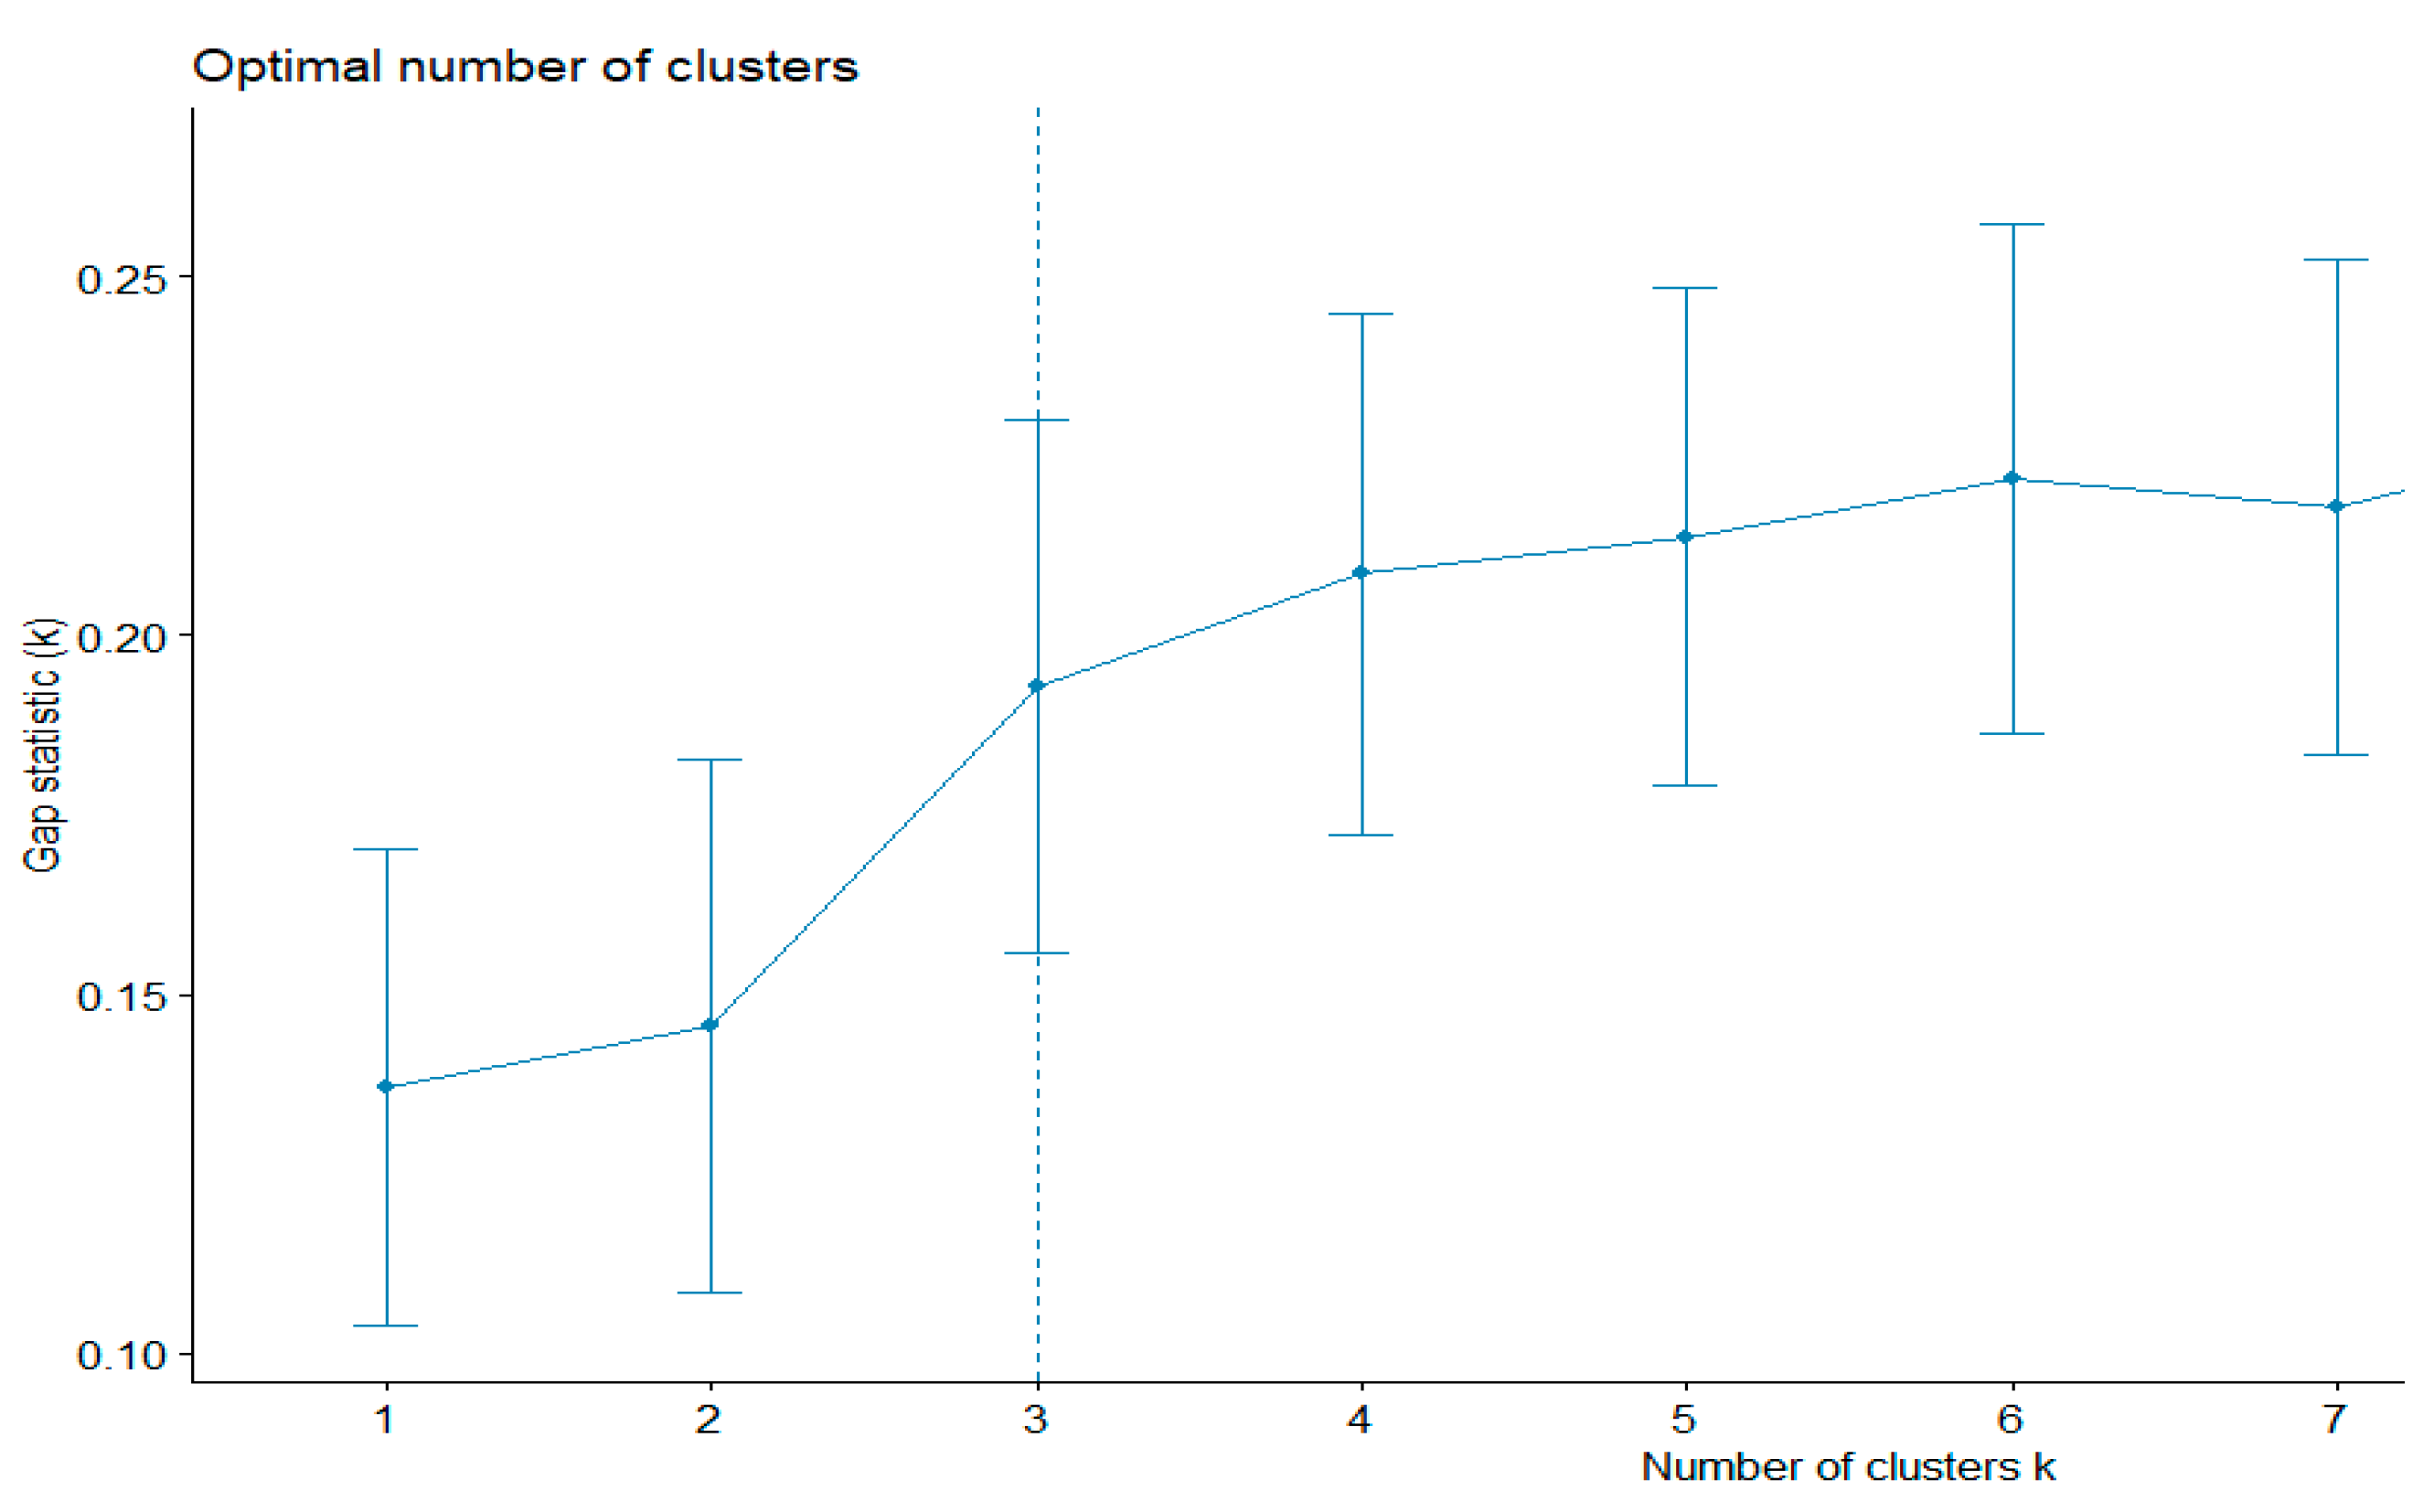
Figure 3.
Applying the k-means method to determine the distribution of elements between clusters.
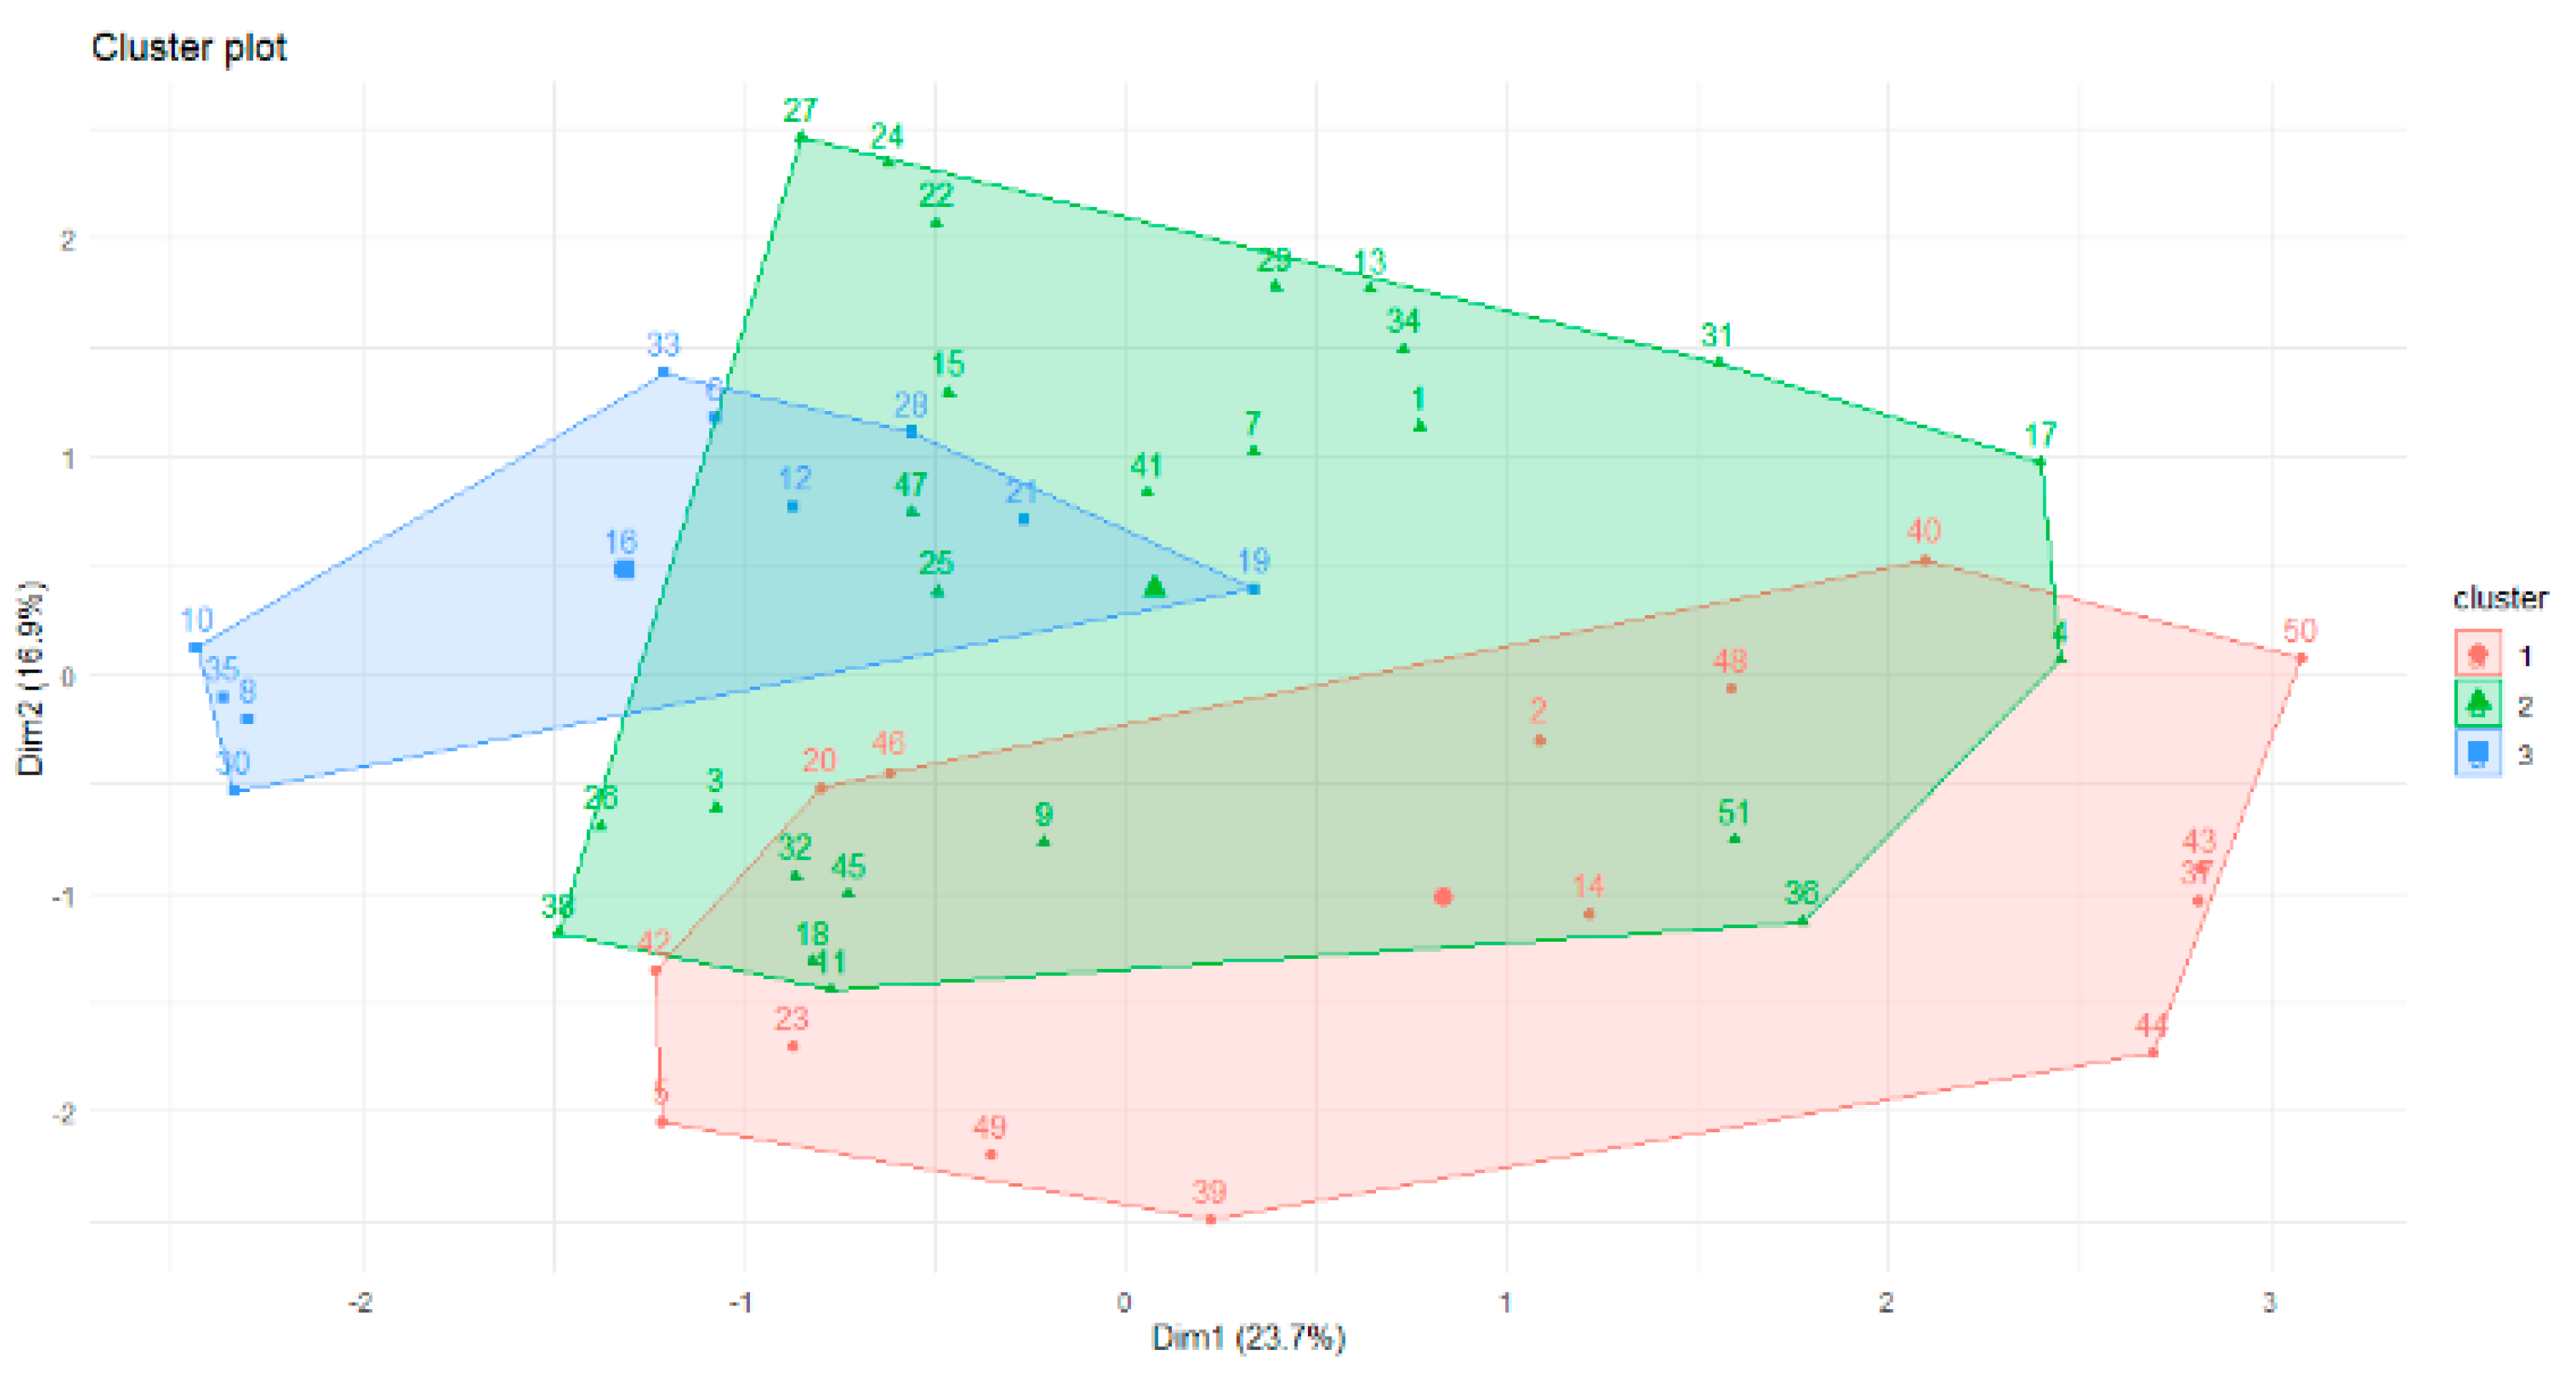
Figure 4.
The quality of clustering based on visual assessment of the cluster tendency (VAT).

Figure 5.
Patient placement in the component space.


Table 1.
Results of the naive Bayes method.
| Class | 1 | 2 | 3 | 4 | 5 | |
|---|---|---|---|---|---|---|
| Statistics | ||||||
| Sensitivity | 0.00000 | 0.8000 | 0.6000 | 0.00000 | 1.0000 | |
| Specificity | 1.00000 | 0.7647 | 0.7647 | 1.00000 | 0.9167 | |
| Positive Predictive Value | 0.00000 | 0.6667 | 0.6000 | 0.00000 | 0.6000 | |
| Negative Predictive Value | 0.96296 | 0.8667 | 0.7647 | 0.92593 | 1.0000 | |
| Prevalence | 0.03704 | 0.3704 | 0.3704 | 0.07407 | 0.1111 | |
| Detection Rate | 0.00000 | 0.2963 | 0.2222 | 0.00000 | 0.1111 | |
| Detection Prevalence | 0.00000 | 0.4444 | 0.3704 | 0.00000 | 0.1852 | |
| Balanced Accuracy | 0.50000 | 0.7824 | 0.6824 | 0.50000 | 0.9583 | |
Table 2.
Results of the Hopkins statistics method for evaluation of clustering methods.
| Method | k-Means | Fuzzy c-Means | Kohonen Map | DBSCAN | Proposed Method CA | |
|---|---|---|---|---|---|---|
| Numb. of Clusters | ||||||
| 3 | 0.35 | 0.35 | 0.32 | 0.24 | 0.22 | |
| 5 | 0.4 | 0.4 | 0.38 | 0.27 | 0.25 | |
| 7 | 0.5 | 0.45 | 0.5 | 0.31 | 0.38 | |
Table 3.
Results of the Dunn index for evaluation of clustering methods.
| Hierarchical Clustering, Ward Link | Hierarchical Clustering, Single Link | BIRCH | Proposed Method (CA) |
|---|---|---|---|
| 0.45 | 0.42 | 0.56 | 0.59 |
Table 4.
Associative rule parameters.
| Rule | Support | Confidence | Lift | Count |
|---|---|---|---|---|
| {Gastroenteritis } => {Azymed} | 0.046153846 | 0.46153846 | 1.8181818 | 6 |
| {Cystic fibrosis } => {Creon} | 0.046153846 | 0.18181818 | 1.8181818 | 6 |
| {Obstruction of the bile ducts} => {Ursoliv} | 0.015384615 | 0.11111111 | 0.6565657 | 4 |
| {Acute Inflammation of the Gallbladder } => { Ursoliv} | 0.015384615 | 0.09090909 | 0.6565657 | 3 |
© 2020 by the authors. Licensee MDPI, Basel, Switzerland. This article is an open access article distributed under the terms and conditions of the Creative Commons Attribution (CC BY) license (http://creativecommons.org/licenses/by/4.0/).
Share and Cite
MDPI and ACS Style
Melnykova, N.; Shakhovska, N.; Gregus, M.; Melnykov, V.; Zakharchuk, M.; Vovk, O. Data-Driven Analytics for Personalized Medical Decision Making. Mathematics 2020, 8, 1211. https://doi.org/10.3390/math8081211
AMA Style
Melnykova N, Shakhovska N, Gregus M, Melnykov V, Zakharchuk M, Vovk O. Data-Driven Analytics for Personalized Medical Decision Making. Mathematics. 2020; 8(8):1211. https://doi.org/10.3390/math8081211
Chicago/Turabian StyleMelnykova, Nataliia, Nataliya Shakhovska, Michal Gregus, Volodymyr Melnykov, Mariana Zakharchuk, and Olena Vovk. 2020. "Data-Driven Analytics for Personalized Medical Decision Making" Mathematics 8, no. 8: 1211. https://doi.org/10.3390/math8081211
Note that from the first issue of 2016, this journal uses article numbers instead of page numbers. See further details here.