Abstract
This study presents a reliable particle swarm optimizer for sizing optimization of truss structures. This population-based stochastic optimization approach is based on the principle that each particle communicates its position and function value to a number of successively numbered neighboring particles via a fixed cyclic interaction structure. Therefore, such a neighborhood structure changes the movement pattern of the entire swarm, and allows each particle’s movement not to be driven by one global best particle position, which enhances the diversification attitude. Further, by transforming the objective function, it is possible to steer the search towards feasible regions of design space. The efficiency of the proposed approach is demonstrated by solving four classical sizing optimization problems of truss structures.
1. Introduction
Sizing optimization of truss structures is one of the most important topics in structural optimization [1,2,3,4,5,6,7,8]. In these problems, the cross-sectional areas of various elements are included as design variables, while the structure layout and topology are fixed. Efficient optimization algorithms are needed to find the global optimum, satisfying optimization constraints. A number of mathematical programming methods, such as sequential unconstrained minimization technique [9], feasible directions method [10,11], moving asymptotes method [12], and sequential quadratic programming [13] exhibit fast convergence and high accuracy. However, they inherently exploit specific problem-dependent properties, such as differentiability and convexity. These may limit their applicability to truss optimization problems [5].
Meta-heuristic optimization methods, including genetic algorithm (GA), particle swarm optimization (PSO), ant colony optimization (ACO), simulated annealing (SA), differential evolution (DE), harmony search (HS) teaching-learning-based optimization (TLBO), and ray optimization (RO), underwent a tremendous surge in popularity and applicability over the past few decades. However, employing meta-heuristic methods in structural optimization problems may be very cumbersome, as these techniques were originally developed for unconstrained problems. In such cases, various constraint-handling methods are available. For example, there are the modified feasible-based mechanism [1,3], penalty approach [4,14], augmented Lagrange multiplier approach [5,15], violated design points redirection [7,16], fly-back mechanism method [8], problem reformulation as an unconstrained multi-objective formulation [17,18], and serial sequential quadratic programming sub-problems [19]. However, because these methods may not guarantee that strict constraints will be satisfied, their use in real-life problems may be limited [5]. Details of conventional constraint handling schemes can be found in Jansen [5] and Saka [20], and some state-of-the-art meta-heuristic algorithms used in structural optimization problems were recently reviewed by Lamberti [21] and Saka [20].
The PSO algorithm has proven itself capable of finding global optima in a variety of engineering applications, including structural design problems [5,14,22,23,24,25]. An important factor facilitating reliable global searches in structural optimization is to keep an adequate balance between intensification and diversification [2,26]. Intensification searches around the current best region serve to refine and select the best candidate solution, whereas diversification allows different regions of the design space to be explored efficiently, thus assisting the global search process to find a good optimum. These two tasks are somewhat conflicting but equally important; hence, a balance between these two objectives must be achieved. It should be noted that most population-based meta-heuristic algorithms contract the search space as they approach the global optimum. However, after performing a certain number of swarm movements, particles may be trapped in a region that does not even contain local optima. A common problem with PSO is the poor diversification of particles, which results in a strong tendency to premature convergence. In standard PSO, poor diversification is mainly caused by the social structure of the swarm, the so called “neighborhood topology.” The movement of each particle is guided by the collective information generated by other particles connected with it. One of the most common topologies is the star topology, in which the neighborhood of each individual is the entire swarm. This type of fully connected neighborhood topology allows relatively good solutions to be found, and exhibits faster convergence than other neighborhood topologies. However, because of poor exploration performance, this may frequently result in premature convergence to local optima. To overcome this limitation, the ring neighborhood topology, in which each particle is only influenced by its two immediately adjacent neighbors, was developed. As the ring topology tends to reduce the convergence rate of the swarm, its exploration ability is improved. However, this topology has a serious drawback in the higher computation time required by the optimization process. Hence, it appears that one of the most important issues in complex structural optimization problems is to determine the best connection between neighboring particles, while ensuring a good balance of intensification and diversification.
The aim of this study is to develop an easy-to-use and reliable PSO formulation for the sizing optimization of truss structures. The key improvement of our novel PSO scheme is that the population diversity results are derived mainly from distributed social learning among each particle’s neighborhood, rather than learning from only one global best particle in the whole swarm. This neighborhood structure makes each particle to exchange some information via a fixed cyclic interaction structure that contains a series of successively numbered particles with itself as the center, which is repeated for all particles in the swarm in a cyclic manner. Thus, each particle belongs to at least two neighborhood groups of nearby particles so the successful global-best search history of a particle has an indirect effect on the social interactions among all particles. In this structure, a particle’s neighbors are not necessarily particles that are close to each other in hyperdimensional search space, but instead this refers to particles that share information related to their individual fitness values. From this viewpoint, the proposed optimizer is called as a cyclic neighborhood network topology particle swarm optimizer, or CNNT-PSO. The constraint-handling strategy utilized in this research relies on a simple transformation of the original cost function of the optimization problem. This is converted into a pseudo-function that ensures all particles move toward a feasible region of the search space from the beginning of the optimization process. Compared with conventional constraint handling methods, this is relatively simple to implement, and does not require problem-dependent or user-defined parameters such as penalty factors or Lagrange multipliers. This PSO scheme has recently been applied by some of the present authors to the synthesis of fixed-structure robust controllers [27]. In this paper, we carry out a comprehensive analysis of its performance in complicated constrained optimization tasks such as structural optimization problems. The numerical efficiency of the proposed approach is demonstrated by the results obtained in four classical weight-minimization problems of planar and spatial truss structures.
The remainder of this study is organized as follows. Section 2 presents the formulation of the structural optimization problem with various types of constraints; the proposed meta-heuristic search engine is also described. The optimization results are discussed in Section 3, where extensive comparisons with methods in the literature are presented, and the sensitivity of the algorithm to the neighborhood size (i.e., the number of neighboring particles) is analyzed. Finally, Section 4 summarizes the main findings of the study and outlines directions for future research.
2. Description of the Optimization Framework
In meta-heuristic optimization, social diversity is usually defined as the level of dispersion of candidate solutions around the search space. PSO and most other population-based methods contract the search space to increase the probability of obtaining a fitter population. The basic swarm movement pattern usually forces the whole population to move as a single group toward a promising region of the contracting search space. However, this may cause all particles to become trapped in a region far from the optimum [28,29]. In view of this, the main scope of the present study is to develop a simple diversity-enhanced CNNT-PSO scheme for truss-size optimization.
The minimum weight problem for a truss structure can be formulated as follows:
subject to
where is the cross-sectional area of members belonging to the kth group, is the density of the lth member in the kth group, is the length of the lth member in the kth group, is the total number of member groups, is the total number of members in the kth group, and is the zero vector of adequate dimensions. In (2), and include stress and buckling constraints for the ith truss member, respectively, and and include nodal displacement and cross-sectional area constraints, respectively. Details of the above constraint conditions are as follows:
where is the number of elements, is the number of elements subject to compression, is the number of nodes; is the stress in the jth element, is the allowable buckling stress for the jth member subject to compression, is the nodal displacement of the jth free node, and , respectively denote upper and lower bounds for stress, displacement, and cross-sectional area.
The proposed CNNT-PSO algorithm proceeds as follows.
Step 0. Transformation of the minimum weight problem into a pseudo-function-based problem.
The CNNT-PSO algorithm considers the constraint conditions of (2) to calculate the fitness value of each particle and determine the optimal design-variable vector . Our constraint-handling strategy relies on a simple transformation of (1) subject to (2) into an unconstrained optimization problem using a pseudo-function such as . The modified unconstrained problem is then formulated as
where denotes any of the constraint function vectors , , and in (2). Because for any , the condition, , holds for an infeasible solution satisfying . The present approach ensures that all particles move towards the feasible design space since the very beginning of the optimization process. Because PSO requires neither a derivable cost function nor an explicit relationship between cost function and constraints, the functional can be used regardless of the nature of the cost function and the type of constraints.
Remark 1.
A pseudo-objective function can be any function for which the following conditions simultaneously hold: (i) for any yielding (); (ii) , whenever . The function can be used for various constrained optimization problems.
Step 1. Initialization of PSO parameters and start of the optimization procedure.
Let denote the hyperdimensional search space of the design vector , where is the particle index, ℓ () is the iteration number, and is the maximum number of searches. Initialize particles with randomly selected positions and velocities . Let denote each particle’s best previous position, that is, that which yields the minimum fitness value of the modified cost function in (4). This initial value is . Next, we introduce , which denotes the best position in the social neighborhood of the ith particle in the current iteration ℓ. Mathematically, this can be written as
where “arg min” denotes the set of points at which the cost function attains its minimum value, the (even) parameter is the number of neighbors of the ith particle, and for or . Therefore, the initial is set using a previously determined as .
The overall schematic representation of the proposed CNNT-PSO with and is shown in Figure 1. This cyclic network topology-based neighborhood structure forces each particle to share information via a fixed near-neighbor interaction structure containing a series of successively numbered particles, with itself at the center (e.g., ).
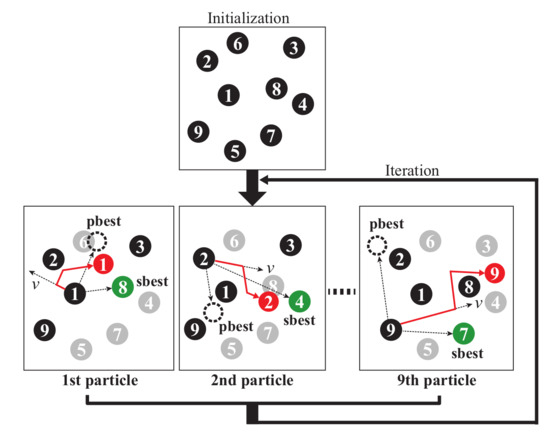
Figure 1.
Explanation of the CNNT-PSO search mechanism ( = 9; = 4).
Remark 2.
The standard PSO algorithm adopts the following form for the unique global best position found by the entire swarm:
This means that ; that is, depends on all of the available in each iteration. This uniqueness of may be the main cause of the strong tendency of PSO to converge prematurely. To overcome this limitation, the particles’ flexibility is increased by introducing an additional diversity-boosting tool that exploits each particle’s local social learning based on the concept of the cyclic network topology-based neighborhood structure.
Step 2. Apply the CNNT-PSO algorithm to update the positions and velocities of all particles.
After initializing , , , and in Step 1, the following position and velocity update laws are applied to all particles ():
where and denote random numbers generated uniformly within , is the cognitive scaling factor, is the social scaling factor, and is the constriction factor, defined as
for [30]. In this paper, and are set to . Next, we set and update and as follows:
We now briefly discuss some distinctive features of our CNNT-PSO scheme. Unlike standard PSO, the third term of (7) implies social cooperation in the neighborhood of the ith particle. Hence, the main novelty introduced by the present approach is that population diversity is derived from a process of distributed social learning in each particle’s neighborhood, rather than learning from only the global best particle , as in the canonical star topology. Furthermore, because each particle belongs to at least two neighborhood groups of nearby particles, the successful global-best search history of a particle will indirectly affect its social interactions.
Remark 3.
Because of the probabilistic nature and problem-dependent characteristics of PSO, it may be difficult to set absolute criteria that ensure the choice of gives a good balance between the particle’s global search capacity and the convergence rate of the swarm. The ratio is a reliable indicator of the efficiency of the optimization search. If is small, the successful social-best search history of a particle is slowly conveyed to particles belonging to other neighboring groups. This may lead to slow down convergence of particles toward the true solution, but also to considerably reduce the risk of premature convergence. Conversely, if is large, particles gather lots of information from many other neighboring particles: the convergence rate will be high, but there will be the risk of premature convergence. The sensitivity of the CNNT-PSO algorithm to the number of neighboring particles will be analyzed in great detail in the next section.
Remark 4.
The proposed CNNT-PSO scheme and other modern optimization algorithms require the setting of a large number of parameters to optimize their performance. However, manually exploring the resulting combinatorial space of parameter settings may be tedious and tends to lead to unsatisfactory outcomes. From this viewpoint, Irace packag [31] and SMAC (sequential model-based algorithm configuration) [32] can be used as useful tools for finding the best parameter settings of an optimizer.
Step 3. Termination criterion.
If the user-defined termination criterion (e.g., ) of the optimization process is satisfied, the iteration of swarm movements following CNNT-PSO stops, and the optimum design is determined as follows:
If the termination criterion is not satisfied, return to Step 2.
3. Test Problems and Optimization Results
The CNNT-PSO algorithm described in Section 2 was tested in four classical weight minimization problems of truss structures including sizing variables. A total of 30 independent runs were carried out for each neighborhood size, where all runs used different initial populations to properly account for the stochastic nature of the optimizer. Statistical data were compared with results in the literature, in particular with Degertekin [1], Degertekin [3] that presented an extensive survey of the optimization results obtained using various meta-heuristic methods (see Table 1). In addition, a sensitivity analysis on the effect of was carried out. The proposed PSO algorithm was implemented in MATLAB Version 7.14, and computations were executed on a PC with a 3.4 GHz Intel Core i7 processor and 8 GB RAM.

Table 1.
Survey of literature studies that have analyzed the test cases considered in this research.
3.1. Planar 10-Bar Truss Structure
The first test problem regards the 10-bar truss shown in Figure 2. The Young’s modulus and material density of the truss members are 10 Msi and , respectively. The cross-sectional area of each member is included as a design variable. Two variants of this problem were considered: (1) Case 1: kips and ; (2) Case 2: kips and kips. The cross-sectional areas of elements were permitted to vary between and 35 . The optimization problem includes 22 nonlinear constraints on element stresses (stress limit in tension and compression is psi) and nodal displacements ( in in both coordinate directions X and Y).
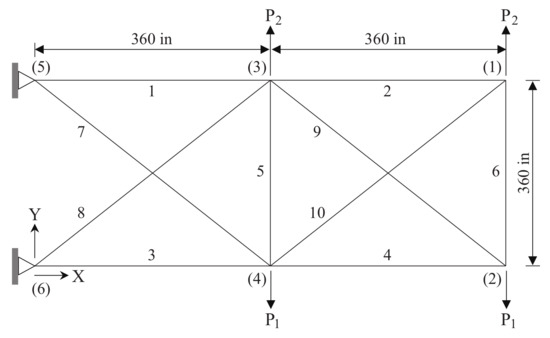
Figure 2.
Schematic of the planar 10-bar truss structure.
A population of 250 individuals was used in this test case. The initial population in each optimization run was generated randomly. The maximum number of iterations was set to 500. Table 2 and Table 3 compare the optimization results with literature for Cases 1 and 2, respectively. The algorithm’s performance was compared on a statistical basis by considering the best, worst, and average weight obtained in the optimization runs. The feasibility of all optimized designs listed in the tables was checked with MATLAB and ANSYS. The present PSO algorithm always found optimized designs consistent with the best designs reported in the literature. However, the proposed algorithm was definitely the most robust optimizer in terms of the dispersion of the optimized weight. Furthermore, some of the algorithms taken as the basis of comparison with CNNT-PSO converged to slightly infeasible designs. Table 4 and Table 5 analyze the effect of the neighborhood size on the performance of CNNT-PSO. Remarkably, the proposed algorithm always found a feasible optimized design for each of the 30 optimization runs, regardless of the value of . It appears that setting the neighborhood size to twice the number of design variables allows the optimal solution to be obtained. The convergence characteristics of the objective function of 30 independent optimization runs are illustrated in Figure 3. Table 4 and Table 5 show that the best solution is far less sensitive than the worst solution to the number of neighboring particles. CNNT-PSO always converged to the best solution overall when the ratio was less than or close to 10%. A similar trend can be observed in the other truss design problems. However, if is very small (e.g., approximately 4% in this test case), more iterations may be required to converge to the global optimum.

Table 2.
Comparison of optimization results with literature: Case 1 of 10-bar truss problem.

Table 3.
Comparison of optimization results with literature: Case 2 of 10-bar truss problem.

Table 4.
Sensitivity of optimized weight to neighborhood size: Case 1 of 10-bar truss problem.

Table 5.
Sensitivity of optimized weight to neighborhood size: Case 2 of 10-bar truss problem.
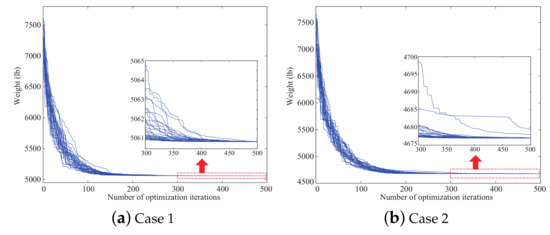
Figure 3.
Convergence curves for the 10-bar truss problem ( = 20).
3.2. Spatial 25-Bar Truss Structure
The second test problem concerns the spatial 25-bar truss tower shown in Figure 4. Elements were divided into 8 groups, as shown in Table 6, which also lists the allowable compressive/tensile stress limits for each group. The Young’s modulus is 10 Msi and the material density is . The structure was subjected to two independent loading conditions:
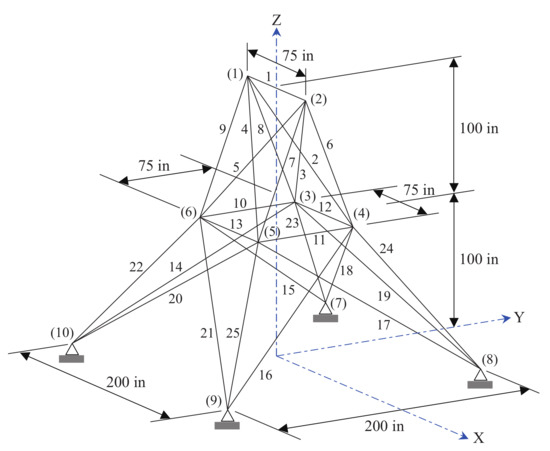
Figure 4.
Schematic of the spatial 25-bar truss structure.

Table 6.
Member grouping and stress limits for the spatial 25-bar truss problem.
- (a)
- Condition 1: 20 kips acting in the positive Y-direction and 5 kips acting in the negative Z-direction at node 1, 20 kips acting in the negative Y-direction and 5 kips acting in the negative Z-direction at node 2;
- (b)
- Condition 2: 1 kip acting in the positive X-direction at node 1, 0.5 kip acting in the positive X-direction at nodes 3 and 6, 10 kips acting in the positive Y-direction at nodes 1 and 2, 5 kips acting in the negative Z-direction at nodes 1 and 2.
The cross-sectional areas of each group of elements were permitted to vary between and . The displacements of all free nodes in the coordinate directions X, Y and Z must be less than in. Therefore, the optimization problem includes 8 sizing variables and 110 nonlinear constraint conditions.
CNNT-PSO parameters were set as follows: and . Feasible solutions were obtained for all 30 trials. The optimization results are compared with literature in Table 7. It can be seen that the present algorithm was the most efficient optimizer in terms of optimized weight and robustness. The statistical data given in Table 8 confirm that the optimal size of the neighborhood is about 10% of the population size. Figure 5 shows the convergence characteristics of the objective function for 30 independent optimization runs. However, for very small or large values of , CNNT-PSO could not achieve an adequate trade-off between population diversity enhancement and convergence speed.

Table 7.
Comparison of optimization results with literature: 25-bar truss problem.

Table 8.
Sensitivity of optimized weight to neighborhood size: 25-bar truss problem.
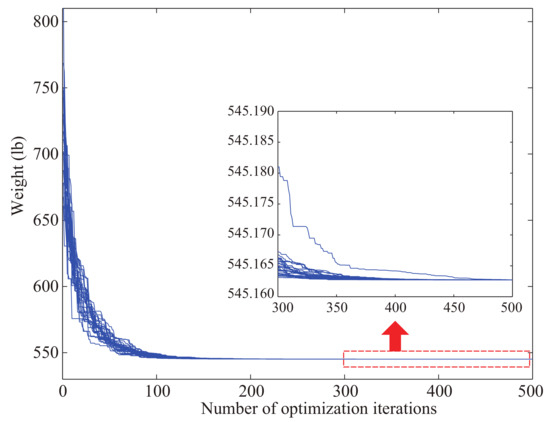
Figure 5.
Convergence curves for the 25-bar truss problem ().
Remark 5.
In the sizing optimization of skeletal structures, the computational cost is generally determined by the total number of function evaluations that is the product of the population size () and the number of optimization iterations (). This is because each computation of in (4) entails a structural analysis to check whether the optimization constraints are satisfied. Hence, although the proposed CNNT-PSO algorithm includes a large number of particles, it does not necessarily have a high computational cost. For example, in the 10-bar planar truss problem, Degertekin [3] set the HMS (harmony memory size, which corresponds to population size in PSO) to 20, and obtained optimum designs from EHS and SAHS after about 12,000 and 8000 optimization iterations, respectively. Therefore, the objective function was evaluated 240,000 times for EHS and 160,000 times for SAHS. However, using and , the proposed CNNT-PSO method requires the objective function to be evaluated 125,000 times, which is fewer than EHS and fewer than SAHS. Further, the number of evaluations of the objective function in Degertekin [1], which used a population size of 30 and 16,872 optimization iterations, was 506,160, which is about 4 times more than with CNNT-PSO. For the 25-bar spatial truss problem, the number of objective function evaluations performed by the proposed method was between and of those in Degertekin [3] and Degertekin [1]. On the other hand, in (4) must be evaluated times to account for the influence of all particles included in the neighborhood of a given particle. However, this is simple arithmetic to find () in (10), and thus, the computational burden of this evaluation is not significant. This suggests that the CNNT-PSO scheme does not incur a greater computational cost than other schemes reported in the literature.
3.3. Spatial 72-Bar Truss Structure
The third test case is the sizing optimization of the spatial 72-bar truss shown in Figure 6. The Young’s modulus of the material is 10 Msi and the material density is . Truss members were divided into 16 groups based on structural symmetry, and the cross-sectional areas of the bars in each group were included as design variables: (1) –, (2) –, (3) –, (4) –, (5) –, (6) –, (7) –, (8) –, (9) –, (10) –, (11) –, (12) –, (13) –, (14) –, (15) –, (16) –. Hence, this optimization problem includes 16 design variables and 264 nonlinear constraints on the member stresses ( psi) and displacements of top nodes 17–20 ( in both the X- and Y-directions). The cross-sectional areas were permitted to vary between and . This truss structure was optimized for two independent loading conditions:
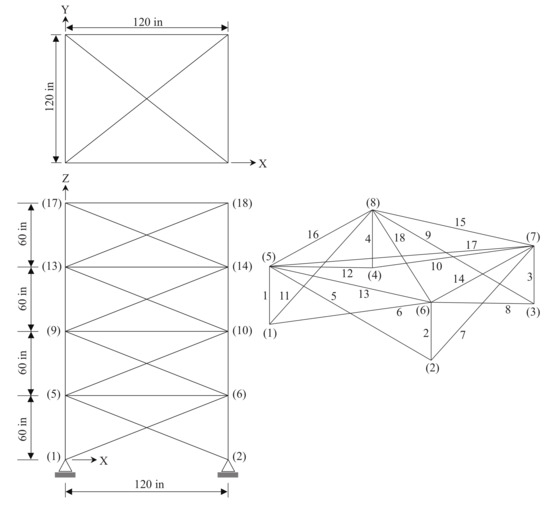
Figure 6.
Schematic of the spatial 72-bar truss structure.
- (a)
- Condition 1: 5 kips acting in the positive X- and Y-directions, and in the negative Z-direction at node 17;
- (b)
- Condition 2: 5 kips acting in the negative Z-direction at nodes 17 through 20.
CNNT-PSO was run with and . All optimization runs were successful and converged to a feasible design. Table 9 shows that the proposed algorithm was again the most efficient optimizer, as it designed the lightest structure. Furthermore, the optimization results were consistent for all trial runs. The optimal number of neighbors of each particle was again twice the number of design variables. The convergence characteristics of the objective function for 30 independent optimization runs are shown in Figure 7. Table 10 confirms that a relatively accurate solution could also be obtained when was less than about 10%.

Table 9.
Comparison of optimization results with literature: 72-bar truss problem.
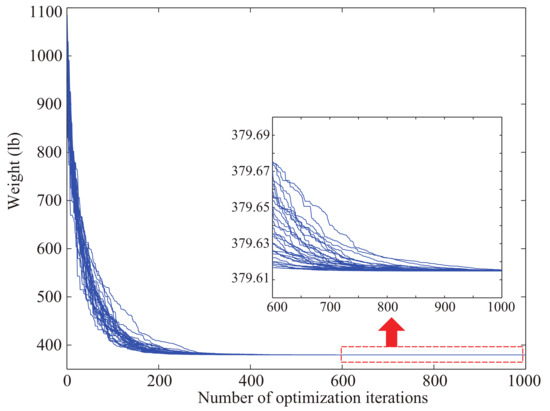
Figure 7.
Convergence curves for the 72-bar truss problem ().

Table 10.
Sensitivity of optimized weight to neighborhood size: 72-bar truss problem.
3.4. Planar 200-Bar Truss Structure
The final test case concerns the sizing optimization of the planar 200-bar truss with 77 nodes shown in Figure 8. The Young’s modulus of the material is 30 Msi and the material density is . Truss members were divided into 29 groups based on structural symmetry (see Table 11), and the cross-sectional areas of the bars in each group were included as design variables. This optimization problem includes 29 design variables and 1200 nonlinear constraints on member stresses (±10,000 psi). Cross-sectional areas must be greater than . This truss structure was designed for three independent loading conditions:
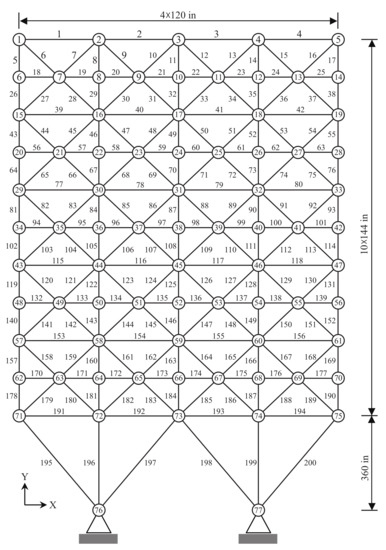
Figure 8.
Schematic of the planar 200-bar truss structure.

Table 11.
Variable linking adopted in the 200-bar truss problem.
- (a)
- Condition 1: 1 kip acting in the positive X-direction at nodes 1, 6, 15, 20, 29, 34, 43, 48, 57, 62, and 71;
- (b)
- Condition 2: 10 kips acting in the negative Y-direction at nodes 1–6, 8, 10, 12, 14–20, 22, 24, 26, 28–34, 36, 38, 40, 42–48, 50, 52, 54, 56–62, 64, 66, 68, and 70–75;
- (c)
- Condition 3: loading conditions 1 and 2 acting together.
CNNT-PSO was run with and . All optimization runs were successful and converged to a feasible design. The convergence curve relative to the best optimization run is plotted in Figure 9. Table 12 shows that the present algorithm was once again the most efficient optimizer, as it designed the lightest structure and converged to a feasible design. Furthermore, the optimization results were marginally sensitive to trial runs. The optimal number of neighbors of each particle was once again about twice the number of design variables. It can be seen from Table 13 that a relatively accurate solution could be obtained by setting to between 6% and 10%.
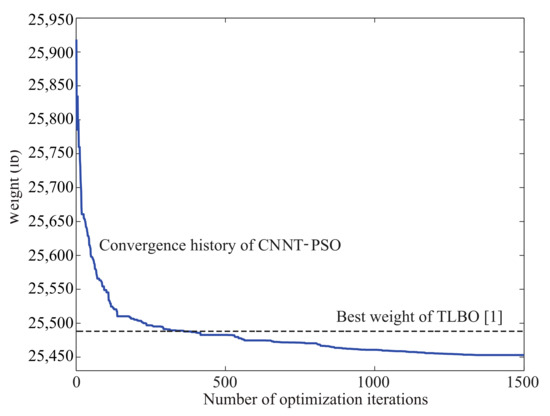
Figure 9.
Convergence curve of the best trial run carried out for 200-bar truss problem ().

Table 12.
Comparison of optimization results with literature: 200-bar truss problem.

Table 13.
Sensitivity of optimized weight to neighborhood size: 200-bar truss problem.
4. Conclusions
This study presented an easy-to-use and reliable meta-heuristic algorithm for structural optimization. The algorithm implemented a cyclic neighborhood learning-based diversity-enhanced PSO scheme. Diversification was enhanced by the distributed social learning among each particle’s neighborhood which replaced the learning from only one global-best particle in the entire swarm as it happens in standard PSO. The proposed CNNT-PSO algorithm was very efficient and reliable in weight-minimization problems of truss structures including up to 29 sizing variables. A comparative study of four classical sizing optimization problems demonstrated that the proposed approach is much better than various meta-heuristic methods in terms of solution quality, robustness, and computational cost.
Author Contributions
Conceptualization and methodology, J.-I.B. and T.-H.K.; software and experiments, J.-I.B.; validation and formal analysis, T.-H.K.; writing–original draft preparation, J.-I.B.; writing–review and editing, T.-H.K.; funding acquisition, T.-H.K. All authors have read and agreed to the published version of the manuscript.
Funding
This research was supported by the Basic Science Research Program through the National Research Foundation (NRF) of Korea funded by the Ministry of Education (NRF-2016R1D1A1B03935288) and the Chung-Ang University Research Scholarship Grants in 2018.
Conflicts of Interest
The authors declare no conflict of interest.
References
- Degertekin, S.O.; Hayalioglu, M.S. Sizing truss structures using teaching-learning-based optimization. Comput. Struct. 2013, 119, 177–188. [Google Scholar] [CrossRef]
- Kaveh, A.; Zolghadr, A. Truss optimization with natural frequency constraints using a hybridized CSS-BBBC algorithm with trap recognition capability. Comput. Struct. 2012, 102–103, 14–27. [Google Scholar] [CrossRef]
- Degertekin, S.O. Improved harmony search algorithms for sizing optimization of truss structures. Comput. Struct. 2012, 92–93, 229–241. [Google Scholar] [CrossRef]
- Kaveh, A.; Khayatazad, M. A new meta-heuristic method: Ray optimization. Comput. Struct. 2012, 112–113, 283–294. [Google Scholar] [CrossRef]
- Jansen, P.W.; Perez, R.E. Constrained structural design optimization via a parallel augmented Lagrangian particle swarm optimization approach. Comput. Struct. 2011, 89, 1352–1366. [Google Scholar] [CrossRef]
- Lamberti, L. An efficient simulated annealing algorithm for design optimization of truss structures. Comput. Struct. 2008, 86, 1936–1953. [Google Scholar] [CrossRef]
- Perez, R.E.; Behdinan, K. Particle swarm approach for structural design optimization. Comput. Struct. 2007, 85, 1579–1588. [Google Scholar] [CrossRef]
- Li, L.J.; Huang, Z.B.; Liu, F.; Wu, Q.H. A heuristic particle swarm optimizer for optimization of pin connected structures. Comput. Struct. 2007, 85, 340–349. [Google Scholar] [CrossRef]
- Vanderplaats, G. Numerical Optimization Techniques for Engineering Design, 3rd ed.; Vanderplaats Research and Development, Inc.: New York, NY, USA, 2001. [Google Scholar]
- Vanderplaats, G.; Moses, F. Structural optimization by methods of feasible directions. Comput. Struct. 1973, 3, 739–755. [Google Scholar] [CrossRef]
- Vanderplaats, G. An efficient feasible directions algorithm for design synthesis. AIAA J. 1984, 22, 1633–1640. [Google Scholar] [CrossRef]
- Svanberg, K. The method of moving asymptotes—A new method for structural optimization. Int. J. Numer. Methods Eng. 1987, 24, 359–373. [Google Scholar] [CrossRef]
- Gill, P.; Murray, W.; Saunders, M. SNOPT: An SQP algorithm for large-scale constrained optimization. SIAM Rev. 2005, 47, 99–131. [Google Scholar] [CrossRef]
- Fourie, P.; Groenwold, A. The particle swarm optimization algorithm in size and shape optimization. Struct. Multidiscip. Optim. 2002, 23, 259–267. [Google Scholar] [CrossRef]
- Sedlaczek, K.; Eberhard, P. Using augmented Lagrangian particle swarm optimization for constrained problems in engineering. Struct. Multidiscip. Optim. 2006, 32, 277–286. [Google Scholar] [CrossRef]
- Venter, G.; Sobieszczanski-Sobieski, J. Particle swarm optimization. AIAA J. 2003, 41, 1583–1589. [Google Scholar] [CrossRef]
- Vaz, A.; Fernandes, E. Optimization of nonlinear constrained particle swarm. Technol. Econ. Dev. Econ. 2006, 12, 30–36. [Google Scholar]
- Venter, G.; Haftka, R. Constrained particle swarm optimization using a bi-objective formulation. Struct. Multidiscip. Optim. 2010, 40, 65–76. [Google Scholar] [CrossRef]
- Richards, Z. Constrained particle swarm optimisation for sequential quadratic programming. Int. J. Model Identif. Contr. 2009, 8, 361–367. [Google Scholar] [CrossRef]
- Saka, M.P.; Geem, Z.W. Mathematical and metaheuristic applications in design optimization of steel frame structures: An extensive review. Math. Probl. Eng. 2013, 2013, 1–33. [Google Scholar] [CrossRef]
- Lamberti, L.; Pappalettere, C. Metaheuristic design optimization of skeletal structures: A review. Comput. Technol. Rev. 2011, 4, 1–32. [Google Scholar] [CrossRef]
- Perez, R.; Behdinan, K. Particle swarm optimization in structural design. In Swarm Intelligence, Focus on Ant and Particle Swarm Optimization; I-Tech Education and Publishing: Vienna, Austria, 2007; pp. 373–394. [Google Scholar]
- Bartoccini, U.; Carpi, A.; Poggioni, V.; Santucci, V. Memes evolution in a memetic variant of particle swarm optimization. Mathematics 2019, 7, 423. [Google Scholar] [CrossRef]
- Santucci, V.; Baioletti, M.; Milani, A. Tackling permutation-based optimization problems with an algebraic particle swarm optimization algorithm. Fundam. Inform. 2019, 167, 133–158. [Google Scholar] [CrossRef]
- Jensi, R.; Jiji, G.W. An enhanced particle swarm optimization with levy flight for global optimization. Appl. Soft Comput. 2016, 43, 248–261. [Google Scholar] [CrossRef]
- Gandomi, A.H.; Yang, X.-S.; Alavi, A.H. Mixed variable structural optimization using firefly algorithm. Comput. Struct. 2011, 89, 2325–2336. [Google Scholar] [CrossRef]
- Maruta, I.; Kim, T.-H.; Song, D.; Sugie, T. Synthesis of fixed-structure robust controllers using a constrained particle swarm optimizer with cyclic neighborhood topology. Expert Syst. Appl. 2013, 40, 3595–3605. [Google Scholar] [CrossRef]
- Liu, H.; Abraham, A.; Zhang, W. A fuzzy adaptive turbulent particle swarm optimization. Int. J. Innov. Comput. Appl. 2007, 1, 39–47. [Google Scholar] [CrossRef]
- Pant, M.; Thangaraj, R.; Abraham, A. Particle swarm optimization: Performance tuning and empirical analysis. In Foundations of Computational Intelligence; Springer: Berlin/Heidelberg, Germany, 2009; Volume 3, pp. 101–128. [Google Scholar]
- Clerc, M.; Kennedy, J. The particle swarm: explosion, stability, and convergence in a multi-dimensional complex space. IEEE Trans. Evol. Comput. 2002, 6, 58–73. [Google Scholar] [CrossRef]
- López-Ibáñez, M.; Dubois-Lacoste, J.; Pérez Cáceres, L.; Birattari, M.; Stützle. The irace package: Iterated racing for automatic algorithm configuration. Oper. Res. Perspect. 2016, 3, 43–58. [Google Scholar] [CrossRef]
- Hutter, F.; Hoos, H.-H.; Leyton-Brown, K. Sequential model-based optimization for general algorithm configuration. In Learning and Intelligent Optimization; Springer Berlin Heidelberg: Berlin/Heidelberg, Germany, 2011; pp. 507–523. [Google Scholar]
- Lee, K.S.; Geem, Z.W. A new structural optimization method based on the harmony search algorithm. Comput. Struct. 2004, 82, 781–798. [Google Scholar] [CrossRef]
- Kaveh, A.; Talatahari, S. Particle swarm optimizer, ant colony strategy and harmony search scheme hybridized for optimization of truss structures. Comput. Struct. 2009, 87, 267–283. [Google Scholar] [CrossRef]
- Lamberti, L.; Pappalettere, C. An improved harmony-search algorithm for truss structure optimization. In The Twelfth International Conference on Civil, Structural and Environmental Engineering Computing; Civil-Comp Press: Stirlingshire, UK, 2009. [Google Scholar]
- Sonmez, M. Artificial bee colony algorithm for optimization of truss optimization. Appl. Soft Comput. 2011, 11, 2406–2418. [Google Scholar] [CrossRef]
- Camp, C.V. Design of space trusses using big bang–big crunch optimization. J. Struct. Eng. 2007, 133, 999–1008. [Google Scholar] [CrossRef]
- Kaveh, A.; Talatahari, S. Size optimization of space trusses using big–bang bigcrunch algorithm. Comput. Struct. 2009, 87, 1129–1140. [Google Scholar] [CrossRef]
© 2020 by the authors. Licensee MDPI, Basel, Switzerland. This article is an open access article distributed under the terms and conditions of the Creative Commons Attribution (CC BY) license (http://creativecommons.org/licenses/by/4.0/).