1. Introduction
The importance of the cryptocurrency market has continued to increase, even in recent years. References [
1,
2] highlighted that the cryptocurrency market was worth more than
$12.5 billion in 2016. Additionally, reference [
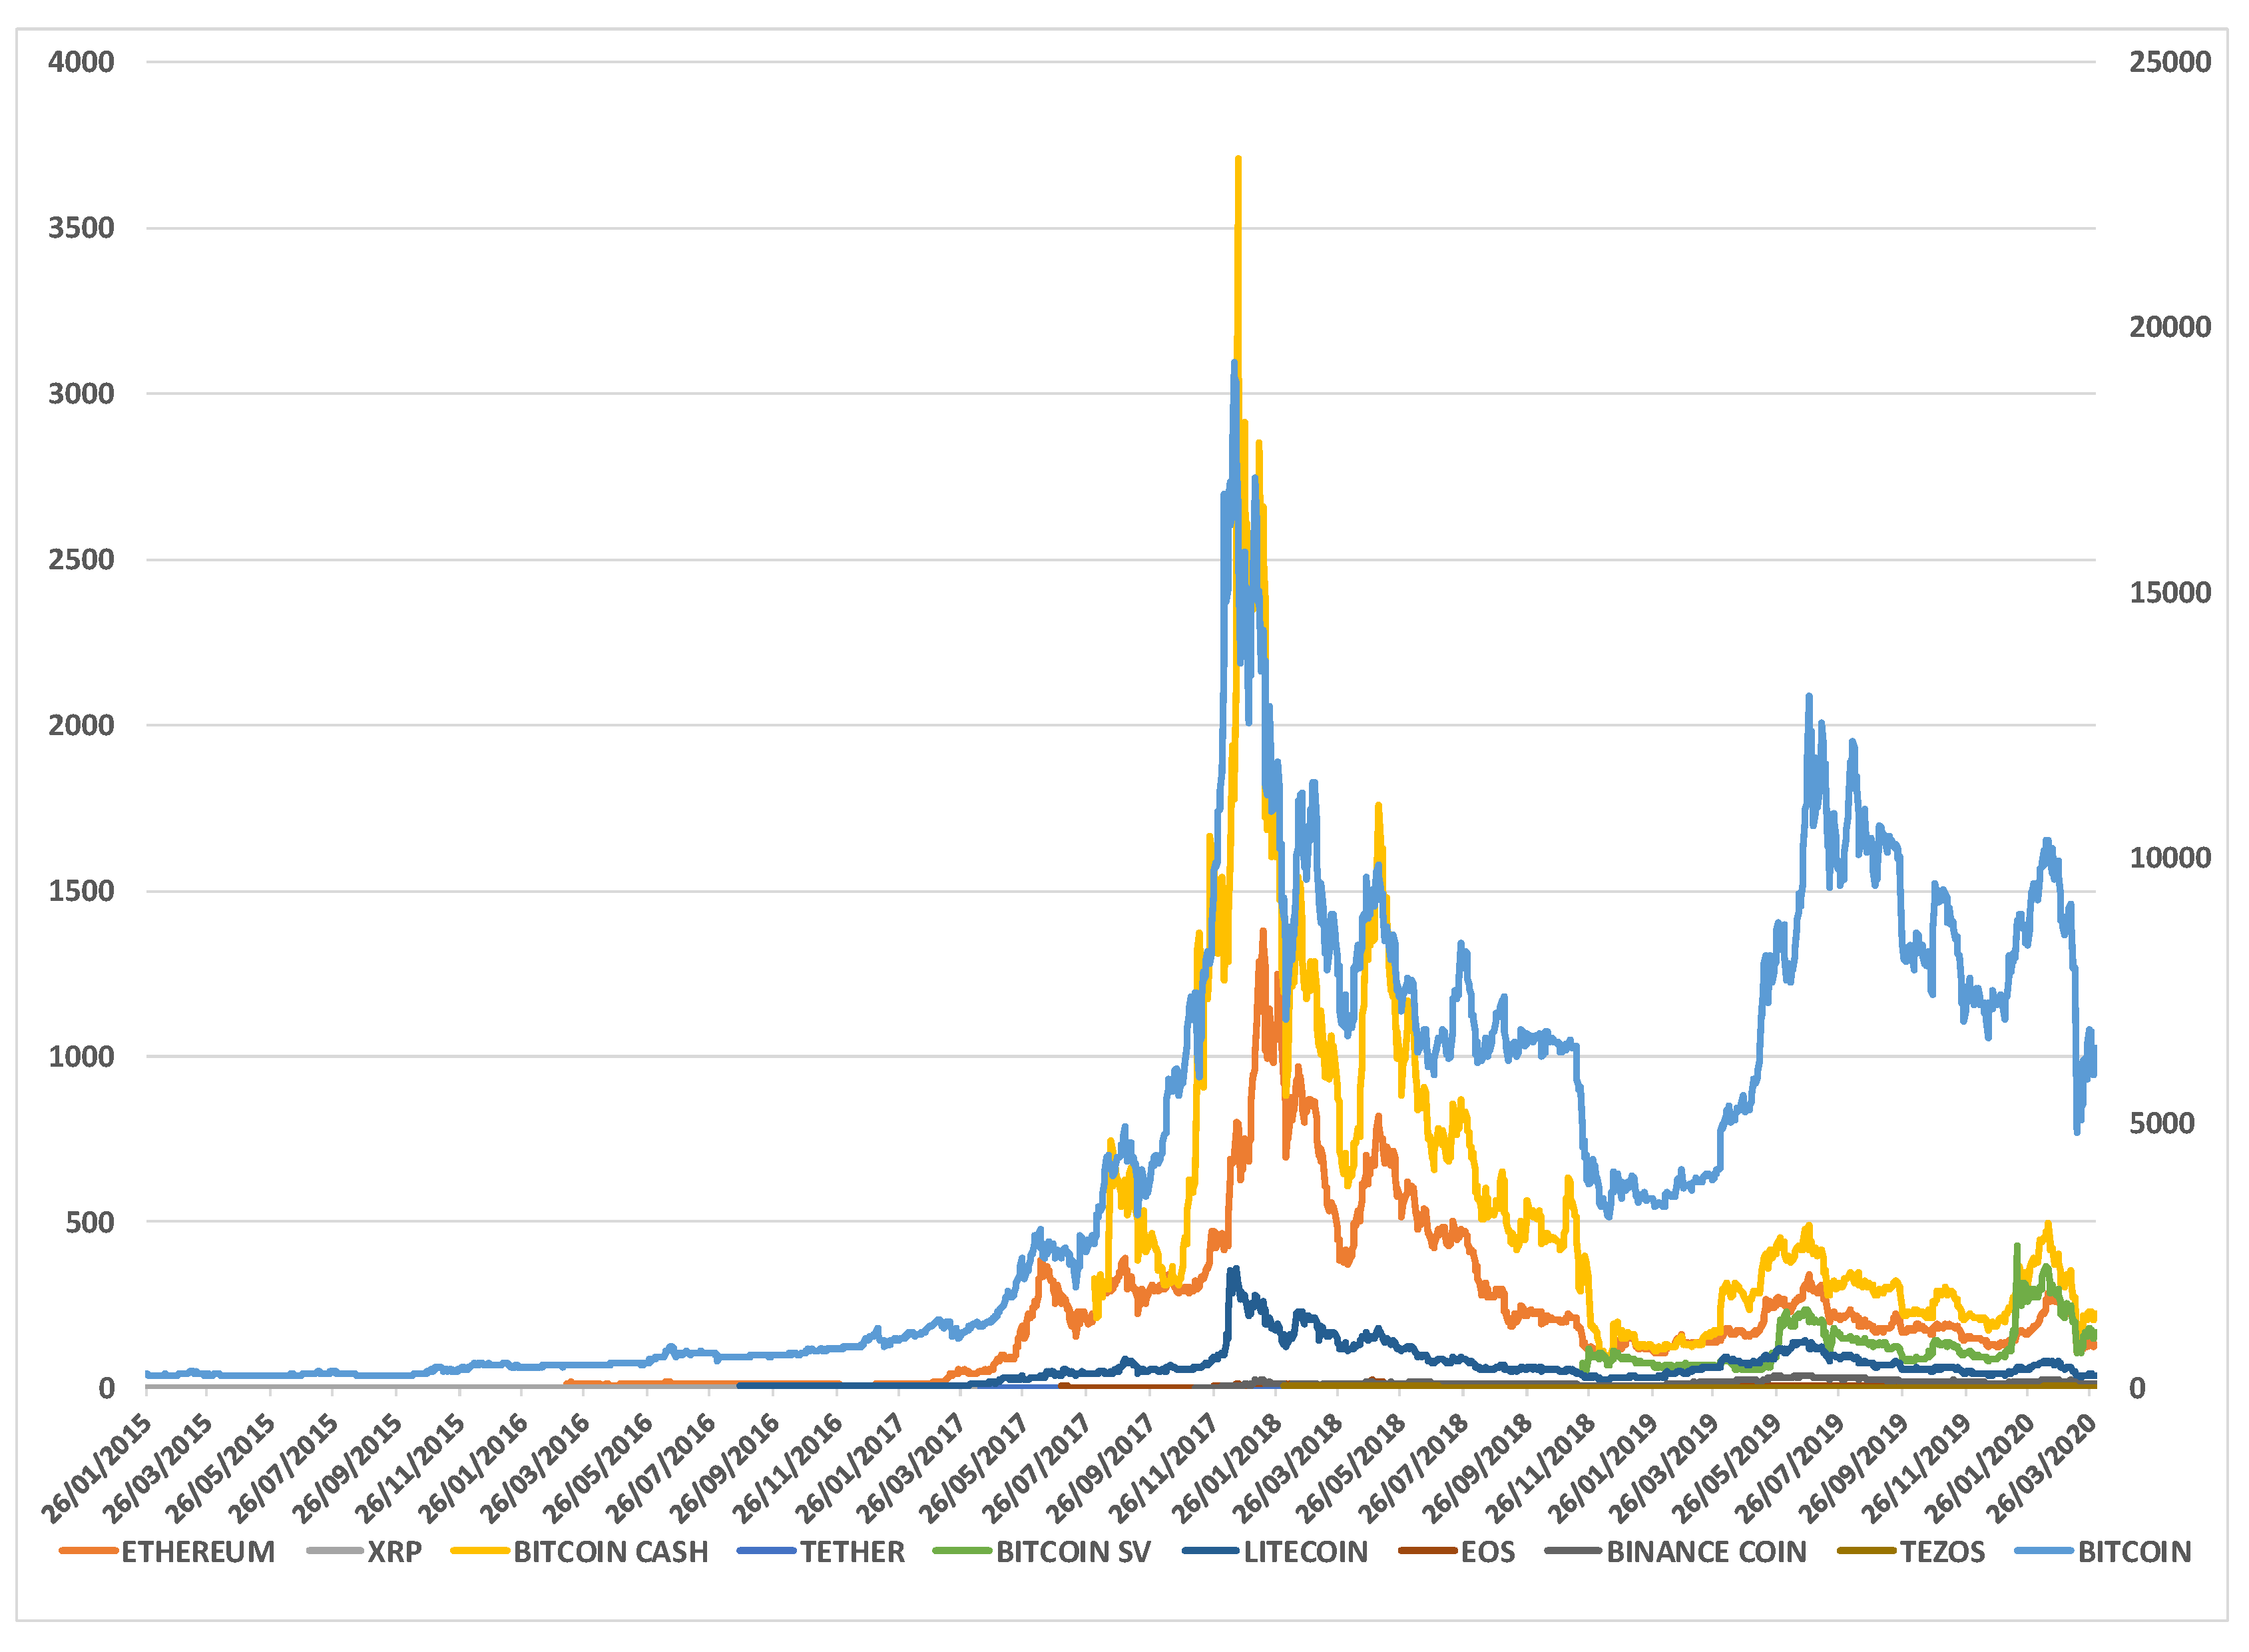
2] noticed the growing popularity of the cryptocurrency markets, now being suggested in the literature as an investment asset, and highlighting that the price of the most liquid cryptocurrency—Bitcoin price—increased about 700%, from
$616 to
$4800 US dollars between October 2016 and October 2017. Presently, the overall cryptocurrency market is even more important as the total cryptocurrency market capitalization is
$251.5 billion on 7 March 2020 and the Bitcoin price has increased almost 3300% from
$269.2 to
$8887.8 US dollars between the beginning (26 January 2015) and the final (7 March 2020) date of the sample period.
Furthermore, Bitcoin dominance in the cryptocurrency market is increasing. Reference [
3] confirmed that Bitcoin’s capitalization was about 37% of the cryptocurrency market on 1 May 2018 but now, merely two years later, Bitcoin’s market share is about 66% on 7 March 2020. Therefore, Bitcoin is the most globally recognized cryptocurrency in terms of capitalization and the number of users. Additionally, reference [
4] notes that the cryptocurrencies’ market reached a peak in early 2018 with the market’s capitalizations of
$800 billion and suggests that cryptocurrencies can now be considered to be an alternative investment option for everyone. This spectacular growth attracted the attention of regulation authorities, big corporations, and small investors.
In this context, a wide and recent branch of the financial literature has focused on studying the cryptocurrency market. Thus, many kinds of research analyze potential connectedness between different altcoins in the cryptocurrency market, as well as between cryptocurrencies and alternative financial assets. These studies apply different methodologies such as: Autoregressive Distributed Lag (ARDL) model in [
1]; several Diebold and Yilmaz type approach [
5,
6,
7] in [
8,
9]; Vector AutoRegressive (VAR) and Generalized AutoRegressive Conditional Heteroskedasticity (GARCH) methodologies in [
3,
10,
11,
12]; BEKK-GARCH framework in [
13,
14,
15,
16]; and other innovative approaches in [
4,
17], among many others. All of them find important interdependencies between many altcoins of the cryptocurrency market.
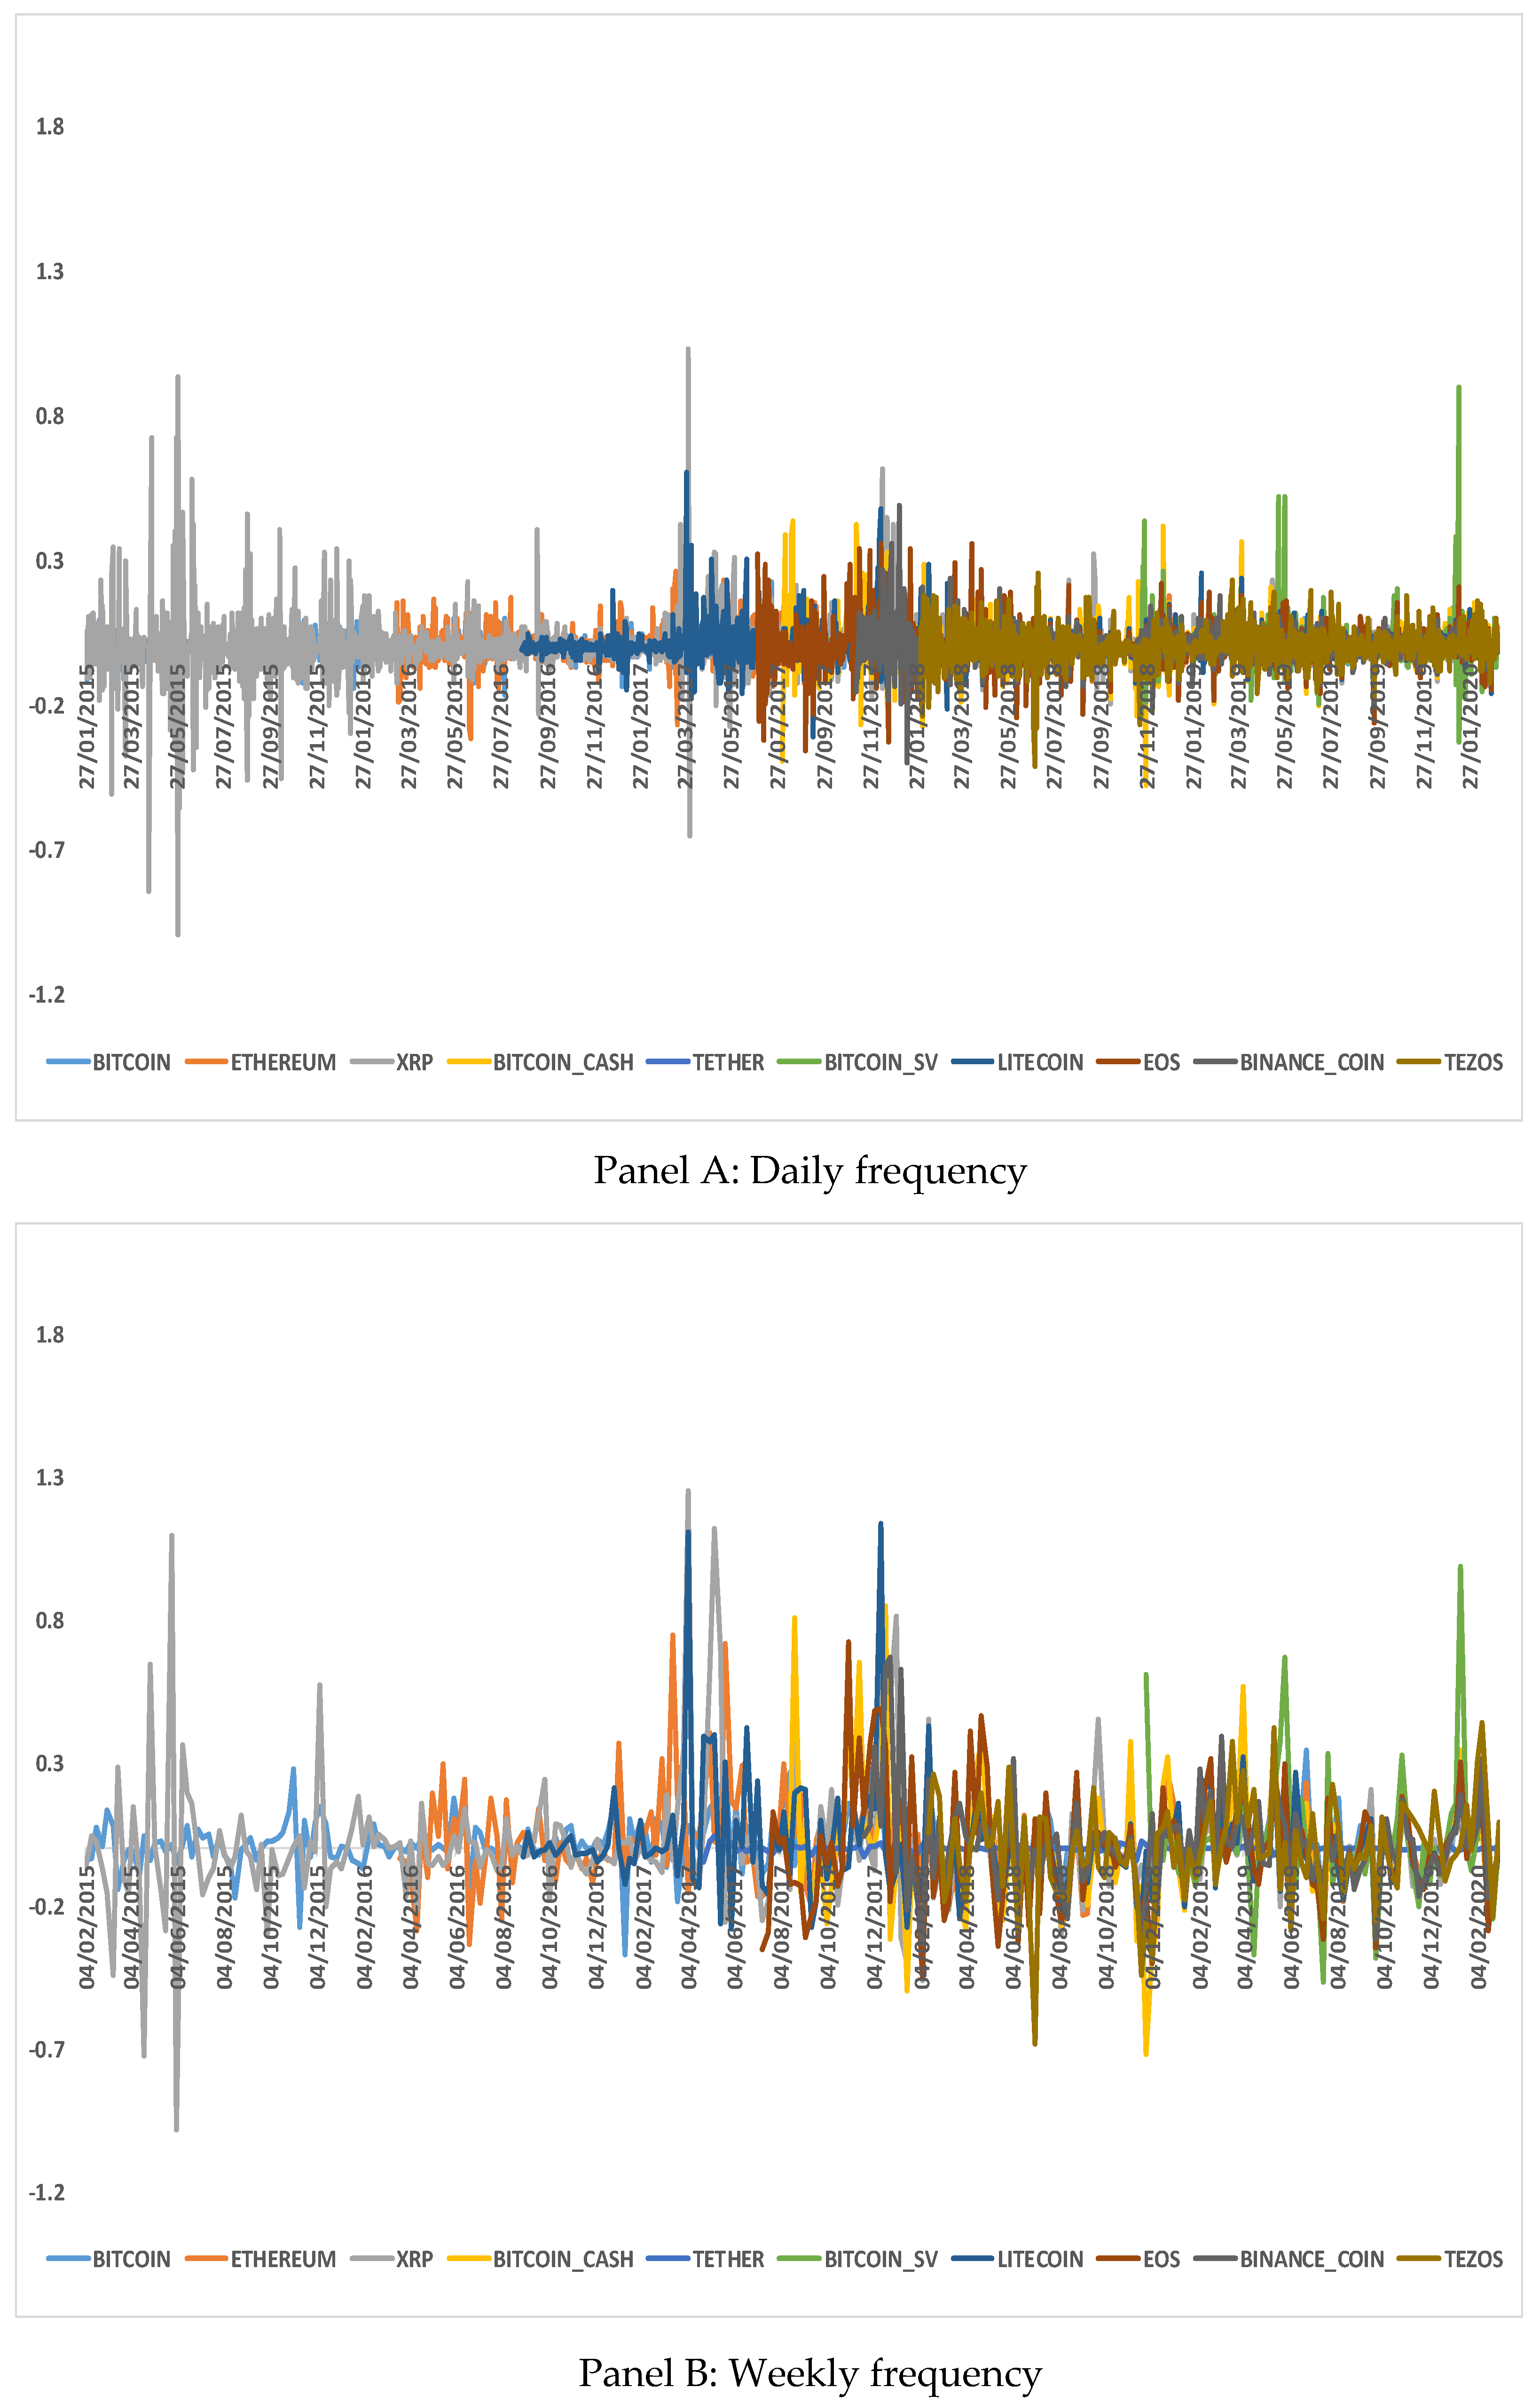
Thus, the main aim of this research is to explore potential long- and short-run connectedness between Bitcoin returns and the rest of the recent (March 2020) top 10 cryptocurrency returns (Ethereum, XRP, Bitcoin Cash, Tether, Bitcoin SV, Litecoin, EOS, Binance coin and Tezos). For robustness, these estimates are repeated for different frequencies (daily, weekly, and monthly) for a sample period from 26 January 2015 to 7 March 2020 in a nonlinear ARDL framework.
This paper contributes to the previous literature in several ways. First, to the best of our knowledge, this is the first research that simultaneously estimates both long- and short-run asymmetries in the cryptocurrency markets. This is accomplished by using the NARDL approach [
2,
18] to examine the relationship between Bitcoin returns and the remaining top 10 cryptocurrencies’ returns. References [
2,
18,
19] affirm that some of the main advantages of the NARDL methodology is that it is suitable for small samples regardless of the stationarity of the variables. Additionally, this methodology checks simultaneously long- and short-run nonlinearities by estimating positive and negative partial sum decompositions of the regressors. Also, the NARDL approach separately measures responses to positive and negative shocks of the regressors from the asymmetric dynamic multipliers. Second, this research studies in depth the potential connectedness between Bitcoin and the nine alternative named cryptocurrencies. Alternative cryptocurrencies have been selected as the largest market capitalizations as reported on 7 March 2020 from the Coinmarketcap site. Finally, for robustness, this study compares estimates for daily, weekly, and monthly frequencies.
The rest of the paper is structured as follows.
Section 2 develops a wide literature review concerning the interdependence among different altcoins of the cryptocurrency market.
Section 3 presents the data and the methodology applied in this study.
Section 4 collects the main results of our NARDL estimates, distinguishing three different sub-sections depending on the frequency (daily, weekly, and monthly) of the data. Finally,
Section 5 summarizes and presents concluding remarks and comments on potential implications and future research.
2. Literature Review
The number of empirical studies analyzing cryptocurrencies has grown exponentially in the recent years in the financial literature. Thus, reference [
20] performs a rigorous review of financial literature about the cryptocurrency market, remarking that cryptocurrencies must face charges of potential illicit use and inexperienced exchange systems, among others. Some additional recent examples of research include reference [
2] that studies the relationship between Bitcoin and Gold price returns, finding a positive and statistically significant connectedness, and reference [
21] that remark the prevalence of cryptocurrencies with over 2000 Bitcoin-like cryptocurrencies now in use among many recent contributions.
However, a recent important extension of the literature examines the relationships among Bitcoin and other alternative cryptocurrencies. Reference [
1] proposes the autoregressive distributed lag (ARDL) methodology to study interdependencies between the reference cryptocurrency Bitcoin plus other alternative virtual currencies and two altcoin markets in the short and long run for the period 2013–2016. They find that there is a statistically significant relationship between Bitcoin and altcoin markets, mainly in the short run. Using the same ARDL approach, reference [
22] checks if the new coin events significantly influence Bitcoin returns. They find evidence that Initial Public Offerings (IPOs) of new altcoins reduce Bitcoin returns.
Reference [
23] studies potential co-movements between Bitcoin and some relevant cryptocurrencies (Dash, Ethereum, Litecoin, Monero and Ripple) using wavelet techniques. The find co-movements in the following relationships: Bitcoin-Dash, Bitcoin-Monero, Bitcoin-Ripple and additionally they find evidence of important diversification abilities with an Ethereum-Bitcoin portfolio in the long-term, and Monero-Bitcoin portfolio in the short-term. Reference [
24] uses wavelet-based methods to analyze the time-varying co-movement patterns of some relevant cryptocurrency prices (Bitcoin, Ethereum, Lite, and Dashcoin). First, using wavelet multiple correlation and cross-correlation, they show Bitcoin could be the potential market leader. Additionally, they estimate wavelet local multiple correlation for the aforementioned cryptocurrency prices across different time-scales concluding that the correlation follows an aperiodic cyclical pattern and that the cryptocurrency prices are driven by Bitcoin price fluctuations, with important implications for investment purposes. Reference [
25] applies the cross-quantilogram approach to study the hedging abilities of some relevant cryptocurrencies against down fluctuations in the US stock market and US sector indices. They find very heterogeneous results that help investors to manage cryptocurrencies portfolios. Reference [
26] analyzes the volatility movements of the most important cryptocurrencies (Bitcoin and Ether) by using a bivariate Diagonal BEKK model. This research finds evidence of interdependencies in the cryptocurrency market as well as the effects of important events on volatility with important implications for informed decision-making by investors.
In the same vein, reference [
8] measures interdependencies between the most important cryptocurrencies’ returns and volatilities, using the Diebold and Yilmaz approach [
5]. They suggest an emergent and time-varying interdependence between the cryptocurrencies analyzed. One of the recent methodologies is applied in [
9], specifically the Diebold and Yilmaz measures [
6,
7], to study potential return and volatility connectedness among six cryptocurrencies. They discover that changes in Litecoin and Bitcoin returns show the most relevant impact on the rest of cryptocurrencies. Furthermore, Bitcoin and Litecoin show the highest and Dash the lowest volatility connectedness, confirming the hedging potential of Bitcoin and Litecoin when constructing portfolios with cryptocurrencies. Reference [
27] estimates market-herding dynamics in the cryptocurrency market by adapting the Capital Asset Pricing Model (CAPM) framework as developed earlier by [
28]. Thus, this methodology explores time variation in betas and cross-sectional dispersion of individual assets, showing a recent growing market herding.
Some other research, such as [
3], uses a VAR modelling methodology to study the information transmission between the most important cryptocurrencies (Bitcoin, Litecoin, Ripple, Ethereum, and Bitcoin Cash). Specifically, by obtaining the Geweke’s feedback measures and generalized impulse response functions, they confirm a strong contemporaneous information transmission, and some lagged feedback effects, mainly from other cryptocurrencies to Bitcoin. Reference [
10] examines potential spillovers between Bitcoin and companies in the energy and technology sector in the context of an asymmetric multivariate VAR-GARCH methodology. They find statistically significant return and short-run volatility spillovers from (mainly technology) companies to Bitcoin and long-run volatility spillovers from Bitcoin to energy companies. Reference [
11] uses several time-varying copula methods and bivariate dynamic conditional correlation GARCH models to examine the financial properties of cryptocurrencies and their dynamic relationship with some financial and commodity assets. They discover some important implications for investors, as the cross-correlation with conventional assets is changeable over time, depending on economic shocks. Additionally, cryptocurrencies may be suitable for financial diversification, but may form poor hedging instruments. Reference [
12] applying the GARCH-MIDAS approach to forecast volatility of some relevant cryptocurrencies using different data frequencies. In addition, they propose different economic and financial drivers. They conclude that Global Real Economic Activity provides better volatility forecasts in bull and bear markets.
Reference [
13] uses a multivariate BEKK-GARCH methodology and impulse response analysis applied within a VAR model to check potential hedging properties and volatility spillovers between Bitcoin and Ethereum. They find that the connectedness between them is time-variant and decreases the potential diversification properties over time. These results have implications for investment strategies mainly during economic turmoil. Reference [
14] applies pairwise bivariate BEKK models to study interlinkages and conditional correlations between different pairs of cryptocurrencies. Specifically, they analyze Bitcoin-Ether, Bitcoin-Litecoin, and Ether-Litecoin, pairs finding evidence of bi-directional effects in Bitcoin-Ether and Bitcoin-Litecoin, and uni-directional spillover from Ether to Litecoin. Furthermore, bi-directional volatility spillovers are found in all cases, as well as time-varying and positive conditional correlations. Reference [
15] applies Diagonal BEKK and Asymmetric Diagonal BEKK methodologies on eight cryptocurrencies (Bitcoin, Ethereum, Litecoin, Dash, Ethereum Classic, Monero, Neo and OmiseGO) to study conditional volatility dynamics among them and their volatility co-movements. They find that cryptocurrencies have high term persistence of volatility, show strong interdependencies between them and have time-varying and positive conditional correlations. In the same vein, reference [
16] uses the Granger causality test and a BEKK-MGARCH approach to study the return and volatility spillovers between Bitcoin and Litecoin. They show that both return and volatility spillovers run in one direction, from Bitcoin to Litecoin.
Reference [
29] studies, among other topics, the weak-form market efficiency in the cryptocurrency market analyzing the measure “price delay” showing that it significantly decreases over time thereby supporting weak-form efficiency of the cryptocurrency market. Reference [
30] studies Bitcoin, Litecoin, Ripple and Dash portfolio optimization and the correlation between them showing that the Black–Litterman model with Variance-Based Constraints (VBCs) offers better out-of-sample estimates than other benchmarks. Therefore, investors should apply more advanced approaches such as the Black–Litterman model to better manage cryptocurrency portfolios. Reference [
31] studies many (smaller and larger) cryptocurrencies and the potential existence of herding in this market, showing inefficiency and excessive risk only in economic turmoil. In addition, smaller cryptocurrencies may be herding with larger ones. Reference [
32] studies the relationship between returns and volatility of Bitcoin, at both contemporaneous and intertemporal levels, employing high-frequency data. Thus, there could be a negative, statistically significant, and contemporaneous link between all volatility measures and Bitcoin returns, but weak evidence in case of realized variance, jump variation, and downside realized semivariance. Additionally, there is no justification for a positive risk-return trade-off in Bitcoin markets. Reference [
33] remarks on the relevance of correlation networks on the evolution of cryptocurrency prices over time and finds a positive and statistically significant connectedness between different cryptocurrencies. Specifically, one group of cryptocurrencies could be particularly correlated with Cardano while another group associated with Ethereum.
Some of the literature use novel approaches. Reference [
4] applies descriptive metrics from Complex Networks to study the price synchronization in the cryptocurrency market. Specifically, they employ the Threshold Weighted—Minimum Dominating Set (TW-MDS) methodology to detect dominant cryptocurrencies over time, assuming that a dominant node would describe the behavior of the cryptocurrency market. They conclude that there is strong evidence of a growing price synchronization in this market. Reference [
34] applies the generalized variance decomposition methodology, which enables the construction of a directional weighted network to study the connectedness between return and volatility of many cryptocurrencies. She finds highly connected cryptocurrencies mainly during shocks and some cryptocurrencies (Ethereum, Monero, OmiseGo) have more impact on the market than others. Additionally, some cryptocurrencies are less connected and less affected by shocks implying they are more attractive for investment purposes. Reference [
17] analyzes the structure of the cryptocurrency market and propose the Bitcoin-Ethereum filtering mechanism (based on the agglomerative hierarchical clustering and minimum spanning tree) to exclude their linear influences with other cryptocurrencies. For robustness, they examine the market structures before and after filtering in terms of the Total, Pre-, and Post-regulation periods. They find evidence that Bitcoin and Ethereum are leaders in the cryptocurrency market, there are six other clusters of cryptocurrencies, and market structures renovate after the announcement of new regulations from several countries.
Reference [
35] uses cointegrating tests and Vector Error Correction (VEC) Granger Causality/Block Exogeneity Test approaches to research the Bitcoin–Altcoin price synchronization hypothesis for ten altcoins, specifically Litecoin, Dash, Doge, IOTA, Nem, Neo, Stellar, Ripple and Tron for three different sub-periods: 2015–2016, 2017, and 2018. They find cryptocurrency investors are more sensitive to the features and quality of each coin during 2018 than for 2017. Reference [
36] provides a systematic survey of return and volatility spillovers of cryptocurrencies, considering other cryptocurrencies and alternative assets. Thus, Bitcoin is the most relevant cryptocurrency mainly as a transmitter, but also as a receiver of spillovers. Furthermore, Bitcoin shows the most important connectedness with Ethereum, Litecoin, and Ripple. Return spillovers are more pronounced than volatility bi-directional spillovers. Finally, reference [
36] detects volatility transmission among Bitcoin and national currencies. Reference [
37] applies multivariate extreme value theory and they estimate a bias-corrected extreme correlation coefficient to study the contemporaneous tail dependence structure in pairwise comparisons of a large number of cryptocurrencies (Bitcoin, Dash, Dogecoin, Ethereum, Litecoin, Monero, Namecoin, Novacoin, Peercoin, and Ripple). They find significantly high bivariate dependency in the distribution tails of some of the most important cryptocurrencies. Thus, extreme correlations increase in bear markets, but not in bull markets for the pairs studied. Moreover, many cryptocurrency pairs show a low level of dependency in the tails of the distribution. Reference [
38] uses panel ordinary least squares with cluster-robust standard errors to research the field of Tokenomics studying many blockchain tokens. This paper analyzes the potential connectedness between non-digital entities and digital tokens, finding that token functions significantly affect token prices regardless of the stage of the business cycle. Finally, reference [
39] studies the diversification capability of some cryptocurrencies (Bitcoin, Litecoin, Ripple, Stellar, Monero, Dash, and Bytecoin) against certain economic risks such as changes in oil price, gold price, interest rate, USD strength, and the stock market. Thus, they show structural breaks and Autoregressive Conditional Heteroskedastic (ARCH) disturbance in each cryptocurrency, suggesting a systematic risk within the cryptocurrency market. Furthermore, cryptocurrencies could have insignificant correlations with economic risk factors, reducing their diversification abilities.
Thus, to the best of our knowledge, this paper contributes to this previous literature in several ways. First, this research studies in depth the potential connectedness between Bitcoin and many other important cryptocurrencies in terms of recent market capitalization using the NARDL approach. The advantage of this methodology is that it enables us to simultaneously estimate both long- and short-run asymmetries [
2,
18]. Additionally, for robustness, this study compares estimates from several frequency data (daily, weekly, and monthly).
4. Results and Discussion
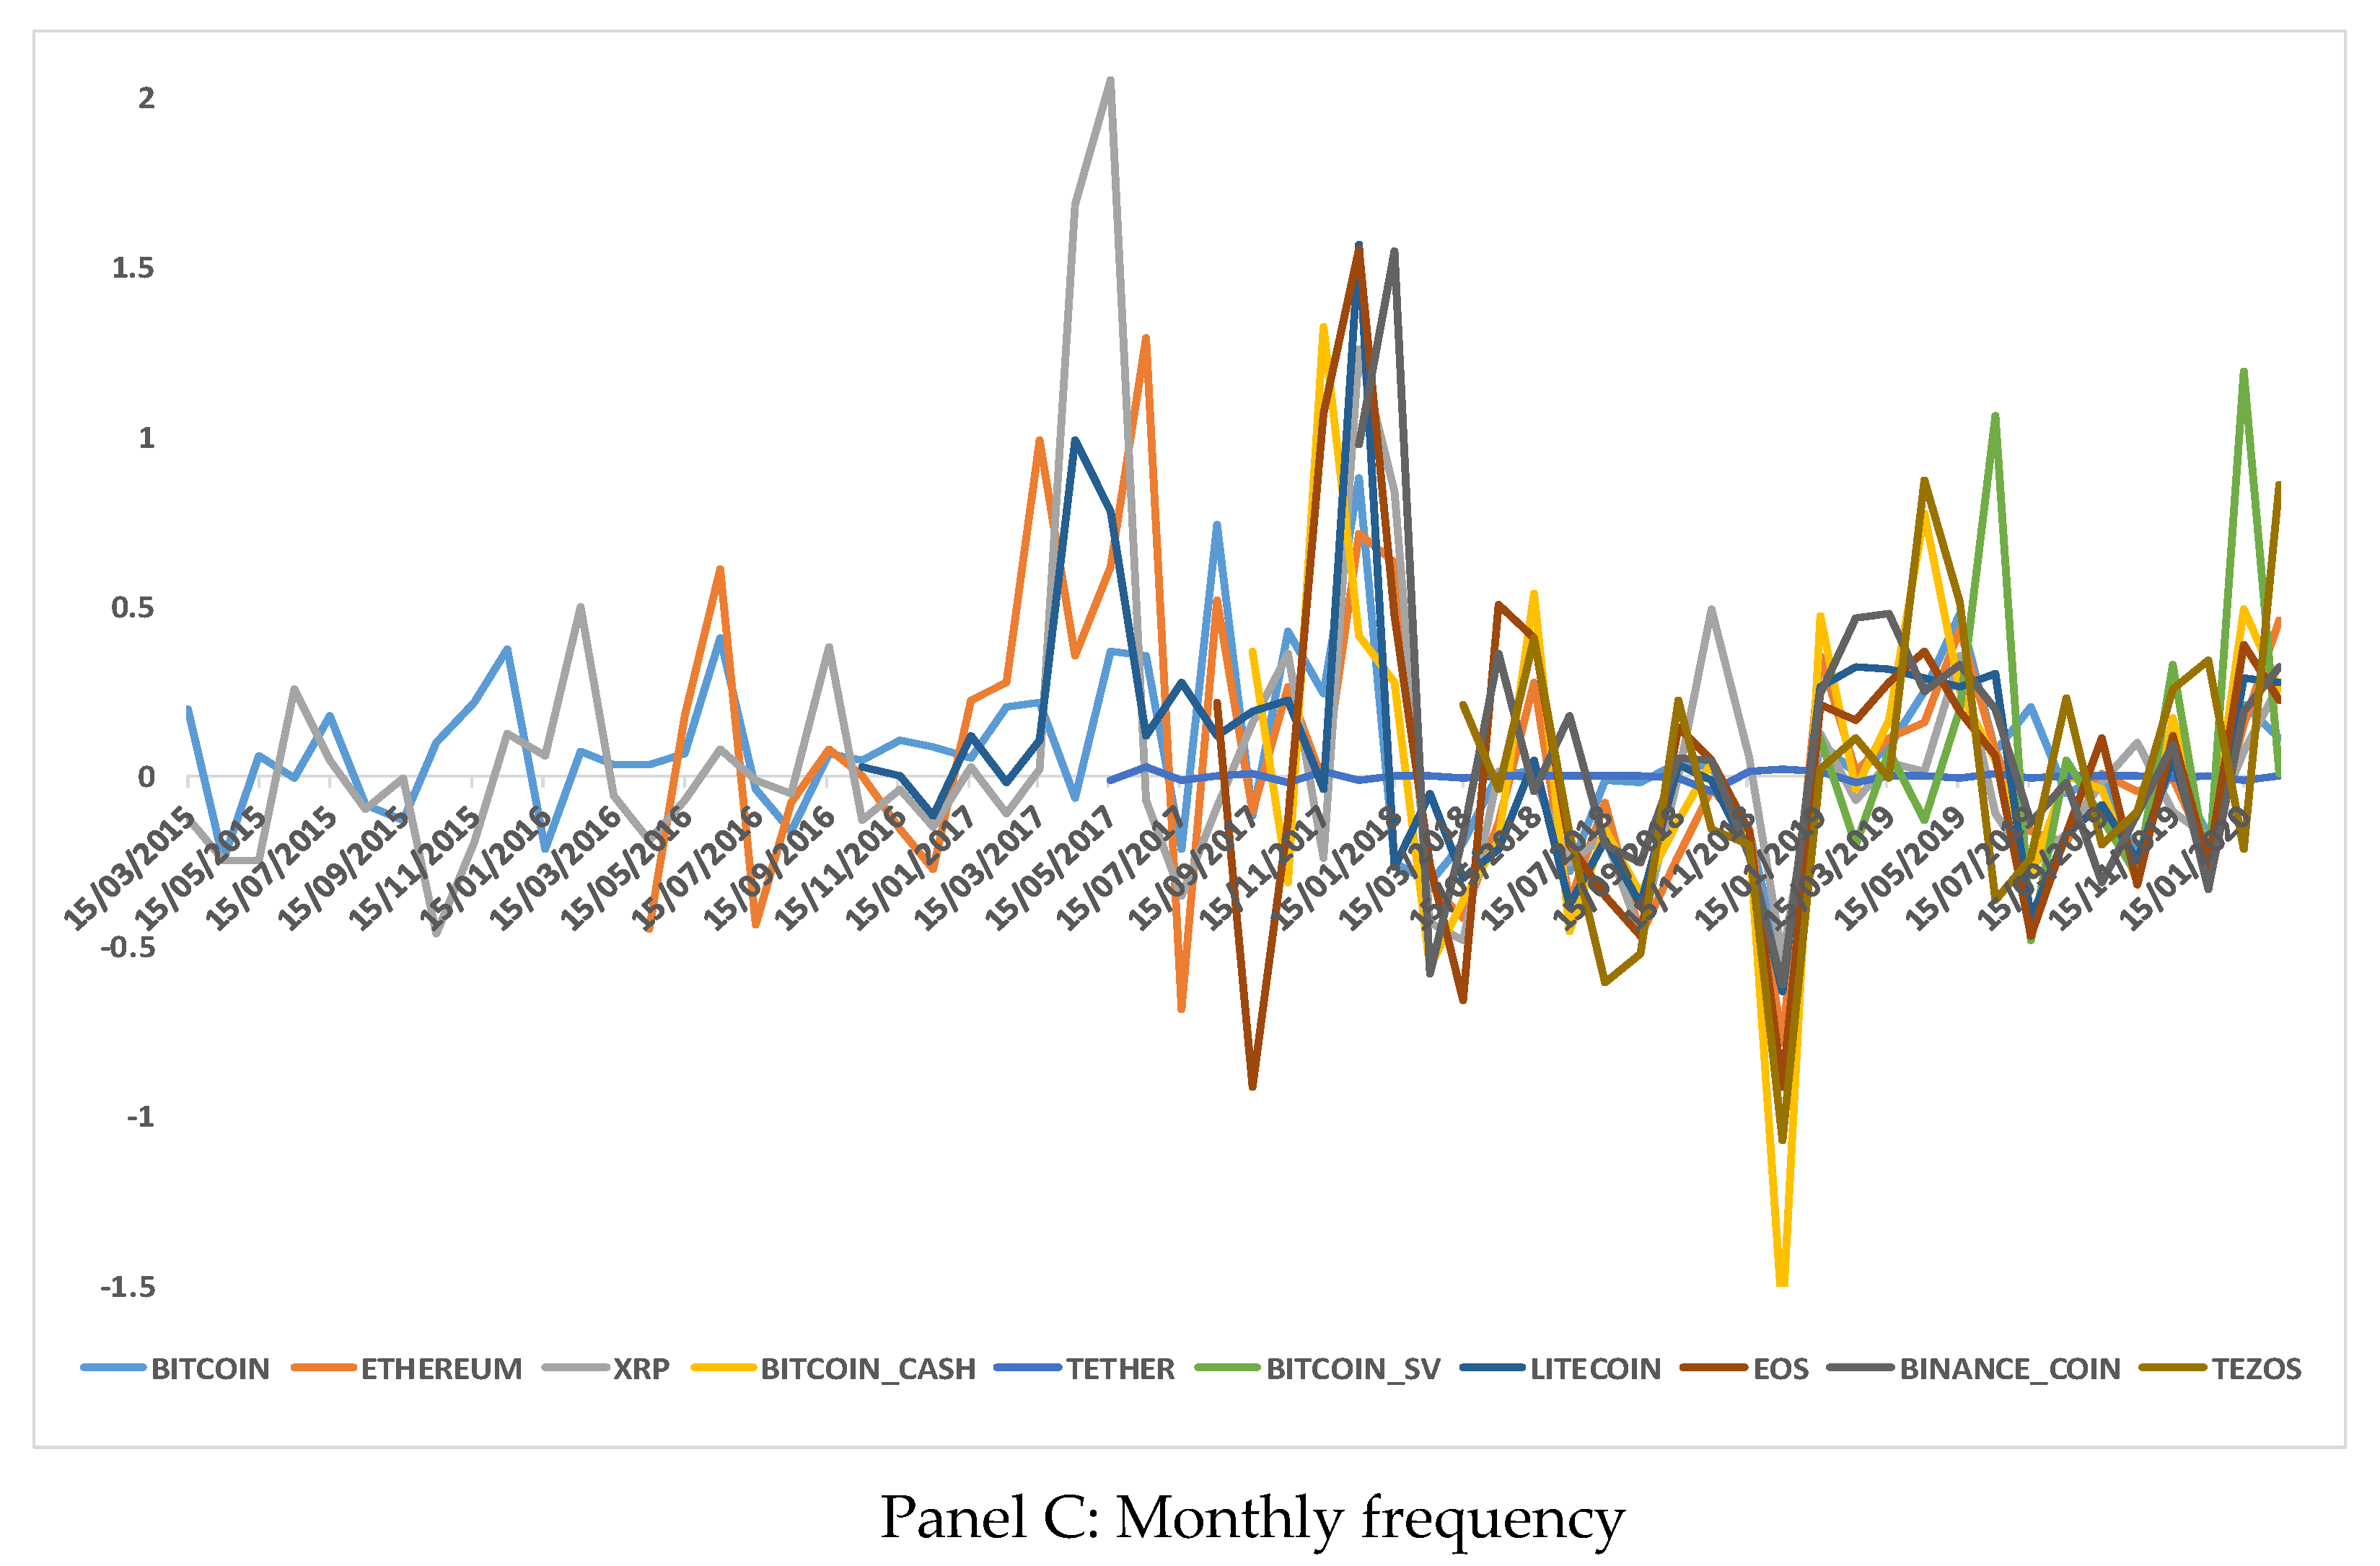
This section reports the estimates of the nonlinear ARDL model; including estimates of the long- and short-run relationships between Bitcoin returns and the rest of the top 10 cryptocurrency returns for different frequencies (daily, weekly, and monthly) for a sample period from 26 January 2015 to 7 March 2020. We would like to highlight that the results may not be appropriate for monthly frequencies because due to the recent appearance of certain currencies such as “Bitcoin SV” (on 19 November 2018) and “Tezos” (on 2 February 2018), there are very few monthly data in these two cases. In addition, it is noteworthy that the maximum lag order considered in these NARDL estimations is 4.
4.1. Results of the NARDL Models: Daily Frequency
Table 3 reports the regression results of the nonlinear ARDL models and the asymmetry and cointegration tests between Bitcoin returns and the rest of the top ten cryptocurrency returns (Ethereum, XRP, Bitcoin Cash, Tether, Bitcoin SV, Litecoin, EOS, Binance coin, and Tezos) for daily frequency.
Table 3 is organized as follows. Column 2 contains the Pearson’s correlation coefficients, column 3 the Wald F test for the presence of cointegration, column 4 the cointegration equation (long-run elasticities) between Bitcoin returns and the rest of cryptocurrency returns, column 5 the Wald test for long-run symmetry, column 6 the Wald test for short-run symmetry, columns 7 and 8 report the effect of the cumulative sum of positive and negative changes (respectively) in Bitcoin returns for (1–4)-lags on the rest of cryptocurrencies and finally, column 9 shows the Adjusted R
2 of each cryptocurrency.
The Pearson’s correlation coefficients in column 2 show that the null hypothesis of no correlation (H0: PCorr = 0) is rejected by all the top ten cryptocurrencies. More specifically, a high positive correlation is observed between Bitcoin returns and all the rest of the top ten cryptocurrency returns. All of them exhibit statistical significance at the 1% level, showing Pearson’s correlation coefficients between 43.3% and 82.2%, except for Tether that shows statistical significance at the 5% level and the lowest Pearson’s correlation coefficient of 10.7%.
The Wald F test for the presence of cointegration reported in column 3 shows that the null hypotheses of no cointegration on the level variables jointly equal to zero (H0: β1 = β2 = β3 = 0) is rejected by five cryptocurrencies (XRP, Bitcoin_cash, Tether, EOS, and Binance coin). Thus, the F statistics show long-run relationships, i.e., cointegration, between changes in Bitcoin returns and XRP, Bitcoin_cash, Tether, EOS and Binance_coin returns for daily frequency. Additionally, the long-run coefficients of changes in Bitcoin returns are positive and statistically significant at 1% level for these five cryptocurrencies, where the highest values are for XRP and Theter.
Column four of
Table 3 shows the cointegration equation:
Rjt−i = e+·BR+t−i + e−·BR−t−i (long-run elasticities) between Bitcoin returns (BR) and the rest of the top ten cryptocurrencies’ returns (
Rjt−i). Thus, regarding the long-run elasticities for the cumulative sum of positive changes in Bitcoin returns)
BR+t−i and the cumulative sum of negative changes in Bitcoin returns BR
−t-i, all cryptocurrency returns respond in the same way to positive and negative changes in Bitcoin returns. Additionally, the coefficients are quite similar and are of modest size for all cryptocurrencies. The largest coefficients correspond to Bitcoin_sv returns that respond more to positive and negative changes in Bitcoin returns (4.5% versus 5.7%, respectively). Moreover, the long-run elasticities for the cumulative sum of positive and negative changes in Bitcoin returns are statistically significant just for four cryptocurrencies, EOS, XRP, Tether and Binance_coin. Moreover, the coefficients are negative for XRP and EOS, meaning they move in the opposite direction to the changes in Bitcoin returns, but are positive for Tether and Binance_coin, meaning they fluctuate in line with Bitcoin returns.
The fifth column shows the Wald test for investigating long-run symmetry. These results show that the null hypothesis of long-run symmetry (H0: −β2/β1 = −β3/β1), is rejected only by two cryptocurrencies: XRP and Binance_coin. Thus, the Wald test indicates that there could be asymmetry in the long-run impact of Bitcoin returns on XRP and Binance_coin returns for daily data, corroborating previous results obtained with long-run elasticities.
The sixth column shows the Wald test for short-run symmetry. In this case, the null hypothesis of short-run symmetry (H0: γi+ = γi−), is rejected by all the cryptocurrencies as all cryptocurrencies show positive and statistically significant coefficients at the 1% significance level. Therefore, there is strong evidence of asymmetric short-run responses of all cryptocurrency returns to changes in Bitcoin returns for daily frequency. Thus, nonlinear asymmetries are important in the short-run relationship between Bitcoin returns and the remaining top ten cryptocurrencies’ returns for daily data.
Columns seven and eight show the effect of the cumulative sum of positive and negative changes respectively in Bitcoin returns for 1 to 4 lags on the rest of cryptocurrencies’ returns. In line with [
2,
18], among others, we observe high persistence in the effect of both positive and negative changes in Bitcoin returns, for 1 to 4 lags, in more than half of the cryptocurrency returns. More specifically, we observe a positive and statistically significant effects of the cumulative sum of positive changes in Bitcoin returns on Ethereum returns (for 2- and 4-lags), XRP returns (for 1- and 3-lags), Bitcoin_sv returns (for 2-lags) and Litecoin returns (for 1- and 2-lags), as well as a negative and statistically significant effect of the cumulative sum of positive changes in Bitcoin returns on Bitcoin_cash returns (for 1-lag). We also notice just negative and statistically significant effect of the cumulative sum of negative changes in Bitcoin returns on Ethereum returns (for 3-lags), Bitcoin_cash returns (for 1-lag), Tether returns (for 1- and 2-lags), EOS returns (for 4-lags) and Binance_coin returns (for 1-lag).
Finally, the explanatory power of the NARDL model as reported in the last column varies from a minimum of 14.5% for Tether to a maximum of more than 40% for EOS and Binance_coin returns.
4.2. Results of the NARDL Models: Weekly Frequency
Table 4 shows the weekly regression results of nonlinear ARDL models and asymmetry and cointegration tests between Bitcoin and the remaining top 10 cryptocurrency returns. Overall, the explanatory power of the NARDL model as measured and reported in the last column of
Table 4 varies from a minimum of 6.7% (for XRP returns) to a maximum of 51.6% (for Bitcoin_cash returns) and 50% (for EOS returns). There appears to be a tendency for the R
2 to be a bit higher for weekly than for daily frequencies.
Table 4, column 2, reports the Pearson’s correlation coefficients between Bitcoin returns and the rest of the top ten cryptocurrency returns and states that the null hypothesis of no correlation is rejected by all the top ten cryptocurrencies. There is a strong positive correlation, at least 40%, between Bitcoin and all but Tether cryptocurrency returns and all of them show a statistical significance at the 1% level. Tether is an interesting exception showing a negative and statistically significant correlation with Bitcoin returns.
Column 3’s Wald’s F test for cointegration shows that the null hypothesis of no cointegration is rejected by four cryptocurrencies (Ethereum, Tether, EOS, and Binance coin). Thus, indicating long-run connectedness between weekly Bitcoin returns and Ethereum, Tether, EOS and Binance_coin weekly returns. Additionally, the long-run coefficients of changes in Bitcoin returns are positive and significant at the 5% significance level for Tether and EOS and at the 10% significance level for Ethereum and Binance_coin.
Column four of
Table 4 shows that all cryptocurrency returns (except for Litecoin returns) respond in the same way to positive and negative changes in Bitcoin returns. Additionally, the coefficients are quite similar for most cryptocurrencies except for Ethereum, Bitcoin_sv, Litecoin and especially for Binance_coin where estimates for long-run elasticities are substantially different. Clearly, the Binance_coin returns respond more to negative changes in Bitcoin returns because the coefficient is larger. Thus, for instance, a 10% increase in Bitcoin returns is related to the increase in the Binance_coin returns by about 1.9%. However, a 10% decrease in Bitcoin returns leads to an 11.9% decrease in Binance_coin returns. Nevertheless, these elasticities are not statistically significant. Long-run elasticities for the cumulative sum of positive and negative changes in Bitcoin returns are statistically significant just for Tether, EOS and XRP at the 1%, 5% and 10% significance level, respectively. Moreover, the coefficients are negative for XRP and positive for EOS and Tether.
The Wald test for long-run symmetry reported in column five shows that the null hypothesis of long-run symmetry is not rejected by any of the top ten cryptocurrencies. However, the corresponding test for short-run symmetry reported in column six shows that the null hypothesis of short-run symmetry is rejected by all the cryptocurrencies. More specifically, all cryptocurrencies show positive and statistically significant coefficients at 1% significance level. Therefore, there is strong evidence of asymmetric short-run responses of all cryptocurrency returns to changes in Bitcoin returns for weekly frequency but there is no evidence of long-run asymmetry. Therefore, nonlinear asymmetries are also important for the short-run relationship between Bitcoin and the remaining top 10 cryptocurrencies for weekly data.
Weekly frequency data also corroborate a high persistence on the impact of both positive and negative changes in Bitcoin returns, for 1 to 4 lags, on half of the remaining top 10 cryptocurrency returns. More specifically, the cumulative sum of positive and negative changes (respectively) of Bitcoin returns for 1 to 4 lags on the rest of cryptocurrency returns, shown in columns seven and eight of
Table 4, illustrates that there is a statistically significant and slightly larger short-run impact of increases than decreases of Bitcoin returns on most cryptocurrency returns. We notice a positive and statistically significant effect of the cumulative sum of positive changes in Bitcoin returns on Bitcoin_cash returns for 2- and 4-lags, on Tether returns for 1- and 3-lags, on Bitcoin_sv returns for 1-lag and on Binance_coin returns for 2-lags, as well as a negative and statistically significant effect of the cumulative sum of positive changes in Bitcoin returns on EOS returns for 3-lags. We also notice a positive and statistically significant effect of the cumulative sum of negative changes in Bitcoin returns on Bitcoin_cash for 1- and 3-lags and a negative and statistically significant effect of the cumulative sum of negative changes in Bitcoin returns on Bitcoin_sv and EOS for 1-lag.
4.3. Results of the NARDL Models: Monthly Frequency
Table 5 shows the regression results of nonlinear ARDL models and asymmetry and cointegration tests between Bitcoin returns and the remaining top 10 cryptocurrency returns for monthly frequency. It should be noted that monthly data may give inaccurate results for a few of the altcoin cryptocurrencies because some have only recently been created and so have a modest number of monthly observations. Specifically, the most recent cryptocurrencies are Tezos, whose prices start on 2 February 2018, and especially Bitcoin_sv, whose prices start on 19 November 2018. Therefore, we will analyze the monthly results considering this potential limitation.
Neglecting the results of recently issued cryptocurrencies with modest sample size, the explanatory power of the monthly NARDL model varies from a minimum adjusted R2 of 26.8% for the Tether returns to a maximum of 77.3% for EOS returns. It is noticeable that the two most recently issued cryptocurrencies with the smallest sample size have the highest adjusted R2; 96.6% for Bitcoin_sv and 80.1% for Tezos. In any event, there is a clear tendency for the explanatory power of the NARDL model to rise as the sampling frequency decreases. For example, for EOS the explanatory power steadily increases as we move from daily, weekly, and monthly frequency, achieving R2 of 40.4%, 50% and 77.3% respectively.
The Pearson’s correlation reported in column two of
Table 5 rejects the null hypothesis of no correlation for just six out of nine cryptocurrencies. More specifically, a positive and statistically significant relationship is observed between Bitcoin returns and Ethereum Bitcoin_cash, XRP, Litecoin, EOS and Binance_coin returns at but only Ethereum and Bitcoin_cash are highly significant, the rest are significant at the 10% level. It is interesting to note that the three cryptocurrencies that do not reject the null hypothesis are the two above noted most recently issued cryptocurrencies and Tether, which as the lowest R
2 of all, showing that there is no correlation between bitcoin returns and the returns of these more recent cryptocurrencies.
The results of the Wald’s F test for cointegration, reported in column three of
Table 5, show that the null hypothesis of no cointegration is rejected by six cryptocurrencies, XRP, Tether, Bitcoin_sv, Litecoin, EOS, and Tezos. Thus, the bounds F statistics show long-run connectedness between these cryptocurrency returns and changes in Bitcoin returns. In addition, the long-run coefficients of changes in Bitcoin returns are positive and statistically significant in these six cryptocurrencies. We should note that for Tezos and Bitcoin_sv, the two most recently issued cryptocurrencies, have the very high F statistics that could be an artifact of a modest sample size.
The cointegration equation listed in column four shows that all cryptocurrency returns respond in the same way to positive and negative changes in Bitcoin returns. Additionally, the coefficients are quite similar for most cryptocurrencies except for the two most recently issued cryptocurrencies where Tezos coefficient of negative changes in Bitcoin returns is twice as high as the coefficient of positive changes and especially the most recently issued Bitcoin_sv, where the coefficient of negative changes is almost nine times higher than the coefficient of positive changes. Furthermore, the long-run elasticities for the cumulative sum of positive and negative changes in Bitcoin returns are statistically significant just for Tether, Litecoin and Tezos and just the coefficient of negative changes of Bitcoin returns for Bitcoin_sv and EOS.
The results of the Wald test for testing the long-run symmetry reported in column five, show that the null hypothesis of long-run symmetry is rejected only by Bitcoin_sv and Tezos indicating that there could be asymmetry in the long-run impact of Bitcoin returns for these two most recently issued cryptocurrencies. For the Wald test for testing the short-run symmetry reported in column six, it is observed that only two of them, one of which is the modest sample size by Bitcoin_sv, show negative and statistically significant coefficients. Meanwhile all the remaining cryptocurrencies have positive and statistically significant coefficients at 1% level. Therefore, all cryptocurrency returns show asymmetric short-run responses to changes in Bitcoin returns for monthly frequency.
The effect of the cumulative sum of positive and negative changes in Bitcoin returns for 1–4 lags on the rest of cryptocurrency returns is shown in columns seven and eight of
Table 5. There is a positive and statistically significant effect for the cumulative sum of positive changes in Bitcoin returns on six out of nine cryptocurrency returns: on Bitcoin_cash, Tether and EOS returns (for 1-lag), on Bitcoin_sv returns (for 1- and 2-lags), and on Litecoin and Binance_coin returns (for 1- and 4-lags), as well as just a negative and statistically significant effect in Bitcoin returns on Tezos returns (for 2-lags). We also notice a positive and statistically significant effect of the cumulative sum of negative changes in Bitcoin returns just on Tezos returns (for 1-, 2- and 3-lags), as well as a negative and statistically significant effect of the cumulative sum of negative changes in Bitcoin returns on four out of nine cryptocurrency returns: on Tether returns (for 1-lag), on Litecoin returns (for 3-lags), on EOS returns (for 1- and 3-lags) and on Binance_coin returns (for 2-, 3-, and 4-lags). Consequently, for monthly frequency, we find a high persistence in the effect of both positive and negative variations in Bitcoin returns, for 1 to 4 lags, on most of the cryptocurrency returns.
5. Concluding Remarks
This paper aims to study both long- and short-run interdependencies between returns of Bitcoin and the rest of the recent most important cryptocurrencies that is Ethereum, XRP, Bitcoin Cash, Tether, Bitcoin SV, Litecoin, EOS, Binance coin, and Tezos applying a NARDL approach. Our sample period extends from 26 January 2015 to 7 March 2020 and our research check results for daily, weekly, and monthly frequency data.
To the best of knowledge, this is the first study that explores the co-movement between Bitcoin and the remaining top ten cryptocurrencies selected according to the largest market capitalization, by using the NARDL approach to evaluate both long- and short-run asymmetries. The Pearson’s correlation coefficients provide evidence that there is a positive and statistically significant correlation between Bitcoin returns and all the rest of the top ten cryptocurrencies for all frequencies, except for the most recent cryptocurrencies, for monthly frequency, likely due to the lack of data. These results are in line with those obtained in works such as [
2,
4,
9,
15,
26,
31]. We find a cointegration or long-run relationship between most cryptocurrency returns and changes in Bitcoin returns for all frequencies [
32], while in [
35] most of the variables are not cointegrated. Moreover, the cointegration equation reveals that cryptocurrency returns usually respond in the same way to positive and negative changes in Bitcoin returns, with very few exceptions. Furthermore, our tests indicate that asymmetries in the long-run impact of Bitcoin returns is operative on a maximum of only two of nine cryptocurrency returns but there is strong evidence of asymmetry in the short-run impact of Bitcoin returns in all cryptocurrency returns for all frequencies. This provides strong evidence that nonlinear asymmetries are especially important for the short-run relationships between these cryptocurrencies. Our results are similar to those found in [
1,
22], but instead of using ARDL, we include non-linearity in the estimation. We find evidence of high persistence in the impact of both positive and negative changes in Bitcoin returns, for 1 to 4 lags for most of the cryptocurrency returns. Specifically, the cumulative sum of positive and negative changes in Bitcoin returns has a statistically significant effect on most cryptocurrency returns for daily, weekly, and monthly frequencies. The NARDL model explains more than 40% and 50% of the cryptocurrency returns with changes in Bitcoin returns for the daily and weekly time series respectively but monthly results for the most recently issued cryptocurrencies could be exaggerated due to the short time series available for monthly data.
According to our results, some cryptocurrencies (in concrete XRP, Tether and EOS) are more connected to Bitcoin than others (Tezos, among other altcoins), in line with [
23]. The economic intuition being the more connected an altcoin is, the more likely they can be used as a substitute whereas the lower the connectedness, the more they can be considered to be an alternative asset distinct from Bitcoin. Thus, potential practical applications of our results could be that the least connected virtual coin can be used to diversify positions in Bitcoin whereas the more connected the altcoin is, the better it can be used to hedge positions in Bitcoin. Assuming that there would be a lack of liquidity in the cryptocurrency market so that if you, as a potential investor, wish to reduce exposure in Bitcoin and you sell, then your own selling actions could reduce the Bitcoin price against you. Similarly, if you want to hedge, you probably could not short Bitcoin so selling a highly correlated altcoin could be the alternative to hedge. Moreover, another relevant aspect of research is how the results change as we move from daily to monthly observations. We seem to obtain an increase in R square as we reduce the frequency of the observations. Does that suggest that the longer the periodicity of data the more connected the altcoins are to Bitcoin? That would be interesting if for example we wish to hedge Bitcoin positions with say Tether positions.
For all that, our results would have important implications for market participants, because potential connectedness between the top cryptocurrencies’ returns may affect the decision-making of investors and policymakers. Thus, future research could extend our study to the analysis of potential co-movements in volatility in the cryptocurrency market as volatility co-movements can have a key role for implementing suitable investment strategies as well. To make more informed decisions, an extensive study of interdependencies between cryptocurrencies and conventional assets is crucial. Finally, it would be very interesting to incorporate into the analysis the stage of the economy, because previous literature confirms that interdependence patterns may change over time. This is a significant aspect in a market as volatile as the cryptocurrency market, especially in periods of economic recession such as the present one, caused by COVID-19, which is affecting the whole world. Therefore, a critical issue will be to propose investment strategies using cryptocurrencies as hedging and/or diversification instruments in the current period affected by the SARS-CoV-2 pandemic.


