Article

A Multi-Criteria Reference Point Based Approach for Assessing Regional Innovation Performance in Spain

by
Ana Garcia-Bernabeu
1,*,
José Manuel Cabello
2 and
Francisco Ruiz
2
1
Department of Economy and Social Sciences, Campus of Alcoi, Universitat Politècnica de València, 03801 Alcoi, Spain
2
Department of Applied Economics (Mathematics), Universidad de Málaga, 29071 Málaga, Spain
*
Author to whom correspondence should be addressed.
Mathematics 2020, 8(5), 797; https://doi.org/10.3390/math8050797
Submission received: 17 April 2020 / Revised: 8 May 2020 / Accepted: 9 May 2020 / Published: 14 May 2020
(This article belongs to the Special Issue Recent Advances and Applications in Multi-Criteria Decision Analysis)

Abstract

:
The evaluation of regional innovation performance through composite innovation indices can serve as a valuable tool for policy-making. While discussion on the best methodology to construct composite innovation indices continues, we are interested in deepening the use of reference levels and the aggregation issue. So far, additive aggregation methods are, largely, the most widespread aggregation rule, thus allowing for full compensability among single indicators. In this paper, we present an integrated assessment methodology to evaluate regional innovation performance using the Multi-Reference Point based Weak and Strong Composite Indicator (MRP-WSCI) approach, which allows defining reference levels and different degrees of compensability. As an example of application to the Regional Innovation Scoreboard, the proposed technique is developed to measure the innovation performance of Spain’s regions taking into account Spanish and European reference levels. The main features of the proposed approach are: (i) absolute or relative reference levels could be previously defined by the decision maker; (ii) by establishing the reference levels, the resulting composite innovation index is an easy-to-interpret measure; and (iii) the non-compensatory strong composite indicator provides an additional layer of information for policy-making (iv) a visualization tool called Light-Diagram is proposed to track the specific strengths and weaknesses of the regions’ innovation performance.

1. Introduction

Innovation is considered one of the key factors behind regional growth and lies at the centre of a huge number of studies trying to identify the driving forces of innovation [1,2,3,4]. Thus, the importance of measuring innovation is widely acknowledged by policy-makers and researchers in order to identify general trends, determine performance targets and set policy priorities. In recent years, there has been an ongoing debate on how the innovation performance at different levels should be measured, and three main approaches prevail. A first group includes the use of single indicators such as the number of patents [4,5,6] or research and development expenditures [7]. The second approach proposes the use of extensive sets of indicators in order to cluster the countries or regions [8,9,10]. Finally, starting from the 1990s, some researchers introduced the use of composite innovation indices, arguing that they can provide a more comprehensive way to benchmark innovation performance for the purpose of policy-making.
A composite innovation index is a mathematical combination of a set of indicators representing the different dimensions of innovation. Like other composite indices, most criticisms relate to the fact that they provide a simple “big picture” that can lead policy-makers to draw simplistic conclusions [11]. Thus, we are interested in deepening the use of multi-criteria decision making (MCDM) approaches to construct composite innovation indices, at regional level, which would allow us to provide valuable additional information in terms of comparability and compensability. With this aim, we make use of the Regional Innovation Scoreboard (RIS) framework, which provides data for all the European regions about 17 innovation single indicators. For a complete description of the RIS framework, see Table A1 in Appendix A.
Therefore, this paper addresses two research questions that focus on the construction of a composite innovation index to measure regional innovation performance at Europe.
  • The first question examines the issue of how the decision makers could provide preferential information making use of reference levels to define performance intervals from the beginning, depending upon the scope and aim of the composite innovation index. The point of establishing the reference levels is that the resulting composite innovation index is an easy-to-interpret measure in terms of a comparability analysis of regions at national or European level.
  • The second question is: how does the compensability of individual indicators affect the overall ranking of regions when evaluating their innovation performance? The level of compensability defined when the individual indicators are aggregated has strong policy-making implications. From full compensation(weak) to no-compensation aggregation (strong) rules, we can obtain different composite innovation indices that aid the users to identify weak and strong points of each region and design policies accordingly.
To answer these research questions, we apply a novel MCDM aggregation methodology for building composite indicators, known as Multiple Reference Point based Weak and Strong Composite Indicators (MRP-WSCI), which is based on the use of reference levels and distance functions [12]. By using reference levels, it is possible to set a priori performance intervals so that the proposed composite indicator enables the decision maker to monitor the innovation performance of a region at the global or national level. By establishing different degrees of aggregation, we obtain two types of composite indicators: the Weak Composite Indicator (WCI), which allows compensability among indicators and the Strong Composite Indicator (SCI), reflecting the worst values achieved by the region. Moreover, we pay special attention to the visualisation tools of the indicators and, apart from tables and graphs with the corresponding rankings and scores, we use a new interesting way to track the specific strengths and weaknesses of regions’ innovation performance, at every aggregation stage that we call Light-Diagram.
The paper is organized as follows. Section 2 develops a literature review on composite innovation indices. In Section 3, the procedure for developing the composite innovation index based on the MRP-WSCI method is described. In Section 4, we illustrate the proposed methodology making use of the RIS framework and 2019 dataset to benchmark the innovation performance of Spanish regions with respect to EU reference levels. Section 5 presents the numerical results of the MRP-WSCI application to Spain, but in this case, establishing Spanish’s reference levels. Finally, we conclude the paper with remarks in Section 6.

2. Composite Innovation Indices: A Literature Review

In the literature, the use of composite innovation indices was first introduced at the micro-level by the seminal work of [13], who developed a composite measure of firm’s innovativeness by using Factor Analysis of a whole set of innovation variables. Another example at firm level is [14], where a composite innovation index was proposed to benchmark the most innovative firms in Australia. In [15,16], a new measure of innovation was proposed to find the link between innovation and productivity in Canadian manufacturing industries. [17] define an innovative propensity index (IPI) of firms using a multi-criteria methodology based on Fuzzy AHP. Furthermore, in [18], an integrated innovativeness index is developed for benchmarking firm innovative performance by applying a recent multi-criteria methodology called Intuitionistic fuzzy-TOPSIS. The issue of evaluating the expediency of technology commercialization in R&D organizations using a MCDM approach is presented in [19].
In recent years, the use of composite indices has grown significantly at the macro-level to make cross national comparisons in several areas including innovation [20]. In the global context, the most comprehensive indicator for country innovation measurement is the Global Innovation Index (GII), which is jointly developed by INSEAD, World Intellectual Property Organization (WIPO) and Cornell University. Since 2007, the GII provides data and insights gathered from tracking innovation around the globe [21]. The GII is a composite index constructed in a multi-stage weighted average aggregation procedure starting from 80 single indicators, which are aggregated in seven pillars to provide two subindices—the Innovation Input Sub-Index and the Innovation Output Sub-Index. Finally, the overall GII score is the simple average of the Input and Output Sub-Indices. At the European scale, since the beginning of 2000s, the European Commission has promoted the use of composite indicators arguing that “by aggregating a number of different variables, composite indicators are able to summarise the big picture in relation to a complex issue with many dimensions” [22]. In the field of the measurement of innovation, the annual European Innovation Scoreboard (EIS) assesses strengths and weaknesses of EU Member States innovation systems. Furthermore, in Europe, but at a regional level, the Regional Innovation Scoreboard (RIS), which is used here as an empirical case, covers 238 regions in 23 EU Member States and it is calculated as the unweighted average of the normalized innovation indicators.
However, the application of such composite indices for measuring innovation performance and their utility in directing innovation policy has also been discussed in [1,23,24,25,26,27,28], mainly due to the problems related to the varying statistical and mathematical methods utilised for aggregating the indicators into a composite indicator [29]. Thus, the lack of one-best-way to construct a composite innovation index has led to open a methodological debate on the theoretical framework to develop the final composite index [30,31].
Over the last decades, the use of multi-criteria decision making (MCDM) techniques when constructing composite indicators has also increased notably, as they have been viewed highly suitable in aggregating single indicators into a composite one [11,32,33,34,35]. In [36], a review of MCDM methods to construct composite indicators is shown. As stated by these authors, one group of these techniques are distance functions based methods in which reference levels are defined by the decision maker in order to minimize the distance between an alternative and a point or points enjoying good preferential properties [37]. Within this family, the reference point method [38] was adapted by [39] to develop synthetic sustainability indicators dealing with different compensation degrees between the criteria. Lately, this methodology has been used in a variety of domains such as sustainability, university performance, regional social progress and to measure the ease of doing business [12,40,41,42]. Among the main advantages of this type of MCDM distance based methodologies, we should mention its ease of implementation and ease of use, as the decision maker can establish a desired number of reference levels. These levels are used by the so-called achievement scalarizing function, to bring all the indicators down to a common scale (therefore, the achievement function carries out a distance-based normalization of the original data). Thus, by providing the reference levels of innovation performance, the resulting composite innovation index is an easy-to-interpret measure, as it provides the position of the region with respect to those levels, thus becoming a more informative measure. As a contribution for evaluating regional innovation performance for an European country, in our proposal, the decision maker may choose the following reference levels: (i) European reference levels for benchmarking the position of the regions with respect to the overall European patterns; (ii) National reference levels in order to obtain a regional comparative assessment of innovation performance to set national targets.
In addition, the focus of our study addresses in particular the “big debate” between linear aggregation vs non-linear aggregation when constructing a composite innovation index, since it determines the level of compensability, that is, the possibility that a large improvement with regard to one or more criteria can offset a small worsening with regard to one or more other criteria, or vice versa [43]. According to [44], a compensatory approach implies the use of linear functions such as the arithmetic mean that overlooks unbalances, namely, the disequilibrium among the sub-indicators/dimensions of the composite indicator. Moreover, as stated by [45,46], the use of linear aggregation rules implies ensuring that the preferential independence condition has been met. In contrast, non-compensatory or partial compensatory approaches involves unbalanced-adjusted functions, as for example the geometric mean. Additive aggregation methods of single indicators is by large the most widespread aggregation rule when constructing composite innovation indicators at the micro and macro-level. This implies complete substitutability among the various dimensions of the innovation, and such complete compensability is often not desirable. Looking at the regional innovation patterns in EU regions, given that the Regional Innovation Scoreboard uses additive aggregation methods, a full compensability approach is assumed. We stress at this point that the level of compensability can have strong policy implications when measuring and benchmarking regional innovation performances through composite indicators.

3. Research Design and Methodology for Reference Point Based Regional Innovation Composite Indicator

From the baseline framework of the Regional Innovation Scoreboard (RIS) indicators, we develop a step-wise methodological approach for constructing regional innovation composite indexes using reference levels and distance functions. Let us summarize in this section the Multiple Reference Point based Weak and Strong Composite Indicator (MRP-WSCI) methodology to build composite indicators. This description is a summary of the process described in [12] (where the reader is referred for further details), but we have decided to include it in this paper for completeness.
Let us assume that we are managing a set of J regions, for which I indicators are evaluated. Let us denote by x i j the value of indicator i for region j. The MRP-WSCI process comprises the following steps:

3.1. Parameters: Weights and Reference Levels

It will be assumed that the decision center has assigned weights μ 1 , μ 2 , , μ I to the indicators, which reflect the contribution of each indicator to the final composite measure. In our case, given that the original regional innovation index uses equal weights for all the indicators, we will also do so in order to obtain comparable results.
On the other hand, the MRP-WSCI methodology assumes that the decision center is able to provide a set of n reference levels for every indicator i: q i 1 , q i 2 , , q i n . In general, these levels define performance thresholds for indicator i (e.g., very poor, poor, fair, good, very good,...). Let us denote by q i 0 and q i n + 1 , respectively, the minimum and maximum values that indicator i can take. As a result, we obtain the following ( n + 2 ) -dimensional reference vector for indicator i:
q i = ( q i 0 , q i 1 , , q i n , q i n + 1 ) .
Although these reference levels can be defined in an absolute way by experts, in our case statistical values will be used. To be more precise two options for these levels will be considered.
  • On the one hand, we will adapt the benchmarks used by the RIS (Modest, Moderate, Strong, Leader) at an European level, as described in Section 4.1. This way, we establish the behaviour of the Spanish regions with respect to all the European ones, following these benchmarks.
  • On the other hand, we will use percentiles 25, 50 and 75 across all the Spanish regions. This way, we can see the relative position of each region also with respect to the Spanish regions only. This will let us illustrate the effect of using different reference levels in the MRP-WSCI approach.

3.2. Normalization: The Achievement Scalarizing Function

A set of n + 2 real values α 0 , α 1 , , α n , α n + 1 will be used, which are the same for all the I indicators. In our example, these values are set by default to 0, 1, 2, 3, and 4, and they define a common measurement scale. Therefore, as an example, if percentiles are used as reference levels, α 1 = 1 is the value in the common scale that a given region has if it achieves percentile 25 in indicator i. A so-called achievement scalarizing function is used to turn each indicator i to the scale defined by the values α t ( t = 0 , , n + 1 ). Apart from normalising the indicators, this function also informs about the relative position of each region with respect to the corresponding reference levels. These functions were initially defined in [38] for general reference point procedures, and they were afterwards extended to double reference point (reservation-aspiration) methods, [47], and adapted to the calculation of composite indicators, [12,40,48]. For the case when n reference levels are used (assuming, without loss of generality that the indicator is of the-more-the-better type), the achievement scalarizing function defined in [12] takes the following form:
s i j = s i ( x i j , q i ) = α t 1 + α t α t 1 q i t q i t 1 ( x i j q i t 1 ) , if x i j [ q i t 1 , q i t ] , ( t = 1 , , n + 1 ) .
This way, we are using a piece-wise linear function. If the region achieves, for example, values between percentiles 50 and 75 for indicator i, the corresponding achievement scalarizing function s i of indicator i takes values between α 2 = 2 and α 3 = 3 .

3.3. Full Compensation: The Weak Composite Indicator

The weak composite indicator ( W C I ) allows full compensation among the single indicators by using an additive aggregation. First, the weights μ i are normalized to add up to 1:
μ i w = μ i k = 1 I μ k .
Second, the W C I of a given region j is built in the following way:
W C I j = i = 1 I μ i w s i ( x i j , q i ) .

3.4. No Compensation: The Strong Composite Indicator

The strong composite indicator ( S C I ) does not allow any compensation. In fact, S C I j measures the worst performance of region j. In our case, given that equal weights are used for every indicator, S C I j is just the minimum value of all the achievement functions of region j:
S C I j = min i = 1 , , I { s i ( x i j , q i ) } .
If there are different weights assessed to the indicators and the decision makers wish to take into account the relative importance of each indicator in the strong measure, an alternative way of building S C I j can be found in [12].

3.5. Successive Aggregations

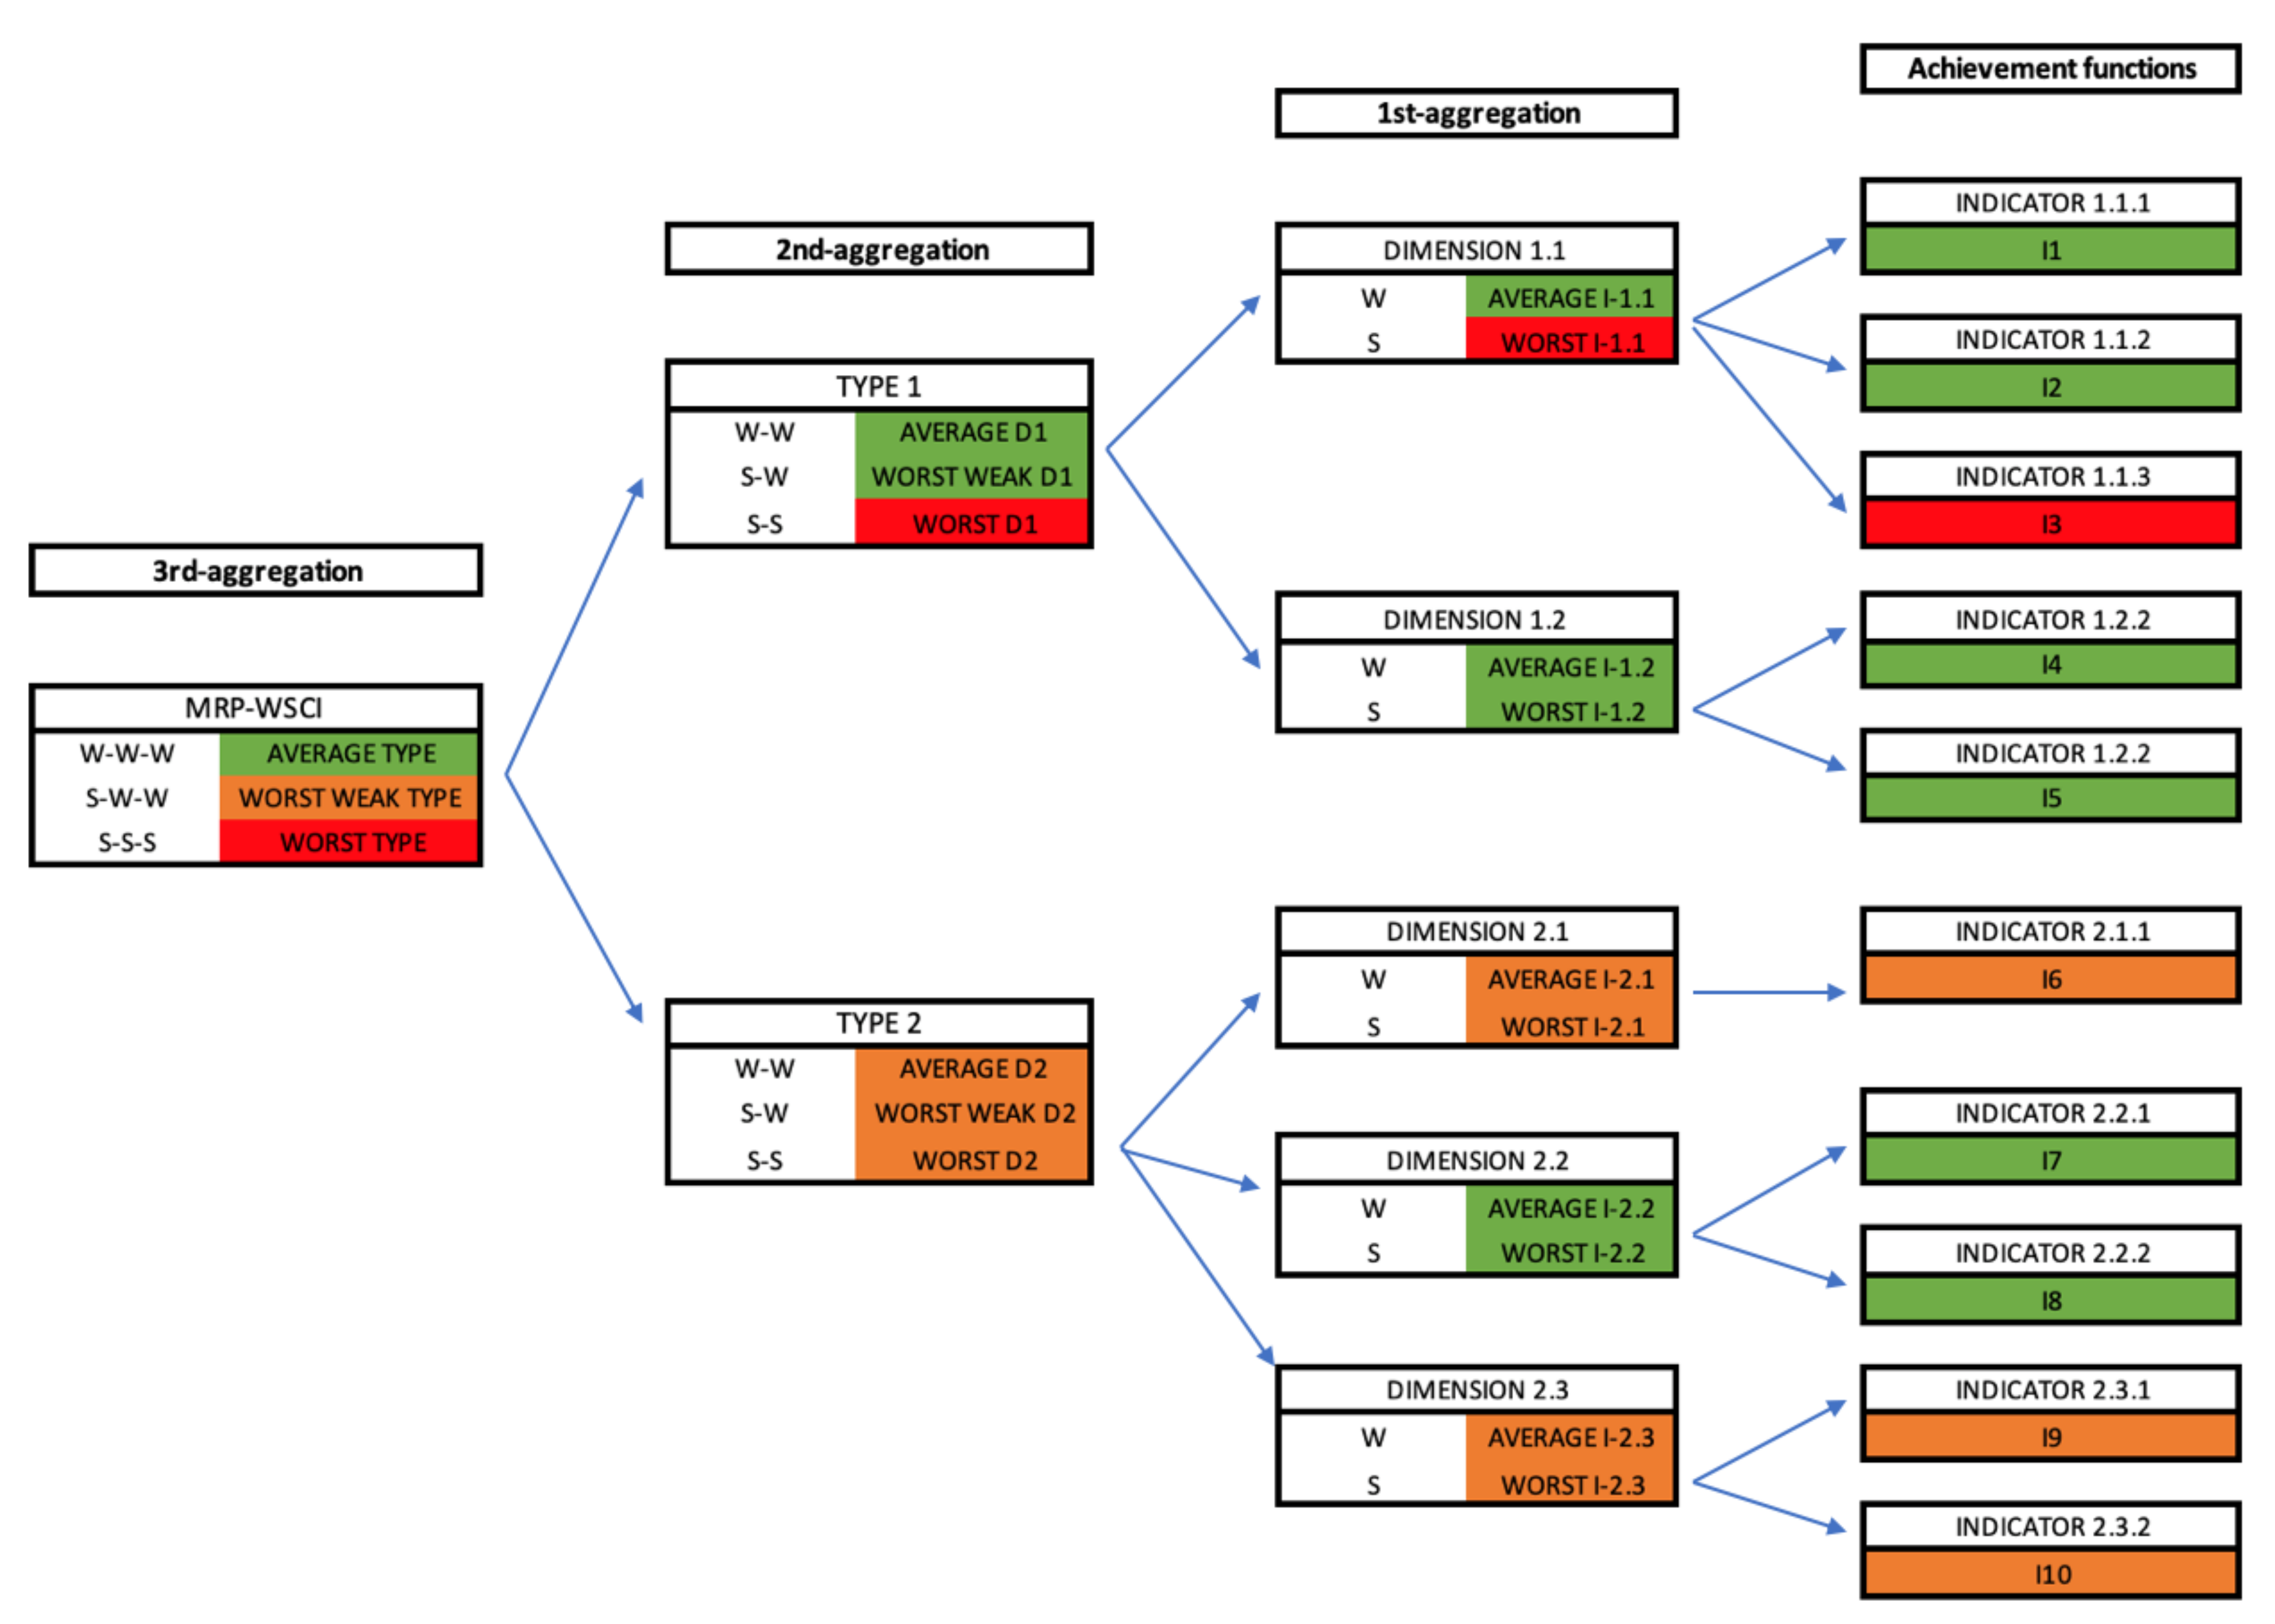
As is often the case in most composite indicators, the RIS framework is based on a system of indicators which is structured in several levels. In this case, the 17 indicators are grouped into 9 innovation dimensions, which are afterwards grouped into 4 types, and finally the composite innovation indicator is obtained. Therefore, we need to carry out a three-stages aggregation process as shown in Figure 1.
  • First Aggregation. We obtain for each region the W C I j and S C I j of each innovation dimension. If the region is understood from the context, they will be simply denoted as W and S and they measure:
    -
    W: the average (compensatory) measure of the dimension;
    -
    S: the worst indicator of the dimension.
  • Second Aggregation. Given the way W and S have been constructed, these composite indicators take values in the same scale, 0-1-2-3-4, as the original achievement scalarizing functions, and therefore, they can be used as achievement function in the following aggregations. Thus, in the second aggregation, one of these composite indicators is used as achievement functions to build the composite indicators of each type.
    If the weak composite indicators are used as achievement functions, we get two composite indicators for each type:
    -
    W-W, the weak-weak composite indicator, measures the average (compensatory) performance of the type;
    -
    S-W, the strong-weak composite indicator, points out the worst dimension of the type.
    Alternatively, the strong composite indicators of each innovation dimension can be used as achievement functions in the second stage. In this case, it is interesting to consider:
    -
    S-S, the strong-strong indicator, which points out the worst single indicator of each type.
  • Third Aggregation. Finally, the same considerations can be made for the last aggregation stage, where we obtain global composite indicators for each region. In this case, we will consider:
    -
    W-W-W, which gives an overall compensatory measure of each region;
    -
    S-W-W, which points out the worst type of each region;
    -
    S-S-S, which indicates the worst single indicator of each region.
Therefore, the methodology provides a set of composite indicators which allow decision makers to find out possible improvement areas, in an easy way.

3.6. A New Visualization Tool: The Light-Diagram

The development of visualization tools is one of the ten steps proposed by [49] for the construction of composite indicators, since the way in which the composite indicators can be visualized or presented can influence their interpretation. The Regional Innovation Scoreboard (RIS) assessment is displayed through an interactive dashboard, with tables and maps to provide a visual representation of regions’ performance by indicator and year (https://interactivetool.eu/RIS/index.html). The RIS interactive tool is intended to provide an overview of the region’s innovation performance from the Regional Innovation Index (RII), which is calculated as the unweighted average of the normalised scores of the 17 indicators. While this is an effective way to communicate the overarching regional innovation performance to non-experts, the MRP-WSCI approach can enrich this analysis with the information derived from the weak and strong composite indicators.
To reinforce the usefulness of the MRP-WSCI approach, we have developed a new visualization tool that we call Light-Diagram. The aim of this tool is to have all the information regarding each region available at a glance. It is possible to see the values of the achievement functions and those of every composite indicator. At the same time, the colors used allow us to easily identify the performance interval of each element. It adds value and feeds into a broader monitoring exercise the information provided by the MRP-WSCI composite indicators at different levels of the aggregation. The ultimate goal of this diagram is to provide a firmer foundation for innovation policy-making and to help ensure that the money devoted to innovation activities in the region delivers maximum returns. When applying the MRP-WSCI, after defining the reference levels and using the achievement function s i defined in Equation (2), we can identify, at the three stages of the aggregation, different innovation performance levels (like, e.g., high, medium or low), using colors (like green, orange and red). Let us see an example of a simulated Light-Diagram for a composite index with a hierarchy of two types, five dimensions and ten indicators.
As Figure 2 shows, for the region considered it can be easily detected that the third indicator I 3 (colored in red) is the responsible for the low innovation performance in the first dimension at the first aggregation stage. In the second aggregation, the worst value of the dimension 1.1 is also the responsible of the bad performance of the S-S composite indicator in the first type. In the last aggregation stage, we obtain the S-S-S composite index also colored in red. The Light-Diagram tool is not only a matter of knowing the weaknesses of regional innovation performance but it also highlights its strengths in green.

4. Benchmarking Spanish Regional Innovation Performance According to European Reference Levels

In this section, an application of the Multiple Reference Point based Weak and Strong Composite Indicator (MRP-WSCI) methodology to a set of indicators included in the Regional Innovation Scoreboard (RIS) framework for Spanish regions in 2019 is presented, using European reference levels. The RIS covers 238 regions in 23 EU Member States and is the regional extension of the European Innovation Scoreboard.
In the RIS, the regional innovation performance is measured using the Regional Innovation Index (RII) composite indicator, which summarises the region innovative performance based on 17 indicators. These indicators are grouped into four main types: Framework conditions, Investments, Innovation activities, and Impacts. These four types are in turn sub-divided into 9 innovation dimensions (see Table A1 in Appendix A).
After, normalizing the data, the Regional Innovation Index (RII) is calculated as the unweighted average of the normalised scores of the 17 indicators. The choice of European reference levels is supported by the need to benchmark the positions of the regions with respect to the overall European innovation patterns.
For Spain, we use the RIS 2019 database for 17 regions: Galicia (ES11), Principado de Asturias (ES12), Cantabria (ES13), País Vasco (ES21), Comunidad Foral de Navarra (ES22), La Rioja (ES23), Aragón (ES24), Comunidad de Madrid (ES30), Castilla y León (ES41) Castilla-la Mancha (ES42), Extremadura (ES43) Cataluña (ES51), Comunidad Valenciana (ES52), Illes Balears (ES53), Andalucía (ES61), Región de Murcia (ES62) and Canarias (ES70). In our analysis we do not consider Ciudad Autónoma de Ceuta (ES63) and Ciudad Autónoma de Melilla (ES64), as data is not available for most of the indicators.

4.1. Defining EU Relative Reference Levels

As a first step towards the construction of the composite indicator, the reference levels for each indicator are defined according to classification scheme used in the RIS framework in which regions are classified in four innovation performance groups:
  • Regions performing between the minimum value of the indicator, q 0 ( M i n ) , and 50% of the EU average, q 1 ( 50 ) , are regarded as Modest Innovators ( M * ).
  • Regions performing between q 1 ( 50 ) and 90% of the EU average, q 2 ( 90 ) , are regarded as Moderate Innovators ( M * ).
  • Regions performing between q 2 ( 90 ) and 120% of the EU average, q 3 ( 120 ) , are regarded as Strong Innovators (S).
  • Regions performing between q 3 ( 120 ) and the maximum value of the indicator, q 4 ( M a x ) , are regarded as Leaders (L).
In Table 1 we display in each cell the values corresponding to the relative reference levels for year 2019. It must be noticed that, while the RII uses these benchmarks at the global level, that is, once the composite measure is built, we use them at indicators level. This way, we can monitor the performance of the region with respect to the levels at each aggregation step.

4.2. Profiling Regional Innovation Performances: Results and Visualization Tools

In order to get the rankings of the Spanish regions with respect to the European reference levels, we computed the W-W-W (overall compensatory average), S-W-W (worst type) and S-S-S (worst indicator) composite indicators for 2019. Table 2 displays both the values and the region rankings of the RII and the MRP-WSCI indicators. Looking at the MRP-WSCI, the same rank is reached for the top regions, (ES21) País Vasco, (ES51) Cataluña, (ES22) Comunidad Foral de Navarra and (ES30) Comunidad de Madrid according to the RII and for the W-W-W composite index.
Anyway, some changes of rankings can be observed, which are due to the normalization based on reference levels and the existence of several aggregation steps in the MRP-WSCI methodology. Let us see, for example, the cases of (ES52) Comunidad Valenciana, ranked 5 in the RIS and 7 in the W-W-W, and (ES24) Aragón, ranked 7 in the RIS and 5 in the W-W-W.
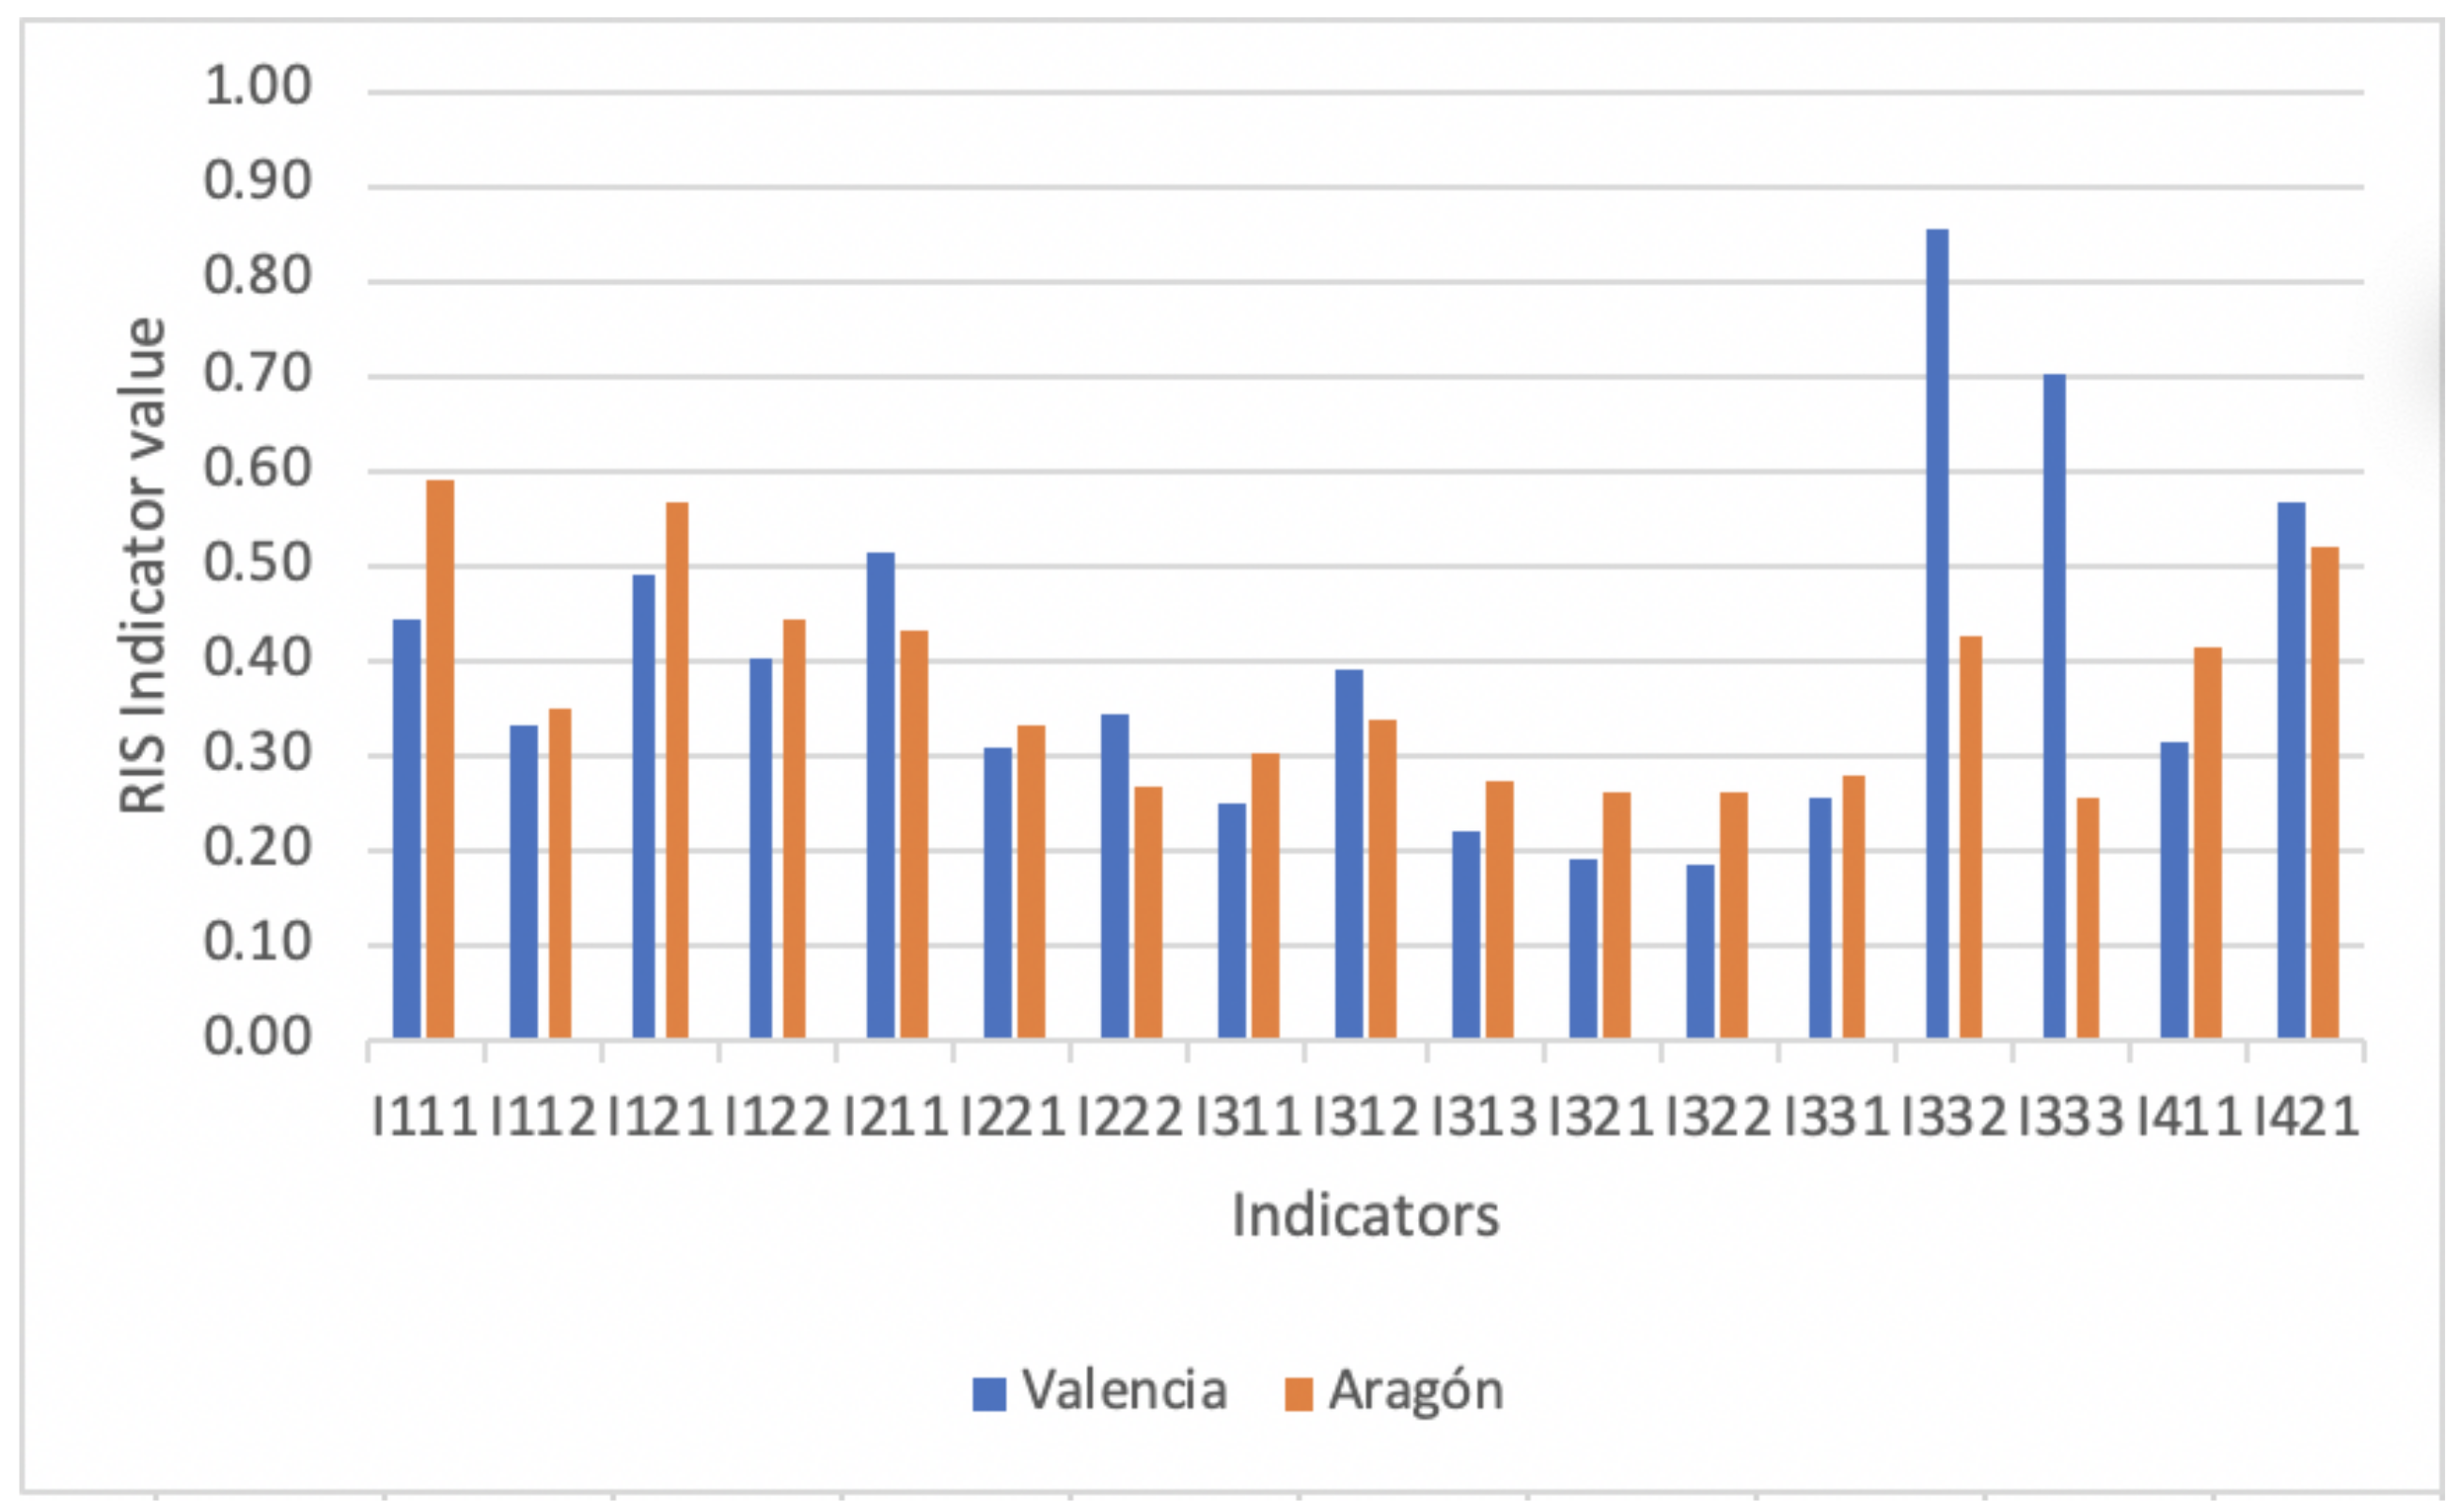
In Figure 3, we can see that the differences in the values of the RIS indicators (denoted as specified in Table A1) are higher in favour of Comunidad Valenciana, which is, therefore, better ranked. But in Figure 4 (left), we can see two effects.
First, due to the reference levels used, the differences in the achievement functions are not so high. For example, in the indicator Trademark Applications ( I 332 ), although the difference of absolute values is high in favour of Comunidad Valenciana, the value of Aragón is very close to the Leader threshold (see Table 1), and therefore, the corresponding value of the achievement function is very close to 3. Second, the process consisting of several aggregations gives actually the same weight to each of the types (and to each of the dimensions), unlike the RIS scheme, which implicitly places a higher weight on the types containing more single indicators. As can be seen in Figure 4 (centre and right), this finally causes Aragón to get a better W-W-W value.
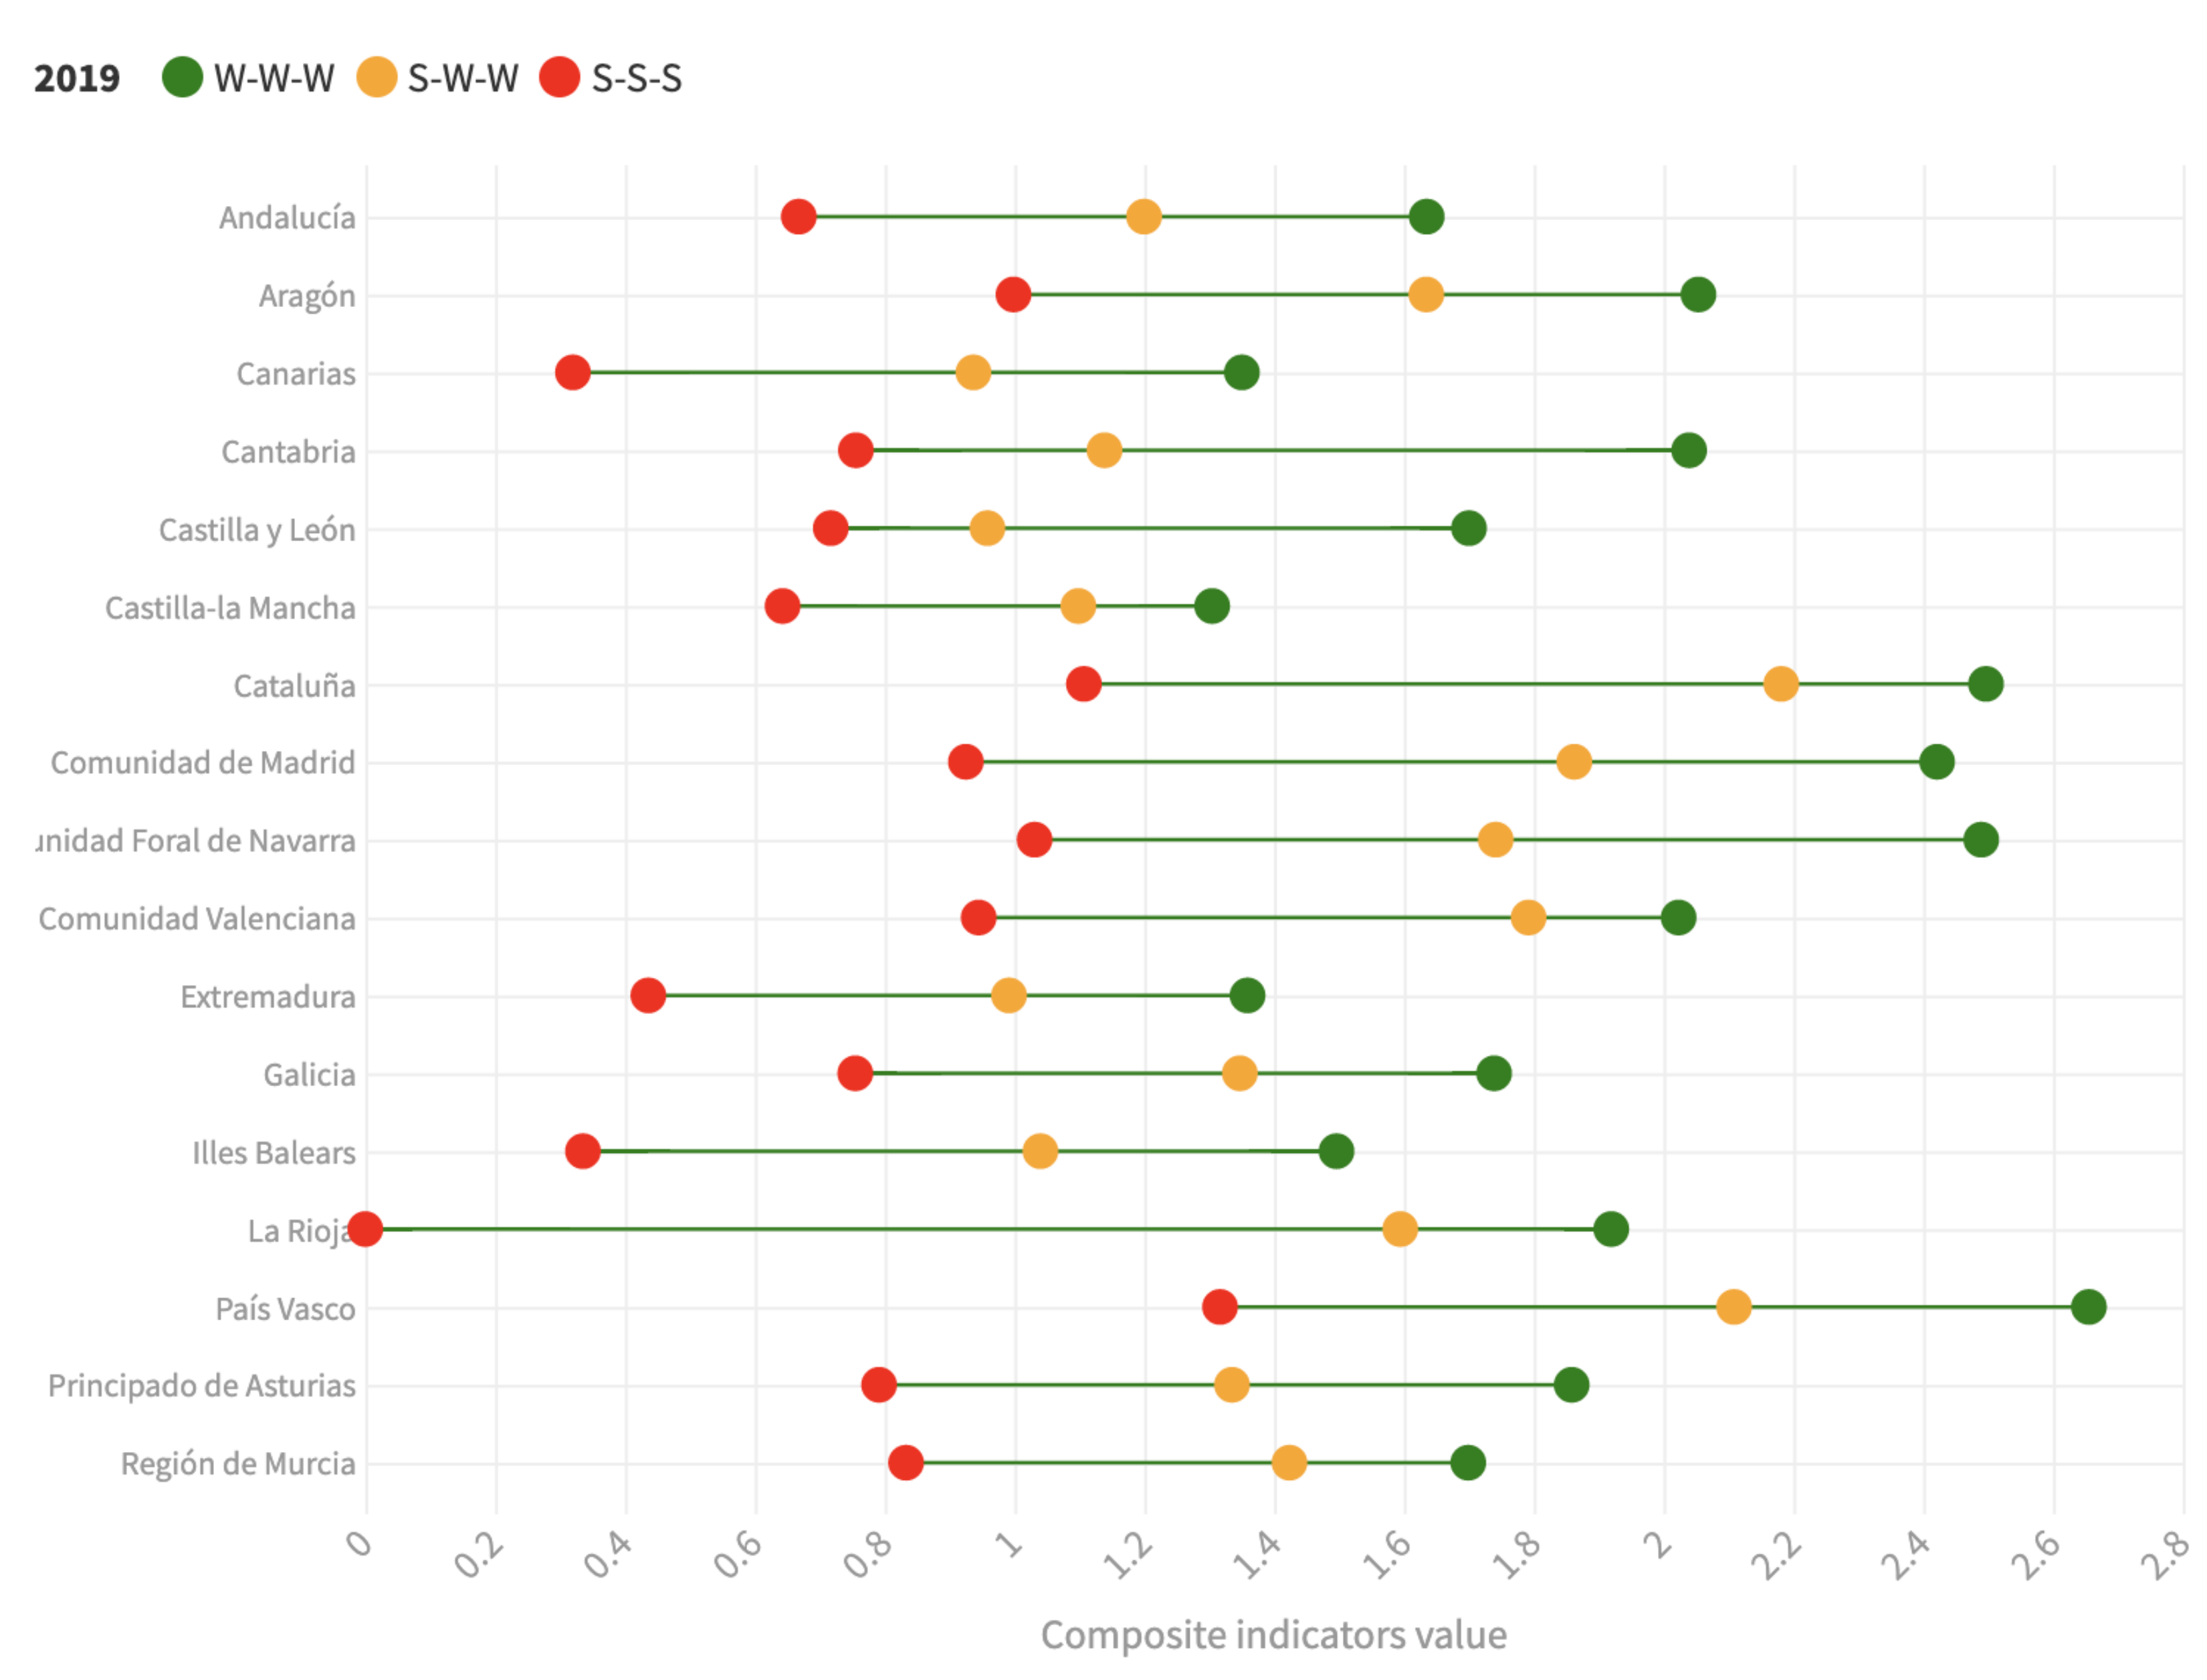
Besides, depending on the level of compensability, some regions present different positions in the ranking, as shown in Figure 5. It can be seen that, for all regions, the weak composite indicator W-W-W colored in green gets the highest score, the S-W-W indicator colored in yellow under performs the previous one, and finally the strong perspective given by the S-S-S index colored in red takes the smallest values.
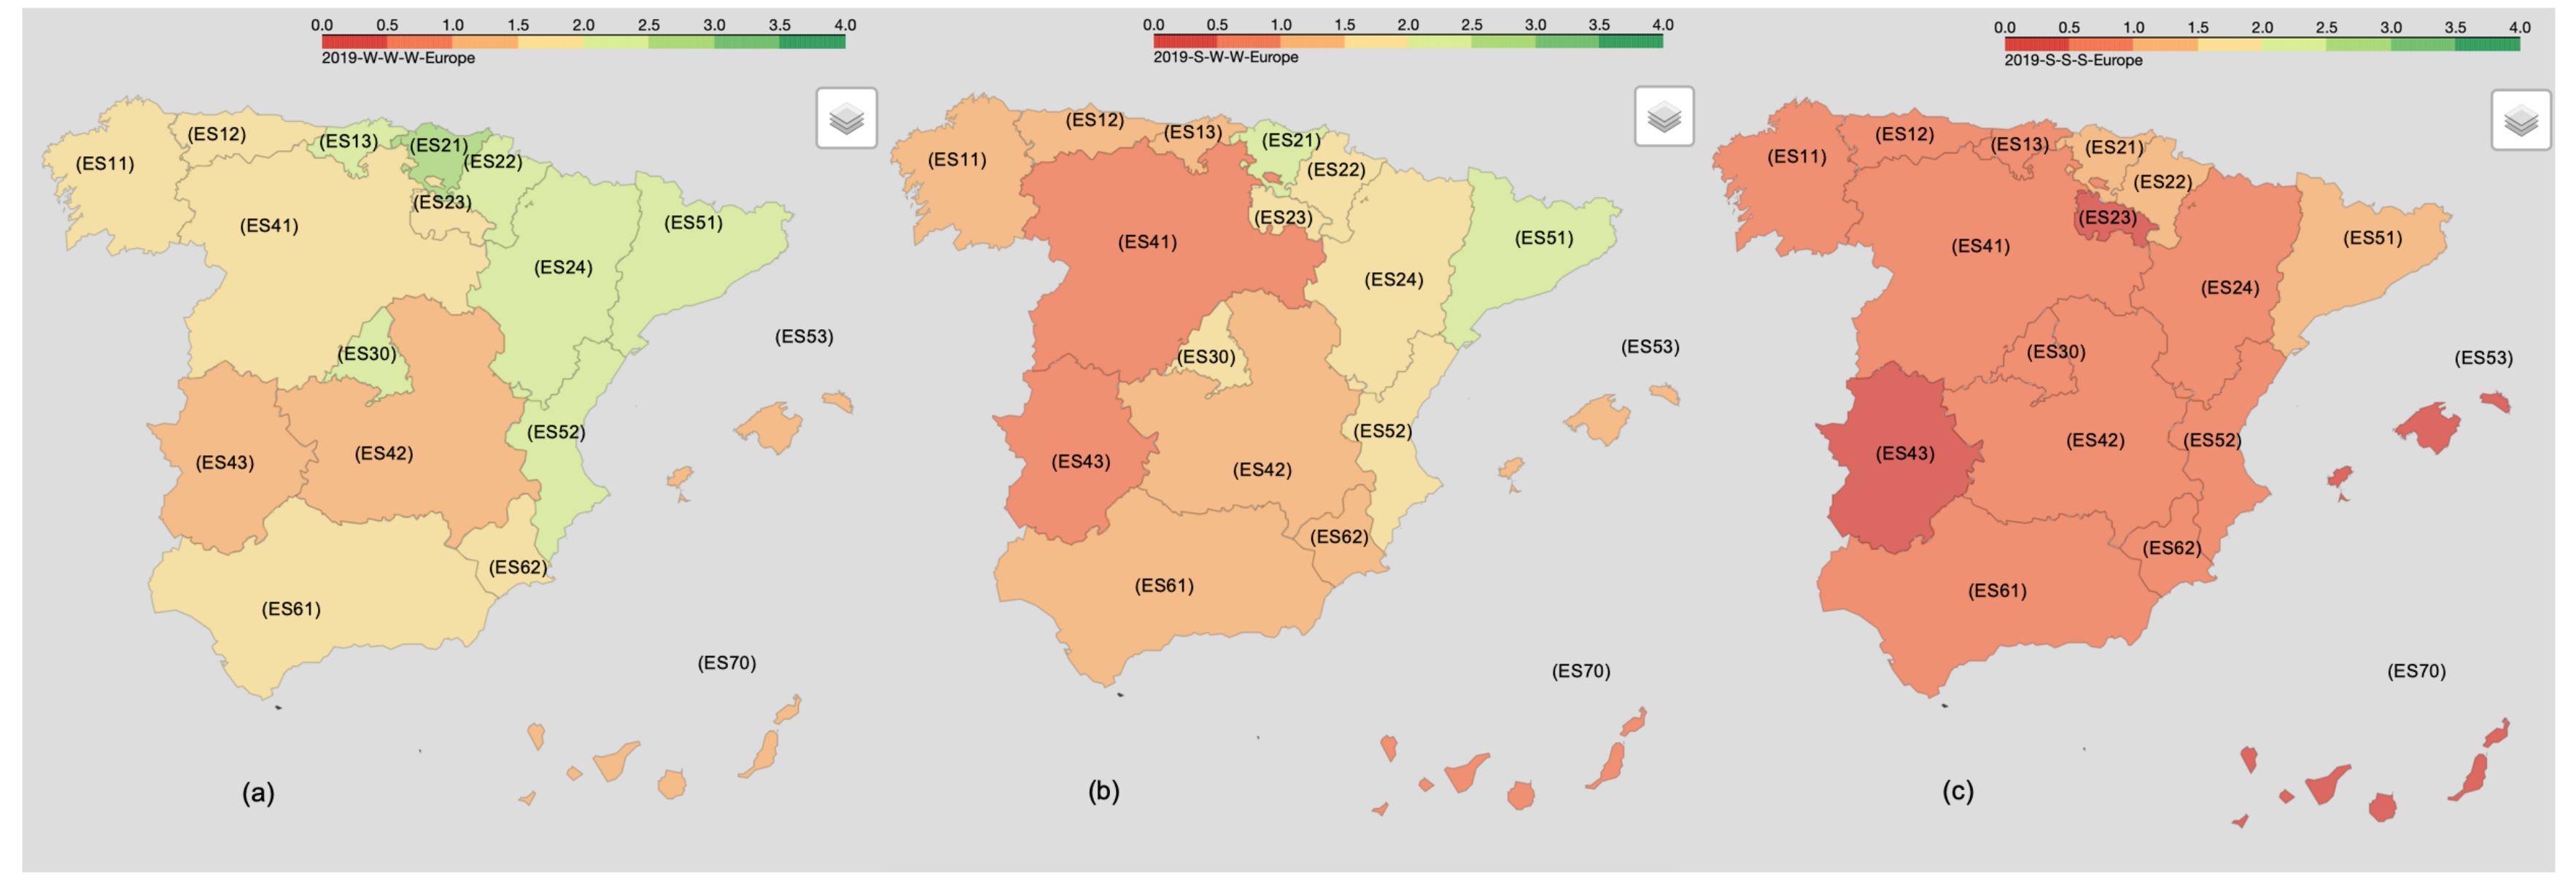
Bringing a new perspective to the analysis, in Figure 6 we provide through maps the regional innovation performance assessment for the three levels of compensability. Besides, the use of maps can make the analysis more visually appealing and it can highlight those regions where policy makers should pay attention, as the S-S-S perspective provides information that can be used to define improvement actions. To perform the maps, the EU reference levels previously stated were used to classify the regions by using two color scales per reference level. Looking at these maps from left to right, one can observe how, as the level of compensability decreases, the innovation performance, logically, gets worse.
As noted, the worst performing regions from the S-S-S approach are (ES23) La Rioja, (ES70) Canarias, (ES53) Illes Balears and (ES43) Extremadura. It is worth pointing out the case of (ES23) La Rioja, ranked six by the RII indicator, eight and seven by the W-W-W and S-W-W indexes, respectively, while it achieves the worst position from a strong perspective (S-S-S) index. In situations such as this, with a wide range among the composite indicators, further analysis is required through a strong multidimensional approach.
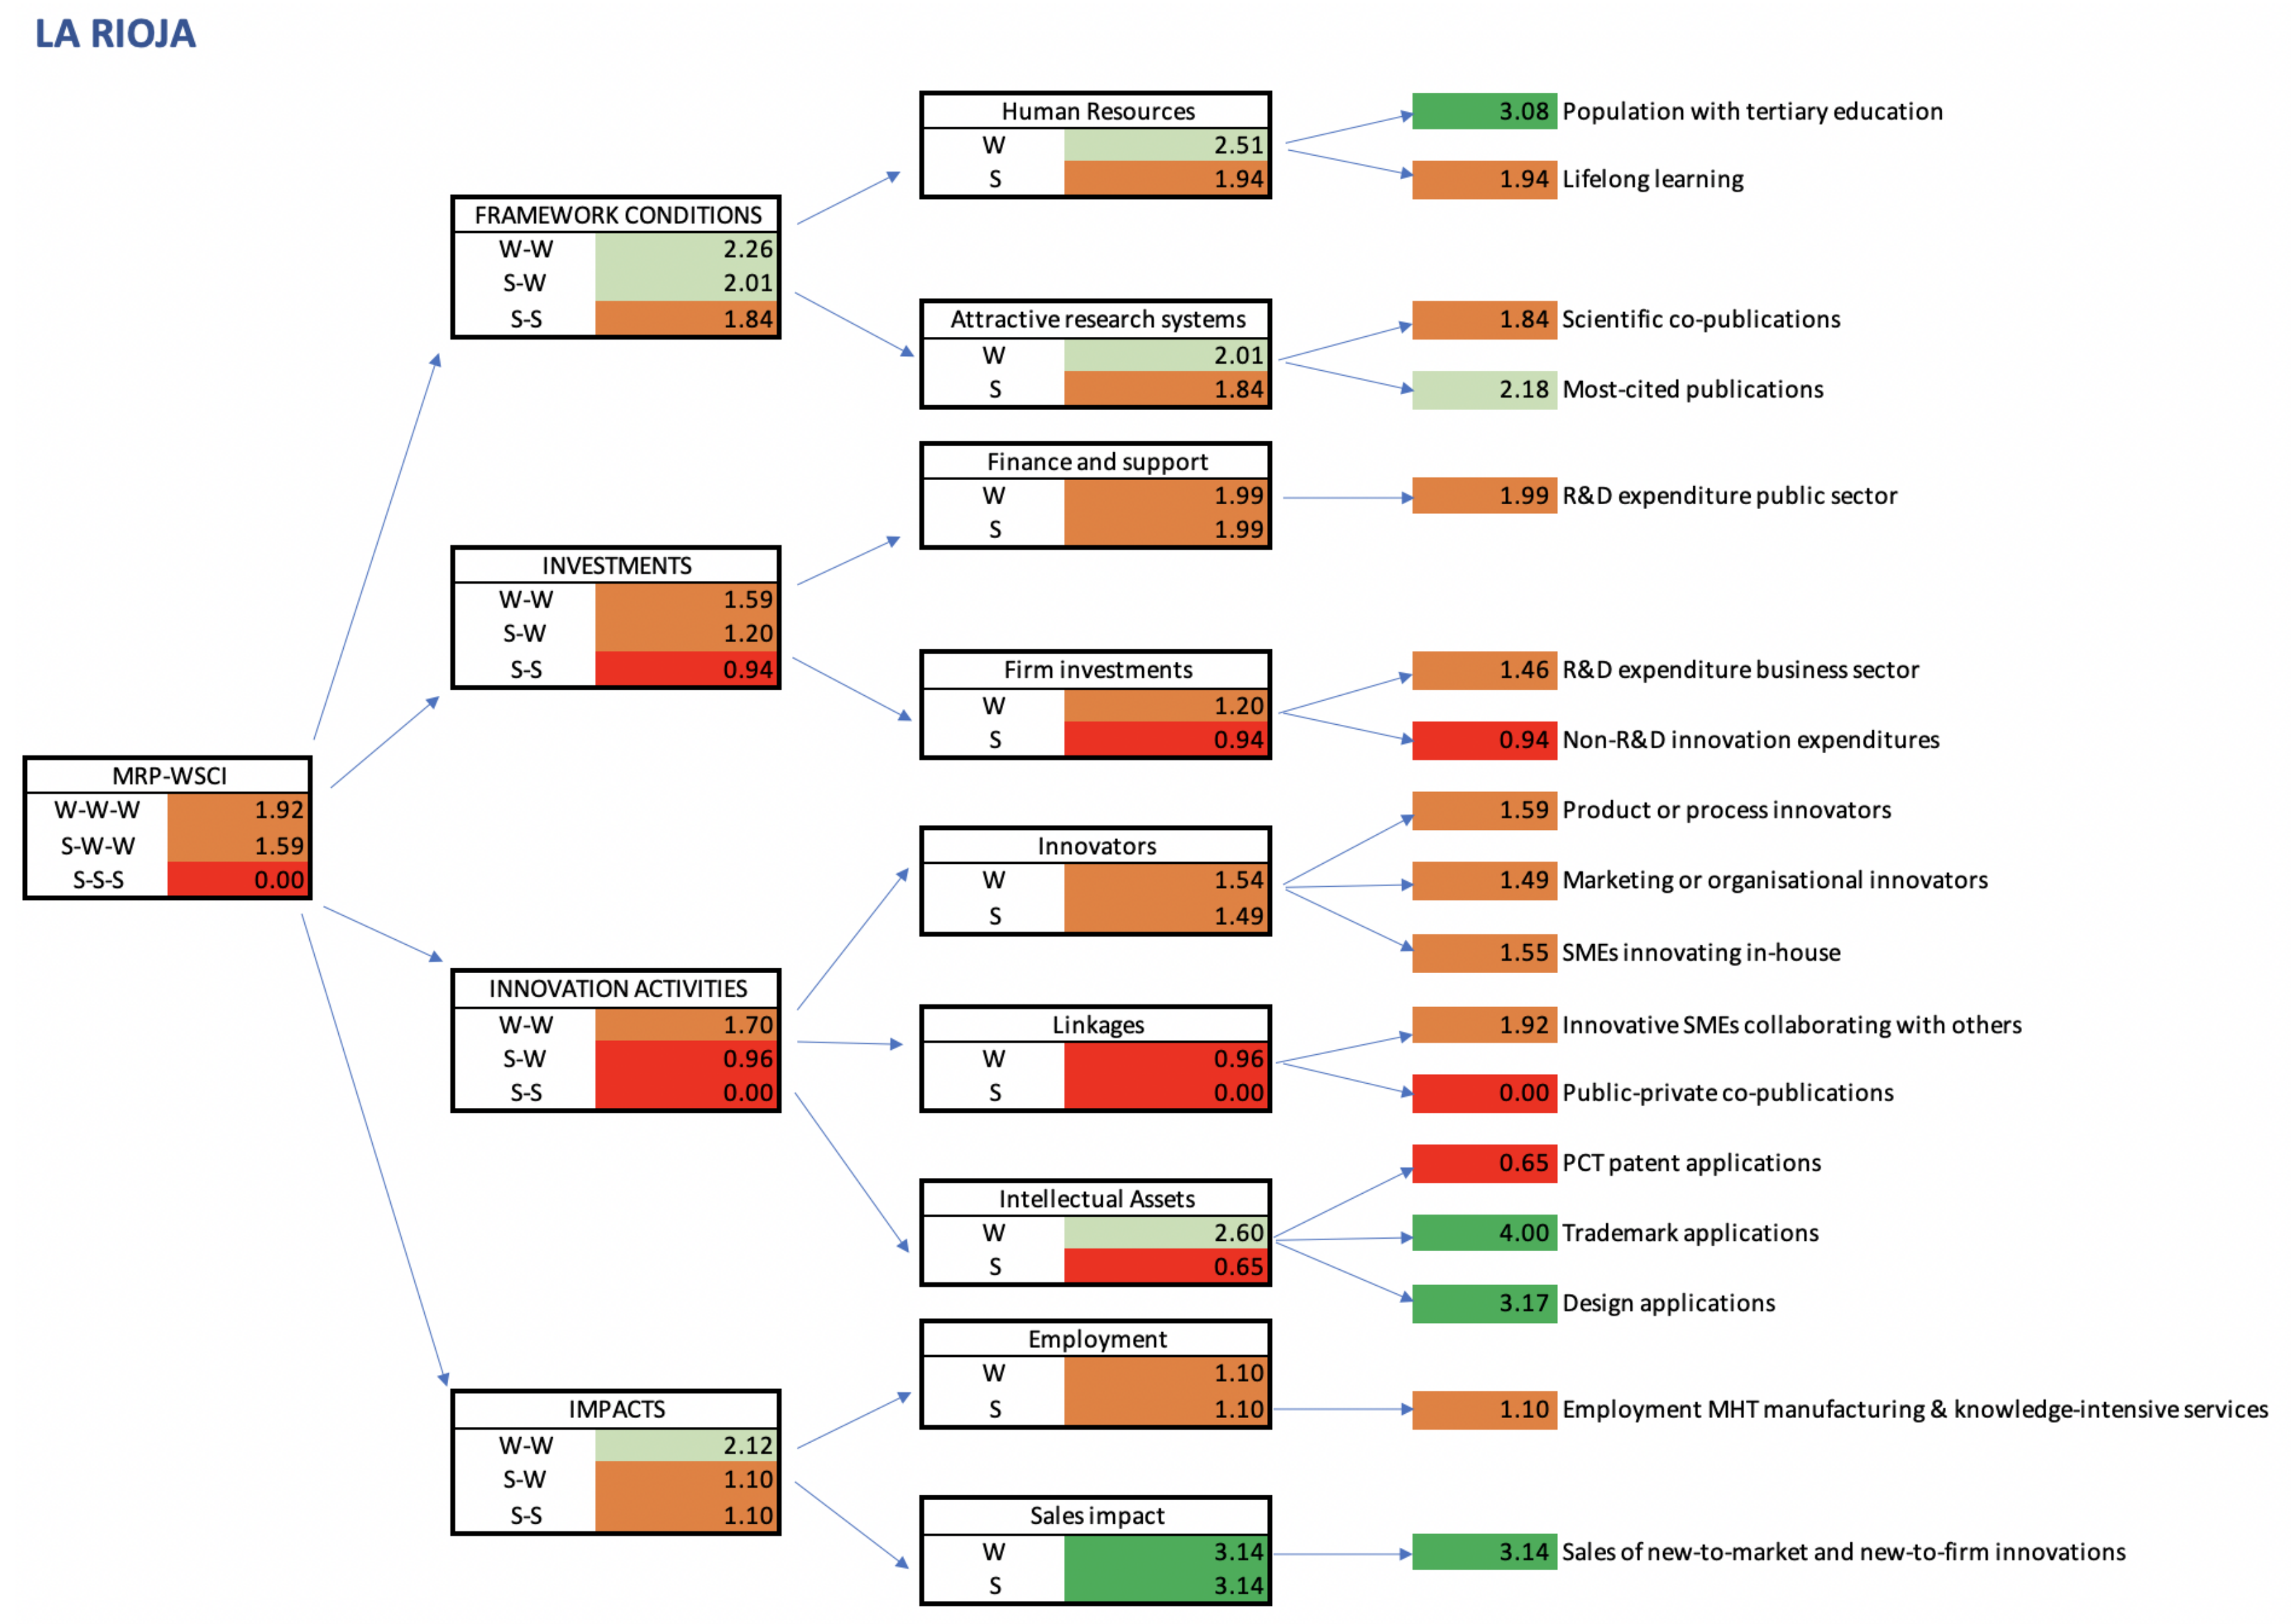
We also have developed a new visualization tool that we call Light-Diagram to provide warning signals that flag those innovation areas requiring policy intervention and at the same time to highlight the region’s strengths. Let us see, for example, the case of La Rioja (ES23) as shown in Figure 7.
This Light-Diagram allows us to track the specific strengths and weaknesses of La Rioja (ES23) region. First, the warning signals of the region are colored in red at all levels of the aggregation. In the last aggregation, when applying the MRP-WSCI methodology, the value of the S-S-S indicator is zero and is the responsible for the last position in the ranking. We can see that this low value of the S-S-S composite innovation index is due to the Innovation Activities ( I 3 ) type where the S-S value is zero. In turn, this value comes from Public and private co-publications ( I 322 ) which takes the worst position in the Linkages ( I 32 ) dimension, due to the zero value of the achievement function. This means that (ES23) La Rioja gets the worst value across all European regions in this indicator.
At the same time, it is possible to identify those criteria in which the region has strengths by looking at the green color. For (ES23) La Rioja, it is remarkable the good performance of the Sales impact ( I 42 ) dimension, as well as in the Human Resources ( I 11 ), the Population with tertiary education ( I 111 ) indicator, both performing in the corresponding Leader interval. Furthermore, the high performances in Trademark applications ( I 332 ) (the best value among all European regions) and in Design applications ( I 33 ) (at the Leader interval) is clearly compensated by the bad score in PCT patent applications ( I 331 ) (at the Modest Innovator interval). Finally, it is remarkable the moderate innovation performance of the region given by the overall W-W-W composite index and S-W-W index coming from the Investment ( I 2 ) dimension, which are colored in orange.

5. Setting National Reference Levels: A Country-Level Analysis

A country-based analysis by using national reference levels may be appropriate to benchmark the regions innovation performance when the innovation policies are defined by local or national institutions. In this case, we use percentiles 25, 50 and 75 (therefore, n = 3 ), to see the relative position of each region with respect to the Spanish regions only (see Table 3).
In Table 4, the scores and rankings for Spanish regions have been calculated by applying the MRP-WSCI approach. The regions (ES21) País Vasco, (ES22) Comunidad Foral de Navarra, and (ES51) Cataluña, are placed in first, second and third position, respectively, in the ranking. At the bottom are (ES53) Illes Balears, (ES70) Canarias, and (ES42) Castilla la Mancha.
Depending on the compensation level considered, weak or strong, the regions get different positions in the ranking as shown in Figure 8. We also depict with maps how the type of aggregation transforms the regional innovation pattern of Spain (see Figure 9). Whereas, seven regions are colored in green when a weak perspective prevails, only the (ES21) País Vasco is able to maintain a top position under the strong approach in which the red color prevails in a large number of regions.
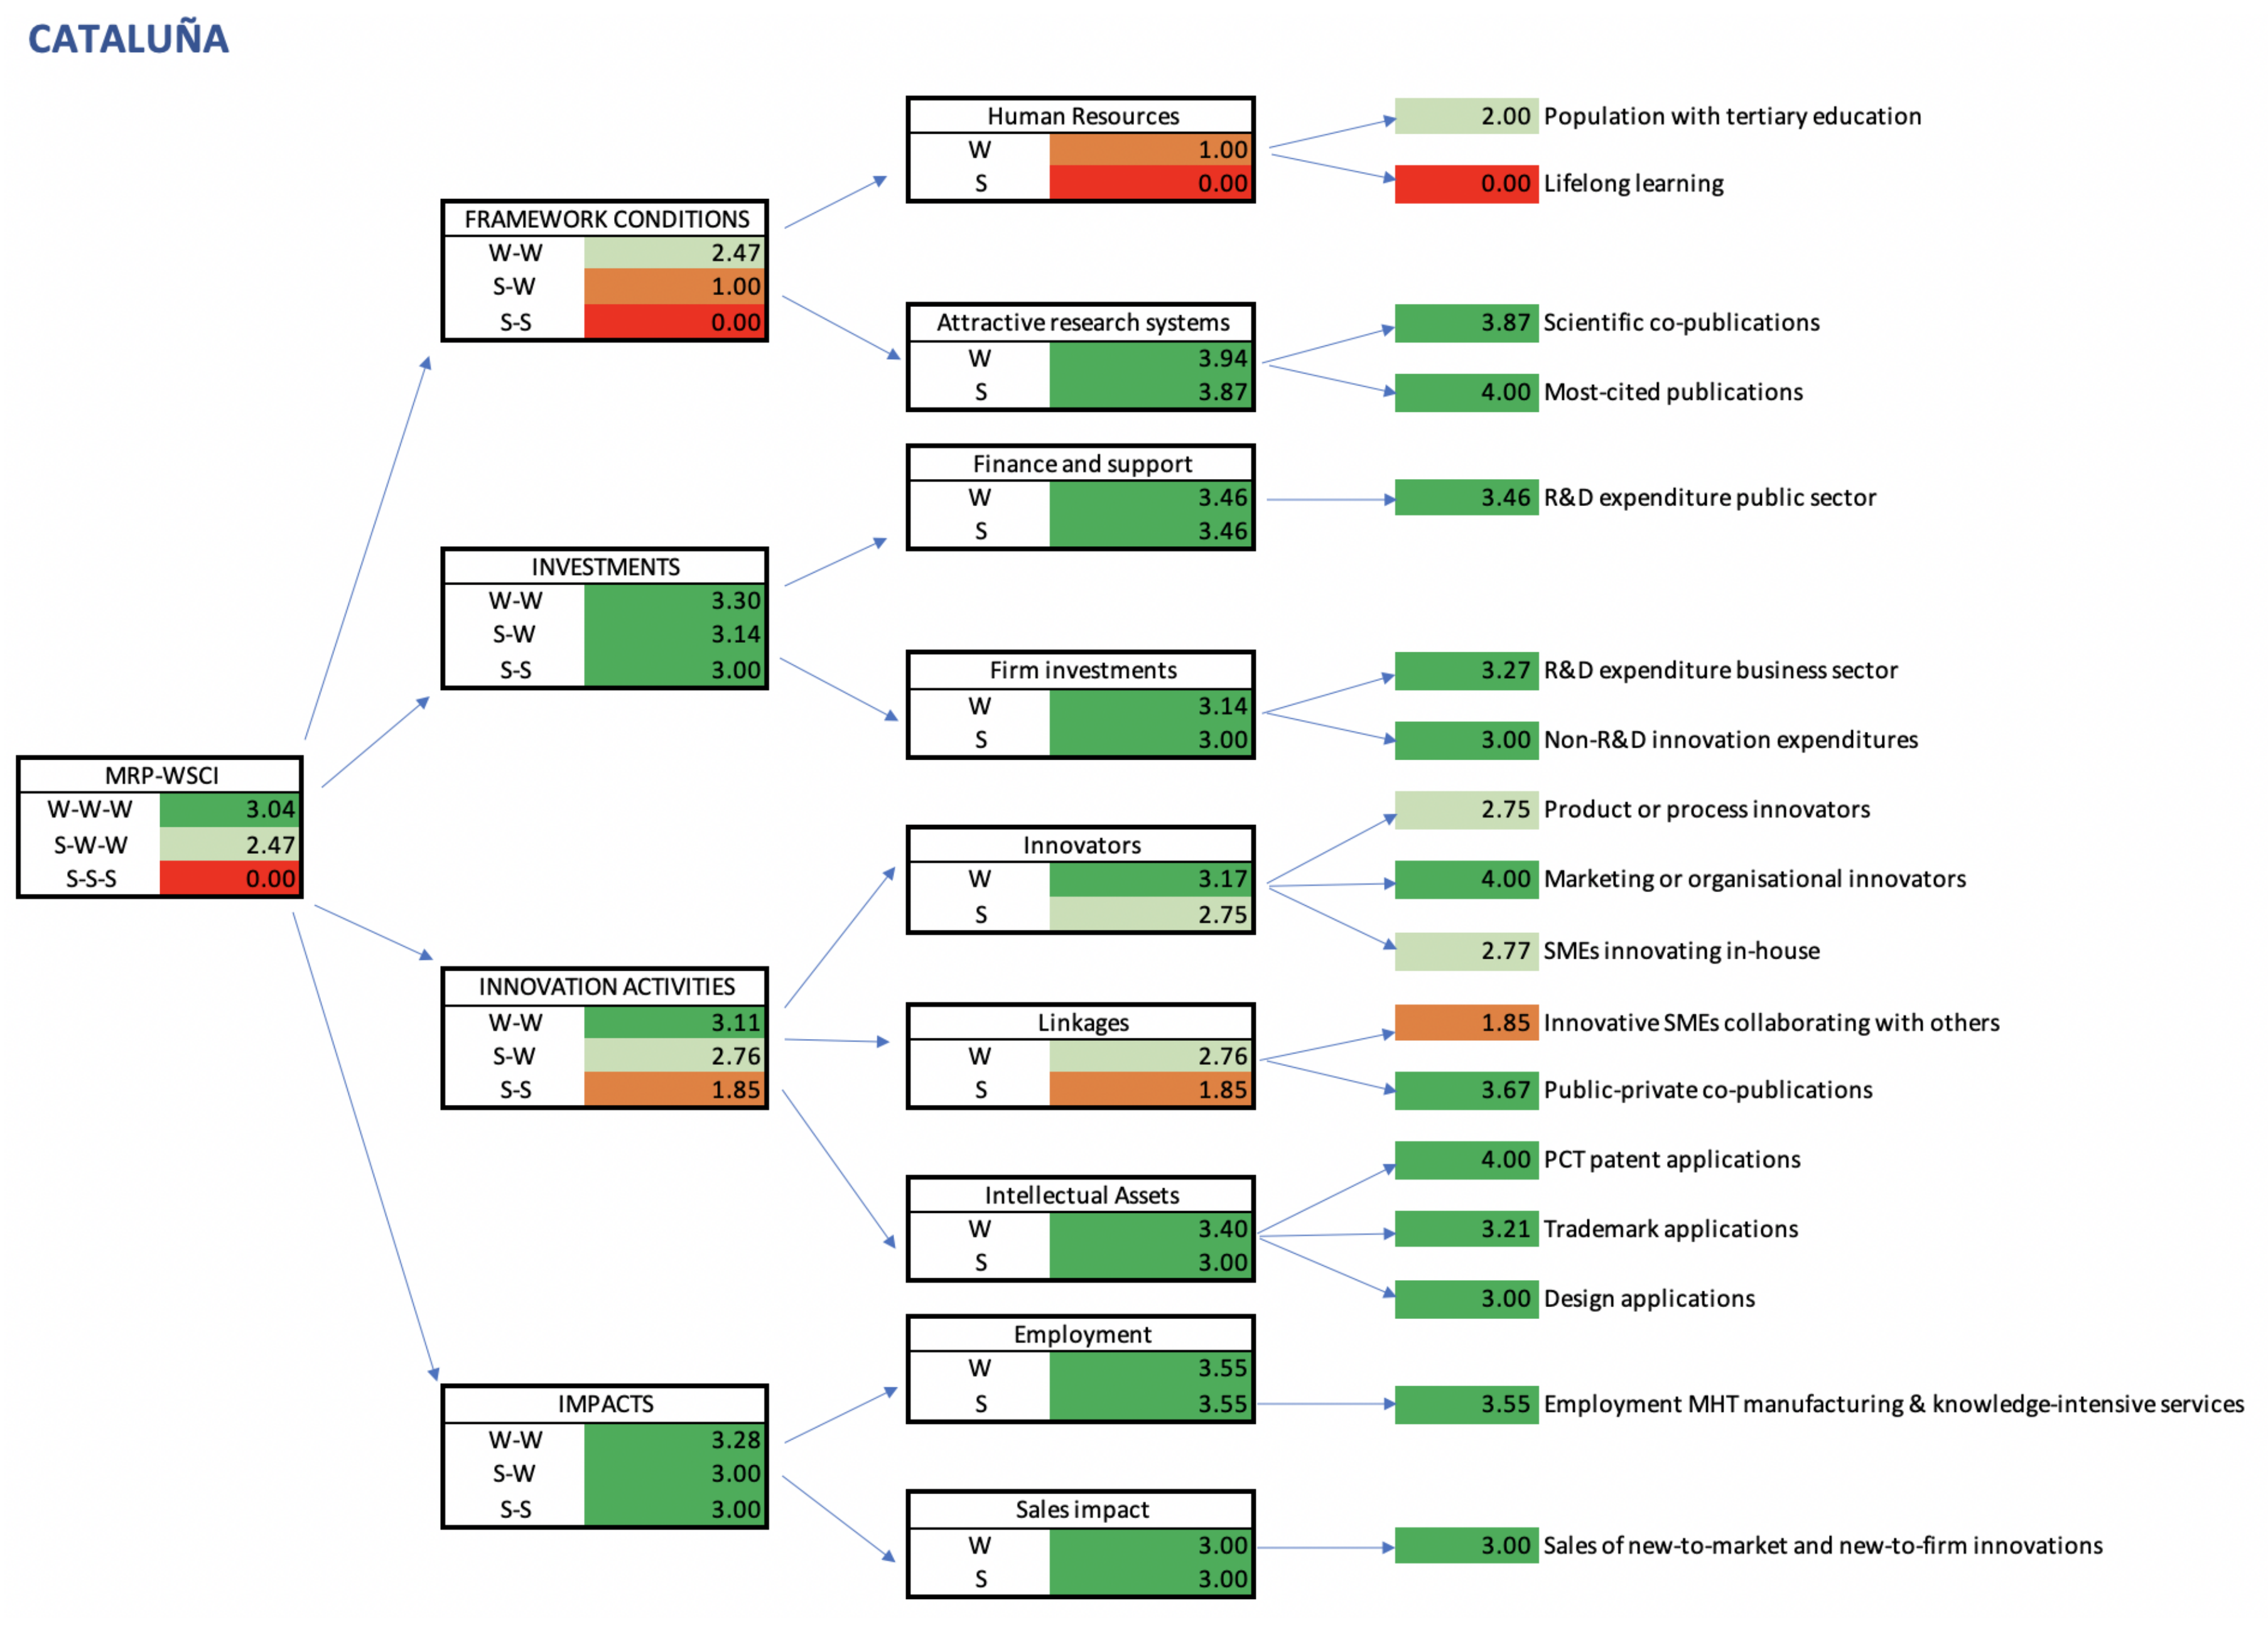
A deeper understanding of the main indicators that have contributed to a bad or good region’s innovation performance should be undertaken through the ”Light-Diagram“ tool. In this context, we pay special attention to the (ES51) Cataluña region, which presents a great variability depending on the weak or strong perspective. The picture provided in Figure 10 enables policy makers to track and target the performance of the Framework Conditions ( I 1 ) type, mainly in the Human Resources ( I 11 )dimension and, in particular, to enhance the Lifelong learning ( I 112 ) indicator, which takes the worst value among all the Spanish regions.
As expected, when using European reference levels, the regions get similar positions in relation to the RII ranking. In contrast, if the reference levels are taken at national level we appreciate more differences. As an example, let us consider the cases of (ES51) Cataluña and (ES22) Comunidad Foral de Navarra, which interchange their positions in the rankings when Spanish levels are used. As can be seen in Figure 11, when Spanish levels are used, (ES51) Cataluña gets worse values in the first two indicators, just at the Strong Innovator threshold for Population with tertiary education ( I 111 ) and, particularly, the worst value among all the Spanish regions for Lifelong Learning ( I 112 ), as mentioned before (see Table 3). This is because, in general, the Spanish regions perform better than many other European regions in these two indicators.
Finally, we can conclude that the value of the scoreboard depends on the benchmark performance, and it is influenced by the choice of the reference levels. The variability of each region’s ranking from the weak composite indicator with respect the RII is shown in Table 5.

6. Conclusions

In this paper, we have proposed an alternative methodology to assess regional innovation performance, by building composite indicators from a multi-criteria decision making perspective. More precisely, making use of a predefined set of single indicators, we have built several composite measures by applying a reference point based scheme. This allows us to establish reference levels on the different indicators (which determine certain performance intervals), and to easily interpret the results in terms of the position of each region with respect to these levels.
Innovation is an increasingly important feature, given that it is regarded as one of the key factors behind growth. Nevertheless, assessing innovation is far from being trivial, given that it is a complex concept which comprises activities of a different nature, and which can be examined from different angles. Nowadays information society makes it easier for researchers to get access to data reflecting all these different activities and angles. Nevertheless, at the same time, this great amount of information calls for the use of composite measures to obtain manageable and easy-to-interpret assessment indexes. The Regional Innovation Scoreboard (RIS) provides data, for all the European regions, about 17 innovation single indicators, which are grouped into nine innovation dimensions, which are in turn classified into four innovation types. Making use of these data, they build a composite innovation index for each region (known as the Regional Innovation Index, RII), using a direct simple additive aggregation of the 17 single indicators with equal weights. After building these composite indicators, they classify the regions into four performance groups (modest innovators, moderate innovators, strong innovators and leaders), taking into account the relative position of each region with respect to the rest. Instead, we propose the use of the Multiple Reference Point Weak and Strong Composite Indicator methodology (MRP-WSCI), to build these composite measures making use of the same source data. As an example, we have shown the results obtained for the Spanish regions.
To the best of our knowledge, it is the first time that a reference point based methodology is used to assess innovation performance, and our research has allowed us to give answers to the two research questions we stated at the beginning of this paper:
  • How can decision makers provide preferential information making use of reference levels, depending upon the scope and aim of the composite innovation index?
  • How does the compensability of single indicators affect the overall ranking of regions when evaluating their innovation performance?
Regarding the first question, the results have shown that the use of reference levels on the single indicators allow decision makers to define performance intervals from the beginning. Given that the methodology allows to carry out several aggregation steps, it is possible to monitor the position of each region at indicator, dimension, type and global levels, and not only at global level, as it happens with the RII. Besides, the graphical visualization tool proposed makes it possible to get all this information for a given region at a glance. As an example, we have used the same relative criteria used by the RIS to define the performance intervals, but at the indicator level. In our opinion, this provides a much richer information throughout the process and besides, the results obtained at each step are easier to interpret. Another example has been provided where the reference levels are set taking into account only the values of the Spanish regions. With these two examples, we have shown that results may vary depending on the reference levels set. Therefore, potential users can decide which levels to use, based on their specific scopes and aims. The methodology used allows, as previously stated, to clearly relate the results to the levels chosen and therefore, users can easily interpret the meaning of the composite measures.
Regarding the second question, the results have proved the usefulness of getting composite measures with different degrees of aggregation. While the fully compensatory scheme (weak) provides an overall performance assessment, the non-compensatory scheme (strong) provides users with warning signs that identify indicators, dimensions or types with a less satisfactory performance. The examples used in the paper have shown that this useful information may remain unnoticed when (as is the case in the RIS and in most of the existing methodologies) a compensatory scheme is used. In our opinion, it is not a question of choosing between the weak and the strong composite indicators, but of jointly considering them, to make the most of the additional information provided.
Because of these two features of the methodology proposed, we believe that it is a very useful tool for decision making processes. By setting the reference levels, decision makers can provide preferential information in an intuitive way, defining performance intervals for each indicator. By analyzing the weak composite measures, we can get an overall view of the performance of each region. Finally, by looking at the strong composite measures, policy makers can identify improvement actions for their regions.
The Spanish regions have been used for illustrative purposes, but this methodology is equally applicable to any other country, given that all the data are available. Besides, similar studies can be made at other microeconomic ranges, like organizational or sectoral, maybe defining a different system of indicators if this was regarded suitable. Finally, we would like to study, as a future research line, the possibility to build a web-based software, incorporating the methodological and visualization features, where potential users could define their reference levels and get the corresponding results.

Author Contributions

Data treatment, A.G.-B.; Formal analysis, J.M.C. and F.R.; Methodology, J.M.C. and F.R.; Software, J.M.C.; Writing–original draft, A.G.-B. and F.R. All authors have read and agreed to the published version of the manuscript.

Funding

This research has been partially supported by the Spanish Ministry of Economy and Competitiveness (Project ECO2016-76567-C4-4-R), by the Regional Government of Andalucía (research group SEJ-417), and by the ERDF funds (Project UMA18-FEDERJA-065).

Acknowledgments

The authors would like to thank the financial support received from the Spanish Ministry of Economy and Competitiveness (Project ECO2016-76567-C4-4-R), from the Regional Government of Andalucía (research group SEJ-417), and by the EU FEDER operative program (project UMA18-FEDERJA-065).

Conflicts of Interest

The authors declare no conflict of interest.

Appendix A

Table A1. RIS description for the elementary criteria. Source: [50].
Framework Conditions ( I 1 )IndicatorDefinition NumeratorDefinition Denominator
Human Resources ( I 11 )Population with tertiary education ( I 111 )Number of persons in age class with some form of post secondary educationTotal population between 30 and 34 years
Lifelong Learning ( I 112 )Number of persons in private households aged between 25 and 64 years who have participated in the four weeks preceding the interview, in any education or training...Total population aged between 25 and 64 years
Attractive research systems ( I 12 )Scientific Co-Publications ( I 121 )Number of scientific publications with at least one co author based abroadTotal population
Most-cited publications ( I 122 )Number of scientific publications among the top 10% most cited publications worldwideTotal number of scientific publications
Investments ( I 2 )IndicatorDefinition NumeratorDefinition Denominator
Finance and support ( I 21 )R&D expenditures in the public sector as percentage of GDP (R&D expenditure public sector) ( I 211 )All R&D expenditures in the government sector (GOVERD) and the higher education sector (HERD)Regional Gross Domestic Product
Firm investments ( I 22 )R& D expenditure business sector ( I 221 )All R&D expenditures in the business sector (BERD)Regional Gross Domestic Product
Non-R& D innovation expenditures ( I 222 )Sum of total innovation expenditure for SMEsTotal turnover for SMEs
Innovation Activities ( I 3 )IndicatorDefinition NumeratorDefinition Denominator
Innovators ( I 31 )Product or Process Innovators ( I 311 )Number of SMEs that introduced a new product or a new process to one of their marketsTotal number of SMEs
Marketing or organisational innovators ( I 312 )Number of SMEs that introduced a new marketing innovation and/or organisational innovation to one of their marketsTotal number of SMEs
SMEs innovating in-house ( I 313 )Number of SMEs with in house innovation activities.Total number of SMEs
Linkages ( I 32 )Innovative SMEs collaborating ( I 321 )Number of SMEs with innovation co operation activities.Total number of SMEs
Public-private co-publications ( I 322 )Number of public private co authored research publications.Total population
Intellectual Assets ( I 33 )EPO patent applications per billion regional GDP (EPO patent applications) ( I 331 )Number of patents applied for at the European Patent Office (EPO), by year of filingGross Domestic Product in Purchasing Power Standard
Trademark applications per billion regional GDP (Trademark Applications) ( I 332 )Number of trademarks applied for at EUIPOGross Domestic Product in Purchasing Power Standard
Design applications per billion regional GDP (Design applications) ( I 333 )Number of designs applied for at EUIPOGross Domestic Product in Purchasing Power Standard
Impacts ( I 4 )IndicatorDefinition NumeratorDefinition Denominator
Employment ( I 41 )Employment in medium high/high tech manufacturing and knowledge intensive services as percentage of total workforce ( I 411 )Number of employed persons in the medium high and high tech manufacturing sectors.Total workforce including all manufacturing and service sectors
Sales Impact ( I 42 )Sales of new to market and new to firm innovations in SMEs as percentage of turnover ( I 421 )Sum of total turnover of new or significantly improved products for SMEsTotal turnover for SMEs

References

  1. Hauser, C.; Siller, M.; Schatzer, T.; Walde, J.; Tappeiner, G. Measuring regional innovation: A critical inspection of the ability of single indicators to shape technological change. Technol. Forecast. Soc. Chang. 2018, 129, 43–55. [Google Scholar] [CrossRef]
  2. Makkonen, T.; van der Have, R.P. Benchmarking regional innovative performance: Composite measures and direct innovation counts. Scientometrics 2013, 94, 247–262. [Google Scholar] [CrossRef] [Green Version]
  3. Asheim, B.T.; Smith, H.L.; Oughton, C. Regional innovation systems: Theory, empirics and policy. Reg. Stud. 2011, 45, 875–891. [Google Scholar] [CrossRef]
  4. Buesa, M.; Heijs, J.; Baumert, T. The determinants of regional innovation in Europe: A combined factorial and regression knowledge production function approach. Res. Policy 2010, 39, 722–735. [Google Scholar] [CrossRef]
  5. Schmookler, J. The interpretation of patent statistics. J. Pat. Off. Soc. 1950, 32, 123–146. [Google Scholar]
  6. Di Cagno, D.; Fabrizi, A.; Meliciani, V.; Wanzenböck, I. The impact of relational spillovers from joint research projects on knowledge creation across European regions. Technol. Forecast. Soc. Chang. 2016, 108, 83–94. [Google Scholar] [CrossRef]
  7. Griliches, Z. R&amp D, Patents and Productivity; University of Chicago Press: Chicago, IL, USA, 1984. [Google Scholar]
  8. Capello, R.; Lenzi, C. Territorial patterns of innovation: A taxonomy of innovative regions in Europe. Ann. Reg. Sci. 2013, 51, 119–154. [Google Scholar] [CrossRef]
  9. Navarro, M.; Gibaja, J.J.; Bilbao-Osorio, B.; Aguado, R. Patterns of innovation in EU-25 regions: A typology and policy recommendations. Environ. Plan. C Gov. Policy 2009, 27, 815–840. [Google Scholar] [CrossRef] [Green Version]
  10. Pinto, H. The diversity of innovation in the European Union: Mapping latent dimensions and regional profiles. Eur. Plan. Stud. 2009, 17, 303–326. [Google Scholar] [CrossRef] [Green Version]
  11. Nardo, M.; Saisana, M.; Saltelli, A.; Tarantola, S.; Hoffman, A.; Giovannini, E. Handbook on Constructing Composite Indicators; OECD Publishing: Paris, France, 2008. [Google Scholar]
  12. Ruiz, F.; El Gibari, S.; Cabello, J.M.; Gómez, T. MRP-WSCI: Multiple reference point based weak and strong composite indicators. Omega 2019. [Google Scholar] [CrossRef]
  13. Hollenstein, H. A composite indicator of a firm’s innovativeness: An empirical analysis based on survey data for Swiss manufacturing. Res. Policy 1996, 25, 633–645. [Google Scholar] [CrossRef]
  14. Feeny, S.; Rogers, M. Innovation and performance: Benchmarking Australian firms. Aust. Econ. Rev. 2003, 36, 253–264. [Google Scholar] [CrossRef] [Green Version]
  15. Gu, W.; Tang, J. Link between innovation and productivity in Canadian manufacturing industries. Econ. Innov. New Technol. 2004, 13, 671–686. [Google Scholar] [CrossRef]
  16. Tang, J.; Le, C.D. Multidimensional innovation and productivity. Econ. Innov. New Technol. 2007, 16, 501–516. [Google Scholar] [CrossRef]
  17. Cobo, A.; Rocha, E.R.; Villamizar, M.A. Innovative propensity with a fuzzy multicriteria approach: Analysis of the Spanish industrial sector with data mining techniques. Manag. Decis. 2019, 57, 2940–2957. [Google Scholar] [CrossRef]
  18. Kumar, S.; Haleem, A.; Sushil. Assessing innovativeness of manufacturing firms using an intuitionistic fuzzy based MCDM framework. Benchmarking 2019, 26, 1823–1844. [Google Scholar] [CrossRef]
  19. Zemlickienė, V.; Turskis, Z. Evaluation of the expediency of technology commercialization: A case of information technology and biotechnology. TEchnological Econ. Dev. Econ. 2020, 26, 271–289. [Google Scholar] [CrossRef] [Green Version]
  20. OECD. Handbook on Constructing Composite Indicators: Methodology and User Guide; OECD Publishing: Paris, France, 2008. [Google Scholar]
  21. Dutta, S.; Lanvin, B.; Wunsch-Vincent, S. The Global Innovation Index 2018: Energizing the World with Innovation; Ithaca: Fontainebleau, France, 2019. [Google Scholar]
  22. European Commission (Ed.) Third European Report on Science & Technology Indicators 2003; EUR 20025 EN; European Commission: Brussels, Belgium, 2003. [Google Scholar]
  23. Grupp, H.; Mogee, M.E. Indicators for national science and technology policy: How robust are composite indicators? Res. Policy 2004, 33, 1373–1384. [Google Scholar] [CrossRef]
  24. Schibany, A.; Streicher, G. The European innovation scoreboard: Drowning by numbers? Sci. Public Policy 2008, 35, 717–732. [Google Scholar] [CrossRef]
  25. Grupp, H.; Schubert, T. Review and new evidence on composite innovation indicators for evaluating national performance. Res. Policy 2010, 39, 67–78. [Google Scholar] [CrossRef]
  26. Adam, F. Measuring National Innovation Performance: The Innovation Union Scoreboard Revisited; Springer: Berlin, Germany, 2014. [Google Scholar]
  27. Edquist, C.; Zabala, J.M. The Innovation Union Scoreboard Is Flawed: The Case of Sweden—Not Being the Innovation Leader of the EU; CIRCLE: Lund, Sweden, 2015. [Google Scholar]
  28. Kozłowski, J. Innovation indices: The need for positioning them where they properly belong. Scientometrics 2015, 104, 609–628. [Google Scholar] [CrossRef] [PubMed] [Green Version]
  29. Carayannis, E.G.; Goletsis, Y.; Grigoroudis, E. Composite innovation metrics: MCDA and the Quadruple Innovation Helix framework. Technol. Forecast. Soc. Chang. 2018, 131, 4–17. [Google Scholar] [CrossRef]
  30. Saisana, M.; Tarantola, S. State-of-The-Art Report on Current Methodologies and Practices for Composite Indicator Development; Technological and Economic Risk Management Unit, Institute for the Protection and the Security of the Citizen, Joint Research Centre, European Commission: Ispra, Italy, 2002; Volume 2014. [Google Scholar]
  31. Greco, S.; Ishizaka, A.; Tasiou, M.; Torrisi, G. On the methodological framework of composite indices: A review of the issues of weighting, aggregation, and robustness. Soc. Indic. Res. 2019, 141, 61–94. [Google Scholar] [CrossRef] [Green Version]
  32. Nardo, M.; Saisana, M.; Saltelli, A.; Tarantola, S. Tools for Composite Indicators Building; European Commission, Joint Research Centre, Institute for the Protection and the Security of the Citizen, Technological and Economic Risk Management Unit: Ispra, Italy, 2005. [Google Scholar]
  33. Jacobs, R.; Smith, P.C.; Goddard, M.K. Measuring Performance: An Examination of Composite Performance Indicators; Centre of Health Economics, University of York: York, UK, 2004. [Google Scholar]
  34. Freudenberg, M. Composite Indicators of Country Performance: A Critical Assessment; OECD Science, Technology and Industry Working Papers, 2003/16; OECD Publishing: Paris, France, 2003. [Google Scholar]
  35. Saisana, M.; Domínguez-Torreiro, M.; Vértesy, D.; Alvarez, M. Joint Research Centre Statistical Audit of the 2018 Global Innovation Index; Cornell University, INSEAD, WIPO, The Global innovation Index 2018; Energizing the World with Innovation: Fontainebleau, France, 2018; pp. 71–88. [Google Scholar]
  36. El Gibari, S.; Gómez, T.; Ruiz, F. Building composite indicators using multicriteria methods: A review. J. Bus. Econ. 2019, 89, 1–24. [Google Scholar] [CrossRef]
  37. Diaz-Balteiro, L.; González-Pachón, J.; Romero, C. Measuring systems sustainability with multi-criteria methods: A critical review. Eur. J. Oper. Res. 2017, 258, 607–616. [Google Scholar] [CrossRef]
  38. Wierzbicki, A.P. The Use of Reference Objectives in Multiobjective Optimization. In Multiple Criteria Decision Making Theory and Application; Fandel, G., Gal, T., Eds.; Springer: Berlin/Heidelberg, Germany, 1980; pp. 468–486. [Google Scholar]
  39. Ruiz, F.; Cabello, J.M.; Luque, M. An application of reference point techniques to the calculation of synthetic sustainability indicators. J. Oper. Res. Soc. 2011, 62, 189–197. [Google Scholar] [CrossRef]
  40. Cabello, J.M.; Ruiz, F.; Pérez-Gladish, B.; Méndez-Rodríguez, P. Synthetic indicators of mutual funds’ environmental responsibility:An application of the Reference Point Method. Eur. J. Oper. Res. 2014, 236, 313–325. [Google Scholar] [CrossRef]
  41. Ruiz, F.; Cabello, J.M.; Pérez-Gladish, B. Building Ease-of-Doing-Business synthetic indicators using a double reference point approach. Technol. Forecast. Soc. Chang. 2018, 131, 130–140. [Google Scholar] [CrossRef]
  42. El Gibari, S.; Gómez, T.; Ruiz, F. Evaluating university performance using reference point based composite indicators. J. Inf. 2018, 12, 1235–1250. [Google Scholar] [CrossRef]
  43. Giarlotta, A. Multicriteria compensability analysis. Eur. J. Oper. Res. 2001, 133, 190–209. [Google Scholar] [CrossRef]
  44. Mazziotta, M.; Pareto, A. Measuring well-being over time: The adjusted Mazziotta–Pareto index versus other non-compensatory indices. Soc. Indic. Res. 2018, 136, 967–976. [Google Scholar] [CrossRef]
  45. Munda, G.; Nardo, M. On the Methodological Foundations of Composite Indicators Used for Ranking Countries; Joint Research Centre of the European Communities: Ispra, Italy, 2003; pp. 1–19. [Google Scholar]
  46. Munda, G.; Nardo, M. Noncompensatory/nonlinear composite indicators for ranking countries: a defensible setting. Appl. Econ. 2009, 41, 1513–1523. [Google Scholar] [CrossRef] [Green Version]
  47. Wierzbicki, A.P.; Makowski, M.; Wessels, J. (Eds.) Model-Based Decision Support Methodology with Environmental Applications; Kluwer Academic Publishers: Dordrecht, The Netherlands, 2000. [Google Scholar]
  48. Cabello, J.M.; Navarro, E.; Prieto, F.; Rodríguez, B.; Ruiz, F. Multicriteria development of synthetic indicators of the environmental profile of the Spanish regions. Ecol. Indic. 2014, 39, 10–23. [Google Scholar] [CrossRef]
  49. Munda, G.; Nardo, M. Constructing Consistent Composite Indicators: The Issue of Weights; European Commission: Brussels, Belgium, 2005. [Google Scholar]
  50. Hollanders, H.; Es-Sadki, N.; Kanerva, M. European Innovation Scoreboard 2016; European Commission: Brussels, Belgium, 2016. [Google Scholar]
Figure 1. Hierarchy structure of the Regional Innovation Scoreborad (RIS) for three-stages of the aggregation process. The system of indicators is formed by four types, which are in turn subdivided into 9 dimensions.
Mathematics 08 00797 g001
Figure 2. Hypothetical example of the Light-Diagram tool, for a hierarchy of ten criteria, five dimensions and two types. The meaning of each composite indicator is briefly described. Different colors indicate different performance intervals.
Mathematics 08 00797 g002
Figure 3. RIS indicators for (ES52) Comunidad Valenciana and (ES24) Aragón. The indicators are denoted as shown in Table A1.
Mathematics 08 00797 g003
Figure 4. Values of the successive aggregations for (ES52) Comunidad Valenciana and (ES24) Aragón. We can see the values of the achievement functions of the single indicators (left), the weak composite indicator of each dimension (center) and the weak–weak composite indicator of each type (right).
Mathematics 08 00797 g004
Figure 5. 2019 Spain regional innovation performance for different levels of compensability. Each line goes from the zero compensation scheme (S-S-S indicator, red) to the fully compensatory scheme (W-W-W indicator, green).
Mathematics 08 00797 g005
Figure 6. 2019 Innovation Performance of Spanish regions for different compensation degrees with respect to EU Reference Levels. (a) W-W-W Composite Indicator. (b) S-W-W Composite Indicator. (c) S-S-S Composite Indicator. Each performance interval has been subdivided into two subintervals (colors).
Mathematics 08 00797 g006
Figure 7. Light-Diagram for (ES23) La Rioja in 2019: EU reference levels. The values of the achievement functions and of each composite indicator are shown for every aggregation step.
Mathematics 08 00797 g007
Figure 8. Spain Regions’ innovation performance in 2019 for different levels of compensability: Spanish reference levels.
Mathematics 08 00797 g008
Figure 9. 2019 Innovation Performance of Spanish regions for different compensation degrees with respect to Spanish Reference Levels. (a) W-W-W Composite Indicator. (b) S-W-W Composite Indicator. (c) S-S-S Composite Indicator.
Mathematics 08 00797 g009
Figure 10. Light-Diagram for (ES51) Cataluña in 2019: Spanish reference levels.
Mathematics 08 00797 g010
Figure 11. Achievement functions of the single indicators with European levels (left) and Spanish levels (right) for (ES51) Cataluña and (ES22) Comunidad Foral de Navarra.
Mathematics 08 00797 g011
Table 1. Reference Levels of the Regional Innovation Index (RII) indicator in 2019, relative to the EU Regions.
Framework Conditions q 0 ( Min ) M * q 1 ( 50 ) M * q 2 ( 90 ) S q 3 ( 120 ) L q 0 ( Max )
Population with tertiary education0.00 0.21 0.38 0.51 1.00
Lifelong Learning0.00 0.16 0.29 0.38 1.00
Scientific Co-Publications0.00 0.25 0.45 0.60 1.00
Most-cited publications0.00 0.22 0.40 0.54 1.00
Framework Conditions q 0 ( M i n ) M * q 1 ( 50 ) M * q 2 ( 90 ) S q 3 ( 120 ) L q 0 ( M a x )
R&D expenditure public sector0.00 0.25 0.44 0.59 1.00
R&D expenditure business sector0.00 0.22 0.40 0.53 1.00
Non-R&D innovation expenditures0.00 0.27 0.48 0.64 1.00
Framework Conditions q 0 ( Min ) M * q 1 ( 50 ) M * q 2 ( 90 ) S q 3 ( 120 ) L q 0 ( Max )
Product or Process Innovators0.00 0.24 0.43 0.58 1.00
Marketing-org innovators0.00 0.23 0.41 0.55 1.00
SMEs innovating in-house0.00 0.23 0.42 0.56 1.00
Innovative SMEs collaborating0.00 0.18 0.33 0.44 1.00
Public-private co-publications0.00 0.16 0.29 0.39 1.00
EPO patent applications0.00 0.16 0.29 0.39 1.00
Trademark Applications0.00 0.18 0.32 0.43 1.00
Design applications0.00 0.20 0.36 0.48 1.00
Framework Conditions q 0 ( Min ) M * q 1 ( 50 ) M * q 2 ( 90 ) S q 3 ( 120 ) L q 0 ( Max )
Employment0.00 0.23 0.42 0.56 1.00
Sales of new to market0.00 0.26 0.47 0.62 1.00
Table 2. Spain Regions’ innovation performance in 2019 relative to RII and MRP-WSCI: EU reference levels.
RIIW-W-W S-W-W S-S-S
Score Rank Score Rank Score Rank Score Rank
ES21País Vasco79.8412.6612.1121.321
ES51Cataluña77.5822.5022.1811.112
ES22Comunidad Foral de Navarra75.4532.4931.7451.033
ES30Comunidad de Madrid74.0242.4241.8630.936
ES52Comunidad Valenciana69.2852.0271.7940.955
ES23La Rioja67.4761.9281.5970.0017
ES24Aragón64.6672.0551.6361.004
ES13Cantabria60.2382.0461.14120.769
ES62Región de Murcia59.0191.70121.4280.837
ES12Principado de Asturias58.36101.8691.34100.798
ES11Galicia55.68111.74101.3590.7510
ES53Illes Balears52.30121.50141.04140.3415
ES41Castilla y León51.65131.70110.96160.7211
ES61Andalucía51.03141.64131.20110.6712
ES70Canarias46.06151.35160.94170.3216
ES42Castilla-la Mancha44.68161.30171.10130.6413
ES43Extremadura43.36171.36150.99150.4414
Table 3. Spain Regions’ Reference Levels of the RII indicator in 2019 relative to the Spanish Regions’.
Framework Conditions q 0 (Min) q 1 (P25) q 2 (P50) q 3 (P75) q 4 (Max)
Population with tertiary education0.320.420.550.610.73
Lifelong Learning0.210.260.280.330.38
Scientific Co-Publications0.300.420.480.570.67
Most-cited publications0.240.370.430.450.54
Investments q 0 (Min) q 1 (P25) q 2 (P50) q 3 (P75) q 4 (Max)
R&D expenditure public sector0.290.430.460.490.58
R&D expenditure business sector0.100.280.310.400.61
Non-R&D innovation expenditures0.220.250.270.290.36
Innovation Activities q 0 (Min) q 1 (P25) q 2 (P50) q 3 (P75) q 4 (Max)
Product or Process Innovators0.130.200.250.300.35
Marketing or organisational innovators0.230.290.310.340.40
SMEs innovating in-house0.090.180.220.280.35
Innovative SMEs collaborating0.060.130.220.280.44
Public-private co-publications0.000.140.170.230.48
EPO patent applications0.080.120.210.250.35
Trademark Applications0.190.310.420.741.00
Design applications0.090.210.270.450.70
Sales Impacts q 0 (Min) q 1 (P25) q 2 (P50) q 3 (P75) q 4 (Max)
Employment0.110.240.310.420.72
Sales of new to market0.410.460.520.600.97
Table 4. Spain Regions’ innovation performance in 2019 relative to RII and MRP-WSCI: Spanish reference levels.
W-W-WRII S-W-W S-S-S
ScoreRankScoreRankScoreRankScoreRank
ES21País Vasco3.36179.8412.9212.001
ES22Comunidad Foral de Navarra3.14275.4532.8221.772
ES51Cataluña3.04377.5822.4740.0017
ES30Comunidad de Madrid2.88474.0242.5030.975
ES52Comunidad Valenciana2.51569.2851.9951.193
ES24Aragón2.43664.6671.5761.001
ES13Cantabria2.30760.2381.5180.079
ES23La Rioja1.97867.4761.4090.0017
ES12Principado de Asturias1.93958.36100.69140.0017
ES62Región de Murcia1.701059.0190.75130.0017
ES11Galicia1.691155.68111.5570.666
ES41Castilla y León1.681251.65130.92100.527
ES61Andalucía1.521351.03140.91110.138
ES43Extremadura1.061443.36170.56150.0017
ES53Illes Balears1.051552.30120.45160.0017
ES70Canarias0.871646.06150.79120.0017
ES42Castilla-la Mancha0.641744.68160.44170.0017
Table 5. Scores and ranks of the Spanish regions for the RII, W-W-W (European lelvels) and W-W-W (Spanish levels) indicators. Rank improvements (with respect to RII) are colored in green, and rank impairments are colored in red.
RIIW-W-W-EURW-W-W-SPAIN
ScoreRankScoreRankScoreRank
ES21País Vasco79.812.65613.3621
ES51Cataluña77.622.49723.0393
ES22Comunidad Foral de Navarra75.532.49033.1422
ES30Comunidad de Madrid7442.42242.8824
ES52Comunidad Valenciana69.352.02372.5145
ES23La Rioja67.561.92081.9758
ES24Aragón64.772.05452.4296
ES13Cantabria60.282.04062.2967
ES62Región de Murcia5991.699121.69710
ES12Principado de Asturias58.4101.85991.9329
ES11Galicia55.7111.739101.68511
ES53Illes Balears52.3121.496141.05415
ES41Castilla y León51.6131.700111.67612
ES61Andalucía51141.635131.51613
ES70Canarias46.1151.351160.87316
ES42Castilla-la Mancha44.7161.305170.63917
ES43Extremadura43.4171.359151.05914