1. Introduction
The determination of the relative weights of criteria in multi-criteria decision-making models represents a specific problem that is inevitably accompanied by subjectivities. This procedure is very significant, since it exerts a great influence on the final decision in the decision-making process [
1]. Multi-criteria optimization methods use normalized values of weights, which meet the condition that
,
. In many models for perceiving the relative ratios of weights, however, non-normalized values are used in the form of whole numbers or amounts in percentages [
2]. The percentage value of the weight of one criterion denotes a part of the overall preference attributed to that criterion.
The determination of the values of criteria weights is a special problem in multi-criteria optimization, so numerous models have been developed to solve it. Multi-criteria optimization models are well-known for their sensitivity to change in the vector of weight coefficients, so minor modifications in the values of the mentioned vector can cause a major change in the order of the significance of alternatives in the model. Therefore, special attention has been devoted to studying these models in the literature dealing with multi-criteria optimization [
3,
4,
5,
6].
Studying the available literature allows us to notice that there is no unique classification of methods used for the determination of criteria weights, and their classification was, for the most part, performed in compliance with the author’s understanding of and needs regarding the solving of a concrete practical problem. Therefore, in [
7], the classification of criteria weight determination methods is given, and groups them into objective and subjective approaches. Objective models imply the calculation of criteria weight coefficients based on the value(s) of the criterion/criteria in the initial decision-making matrix. The most well-known objective models include the Entropy method [
8], the CRiteria Importance Through Intercriteria Correlation (CRITIC) method [
9], and the FANMA method (named after the authors Fan and Ma) [
10].
On the other hand, subjective models include the application of a methodology implying the direct participation of decision-makers, who express their preferences according to the significance of criteria. There are several ways in which weights of criteria are obtained through the subjective approach, which may differ from each other in terms of the number of participants in the process of the determination of weights, the methods applied, and the manner in which the final criteria weights are formed. The group of subjective models used to aggregate partial values in multi-attribute analysis methods includes the trade-off method [
11], which enables identification of the decision-maker’s dilemmas through pairwise comparisons; the swing weight method [
12], which involves the construction of two extreme hypothetical scenarios; the worst (
W) and the best (
B) method, in which the first scenario (
W) is constructed based on the worst values of all criteria, and the second scenario (
B) corresponds to the best values; the Simple Multi-Attribute Rating Technique (SMART) method [
13], which includes a procedure for the determination of criteria weights based on comparing criteria with the best and the criteria from within the defined set of criteria; and SMART Exploiting Ranks (SMARTER), which was developed by [
13] and which represents a new version of the SMART method. SMARTER uses the centroid method for ranking the criteria for the determination of weight coefficients.
Apart from the above-mentioned subjective approaches, there are also approaches exclusively based on criteria pairwise comparisons, and such approaches are referred to as pairwise comparison methods. The pairwise comparison method was first introduced by Thurstone [
14], and it represents a structured way of producing a decision matrix. Pairwise comparisons (performed by an expert or a team of experts) are used to demonstrate the relative significance of
m actions in situations in which it is impossible or senseless to assign marks to actions in relation to criteria. In pairwise comparison methods, the decision-maker compares the observed criterion/action with other criteria/actions, and determines the level of significance of the observed criterion/action. An ordinal scale is used to help determine the magnitude of the preference for one criterion over another. One of the most frequently used methods based on pairwise comparisons is the method of the Analytic Hierarchy Process (AHP) [
15]. Apart from the AHP, the pairwise comparison methods include the Decision-Making Trial and Evaluation Laboratory (DEMATEL) method [
16]; the Best Worst Method (BWM) [
17]; the resistance to change method [
18], which has elements of the swing method and pairwise comparison methods; and the Step-Wise Weight Assessment Ratio Analysis (SWARA) method [
19]. In pairwise comparison methods, for example, in the AHP, weights are determined based on pairwise comparisons of criteria, and the results are generated from pairwise comparisons of alternatives with criteria. After that, by means of the usefulness function, the final values of alternatives are calculated. A very significant challenge in pairwise comparison methods arises from a lack of consistency of comparison matrices, which is frequently the case in practice [
20]. Each of these methods has a wide application in the various areas of science and technology, as well as in solving real-life problems. The AHP method is used in [
21] to make a strategic decision in a transport system. In [
22], this method is employed to determine the significance of criteria in evaluating different transitivity alternatives in transport in Catania. In [
23], the AHP method is using to identify and evaluate defects in the passenger transport system, whereas in [
24], it is applied to select an alternative to the electronic payment system. Stević et al. [
25] carried out site selection of a logistics center by applying the AHP method. In [
26], the DEMATEL method is employed to analyze the risk in mutual relations in logistics outsourcing. Additionally, in [
27], the authors proposed a two-phase model which aims to evaluate and select suppliers using an integrated Fuzzy AHP and Fuzzy Technique for Ordering Preference by Similarity to Ideal Solution (FTOPSIS) methods. Integration of the DEMATEL method is not rare, so in [
27], along with the Analytic Network Process (ANP) and Data Envelopment Analysis (DEA), a decision is made on the choice of the 3PL logistics provider. The SWARA method is used in [
28] to select the 3PL in the sustainable network of reverse logistics and a rough form [
29] for the purpose of determining the significance of criteria to the procurement of railroad wagons. Moreover, the application of the SWARA method can be seen in [
30,
31,
32,
33,
34,
35,
36,
37,
38,
39,
40,
41,
42,
43,
44,
45,
46]. BWM is a method that has increasingly been applied in a short period of time [
47,
48,
49,
50,
51,
52,
53,
54,
55,
56,
57,
58,
59,
60,
61,
62,
63,
64,
65,
66,
67,
68,
69,
70]. Some authors [
55,
56,
57,
61,
67,
71,
72,
73] see this method as an adequate substitute for the AHP. Its major advantage is the smaller number of pairwise comparisons (
) involved compared to the AHP.
Weight coefficients represent a means calibrating decision-making models and the quality of a decision made directly depends on the quality of their definition. The reason for studying this problem lies in the fact that each subjective method used for the determination of criteria weights has both advantages and disadvantages. In this research study, subjective methods based on pairwise comparisons of criteria, more precisely, the BWM and AHP models, as the highest-sounding representatives of this group of methods, are analyzed. Their advantages and disadvantages are analyzed. Based on the identification of the weaknesses of these models, a new approach to the determination of weight coefficients that involves forming a non-decreasing series at criteria significance levels (the NDSL model) is proposed. The NDSL model includes the application of an original algorithm to the grouping of criteria according to significance levels, through which the need to predefine the ordinal scale for the pairwise comparison of criteria is eliminated. Criteria are grouped according to significance levels in relation to the most significant criterion. After their grouping according to significance levels, the numerical values of the significance of the criteria are determined in accordance with the decision-maker’s preferences. By employing this procedure, results which are fully consistent and also represent the real relationships defined by experts’ preferences are obtained. The proposed model eliminates the deviations from experts’ preferences that appear in the AHP model, since the NDSL’s results are always consistent. We highlight this since an increase in the consistency ratio in the AHP leads to the distortion of experts’ preferences and the values of weight coefficients deviate from the optimal values. This is what frequently appears in the mentioned models and most often, it is a consequence of using the 9-degree scale characterized by limited possibilities of expressing experts’ preferences [
74].
This paper has several goals. The first goal of the paper is to present a new model for the determination of criteria weight coefficients which enables a rational expression of the decision-maker’s preferences with a minimal number of comparisons—
n − 1. The second goal of the paper is to develop a model for the determination of criteria weight coefficients which always generates consistent results. The third goal of the paper is to eliminate the 9-degree scale for the expression of experts’ preferences in pairwise comparison models through defining an original algorithm for comparing criteria according to the levels of significance. By forming significance levels, the shortcomings of the 9-degree scale, which include (1) its limited flexibility while expressing experts’ preferences and (2) inconsistencies during criteria pairwise comparisons, are eliminated [
74].
The rest of the paper is organized in the following manner: in the next section (
Section 2), the mathematical bases of the NDSL model are presented, and the algorithm demonstrating the performance of the seven steps for defining criteria weight coefficients is presented; in
Section 3, the NDSL model is tested on a real-world problem, and a comparison of the results with those of the BWM and AHP models is made; conclusive considerations and directions for future research studies are given in
Section 4.
2. Model for Determining Weight Coefficients by Forming a Non-Decreasing Series at Criteria Significance Levels
Allow us to assume that, in a multi-criteria model, there is a set S containing n evaluation criteria , and that the weight coefficients of the criteria have not been predefined, i.e., that weight coefficients need to be determined. Allow us also to assume that, in that multi-criteria problem, the criteria are ordered according to their significance (strength). Therefore, the weight coefficients of the criteria satisfy the relationships in which , with the condition that the criteria weights are normalized and meet the condition stipulating that .
Theorem 1. For a randomly chosen real (natural) number N, which is such that(whererepresents the number of criteria in the multi-criteria model), and if the criterionand the criterion,, are assigned the sum of 2N, then it is possible to determine the number, which is such that it fulfils the ratio between the criteria:
Proof. The proof of this ratio is obvious, since, for , we evidently obtain , i.e., we obtain , i.e., we obtain , i.e., the ratio .
If we assume that the ratio
, then we also obtain
, from which it follows that
, i.e.,
where
represents a non-negative number for the given
. □
Corollary 1. If the criterion
has a greater or equal significance (weight) for the criterion , then the condition is met, from which it follows that .
Proof. The proof for Corollary 1 is evident, since it arises from Theorem 1:
If , then we have . Since and , then we have and . □
It follows from Corollary 1 that a non-decreasing series of numbers can be attributed to the series of the criteria ordered according to significance, i.e.,
Based on Theorem 1, it is possible to conclude that
. Since we have
then
and we have
.
Additionally, based on Theorem 1, a new series (4) can be formed from the already formed series of elements (3), i.e.,
The non-decreasing series of elements that is presented by the expression (4) represents a series of ratios of the significance (strength) of the criterion
against the other criteria from within the
S set of criteria. Based on the condition (1), the series of elements (4) can be represented as a non-decreasing series of weight coefficients of the criteria of the multi-criteria model, which is such that
Based on the expression (5) and the condition that the sum of all weight coefficients of criteria of the multi-criteria model is equal to one, i.e.,
, the following is obtained:
Therefore, it follows from this that the weight coefficient of the most influential (best) criterion is obtained as
It follows from the condition (1) that
, i.e.,
, from which the weight coefficients of the remaining criteria are obtained:
2.1. Forming a Non-Decreasing Series at Criteria Significance Levels
The basic idea of forming a criteria classification level precisely reflects the need to determine the significance of criteria and eliminate the limitations of using predefined scales for expressing experts’ preferences. The basic limitation of using scales for expressing experts’ preferences in subjective models, such as the AHP, BWM, and DEMATEL, relates to the small range of values of such scales, as well as the nonlinearity of the scale (in the AHP). The insufficient range of values makes the development of an objective expression of experts’ preferences more difficult, which is particularly pronounced when comparing a larger number of criteria. Therefore, for example, the range of values for the scale employed in the AHP and BWM is from 1 to 9. Should there be a larger number of criteria (for example, seven) in the considered problem, experts’ comparisons are made more difficult due to the small number of values in the scales. The 9-degree scale also implies that the greatest ratio between the weights of the best () and worst () criteria is limited to 9, i.e., : = 9:1. If, however, an expert considers the ratio : to be greater than 9:1 and the : = 15:1, then such a preference cannot be presented. In order for experts to express preferences of this kind by applying the 9-degree scale, they are forced to distort their preferences, which leads to the deviation of weight values from the optimal values.
By introducing the level of criteria significance, experts are given a possibility to form as many criteria significance levels , as they need for expressing their preferences. Within the framework of significance levels, criteria are roughly classified according to experts’ preferences. Forming significance levels, i.e., grouping criteria according to levels, is performed by adhering to the following rules:
Level : At the level, the criteria from within the set S whose significance is equal to the significance of the criterion or up to two times as small as the significance of the criterion should be grouped. The criterion belonging to the level will be presented as ;
Level : At the level, the criteria from within the set S whose significance is exactly two times as small as the significance of the criterion or up to three times as small as the significance of the criterion should be grouped. The criterion belonging to the level will be presented as ;
Level : At the level, the criteria from within the set S whose significance is exactly three times as small as the significance of the criterion or up to four times as small as the significance of the criterion should be grouped. The criterion belonging to the level will be presented as ;
Level : At the level, the criteria from within the set S whose significance is exactly k times as small as the significance of the criterion or up to k + 1 times as small as the significance of the criterion should be grouped. The criterion belonging to the level will be presented as .
After grouping criteria as per the levels , , experts express their preferences through a numerical comparison of the criteria by means of the significance of the criteria (). Therefore, based on the value , a fine classification of the criteria is conducted within the observed level. The values of the significance of the criteria () within every level , , are defined based on experts’ preferences; the final values within every level need to be defined. In the following part, the boundary values of the significance of the criteria () within the level , are defined.
If the significance of the criterion
is expressed as
, where
, then subset of the criteria is formed for each criteria level, which together make the criteria set
S. Then, it follows that
, and for every level
,
Based on the previously defined relations, it is possible to define the boundaries within which the values of the significance of the criteria () move for each observed level , . If the criterion belongs to the level , is presented as , , and then, based on the relation (2), we can obtain the following:
Level : For , i.e., for , it follows that , whereas for , we obtain . Therefore, it follows that the values of the significance of the criteria () at the level range in the interval , i.e., ;
Level : For , i.e., for , it follows that , whereas for , we obtain . The values of the significance of the criteria () at the level range in the interval , i.e., ;
Level : For , i.e., for , it follows that , whereas for , we obtain . The values of the significance of the criteria () at the level range in the interval , i.e., .
Example 1. If we assume that the criteria are grouped at three levels,, and if we take that, then we can define the interval in which the values of the significance of the criterionwithin the levelshould range. By applying the previously defined relationships, we obtain the result that the valuesrange within the level,, in the following intervals:
- 1.
Level : , then we have ;
- 2.
Level : , then we have ;
- 3.
Level : , then we have .
From the relations presented for the determination of the boundary values of the significance of the criteria (), i.e., from experts’ preferences within the level , , we may perceive that the breadth of the interval depends on the value of the real (natural) number N. A broader interval and, simultaneously, a more comfortable scale with fewer decimal values for expressing experts’ preferences, are obtained for greater values of the number N, such as ; vice versa, a scale with a larger number of decimal values for expressing experts’ preferences is obtained for smaller values of the number N, such as .
Based on Theorem 1, while performing a comparison of any criterion with the criterion (where is the most influential criterion), the NDSL model ensures that the number 2N is added to the criteria. Simultaneously, a part greater than or equal to 2N belongs to the criterion , as the most significant criterion, whereas a smaller or equal part belongs to the criterion . If the problem of defining the number N is observed from an economic standpoint, and if we take N = 50, then this problem can be observed in ordinary economic terms, i.e., in percentages (p%). If , then it belongs to the criterion , while (1−p)% belongs to the criterion . Since expressing in percentages is a normal thing to do during a pairwise comparison, the authors propose that should be taken for the values of the number N for solving real problems.
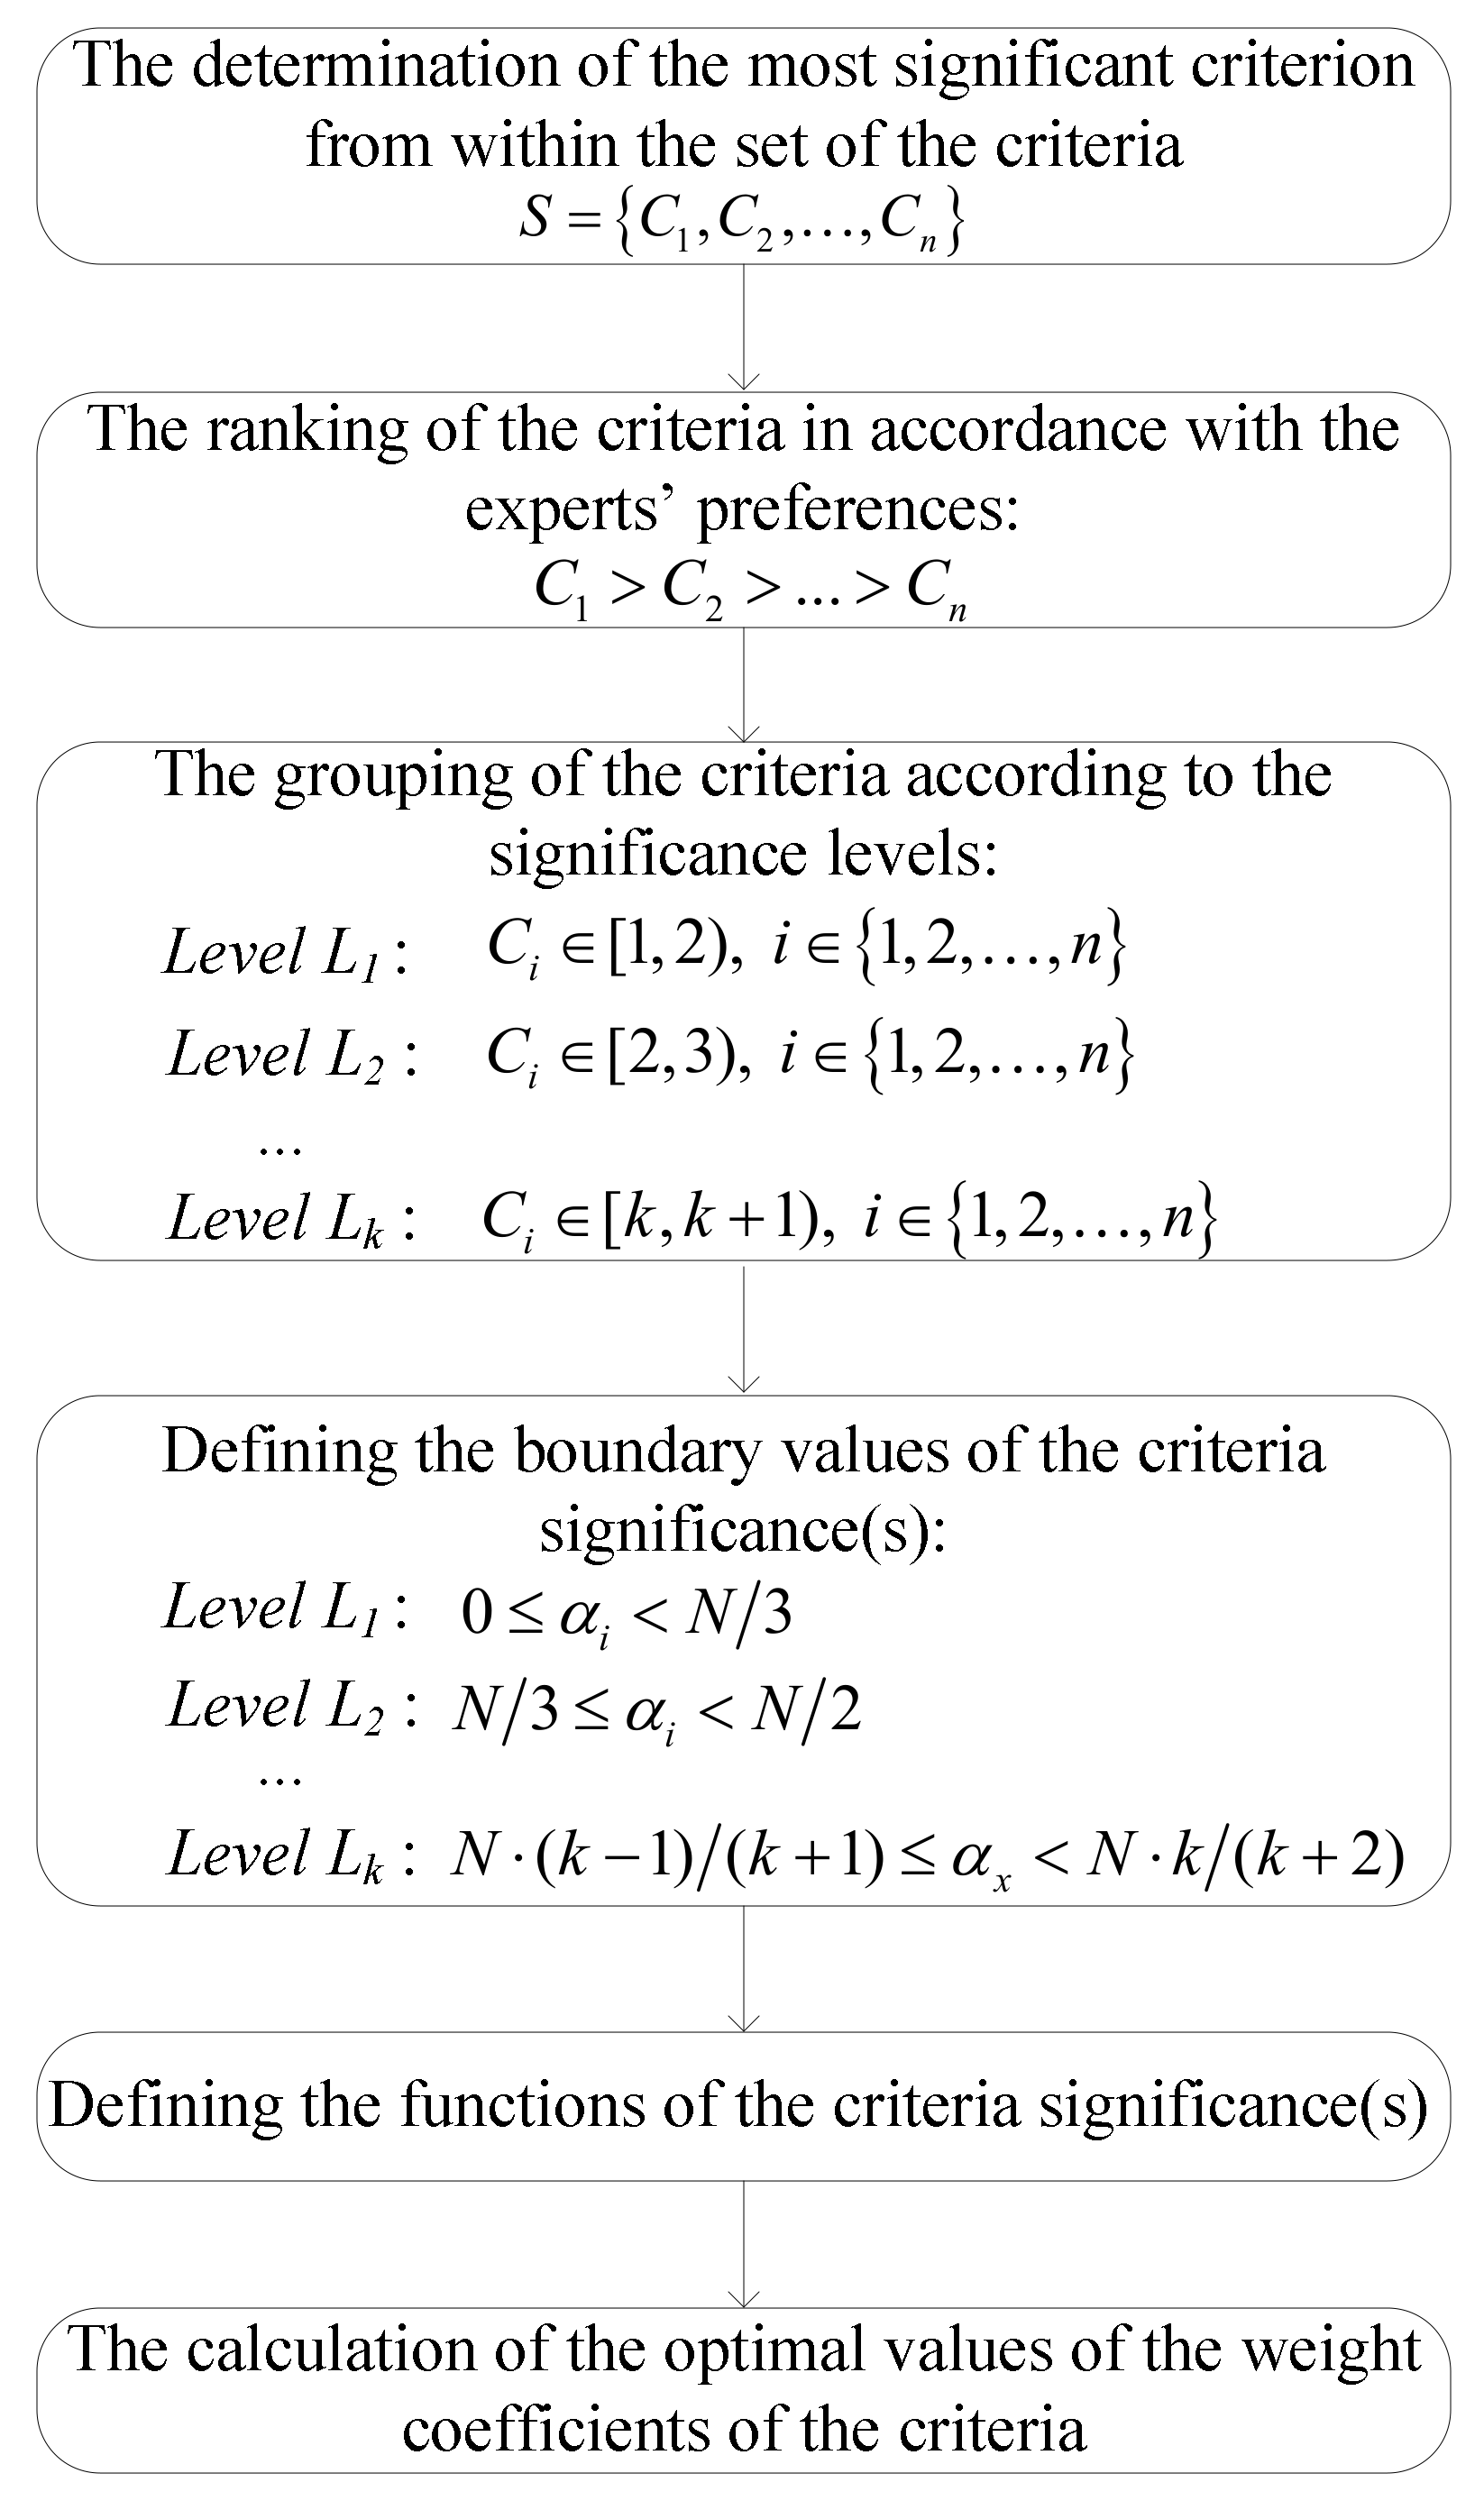
2.2. Steps of the NDSL Model
Based on the previously demonstrated mathematical bases of the NDSL model, the steps that should be taken in order to obtain the weight coefficients of criteria are systematized in this section. In Phase One, a set of evaluation criteria is formed, and the criteria are further ranked in accordance with experts’ preferences. In Phase Two, the levels of significance of the criteria are formed and the criteria significance level is determined within each level. Finally, the weight coefficients of the criteria are calculated in Phase Three.
Figure 1 schematically presents the phases through which the NDSL model is implemented.
The NDSL model includes the calculation of the weight coefficients of criteria through the seven steps presented in the next part of the paper.
Step 1: Determining the most significant criterion from within the set of criteria . Allow us to assume that the decision-maker has chosen the criterion as the most significant, and allow us to assume that is a criterion from within the set , which is the most significant in the decision-making process.
Step 2: Ranking the criteria from within the defined set of evaluation criteria
. Ranking is performed according to the significance of the criteria, i.e., from the most significant criterion to the criterion of the least significance. In that manner, we obtain the criteria ranked according to the expected values of weight coefficients:
where
n represents the total number of the criteria. If it is estimated that there are two or several criteria with the same significance, instead of the sign “>”, the sign “=” is placed in-between those criteria in the expression (10).
Step 3: Grouping the criteria according to the significance levels. Allow us to assume that experts have grouped the criteria as per levels in accordance with their preferences, depending on the significance of the criteria. Grouping criteria as per levels is performed according to the rules defined in the previous section of the paper, namely:
Level : At the level, the criteria from within the set S whose significance is equal to the significance of the criterion or up to two times as small as the significance of the criterion should be grouped. The criterion belonging to the level will be presented as ;
Level : At the level, the criteria from within the set S whose significance is exactly two times as small as the significance of the criterion or up to three times as small as the significance of the criterion should be grouped. The criterion belonging to the level will be presented as ;
Level : At the level, the criteria from within the set S whose significance is exactly k times as small as the significance of the criterion or up to k + 1 times as small as the significance of the criterion should be grouped. The criterion belonging to the level will be presented as .
By grouping criteria as per levels, rough expert preferences for the criteria from within the set are expressed. The precise definition of experts’ preferences is expressed via the significance of the criteria (). The boundary values of as per levels are presented in the next step.
Step 4: Defining the boundary values of the significance of criteria () as per levels. When defining the boundary values of the significance of criteria, the following relations should be adhered to:
Level : For , the values of the significance of criteria () range in the interval , i.e., ;
Level : For , the values of the significance of criteria () range in the interval , i.e., ;
Level : For , the values of the significance of criteria () range in the interval , i.e., .
Step 5: Presenting experts’ preferences as per levels. Based on the defined boundary values , experts express their preferences in accordance with the significance of the criteria. Every criterion within the level , is assigned the value . Therefore, since it is the most significant criterion, the criterion is assigned the value . The rest of the criteria are assigned appropriate values in compliance with the significances of the criteria. If the criterion has a greater significance than the criterion , then it is considered that , or if the criterion has a significance equal to that of the criterion , then it is considered that .
Step 6: Defining the
criteria significance functions. The
criteria significance function is defined in that manner. For each criterion
, it is possible to define a criteria significance function by applying the following expression:
where
,
represents the significance of the criterion assigned to the criterion
within the observed level, whereas
represents a real (natural) number.
Step 7: Calculating the optimal values of criteria weight coefficients. If the most influential criterion is marked as
, then, by applying the expression (12), it is possible for us to calculate the weight coefficient of the criterion
, i.e.,
where
represents the criteria significance function.
The weight coefficients of the remaining criteria from within the set
S are obtained by applying the following expression (13):
where
represents the function of the significance of criteria whose weight coefficient is being calculated, whereas
represents the functions of the significance of all criteria (without the function of the significance of the most significant criterion).
The application of all multi-criteria models is aimed at selecting an alternative with the best final value of the criteria function. The total value of the criteria function
fl (
l = 1,2,..,m) alternative
l can be obtained through the transformation of the NDSL model into a classical multi-criteria model by the application of the expression (14). By applying the simple additive weighted value function (14), which is the basic model for the majority of MCDM methods, the algorithm of the NDSL model transforms into a classical multi-criteria model, which can be used to evaluate
m alternative solutions as per
n optimization criteria.
where
represents the values of the weight coefficients, whereas
represents the values of the alternatives as per the optimization criteria in the decision-making initial matrix
.
3. Application of the NDSL Model
This section is a demonstration of the application of the presented model for solving a real-world problem. With the aim of understanding the presented algorithm as easily as possible, the application of the NDSL model for solving the simple problem of evaluating a car, which a large number of people are faced with every day, is presented. The subject matter of consideration was the problem of selecting an optimal car from a set of cars by applying a larger number of criteria. For the purpose of this study, the criteria defined in the study [
74] were considered.
The subject matter of consideration was the example in which the car buyer is evaluating the alternatives by observing the following five criteria: The quality (C1), the price (C2), convenience/comfort (C3), the safety level (C4), and the interior (C5). If we accept the condition that , i.e., N = 25, then we can determine the weight coefficients of the criteria by the NDSL model as follows:
Step 1: Determining the most significant criterion from within the set of criteria . Allow C1 to be selected as the most significant criterion;
Step 2: The criteria from within the set of criteria are ranked as follows: C2 > C1 = C4 > C3 > C5;
Step 3: Grouping the criteria as per significance levels. The criteria are grouped into sets at four levels, as follows:
At the first level, the criterion C2 is positioned as the most significant criterion, i.e., . Since it has been estimated that the significance of the remaining criteria is more than two times as small as that of the criterion C2, they are classified as the other significance levels. At the second level, there are the criteria C1 and C4, because they have been estimated to have a weight coefficient which is two to three times as small as that of the criterion C2, i.e., . The criterion C3 is at the third level, since its weight coefficient is three to four times as small as that of the criterion C2, i.e., . The criterion C5 is at the eighth level, since its weight coefficient has been estimated to be between eight and nine times as small as the weight coefficient of the most significant criterion (C2), i.e., ;
Step 4: Based on the relations for defining the boundary values of the criteria significance (
), we can determine the intervals for
at every significance level, as follows:
Step 5: Based on the defined intervals of the criteria significance (
), the experts’ preferences as per levels are presented:
Based on the presented values of , it is possible to conclude the following:
- (1)
For Level One: Since the criterion C2 is the most significant criterion, it has been assigned the value ;
- (2)
For Level Two: The criteria C1 and C4 have been estimated to have the same significance, which is exactly twice as small as the significance of the criterion C2, so they have been assigned the value ;
- (3)
For Level Three: The significance of the criterion C3 has been estimated to be slightly less than four times as small as the significance of the criterion C2, so it has been assigned the value ;
- (4)
For Level Eight: The significance of the criterion C5 has been estimated to be slightly more than eight times as small as the significance of the criterion C2, so it has been assigned the value ;
Step 6: By applying the expression (11), the functions of the significance of the criteria
,
, were defined as follows:
Step 7: Since the criterion C2 is defined as the most influential criterion, by applying the expression (12), it is possible to calculate the weight coefficient of the most significant criterion:
The weight coefficients of the remaining criteria are obtained by applying the following expression (13):
In that way, the vector of the weight coefficients is obtained.
4. Comparison and Discussion
In this section, based on the presented methodology, the advantages of the NDSL model that make the model a reliable and interesting multi-criteria model are singled out. The advantages of the NDSL model are presented through a comparison with known methodologies employed for the determination of criteria weight coefficients. The BWM and AHP methods were singled out for the purpose of the comparison, since the validity of both methodologies is based on the satisfaction of the condition of the transitivity of relations and a pairwise comparison. Additionally, other reasons for comparing the model with the BWM and AHP methods are the quality of the results and the widespread use of the BWM and AHP models by the scientific community for successfully solving numerous real world problems. Bearing in mind the fact that the NDSL model is methodologically based on an assessment of the comparative significance of criteria and satisfaction of the condition of transitivity, a comparison with the BWM and AHP models is a logical step for conducting a comparison of the results and validation of the model. In the following part, the application of the BWM and AHP methods is presented for the same example in which the NDSL model was tested in the previous chapter.
The algorithm of the BWM implies the formation of the Best-to-Others (BO) and the Others-to-Worst (OW) vector [
75]:
and
, respectively. By applying the BWM, the optimal values of the weight coefficients were obtained, namely,
,
, and a consistency ratio (CR)
CR = 0.00.Based on the data from [
75], a pairwise comparison matrix of the AHP model (
Table 1) was formed, and the values of the weight coefficients of criteria, with a consistency ratio CR = 0.029, were obtained.
By applying the AHP method, the values of the weight coefficients of criteria similar to those in the BWM were obtained, but with a significantly larger number of pairwise comparisons. The differences in the values of the weight coefficients between the AHP and BWM are a consequence of the incomplete consistency of the results in the AHP model (CR
AHP = 0.029 and CR
BWM = 0.000). A comparative presentation of the results of all three approaches is shown in
Table 2.
Table 2 allows us to notice that identical values of the weight coefficients of criteria were obtained by applying the BWM and NDSL models. By applying the AHP, the values obtained deviate to a certain extent from the weights of the BWM and NDSL models. The solution obtained by the AHP model is also acceptable, since the values of the consistency ratio are within the permitted boundaries, i.e., CR ≤ 0.1. We need to emphasize the fact that, by applying the BWM and NDSL models to this example, completely consistent results were obtained, which was also confirmed by the calculation made, i.e., CR
BWM = 0.00. Comparing criteria by applying a 9-degree scale (in the BWM), however, often leads to inconsistent results. Different from the BWM and AHP models, consistent results are always obtained when using the NDSL model because it applies an original methodology for grouping criteria as per significance, within which transitivity relations between criteria are retained. In the next part of the paper, a discussion is presented through a comparison of the NDSL model with the BWM and AHP models. The discussion aims to point to the limitations of the BWM and AHP models, which are eliminated by the application of the NDSL model. The discussion is organized through the following: (1) a comparative presentation of the number of criteria pairwise comparisons needed in the analyzed models; (2) the impact of the measuring scale on the results of the BWM, AHP, and NDSL models; (3) the consistency of the results of the analyzed models; (4) the problem of defining the best and worst criteria in the BWM and NDSL models; and (5) the problem of multi-optimality in the BWM.
In the AHP method, n(n − 1)/2 pairwise comparisons need to be made, whereas the algorithm of the BWM implies 2n − 3 comparisons. An increase in the number of criteria in the BWM and AHP models leads to a significant increase in the number of pairwise comparisons, through which the mathematical formulation of the mentioned models is, to a great extent, made more complex. This makes the validation of the results and the impossibility of obtaining satisfactory values of the CR more complex. On the other hand, in relation to the presented subjective models (the AHP method and BWM), the NDSL only requires an n − 1 comparison in pairs of criteria, so the mathematical formulation of the model is made more complex as the number of criteria increases. Apart from that, the presented methodology enables us to transfer mathematical transitivity as per significance levels, which produces maximally consistent results for the comparison.
In the case of a larger number of criteria (more than eight), it is difficult to obtain fully consistent results in the BWM and AHP models. That is a consequence of the small range of the 9-degree scale used in these models. The 9-degree scale limits the expression of experts’ preferences to a maximum ratio of 9:1. This limitation further imposes an inconsistency in comparisons. This assertion will be illustrated by the example of an evaluation of suppliers A, B, and C. If suppliers B and C differ from each other a little in terms of the quality of the delivery, the company has a possibility to assign them the values 9 and 8 when comparing them with supplier A. Now, given the fact that there is a small difference between suppliers B and C, that difference cannot consistently be expressed by means of the 9-degree scale. In that situation, there is no other possibility but to assign the value 1, through which the same significance is assigned to suppliers B and C [
76]. Another example is as follows: should alternative A be preferable to B, and should B be better than C (mark: 7), once A is compared with C, the highest available result is 9, which creates an inconsistency. Similar inconsistencies caused by the 9-degree scale also appear in the BWM, but can be eliminated by the implementation of different scales.
These inconsistencies in comparisons are eliminated in the NDSL model. The NDSL model applies a different logic for criteria comparison, which is performed in two steps. The first step involves grouping criteria according to the significance levels, whereas in the second step, an expert evaluation of criteria is carried out through the scale defined for every level individually. By forming a criteria significance level, the shortcoming of the predefined scale of values is eliminated. The NDSL model enables us to form the needed number of such levels, which implies that experts have a sufficient freedom to express the realistic advantages of the most significant criterion in relation to other criteria.
The results of the NDSL model do not require the consistency of the results to be checked because, in the first step of the model, weight coefficients are ranked in relation to the most significant criterion. Therefore, transitivity relations between criteria are formed in the first step. Those relations are retained throughout the model by forming a non-decreasing series as per significance levels, so the results of the model are simultaneously also always consistent. On the other hand, the BWM and AHP models require the consistency of solution(s) to be checked and validation of the results obtained. The 9-degree scale and a large number of comparisons frequently undermine the transitivity between criteria in both models, which leads to an increase in the CR and the boundary values being exceeded.
5. Conclusions
In this paper, a new model for determining the weight coefficients of criteria in multi-criteria models by forming a non-decreasing series at criteria significance levels (NDSL) is presented. The NDSL model involves forming a non-decreasing series based on criteria significance levels. The mathematical formulation of the NDSL model is systematized in the second section of the paper, and an algorithm, which is implemented through seven steps, is proposed. With the aim of presenting the applicability of the new model, its application in decision-making in a real-world problem is demonstrated. A comparison of the results of the NDSL model and the results of the BWM and AHP models is also presented in the paper. It was demonstrated through a comparison with the mentioned models that the NDSL model generates the same results as the existing models and enables elimination of the weaknesses that exist in the BWM and AHP models.
The NDSL model has several interesting characteristics that make it a robust and interesting model to apply in multi-criteria decision-making, namely due to the following facts: (1) the NDSL model requires a significantly smaller number of comparisons in pairs of criteria, only needing an n − 1 comparison, whereas the AHP requires an n(n − 1)/2 comparison and the BWM requires a 2n − 3 comparison; (2) the model enables us to obtain consistent results, even in the case of a larger number of criteria (more than nine criteria); (3) the NDSL model applies an original algorithm for grouping criteria as per significance levels, through which the shortcomings of the 9-degree scale applied in the BWM and AHP models are eliminated. In that way, the small range and inconsistency of the 9-degree scale are eliminated; (4) while the BWM includes defining a unique best/worst criterion, the NDSL model eliminates this limitation and gives decision-makers the freedom to express relationships between criteria in accordance with their preferences, irrespective of the number of best/worst criteria in the model.
The NDSL model represents a tool which helps managers cope with their own subjectivity when prioritizing criteria through a simple and logical algorithm. By employing the presented model, the appearance of the inconsistency of experts’ preferences is eliminated through an original algorithm requiring a small number of comparisons (n − 1). The authors believe that this approach gives experts the opportunity to express their preferences in a natural way, by forming the level of significance of criteria. Accordingly, it is expected that by forming the criteria significance level, the shortcomings and limitations that exist in predefined assessment scales are eliminated. For example, when comparing the best (CB) criterion with the Cx criterion, an expert knows that the CB criterion is 2.5 times more significant than the Cx criterion. In pairwise comparison methods that use the Saaty scale, such a relationship cannot be represented directly, since the Saaty scale involves only integer values. Through the formation of significance levels, the expert is given the opportunity to classify the Cx criterion as belonging to another level in a logical manner, or based on their preferences, since they already know that the CB criterion is 2.5 times more important than the Cx criterion. From this, we can conclude that the experts indirectly form the significance levels of the criteria. However, the mathematical formulation of existing models for pairwise comparisons requires experts to represent the significance of criteria by defining relationships over a numerical scale. In this way, criteria are indirectly grouped into levels of significance. However, such a procedure can lead to a misrepresentation of the significance of the criterion, which may be due to a misunderstanding of the mathematical apparatus of the method. Bearing all of the above in mind, the authors believe that this formulation of the interrelation between criteria enables the rational and logical expression of expert preferences, which further contributes to objective decision making.
Bearing in mind the mentioned advantages of the NDSL, there is a need for the development and implementation of software for real-world applications. Through such work, the model will be brought significantly closer to users and will enable the exploitation of all of the advantages mentioned in the paper. We also propose the application of the model in other real-world applications in which the NDSL model would be used with other developed MCDM tools. This limitation has already been eliminated. The authors developed a software solution in Microsoft Excel software while working on this study. One of the directions of future research studies should be working towards the extension of this model through the application of different theories of uncertainty, such as neutrosophic sets, fuzzy sets, rough numbers, grey theory, and so forth. The extension of the NDSL through the application of theories of uncertainty will enable the processing of experts’ preferences, even when comparisons are made based on partly known or even very little-known data. This would enable an easier expression of the decision-maker’s preferences, simultaneously respecting the subjectivities and shortcomings of information about certain phenomena.


 ,
, 
