Abstract
The thriving development of cross-regional e-commerce has gradually increased online marketing activities and consumers’ intention to shop online. The objective of this paper to find solutions for improving the advertising effectiveness has therefore become very important. In this article, an integrating method of fuzzy quality function deployment (FQFD) and fuzzy grey relational analysis (FGRA) was proposed to identify solutions for improving the advertising effectiveness. Based on this method, the house of quality (HoQ) to facilitate investigation of the 17 advertising effectiveness needs and 10 feasible technical improvements were presented. Through the questionnaire survey of platform users, the importance and satisfaction of the attributes of advertising needs were obtained. After that, a fuzzy relationship matrix was constructed to link technical improvements and advertising effectiveness needs in a fuzzy decision environment. Finally, the priority of technical improvements regarding improving advertising effectiveness were obtained. The results show that the proposed method can help decision makers of cross-regional e-commerce to improve advertising effectiveness effectively, so that they can effectively use resources to design advertisements that meet user needs.
1. Introduction
Online community shopping has become an irreplaceable part of everyday life. Community interactions have also gradually replaced traditional models of interaction between people for delivering messages and expressing opinions [1]. Consumers can use different types of platforms to communicate or buy products and services, which has led to the rise of social networking sites and social media. Internet communities have caused massive changes to advertising marketing and how information is disseminated. They have also transformed the limits of conventional marketing approaches. E-marketing targets Internet behavior to achieve marketing goals. Advertisers pay to display advertisements on websites as links or logos. Numerous online marketing tools are currently used, including word of mouth, videos, in-app advertisements, online activities, and social networks. Due to the advantages of new media—namely timeliness, reach, convenience, interactiveness, and online direct purchasing—web advertisements receive more attention than do traditional advertisements.
Ducoffe [2] stated that advertising value is an index measuring advertising effectiveness. He argued that the value of an advertisement is a subjective evaluation of the advertisement’s relative value to or effect on consumers, and measuring advertising value can assist businesses in evaluating advertising strategies and satisfying consumer needs. Among studies on advertising, Brackett and Carr [3] and Ducoffe [4] have argued that the advertising value of traditional media positively affects consumers’ attitude toward advertisements and purchasing behavior. In the past, traditional advertisements were received by consumers passively; however, current social media advertisements give consumers an active choice. Consumers primarily go online with a purpose and are no longer coerced to receive advertising messages but can choose whether to view advertising content. Therefore, using different marketing and advertising campaigns on social media platforms to attract consumer shopping turns website users into simultaneous consumers.
The recent development of cross-border e-commerce (CBEC) has grown rapidly. CBEC refers to international business activities conducted by transactional entities in different customs territories (where the same custom regulations and tariffs are implemented). This involves striking transactions and settling payments on an electronic business platform, then delivering the products and completing the transaction through cross-regional logistics. Current CBEC trade models are primarily business-to-business or business-to-consumer. According to Xinhua.net data [5], as of 2016, China has over 200,000 CBEB businesses and over 5000 e-commerce platforms. Similarly, Heel et al. [6] predicted that by 2025, global CBEC annual revenue may surge from $250 billion to $350 billion USD, and China and other Asian countries will account for 40% of total revenue. Therefore, the emergence of diverse e-commerce platforms on the market allows consumers to enjoy various consumer experiences and services. Among consumption patterns, buying and selling without borders has become the current new trend. From the description of the above information, it can be known that the thriving development of CBEB has gradually increased online marketing activities and the current market is fiercely competitive. Thus, how to increase the advertising value of online platforms to reinforce advertising effectiveness and users’ purchase intention in this competitive virtual shopping environment through effective web advertisements was the primary issue of this study.
There are numerous methods for quality improvement. However, a systematic approach which is simple and easy to understand will be easier accepted by practitioners. The common research method quality function deployment (QFD) covers various areas, for example, the performance improving, service quality improvement, for solving the logistics service selection problems, etc. [7,8,9,10,11]. Grey system theory proposed by Deng [12] can be used to tackle the relational analysis, prediction, control, and decision making problems of a system in which the model is unsure or the information is incomplete. It provides an efficient solution to the uncertainty, multi-input, and discrete data problems. The grey relational analysis (GRA) is one of the methods based on grey theory. The relation between machining parameters and machining performance can be found out using the GRA. It will indicate the relational degree between two sequences with the help of GRA. GRA has been widely used in supplier selection [13] or vendor selection analysis [14].
There are many tools used in multi-criteria decision-making. Common tools include rough sets [15], fuzzy sets [16], or neural networks [17]. Both rough sets and fuzzy sets can handle imperfect data, but the methods are different. Fuzzy sets emphasize the degree of vagueness of description information, while rough sets emphasize the indiscernibility, imprecision, and ambiguity of the data. Rough set research focuses on classification, and fuzzy set research focuses on the degree of membership. Therefore, the two different theories are not opposed to each other. They are complementary in processing imperfect data. Neural networks are mostly used for learning and induction from past data, which also can be used for decision making. In this study, we aim to develop an integrated method of fuzzy quality function deployment (FQFD) and fuzzy grey relational analysis (FGRA) was proposed to identify solutions for improving the advertising effectiveness. Cause of the uncertainty associated with the scenario in-formation for individual decision making and the fuzziness of human thinking, reasoning and perceptions mean the application of multiple criteria in the process. In other words, the fuzziness of environmental changes and human thinking should be described and presented in a fuzzy manner. The use of natural language can allow the appraisers to express their ideas freely with words and articulate the fuzziness in the decision-making process. This method provides a facilitate investigation of advertising effectiveness needs and feasible technical improvements were presented based on HoQ. After that, a fuzzy relationship matrix was constructed to link technical improvements and advertising effectiveness needs in a fuzzy decision environment by FGRA. Finally, the priority of technical improvements regarding improving advertising effectiveness were obtained to identifying the most critical solutions which are in urgent need for improvement provides a fast and efficient resource allocation. Therefore, the novelty of the proposed methodology is: (1) In the decision-making process, many professional decision makers establish the relationship matrix to reflect different views and reduce the bias effect. This will make the proposed method more realistic in the decision-making process. (2) Integrating FGRA technology for HoQ matrix correlation evaluation will make the results more objective. (3) The importance and satisfaction data obtained from actual survey will make the criterion weight of users’ needs more objective. The research questions of the paper are the following:
- (1)
- How to construct a systematic framework to help CBEC companies to follow the processes to fine the technical improvements for advertising effectiveness quality improvement.
- (2)
- How to extend the fuzzy QFD and fuzzy GRA methods to the multi-criteria decision evaluation of advertising effectiveness, so that it is closer to human thinking in the decision process.
- (3)
- How to identify the technical improvements under the condition with uncertain information and poor data.
This study makes four contributions to the advertising effectiveness quality improvement of CBEC. First, this approach that integrated the methods of FQFD and FGRA provides a systematic framework for decision makers to determine technical improvements before implementing advertising effectiveness quality improvement. Additionally, this paper will present CBEC advertising effectiveness evaluation criteria based on the related literature. Third, from the perspective of advertising value to propose technical improvements for improving advertising effectiveness. Finally, this study used an actual case to verify the proposed approach, which enables businesses to design advertisements based on their needs. These approach and criteria are rather practical and easy to popularize in this article. The paper is organized as follows. Section 2 presents the literature review, methodology is presented in Section 3. Case application and discusses are presented in Section 4 and Section 5. Finally, Section 6 presents the conclusions and suggestions for future research.
2. Literature Review and Methods
2.1. Perceived Advertising Value
The most common definition of perceived value was defined by Zeithaml [18] in which consumers form overall assessments of products or services by comparing their benefits and costs. Perceived value represents the balance between benefits and the sacrifices (such as money, time, and labor). Chen and Dubinsky [19] argued that perceived value is a key factor in consumer behavior and represents consumers’ overall value assessment. Thus, understanding the value perceptions of potential consumers is crucial, and consumers’ assessments of product attributes can provide a basis for determining product value. Perceived value is also subjective and relative [20]; therefore, customers’ perceived value can explain motivations behind consumer behavior from a rational perception angle [21]. Gallarza and Saura [22] also proposed perceived value for describing customers’ values because perceived value is synonymous with consumer value or customer value for consumer research methods. Generally, perceived value is difficult to conceptualize and measure because it originates in the essence of the value, which itself is an abstract concept with different meanings. Most of such meanings are economic—transactional value and perceived price—or psychological—perceptual and emotional influence on product purchases and brand choices [20]. Therefore, advertising value must either satisfy or exceed consumers’ expectations. If consumers believe the advertisement to be high value, consumers may gradually pay attention to their preferred advertisement and choose other similar advertisements. By contrast, perceptions of low value result in consumers ignoring the advertisement and even negative attitudes in response.
Ducoffe [2] defined perceived advertising value as consumers’ perception of online advertisements after receiving the advertising content, and perceptual antecedents can be standard for consumers determining whether advertisements have value and affect their purchase intention. Therefore, advertising content is a key success factor determining whether the advertisement draws consumers and receives feedback. Perceived advertising value comprises cognitive and emotional factors: Cognitive factors include perceptions of how informative the advertisement is, and emotional factors include entertainment and irritation. Informativeness is advertisements’ ability to inform consumers about product types. Irritation reflects the techniques advertisers use to annoy, offend, insult, or manipulate consumers and are considered harmful and may anger consumers. Third, entertainment seen as pleasant or enjoyable advertising can generate positive influences on brand attitude [2,23,24].
A goal of advertising is informing customers of new products or services [25] or product differences. Customers primarily use advertisements to receive product information. The informativeness of advertisements is a critical predictive index of advertising value and is critical to the effectiveness of web advertisements [4,24]. Sun et al. [26] discovered that the dimensions of informativeness and entertainment significantly affect consumer attitudes, and Martins et al. [27] proposed that factors affecting advertising value include informativeness, credibility, entertainment, irritation, and incentives. Kim and Han [23] divided advertising value into informativeness, credibility, entertainment, irritation, and incentives and emphasized that rewards require monetary or nonmonetary benefits. Monetary benefits include discounts, coupons, and gifts; and nonmonetary benefits include upgrades, status rewards, and priority services.
By summarizing these scholars’ discourses, we proposed the following factors of perceived advertising value related to the characteristics of e-commerce platforms.
(1) Information
Information is an incentive with value in the e-commerce environment because consumers’ reactions to advertisements are positive [28]. Ducoffe defined informativeness as the degree to which advertising can provide consumers with complete information on a product. The primary use of advertisements is to obtain information on products, and advertisers and marketers should prioritize consideration of the amount of information in advertisements. If advertisements can transmit complete information to consumers, they will be satisfied during the purchasing process [29]. Lee et al. [30], defined informativeness as advertisements’ ability to communicate product information to consumers, and informative content must include premiums, usability, and price. As consumers go online to collect massive amounts of product information before making a purchase, if advertising content can provide consumers with the information they want on products, it can assist consumers to make adequate decisions during purchases. This can improve the consumers’ attitude toward a website and increase their purchase intention [28]. Therefore, information volume and perceived advertising value are closely related [4].
(2) Entertainment
Ducoffe argued that advertisement designs allow consumers to feel comfort and pleasure when browsing, which substantiates the positive correlation between entertainment in advertisement messages and advertising value. Entertainment in advertisements provides consumers with an escape from reality, enjoyment, or emotional release to promote enjoyment and establish positive consumer attitudes [27,31,32]. Haghirian and Madlberger [33] argued that content with entertainment leaves a deep impression on customers to increase customer engagement and advertisement value [34]. Scharl et al. [35] proposed that if advertisements provide interesting and informative messages, consumers are likely to purchase the advertised product.
(3) Interactivity
Interactivity is key for establishing customer relationships, particularly interactive advertising and marketing communications [36]. Wang et al. [37] focused Ducoffe’s perceived advertising value model and discovered that interactivity was also a factor driving consumers’ perceptions of advertising value. They argued that interactivity in advertising could satisfy consumers’ needs while providing consumers with interpersonal interactions close to real life. Lu et al. [38] argued that interactivity is the high-level engagement and communication that the buyer perceives between the buyer and seller.
(4) Credibility
Credibility in advertising refers to the truthfulness and credibility of the brand or product proposition in advertisements determined by consumers [39]. It proposed that advertising credibility significantly affects the perceived value of advertising. The credibility of advertisement produces positive effects on attitude toward ad and behavioral intentions [40,41] and direct positive effects on customer ratings [40,42,43]. Consumers may ignore or not respond to advertisements if they feel the advertisement is not credible and ignore the message.
2.2. Advertising Effectiveness
The effects of advertising on consumer behavior have always been a process that is complex and difficult to clarify. Traditional methods of measuring advertising effects are based on consumer attitudes toward products and advertisements and consumer’s responses to a series of psychological and behavioral variables in advertisements. Petty and Cacioppo [44] proposed that advertising effectiveness is the result of using various approaches to measure the process of advertisements delivering messages to consumers. After advertisements are delivered to users, users must have a persistent emotional response—like or dislike—to the advertisement, which affect users’ exposure, attention, and response to advertisements. Advertising effectiveness is a paramount topic for advertising media and advertisers. Due to the different traits between the Internet and traditional media, online advertisers have developed different units for measuring online advertising effectiveness. However, no standards currently evaluate web advertisements or fair agency to establish measuring standards. Different definitions of Internet advertising effectiveness are currently used.
MacKenzie and Lutz [39] proposed that attitudes toward advertisements are when consumers form consistent responses identifying or not identifying with advertisements. Saadeghvaziri and Hosseini [45] discovered that the general attitude of advertisements affect consumers’ attitudes toward them. The theory behind the model in which attitude toward the advertisement serves as a mediator explains how consumers process information from a general hierarchy-of-effects framework with attitude toward the advertisement as a mediator. Each stage occurs gradually and represents the relationships between perception, attitude, and behavior. Elements of the model include consumers’ ad cognition, attitude toward the advertisement, brand cognition, attitude toward the brand, and purchase intention. Fishbein and Ajzen [46] divided attitude into three components: cognition, emotion, and desire. They argued that attitude affects consumer behavior through two factors: other people’s opinions and external environments. Attitude can also be the degree that consumers prefer something. When consumers simultaneously feel favorable toward an ad and need the product, a need variable is generated, and purchase intention is formed from that need. Mackenzie et al. [47] measured attitudes toward ads based on cognition and emotion, and consumers’ emotional and evaluative responses to advertising could be understood through measuring attitudes toward ads. Cognition refers to the degree of understanding and evaluation toward the advertisement, and emotion refers to the degree of liking the advertisement.
Overall, academic research has compiled four indexes for measuring the effects of traditional advertising: attitude toward the advertisement, attitude toward the brand, advertisement memory, and purchase intention [48]. Measuring the advertising effectiveness of web media is considerably technical, most scholars have measured advertising effectiveness in web media through the same approaches for measuring advertising effectiveness in traditional media. Therefore, this study’s basis for measuring advertisements used four advertising effectiveness dimensions in traditional media proposed by Ha [48], shown in Table 1.

Table 1.
Users’ advertising effectiveness perception.
2.3. Fundamentals of QFD
Quality function deployment (QFD) is a planning tool that is used to satisfy customer expectations. It was originally developed in 1972 in Japan, as a methodology to improve product quality implemented in business such as Mitsubishi, Toyota, and their suppliers [57]. It can translate customer requirements into engineering characteristics, process specifications, and production requirements [58]. In general, the QFD processes which is based on production will contain four levels [59], product planning, spare parts planning, process planning, and production planning. In other words, QFD will take note of the costumer’s needs to improve on the service quality or the development of new products [58]. QFD mainly uses House of Quality (HoQ) as the interface tool to expand. A HoQ gives detailed information about what customer needs and how these needs can be turned into design specifications to identify these needs [60]. HoQ’s basic structure is divided into six parts (Figure 1), including: (A) customer demand; (B) engineering analysis; (C) competitive analysis; (D) correlation analysis; (E) technology assessment; (F) the relationship matrix.
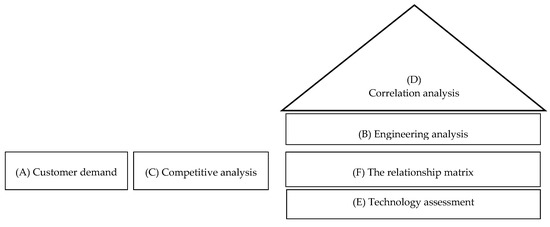
Figure 1.
House of Quality.
There are many successful QFD have been applied to a variety of problems such as library service [61], retail services [62], shipping companies [63]. Other than these studies, the following studies also utilized fuzzy sets: transportation management problem [15,64,65], supply chain management problem [66,67].
3. Methodology
Some concepts and research methods used in this article are briefly introduced in this section. We firstly present a research flowchart to explain the framework of the methodology (see Figure 2).
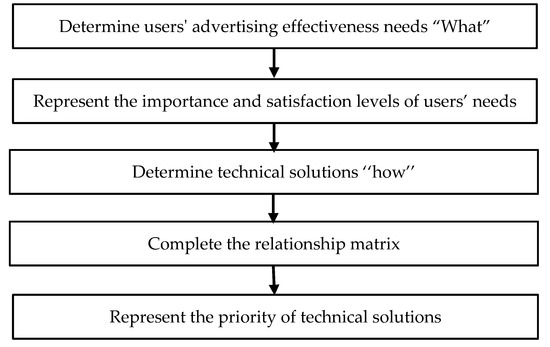
Figure 2.
Framework of the proposed methodology.
3.1. Triangular Fuzzy Number (TFN) and Operations
Fuzzy set theory was originally proposed by Zadeh [68]. It is an effective means to represent imprecise and vague data in the real world. Membership function is used to express a set and the value of a membership function lies between 0 and 1. In this study, we use a triangular fuzzy membership function to quantify the linguistic data in our study,
A TFN A can be denoted by the triplet (c, a, b), and its membership function is defined as
The parameter a gives the maximal grade of , i.e., fA(a) = 1 and it is the most possible value of the evaluated data. c and b are the lower and upper bounds of the available area for the evaluated data.
By the extension principle [68], the fuzzy addition, , and fuzzy multiplicationand , of two TFNs A1 = (c1, a1, b1) and A2 = (c2, a2, b2) are presented as follows:
3.2. Distance between Two TFNs
Chen and Hsieh [69] proposed geometrical distance based on the geometrical operation of trapezoidal fuzzy numbers [70]. In this paper, we utilized the modified geometrical distance with parameter p = 2 that can meet the concept of the classical distance in order to solve the distance between two TFNs. Based on the concept, the distance between two triangular fuzzy numbers and with distance parameter p = 2 can be denoted as ,
3.3. Linguistic Values
The concept of linguistic values is very useful in handling situations that are too complex or ill-defined to be reasonably described in conventional quantitative expressions [71]. In this paper, the appraisal of the imprecise relationship between each technical improvement and each advertising value request is represented by a linguistic value. The triangular fuzzy numbers defined on [0,1] and/or the linguistic values characterized by triangular fuzzy numbers defined on [0,1] are utilized to convey the suitability evaluation of alternatives versus criteria.
We can subjectively define the TFNs used to characterize the linguistic values before experts who participated in the QFD decision-making process. Herein, the appraisal set S = {Very low, Low, Medium, High, Very high} is employed. The TFNs corresponding to these linguistic values are Very low = (0, 0, 0.2), Low = (0, 0.2, 0.4), Medium = (0.3, 0.5, 0.7), High = (0.6, 0.8, 1), Very high = (0.8, 1, 1).
3.4. Fuzzy Grey Relational Analysis
The outline of FGRA [8,72] can be summarized as follows. Suppose the number of evaluation objects is n, the number of evaluation indexes is m. Let Yij = (cij, aij, bij) be the fuzzy evaluation values of object Fj for index Ci. The referential sequence Y0 = (Y10, Y20, …, Yi0, …, Yn0), the comparative sequence Yj = (Y1j, Y2j, …, Yij, …, Ynj), where .
(1) For benefit-index Ci
(2) For cost-index Ci
The sequence difference between Yi0 and Yij can be obtained by the Equation (5).
Next step is to calculate grey relational coefficient (GRC). The GRC is a numeric that can be used to assess grey relational level of comparative sequence and referential sequence at a designated observation point. The GRC, γ(Yi0, Yij), of Y0 and Yj at indicator Ci, can now be defined as
ξ is the distinguished coefficient (). It can be used to help make better distinction between normalized reference series and normalized comparative series. In general, ξ = 0.5 provides better results when the relative conditions among series and elements are uncertain.
The grey relational grade (GRG) in a comparative sequence Yj corresponding to referential sequence Y0 can be defined as
where Pi denotes the standardized weight () of indicator Ci.
3.5. Fuzzy Quality Function Deployment Approach
Since the technical improvements presented in this article are independent, a Japanese-style HoQ (eliminating the correlation matrix) will be employed to develop the procedures of this article. In this section, the five steps that integrating FQFD and FGRA approach for advertising value requires based on the HoQ planning matrix is established. Figure 3 presents the overall structure of the method.
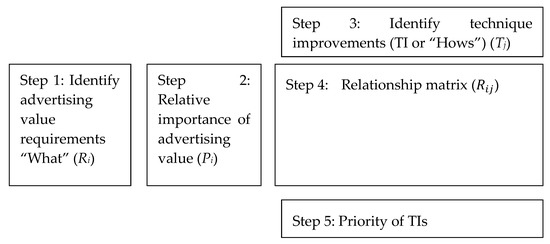
Figure 3.
Integrating fuzzy quality function deployment (FQFD) and fuzzy grey relational analysis (FGRA) approach for advertising effectiveness improving.
Step 1: Identification of “what” are advertising effectiveness requirements or VOCs.
In step one, the decision makers have first to decide the set of n requirements for customer needs. It means decision makers identify customer requirements and related technical requirements of the CEBC that influence the performance and satisfaction of advertisement in this research.
Step 2: Calculate the priorities of users’ needs for advertising effectiveness
The importance and satisfaction levels for each customer’s advertising value needs are surveyed by 5-point Likert scales in this article. It can evaluate the inconsistencies between perceived levels of importance and the satisfaction-related attributes of users’ needs. Then, calculate each weight of need and convert to standardized weight. The calculating concepts is based on the critical VOCs were those with higher importance levels and lower satisfaction levels, which implied that the advertising quality of the users’ needs in question should be improved. Therefore, importance and satisfaction will be considered together in the weight calculation process.
Let Iir and Sir, i = 1, 2,…, n; r = 1, 2, …, p be the importance and satisfaction levels given to advertising value need Ai by the rth respondent. The priority ratio of advertising value needs has a positive relationship with the importance, and has an inverse relationship with the satisfaction, therefore the priority ratio Wi of advertising value need Ai is
where T is the maximum value of the scale for evaluating the satisfaction levels. A 5-point Likert scale is used in this article, therefore the T = 5. The standardized priority ratio Pi of advertising effectiveness need Ai is
Step 3: Develop the technique improvements (TI) to meet the customer’s needs for advertising value
The technical improvements are the list of actions that can be implemented to improve the performance of the advertising value. The technical improvements are those related to how a firm (i.e., CEBC) is going to meet those customer wants. The technical improvements for enhancing the advertising value of CEBCs will be identified through relevant academic literature and experts’ suggestions.
Step 4: Determine the advertising effectiveness needs and TIs relationship matrix.
The relationship between each pair of advertising value needs and TIs explains the degree of influence that TIs can technically influence advertising value needs. The degree of influence between each pair can be evaluated by the experts in the related working area. The fuzzy relationship matrix can be used to describe the relationships of all advertising value needs and TIs follows the linguistic value of TFNs.
Let the degree of fuzzy relationship value evaluate between the advertising effectiveness need Ai, and the TIs Tj be by the experts Ek.
The fuzzy relationship strength Rij in the fuzzy relationship matrix can be obtained by , where
Since the TIs presented in this article are almost independent, the standard HoQ process of “how-how” relationship is excluded.
Step 5: Computing the GRG and obtain the priority of TIs.
After obtaining a fuzzy relationship matrix by step 4, the referential sequence and comparative sequences could be determined. Finally, according to the GRGs results and ranking, the TIs could be obtained.
4. Case Application
In this section, a case study advertising effectiveness enhancing is employed to demonstrate the computational processes described above. The applied FGQFD approach is empirically implemented as follows.
In this study, two kinds of questionnaires were designed to explore what are the customers’ needs for advertising effectiveness and how the technique requirements for improving the advertising effectiveness can be achieved. In the stage 1 survey, the questions are designed by using evaluation criteria of advertising effectiveness (Table 2) as basis, and 17 advertising effectiveness’s needs for CEBC were used to design the questionnaires. All responses were ranked on a five-point Likert-type scale anchored by the level of importance (satisfaction) such that 1 = very unimportant (very unsatisfied) and 5 = very important (very satisfied). This survey was distributed to 300 users of CEBC and 250 copies were returned. After inspection, a total of 225 valid questionnaires were recovered. The effective rate is 75%. From the results of demographic variables analysis in this study, women accounted for 61% of all respondents; age distribution of 26 to 40 years is 55.7%. Education is mostly university-based, showing a high level of education in the industry. Years of purchasing experience of 2–4 years accounts for 30.2%. Marital status, mostly unmarried persons (65.6%). Most have an annual income personal year of 600K dollars (27.7%).
Table 2.
Constructs, scale items, and standard weight of advertising effectiveness.
This study uses Cronbach’s α to measure internal consistency of variables. According to Guilfold (1971) who proposed, if Cronbach’s α is greater than 0.7 indicates a very high reliability. In this study, each scale’s reliability is 0.80 or more. It is showing that each scale has a very high reliability (as shown in Table 2). In addition, the dimensions and questions of the questionnaire are reviewed from relevant literatures and interviews with experts in related fields. Before the questionnaire was distributed, a total of 30 customers, the users of CEBC and academics were invited to revise the questions. Therefore, the questionnaire of this study has content validity. In the stage 2 survey, by combining the user’s needs and technique requirements, a relationship matrix table was constructed to evaluate the relationship strength. There are 6 CEBC managers and experts their work experience connected to Internet marketing.
Based on the steps described in Section 3, the tackling process and study results are summarized as follows:
Step 1: Identification of advertising effectiveness requirements or VOCs.
Following a review of the academic literature, from Section 2, consideration of the CEBC advertising effectiveness evaluation criteria, and consulting with specialist scholars and experts in advertising effectiveness. The four major aspects, attitude toward the advertisement, attitude toward the brand, advertisement memory, and purchase intention, including 17 attributes of advertising effectiveness for CEBC were are summarized and explained in Table 2.
Step 2: Calculate the priorities of customer’s needs for advertising effectiveness
The importance and satisfaction levels for each customer’s advertising effectiveness needs are surveyed by 5-point of the Likert scales in this article. It can evaluate the inconsistencies between perceived levels of importance and the satisfaction-related attributes of value needs. Then, calculate each weight of need and convert to standardized weight. Table 2 shows the results of importance weights (Ii) and satisfaction weights (Si) of all advertising effectiveness needs of customers. The original weights (Wi), and standardized weights (Pi) also can be obtained by the equ.11 and 12. From the result of satisfaction weights and importance weights, we can fine the cognitive satisfaction of the advertising effectiveness attributes is lower than the importance, so the performance improvement can be performed. The top five standardized weights item are: R15. Seeing the advertisement raised my interest in buying the product; R3. I think the way the advertisement was presented can effectively convey the message; R7. After seeing the advertisement, I like the advertised brand even more; R1. I was impressed by the advertisement; and R5. The advertisement is pleasing.
Step 3: Develop the technique improvements (TI) to meet the customer’s needs for advertising effectiveness
The technical improvements are the list of actions that can be implemented to improve the performance of the advertising value. The technical improvements are those related to how a firm (i.e., CEBC) is going to meet those customer wants. The technical improvements for enhancing the advertising value of CEBCs will be identified through relevant academic literature of Section 2 and the suggestions from the survey of 6 CEBC managers and experts their work experience connected to Internet marketing. Three suggested dimensions were obtained, with 4 constructs including 10 technical improvements for improving advertising effectiveness quality shown in Table 3.
Table 3.
The technical improvements.
Step 4: Determine the advertising effectiveness needs and TIs relationship matrix.
The relationship between each pair of advertising effectiveness needs and TIs explains the degree of influence that TIs can technically influence advertising effectiveness needs. By the second questionnaire, a relationship matrix combining the 17 users’ needs and 10 TIs for advertising effectiveness was constructed to assess the fuzzy relationship degree of each technical improvement versus each users’ needs. Five linguistic values characterized by TFNs were then used to gauge the fuzzy relationship strength of each users’ need Ai versus technical improvement Tj. The data obtained from the 6 respondents were used to compile a fuzzy relationship matrix (Equation (13)). Table 4 shows the fuzzy relationship matrix.
Table 4.
Fuzzy relationship matrix.
Step 5: Computing the GRG and obtain the priority of TIs.
After obtaining a fuzzy relationship matrix by step 4, the referential sequence (Y0) and comparative sequences D(Ri0,Rij) could be determined by Equation (6) and Equation (5), see Table 5. Finally, according to the GRGs results, Equation (10) and ranking GRGs, see Table 6 and Figure 4, the technical improvements could be obtained. The empirical results showed that the top 7 of the best technical improvements for enhancing CBEB advertising effectiveness are as follows: T10. The advertising content is true (Credibility); T1. The advertisement provides information relevant to the product (Informativeness); T3. The advertisement provides new and interesting content (Entertainment); T5. The advertisement is pleasing. (Entertainment); T7. The advertisement can interact with users (Interactivity); T8. The advertisement allows for user engagement (Interactivity); T9. The advertising content is trustworthy (Credibility).
Table 5.
Deviation sequences.
Table 6.
Grey relational coefficient.
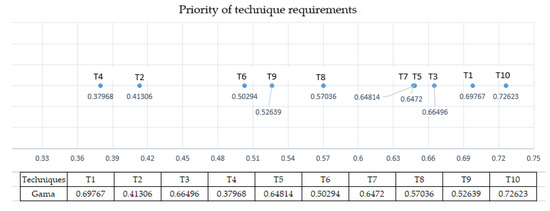
Figure 4.
Priority of technique requirements.
5. Discussion
In this study, techniques for improving and enhancing the quality of advertising effectiveness between e-commerce platforms and users were proposed by combining fuzzy quality function deployment (FQFD) and fuzzy grey relational analysis (FGRA). The top five techniques for improving advertising effectiveness were “10. The advertising content is true”, “1. The advertisement provides information relevant to the product”, “3. The advertisement provides new and interesting content”, “5. The advertisement is pleasing”, and “7. The advertisement can interact with users”. The recommendations for the quality improvements are as below:
5.1. Strengthening Customer Trust
Trust is crucial between businesses and consumers. Consumers’ trust must be considered during web advertising. For consumers, the first impression of the advertised product or company can develop a sense of truthfulness. Thus, advertising reliability is consumers’ first internal feeling toward a product or company and thus merits attention. Methods for reinforcing customers’ trust in advertising are: 1) Maintaining connections with customers, using informational devices to respond to customers’ suggestions anytime, and using automated functions to rapidly solve problems with high repetition rates—when customers browse advertisements on the desired product or raise questions, timely recommendations or responses can prevent a company’s reputation and credibility from being affected by customers losing patience or doubting the advertisement. 2) Recommending reliable products involves obtaining and analyzing the contents of clicked advertisements by using information technology to understand consumers’ habits, provide for customers’ needs in a timely and accurate manner, and reduce customers’ selection barriers. 3) Facing customers honestly by establishing customer trust and accounting for the strengths and weaknesses of offered products with accurate descriptions of product functions and specs is key, and advertisements that fail to honestly impart a product’s suitability severely affect the customers’ sense of trust. Finally, 4) ensuring the consistency of advertised messages enhances a brand’s value in consumers’ minds from consistency across advertised messages. Thus, businesses use various advertising and communication channels to convey company values through consistency across brand concepts, trademarks, and packaging.
5.2. Providing Product and Brand Information
Consumers can accelerate their understanding of products through web advertisement links or by searching for information online. Furthermore, after receiving and using the product, consumers can quickly share their experiences and product information on the Internet. Therefore, advertisements that vendors proactively release or alternative advertisements shared by consumers all provide product information. The lives of consumers nowadays are closely connected with the Internet, and many activities are conducted over the Internet; therefore, providing product advertisements on every platform that allows consumers to obtain information quickly is necessary. For instance, establishing a website to provide comprehensive product information through advertisements allows consumers to find products on the Internet. Another approach to providing advertising messages is establishing a membership system to enable businesses to understand consumer preferences through their purchase history and provide recommendations by pushing advertisements or shopping information. Furthermore, the greatest trait of online consumers is their love of sharing. The transition of passive acceptance in the past to the current trend of active engagement enables businesses to use this trait and allow consumers to share their opinions on websites, another product advertisement platform.
5.3. Providing New and Interesting Advertising Content
Cross-regional e-commerce has a large number of users with different traits. Knowing users’ interests and preferences is the biggest difference between e-commerce advertisements and past traditional advertising platforms. Therefore, beyond basic demographic variables such as age, gender, and area, target audiences can be specified by interest when designing advertisements. Specifying target audiences by interest can reduce marketing costs and generate effective advertisements because of precise audience targeting. Although consumers’ interests may not indicate intentions to purchase products, designing new and interesting content (headlines, visual elements, copywriting, and a clear call to action) or marketing combination (discount promotions, exclusive offers, or value propositions) increase consumers’ value perceptions. Consumers are then redirected to landing pages to increase the time in which consumers pay attention to the advertisement to achieve consumer conversion goals.
5.4. Pleasing Advertisements
Common strategies for effectively designing highly attractive advertising content or posts include visual elements, content relevance, value propositions, and a clear call to action. Visual advertisement design is a key task for modern people. While reading in particular, people tend to prefer visual messages over pure text in visual design. However, despite a preference for visual messages, consumers can easily dismiss product pictures. Pictures must be clear and easy to identify, and slogans on the image must be simple, mainly because users do not have the patience to finish reading excessive text, which may lead to mix-ups and loss of focus. Therefore, pleasing advertisements bring feelings of enjoyment to consumers. Furthermore, advertisements’ overall relevance is another key factor. The relevance of the advertisement components—visual elements, copywriting, and a call to action—should be ensured during creation to promote the product or brand. What values the company brand or product can provide customers or what problems can be resolved should be considered when presenting a value proposition. Finally, when consumers or visitors identify with advertisements and are willing to learn more about the product, a clear call to action guiding consumers toward landing pages is the most critical step.
5.5. Interactive Advertisements
Interactive advertisements use interactive media, either online or offline, for sales promotions and thereby affect consumers’ buying decisions. Compared with traditional advertising content marketing, which focuses on one-way or passive approaches, interactive content drives consumers to actively enter preplanned advertising content. The interactive content can provide information through easily absorbable and understandable approaches, which enable consumers to obtain immediate results that are highly relevant to themselves. Many types of interactive content, including interactive games, tests, and dynamic catalogues, are often used during the initial stage of learning about a product. Information charts or e-books provided during the customer consideration period assist with product configuration or plans to accelerate customers’ purchasing behavior.
The key to interactive execution is to reinforce the memory of the advertised product in a competitive market by transforming words into a form that consumers can quickly grasp and that rapidly captures consumers’ attention. Businesses can use interactive approaches to encourage active engagement by consumers, which naturally extends the time that consumers spend on websites and develop feelings and trust for products. Interactive approaches may even achieve social marketing diffusion through sharing on social networking sites.
6. Conclusions
Scholars have prevalently used statistical analyses and models to examine the effect on improving advertising effectiveness and provide a further understanding of factors that influence advertising performance. However, guiding businesses to use relevant techniques to improve advertising effectiveness under limited resources requires an objective and coherent evaluation model to aid decision-making. Therefore, this study used advantages from triangular fuzzy numbers to process the uncertainty of human opinions. This facilitated the design of a new approach based on FQFD and FGRA to select techniques for improving advertising effectiveness. QFD typically focuses on the product design process that effectively transforms customer needs into design requirements.
In this study, the method integrated FQFD and FGRA and designed five steps to obtain the priority of technical solutions. The analysis of advertising effectiveness improvement revealed that platform users focused on five dimensions: the truthfulness of advertising content, whether the advertisement provides information relevant to the product and brand, whether the advertisement provides new and interesting content, whether the advertisement is pleasing, and whether the advertisement can interact with users.
The methods proposed in this study provided the following theoretical and practical contributions for cross-regional e-commerce platform managers and advertisement designers:
- (1)
- The proposed application of the FQFD model for improving advertising effectiveness is novel and original.
- (2)
- When the management team improves performance, the model provides a TI priority reference.
- (3)
- While adopting a classic FQFD framework and referencing advertising effectiveness indices, a practical model is developed in this paper from expert and business suggestions.
- (4)
- This study used an actual case to verify the proposed approach, which enables businesses to design advertisements based on their needs.
This study has two limitations as follows. First, the CBEC enterprise should be able to identify the TIs that can be really implemented in the company. Second, if the CEBC enterprise does not have sufficient capabilities or professional knowledge to evaluate the relationship between whats and hows, it will consequently affect the priority list of TIs to be implemented and cause the company to fail to achieve the quality improvement goals. Suggestions for further research are as follows. First of all, we can consider technical improvement capabilities to design TIs which will be more suitable for the needs of users. Secondly, this article only applies the proposed method to CBEC case studies. It should be able to try to be practically applied in various situations in many industries. Finally, this study uses fuzzy theory as the calculation tool to design the method, and then it can be carried out using rough theory or neural networks methods.
Funding
This research received no external funding.
Conflicts of Interest
The authors declare no conflicts of interest.
References
- Choi, T.R.; Sung, Y. Instagram versus Snapchat: Self-expression and privacy concern on social media. Telemat. Inform. 2018. [Google Scholar] [CrossRef]
- Ducoffe, R.H. How consumers assess the value of advertising. J. Curr. Issues Res. Advert. 1995. [Google Scholar] [CrossRef]
- Brackett, L.K.; Carr, B.N. Cyberspace advertising vs. other media: Consumer vs. mature student attitudes. J. Advert. Res. 2001. [Google Scholar] [CrossRef]
- Ducoffe, R.H. Advertising value and advertising on the web. J. Advert. Res. 1996, 36, 21–35. [Google Scholar]
- Xinhuanet, Cross-border E-commerce to Boost Chinese Foreign Trade. Available online: http://news.xinhuanet.com/english/2016-01/07/c_134987430.htm (accessed on 1 December 2018).
- Heel, B.V.; Lukic, V.; Leeuwis, E. Cross-border E-commerce Makes the World Flatter; The Boston Consulting Group: Boston, MA, USA, 2014. [Google Scholar]
- Chou, T.Y. Identifying techniques for improving Chinese Guanxi quality of ocean freight forwarder in Taiwan. J. Mar. Sci. Technol. 2018, 26, 207–216. [Google Scholar]
- Chen, C.Y.; Ding, J.F.; Liang, G.S.; Chou, T.Y. Applying fuzzy grey quality function deployment to identify solutions for improving safety of container terminal loading and unloading operations. J. Eng. Marit. Environ. Part M 2016, 232, 276–292. [Google Scholar] [CrossRef]
- Dinarvandi, M.; Jafari, H.; Mohamadi, M.; Hosseini, A. Improving the quality of service to the Urban environment for sustainable development. Procedia Soc. Behav. Sci. 2014, 120, 487–495. [Google Scholar] [CrossRef][Green Version]
- Liao, C.N.; Kao, H.P. An evaluation approach to logistics service using fuzzy theory, quality function development and goal programming. Comput. Ind. Eng. 2014, 68, 54–64. [Google Scholar] [CrossRef]
- Liang, G.S.; Chou, T.Y.; Kan, S.F. Applying fuzzy quality function deployment to identify service management requirements for ocean freight forwarder. Total Qual. Manag. Bus. Excell. 2006, 17, 539–556. [Google Scholar] [CrossRef]
- Deng, J. Introduction to grey system. J. Grey Syst. 1989, 1, 1–24. [Google Scholar]
- Davood, G.; Mahour, M.P. Developing a grey-based decision-making model for supplier selection. Int. J. Prod. Econ. 2012, 137, 191–200. [Google Scholar]
- Dou, Y.; Zhu, Q.; Sarkis, J. Evaluating green supplier development programs with a grey-analytical network process-based methodology. Eur. J. Oper. Res. 2014, 233, 420–431. [Google Scholar] [CrossRef]
- Stankovic, M.; Gladovic, P.; Popovic, V. Determining the importance of the criteria of traffic accessibility using fuzzy AHP and rough AHP method. Decis. Mak. Appl. Manag. Eng. 2019, 2, 86–104. [Google Scholar] [CrossRef]
- Kang, H.Y.; Lee, A.H.I.; Chan, Y.C. An Integrated Fuzzy Multi-Criteria Decision-Making Approach for Evaluating Business Process Information Systems. Mathematics 2019, 7, 982. [Google Scholar] [CrossRef]
- Golmohammadi, D. Neural network application for fuzzy multi-criteria decision making problems. Int. J. Prod. Econ. 2011, 131, 490–504. [Google Scholar] [CrossRef]
- Zeithaml, V.A. Consumer perceptions of price, quality and value: A means-end model and synthesis of evidence. J. Mark. 1988, 52, 2–22. [Google Scholar] [CrossRef]
- Chen, Z.; Dubinsky, A.J. A Conceptual Model of Perceived Customer Value in E-Commerce: A Preliminary Investigation. Psychol. Mark. 2003. [Google Scholar] [CrossRef]
- Gallarza, M.G.; Saura, I.G.; Holbrook, M.B. The value of value: Further excursions on the meaning and role of customer value. J. Consum. Behav. 2011. [Google Scholar] [CrossRef]
- Abdullah, D.; Jayaraman, K.; Kamal, S.B.M. A Conceptual Model of Interactive Hotel Website: The Role of Perceived Website Interactivity and Customer Perceived Value Toward Website Revisit Intention. Procedia Econ. Financ. 2016. [Google Scholar] [CrossRef]
- Gallarza, M.G.; Saura, I.G. Value dimensions, perceived value, satisfaction and loyalty: An investigation of university students’ travel behaviour. Tour. Manag. 2006. [Google Scholar] [CrossRef]
- Kim, Y.J.; Han, J. Why smartphone advertising attracts customers: A model of Web advertising, flow, and personalization. Comput. Hum. Behav. 2014. [Google Scholar] [CrossRef]
- Wang, Y.; Sun, S. Examining the role of beliefs and attitudes in online advertising. Int. Mark. Rev. 2010. [Google Scholar] [CrossRef]
- Kotler, P.; Keller, K.L. Marketing Management: An Asian Perspective, 5th ed.; Prentice Hall: New York, NY, USA, 2008. [Google Scholar]
- Sun, Y.; Lim, K.H.; Jiang, C.; Peng, J.Z.; Chen, X. Do males and females think in the same way? An empirical investigation on the gender differences in Web advertising evaluation. Comput. Hum. Behav. 2010, 26, 1614–1624. [Google Scholar] [CrossRef]
- Martins, J.; Costa, C.; Oliveira, T.; Gonçalves, R.; Branco, F. How smartphone advertising influences consumers’ purchase intention. J. Bus. Res. 2019, 94, 378–387. [Google Scholar] [CrossRef]
- Aitken, R.; Gray, B.; Lawson, R. Advertising effectiveness from a consumer perspective. Int. J. Advert. 2008, 27, 279–297. [Google Scholar] [CrossRef]
- Petrovici, D.; Marinov, M. Determinants and antecedents of general attitudes towards advertising: A study of two EU accession countries. Eur. J. Mark. 2007, 41, 307–326. [Google Scholar] [CrossRef]
- Lee, D.; Hosanagar, K.; Nair, H.S. The Effect of Social Media Marketing Content on Consumer Engagement: Evidence from Facebook; Stanford Graduate School of Business: Stanford, CA, USA, 2014. [Google Scholar]
- Elliott, M.T.; Speck, P.S. Factors that affect attitude toward a retail web site. J. Mark. Theory Pract. 2005. [Google Scholar] [CrossRef]
- McQuail, D. Media Accountability and Freedom of Publication; Oxford University Press: Oxford, UK, 2003. [Google Scholar]
- Haghirian, P.; Madlberger, M. Consumer Attitude Toward Advertising via Mobile Devices—An Empirical Investigation Among Austrian Users. In Proceedings of the 13th European Conference on Information Systems, Information Systems in a Rapidly Changing Economy, Regensburg, Germany, 26–28 May 2005. [Google Scholar]
- Liu, C.L.E.; Sinkovics, R.R.; Pezderka, N.; Haghirian, P. Determinants of Consumer Perceptions toward Mobile Advertising—A Comparison between Japan and Austria. J. Interact. Mark. 2012. [Google Scholar] [CrossRef]
- Scharl, A.; Dickinger, A.; Murphy, J. Diffusion and success factors of mobile marketing. Electron. Commer. Res. Appl. 2005, 4, 159–173. [Google Scholar] [CrossRef]
- Tan, G.W.H.; Lee, V.H.; Hew, J.J.; Ooi, K.B.; Wong, L.W. The interactive mobile social media advertising: An imminent approach to advertise tourism products and services? Telemat. Inform. 2018. [Google Scholar] [CrossRef]
- Wang, C.; Zhang, P.; Choi, R.; D’Eredita, M. Understanding Consumers Attitude toward Advertising. In Proceedings of the Eighth Americas Conference on Information Systems, Dallas, TX, USA, 15–17 August 2002. [Google Scholar]
- Lu, B.; Fan, W.; Zhou, M. Social presence, trust, and social commerce purchase intention: An empirical research. Comput. Hum. Behav. 2016. [Google Scholar] [CrossRef]
- MacKenzie, S.B.; Lutz, R.J. An empirical examination of the structural antecedents of attitude toward the ad in an advertising pretesting context. J. Mark. 1989, 53, 48–65. [Google Scholar] [CrossRef]
- Tsang, M.M.; Ho, S.C.; Liang, T.P. Consumer attitudes toward mobile advertising: An empirical study. Int. J. Electron. Commer. 2004, 8, 65–78. [Google Scholar] [CrossRef]
- Zhang, J.; Mao, E. Understanding the acceptance of mobile SMS advertising among young Chinese consumers. Psychol. Mark. 2008, 25, 787–805. [Google Scholar] [CrossRef]
- Choi, Y.K.; Hwang, J.; McMillan, S.J. Gearing up for mobile advertising: A cross-cultural examination of key factors that drive mobile messages home to consumers. Psychol. Mark. 2008, 25, 756–768. [Google Scholar] [CrossRef]
- Choi, S.M.; Rifon, N.J. Antecedents and consequences of web advertising credibility: A study of consumer response to banner ads. J. Interact. Advert. 2002, 3, 12–24. [Google Scholar] [CrossRef]
- Petty, R.E.; Cacioppo, J.T. Attitude and Persuasion: Classic and Contemporary Approaches; Westview Press: Dubuque, IA, USA, 1981. [Google Scholar]
- Saadeghvaziri, F.; Hosseini, H. Mobile advertising: An investigation of factors creating positive attitude in Iranian customers. Afr. J. Bus. Manag. 2011, 5, 394–404. [Google Scholar]
- Fishbein, M.; Ajzen, I. Brief, Attitude, Intention and Behavior: An. Introduction to Theory and Research Reading; Addison-Wesley: Boston, MA, USA, 1980. [Google Scholar]
- MacKenzie, S.B.; Lutz, R.J.; Belch, G.E. The role of attitude toward the ad as a mediator of advertising effectiveness: A test of competing explanations. J. Mark. Res. 1986, 23, 130–143. [Google Scholar] [CrossRef]
- Ha, L. Observations: Advertising clutter in consumer magazines: Dimensions and effects. J. Advert. Res. 1996, 36, 76–84. [Google Scholar]
- Napoli, J.; Ewing, M.T. The net generation: An analysis of lifestyles, attitudes and media habits. J. Int. Consum. Mark. 2001, 13, 21–34. [Google Scholar] [CrossRef]
- Baker, M.J.; Churchill, G.A. The impact of physically attractive models on advertising evaluations. J. Mark. Res. 1977, 14, 538–555. [Google Scholar] [CrossRef]
- Ferraro, R.; Kirmani, A.; Matherly, T. Look at me! Look at me! conspicuous brand usage, self-brand connection, and dilution. J. Mark. Res. 2013, 50, 477–488. [Google Scholar] [CrossRef]
- Burner, G., II. Web commercial and advertising hierarchy of effects. J. Advert. Res. 2000, 20, 35–45. [Google Scholar] [CrossRef]
- Mitchell, A.A.; Olson, J.C. Are product attribute beliefs the only mediator of advertising effects on brand attitude? J. Mark. Res. 1981, 18, 318–332. [Google Scholar] [CrossRef]
- Norris, C.E.; Colman, A.M. Context effects on recall and recognition of magazine advertisements. J. Advert. 1992, 21, 37–46. [Google Scholar] [CrossRef]
- Bezjian-Avery, A.A.; Bobby, J.C.; Dawn, L. New Media Interactive Advertising Vs. Traditional Advertising. J. Advert. Res. 1998, 38, 23–32. [Google Scholar]
- Park, D.H.; Lee, J.; Han, I. The effect of on-line consumer reviews on consumer purchasing intention: The moderating role of involvement. Int. J. Electron. Commer. 2007, 11, 125–148. [Google Scholar] [CrossRef]
- Akao, Y. Quality Function Deployment: Integrating Customer Requirements into Product Design; Productivity Press: Cambridge, MA, USA, 1990. [Google Scholar]
- Wu, Y.H.; Chung, C. Integration of green quality function deployment and fuzzy theory: A case study on green mobile phone design. J. Clean. Prod. 2015, 108, 271–280. [Google Scholar] [CrossRef]
- Hauser, J.; Clausing, D. The House of Quality. Harv. Bus. Rev. 1988, 66, 63–73. [Google Scholar]
- Kurtulmusoglu, F.B.; Pakdil, F.; Atalay, K.D. Quality improvement strategies of highway bus service based on a fuzzy quality function deployment approach. Transp. A Transp. Sci. 2016, 12, 175–202. [Google Scholar] [CrossRef]
- Chen, Y.T.; Chou, T.Y. Applying GRA and QFD to improve library service quality. J. Acad. Librariansh. 2011, 37, 237–245. [Google Scholar] [CrossRef]
- Trappey, C.V.; Trappey, A.J.; Hwang, S.J. A computerized quality function deployment approach for retail services. Comput. Ind. Eng. 1996, 30, 611–622. [Google Scholar] [CrossRef]
- Lam, J.S.L.; Lai, K.H. Developing environmental sustainability by ANP-QFD approach: The case of shipping operations. J. Clean. Prod. 2015, 105, 275–284. [Google Scholar] [CrossRef]
- Deveci, M.; Öner, S.C.; Canıtez, F.; Öner, M. Evaluation of service quality in public bus transportation using interval-valued intuitionistic fuzzy QFD methodology. Res. Transp. Bus. Manag. 2019. [Google Scholar] [CrossRef]
- Pandey, M.M. Evaluating the strategic design parameters of airports in Thailand to meet service expectations of Low-Cost Airlines using the Fuzzy-based QFD method. J. Air Transport. Manag. 2020. [Google Scholar] [CrossRef]
- Wang, H.; Fang, Z.; Wang, D.; Liu, S. An integrated fuzzy QFD and grey decision-making approach for supply chain collaborative quality design of large complex products. Comput. Ind. Eng. 2020. [Google Scholar] [CrossRef]
- Akkawuttiwanich, P.; Yenradee, P. Fuzzy QFD approach for managing SCOR performance indicators. Comput. Ind. Eng. 2018, 112, 189–201. [Google Scholar] [CrossRef]
- Zadeh, L.A. Fuzzy Sets. Inf. Control 1965, 8, 338–353. [Google Scholar] [CrossRef]
- Chen, S.H.; Hsieh, C.H. Representation, ranking, distance, and similarity of L-R type fuzzy number and application. Aust. J. Intell. Process. Syst. 2000, 6, 217–229. [Google Scholar]
- Heilpern, S. Representation and application of fuzzy numbers. Fuzzy Sets Syst. 1997, 91, 259–268. [Google Scholar] [CrossRef]
- Zadeh, L.A. The Concept of a Linguistic Variable and its Application to Approximate Reasoning, Parts 1, 2, and 3. Inf. Sci. 1975, 8, 199–249. [Google Scholar] [CrossRef]
- Liao, M.S.; Liang, G.S.; Chen, C.Y. Fuzzy grey relation method for multiple criteria decision-making problems. Qual. Quant. 2013, 47, 3065–3077. [Google Scholar] [CrossRef]
© 2020 by the author. Licensee MDPI, Basel, Switzerland. This article is an open access article distributed under the terms and conditions of the Creative Commons Attribution (CC BY) license (http://creativecommons.org/licenses/by/4.0/).