1. Introduction
Lambert and Sharma [
1] presented the performance evaluation matrix (PEM) for operating systems that collect users’ or customers’ perceptions. Compared with other assessment methods that need complicated data comparison, the PEM makes it easy to determine which service items most urgently require improvement, maintenance, or adjustment. This is achieved by locating the items according to (1) customer satisfaction with the items as they are and (2) how important the customers deem them. The PEM is widely applied for performance evaluation and improvement in a range of industries and institutions [
2,
3,
4,
5,
6,
7,
8]. In the PEM, customer perception of the importance of an item is represented by the vertical axis, and customer satisfaction with the item itself is represented by the horizontal axis. Each axis is cut into three equal shares, forming a three by three matrix with nine performance blocks. The three performance areas on the diagonal are regarded as maintenance areas because their importance and satisfaction are equal; the three performance areas on the upper-left are regarded as improvement areas because their importance level is higher than customers’ satisfaction level; and the three areas on the lower-right are viewed as adjustment areas because their satisfaction rating is higher than their importance.
In order to make the PEM more applicable, Hung, Huang, and Chen [
9] altered the position of the performance areas in the PEM to rationalize the evaluation principles. They divided the PEM into three equally-sized performance areas. The three performance areas are the following: the upper-left one is improvement, the middle one is maintenance, and the lower-right one is the adjustment area. Satisfaction and importance are viewed as random variables and submitted to the beta allocation. The importance and satisfaction indices are thereby standardized with values between zero and one. Hung, Huang, and Chen [
9] also suggested that the conventional method of the PEM was subject to sampling error. They therefore proposed deriving the joint confidence interval of the importance and satisfaction indices based on the central limit theorem and replacing the point estimates of the PEM with these joint confidence intervals. Although this method overcomes sampling error, it is complicated and difficult to use [
4,
6,
9].
In addition to sampling error, another limitation encountered by the PEM is that customer or user opinions are often fuzzy [
6,
10,
11,
12]. Therefore, Wang et al. [
6] proposed a fuzzy semantic scale for practical application and also constructed a convenient and comprehensive calculation method. However, while this enables the collection of data that is closer to the feelings of the interviewees, it increases the quantity of data as well as the complexities of collection. Consequently, Yu, Chang, and Chen [
13] as well as Chen et al. [
14] revised and simplified the data collection and calculation of the fuzzy semantic scales. Their modifications include the Likert scale, which is easy to use, but data collection for the fuzzy semantic scale remains relatively complicated.
In order to overcome the above limitations, we check the fuzzy testing method of Buckley [
15], Chen et al. [
16], Lee et al. [
17], and Sarkar et al. [
18]. The method in this paper was extended from the ones in the stated-above three papers. It is based on calculated confidence intervals to construct the triangular shaped fuzzy number similar to the triangular fuzzy number mentioned by Sarkar et al. [
18] and meets the requirements. However, values of the two points of the triangular fuzzy number are fixed, ones of the two points of triangular shaped fuzzy number are changeable. Besides, industries consider the cost benefit and control the timeliness and effectiveness, their samples are not too numerous [
19]. The method in this paper utilizes confidence intervals as the foundation. It not only reduces the risk of misjudgment arising from sampling errors, but also makes the more accurate decision. First, the satisfaction index of each service item is checked to determine whether it is below the mean (i.e., requiring improvement). Second, the importance index of items requiring improvement is tested to determine whether they are above the mean. In cases of limited resources, service items that are the most important are prioritized for improvement. The strengths of Buckley’s fuzzy test are that it maintains the plain format of the Likert scale while deducing the confidence interval from the importance and satisfaction indices to create the fuzzy membership function of the two indexes; and through fuzzy hypothesis testing, it distinguishes items regarded critical to quality. We demonstrate the efficacy of the method through the presentation of a case study of a computer-assisted language learning (CALL) system.
The rest of this paper is organized as the following.
Section 2 illustrates the theoretical model developed by Hung et al. [
9], including definition of two evaluation indexes and their properties.
Section 3 refers to the confidence interval of the satisfaction index in
Section 2 to create a fuzzy membership function. A fuzzy testing criterion is proposed to evaluate whether the satisfaction index of each service item is below the mean. In
Section 4, we construct the fuzzy membership function from the confidence interval of the importance index defined in
Section 2 and propose a fuzzy testing criterion to evaluate whether the importance index is above the mean. A case study of a CALL system illustrates employment of the method in
Section 5. In
Section 6, we present our conclusions.
2. Performance Indices
For the sake of generality, we follow the example of Hung et al. [
9] in this study and assume that there are q service items and each service item is measured by two questions (one for importance and one for satisfaction). This creates a total of 2 q questions. Hung et al. [
9] also assumed that these ratings follow beta distributions. Therefore, this study takes random variables
and
respectively to represent the distributions associated with importance and satisfaction. The importance and satisfaction indices can be shown as the following:
As noted by Hung et al. [
9], index
is between 0 and 1. More than half of customers are satisfied if index
exceeds 0.50, when more than half of customers are dissatisfied if index
is below 0.50. Thus, higher values for index
reflect higher levels of customer satisfaction. Index
behaves similarly. Index
is used as the horizontal axis and index
as the vertical axis to construct the performance evaluation matrix. Since the indices have unknown parameters, they must be estimated from sample data. If
n customers are interviewed, the sample data of satisfaction and importance can be shown as the following:
Satisfaction sample matrix: ,
Importance sample matrix: .
The estimator of satisfaction index
and the estimator of importance index
can be shown separately, as the following:
and
In addition, the standard deviation of these two indices can be expressed respectively, as the following:
and
The expected values of
and
can be expressed respectively, as the following:
where
Obviously, and are unbiased estimators of and separately.
If we let
and
then by the
Central Limits Theorem (
CLT),
and
are distributed as
for
; that is
3. Fuzzy Hypothesis Testing for Satisfaction Index
If we let
, then the data matrix of random variable
can be shown as
then the observation values for the means, standard deviations, and
of each satisfaction service item can be expressed as the following:
Chen et al. [
14] drew on the concept of ceaseless improvement promoted by total quality management and set
as the mean for all the satisfaction index as the following:
When the satisfaction index of service item
i is higher than the mean (
), service item
i does not require improvement. The following hypothesis test is equivalent:
This leads to the following test statistic:
The critical region is
where
is determined by
Thus, the critical value
can be shown as the following:
where
is the significance level and the decision rule is as the following:
(1) Reject if (i.e., service item i needs improvement),
(2) Do not reject if (i.e., service item i does not need improvement).
Since
is distributed as
for
,
Since the observed value of
is
, the observed value of
confidence intervals of
is
where
is the upper
quintiles of
. According to Buckley [
15] and Chen et al. [
16], the
of triangular fuzzy number
is
Obviously, when
, then
. Thus, the triangular fuzzy number of
is
where
Then the fuzzy membership function of
is
Similarly to
, the
of triangular fuzzy number
is
The triangular shaped fuzzy number
is
where
Then the fuzzy membership function of
is
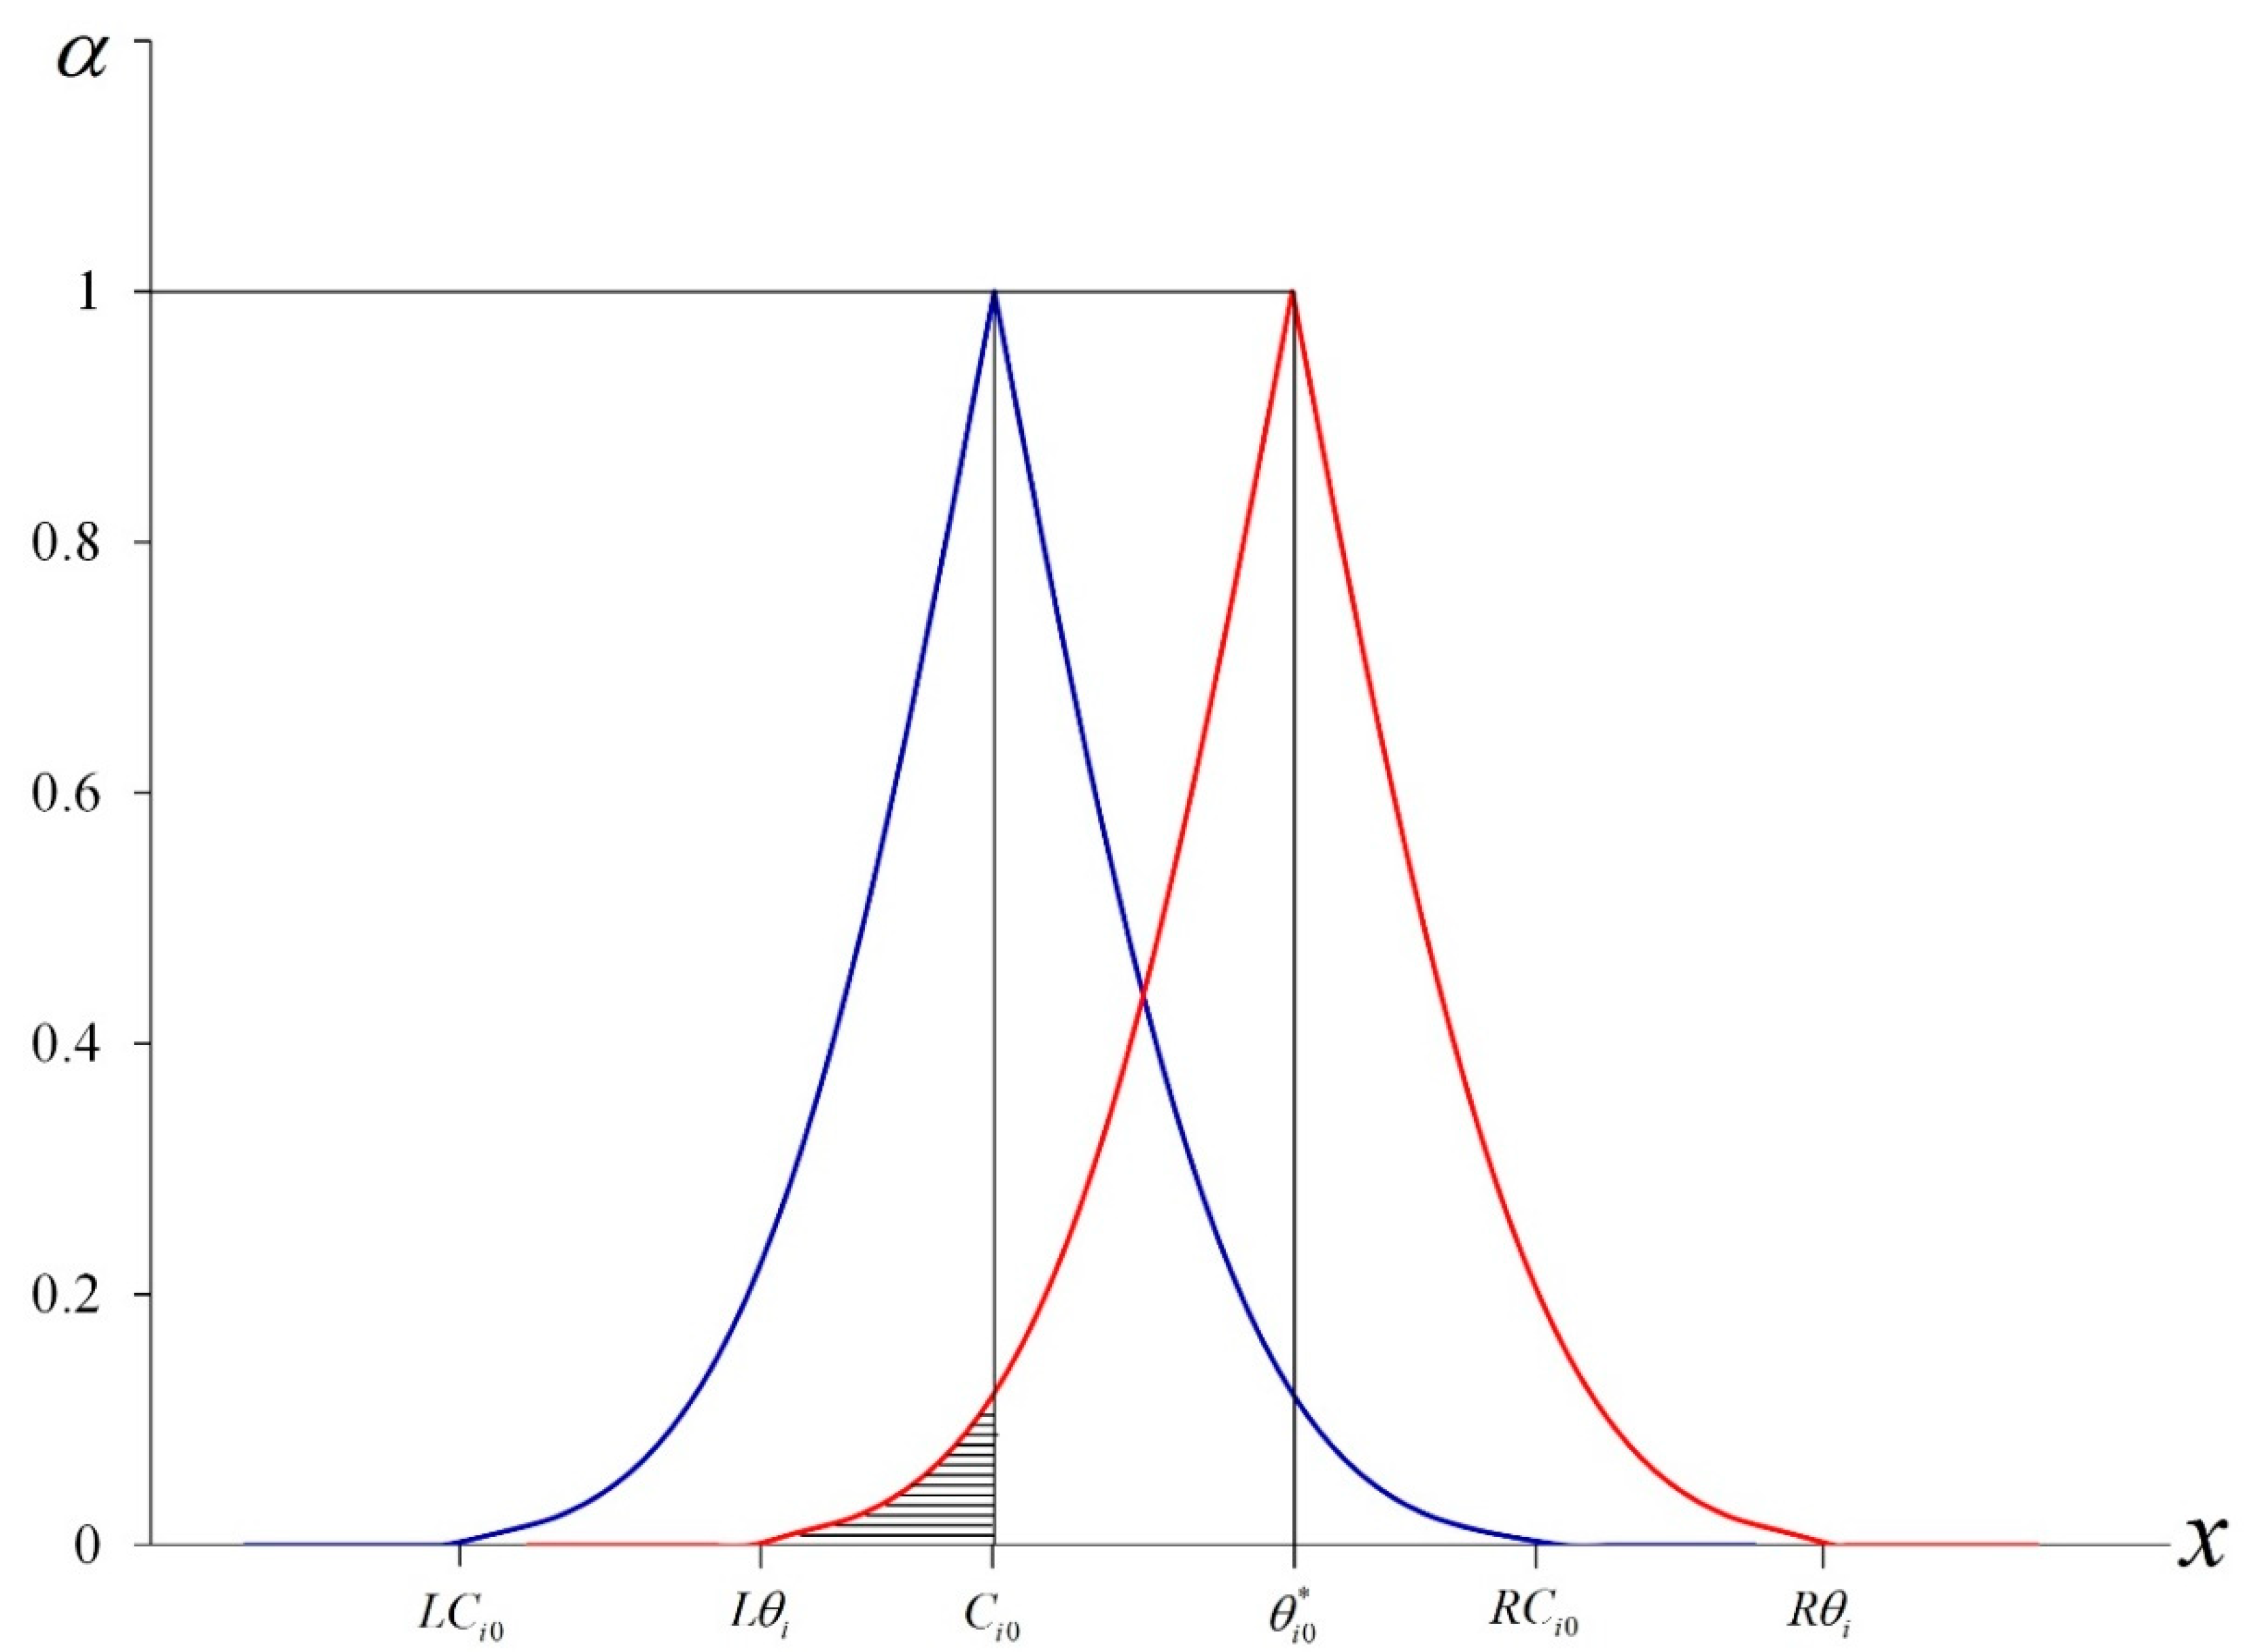
Subsequently, we can express
and
graphically as the following (see
Figure 1):
Obviously,
where
. We let
and
Among these,
represents the biggest integer which is less than or equal to
. If we let
represent the total area under the graph of
, then
for
.
is divided into 100 blocks similar to trapezoids and block
j can be shown as the following:
Suppose
such that
, then
For the purposes of practical manipulation, since
is an integer,
If we let
represent the area under the graph of
but to the right of the vertical line through point
, then
.
is divided into
h trapezoid-like blocks and block
j can be expressed as the following:
Now, we compute the area of
and
as
and
can be shown as the following:
and
As noted by Buckley [
15], we may employ two numbers (
) as the following:
(1) If , then do not reject and infer that service item i does not need improvement ().
(2) If , then make no decision on whether to reject/not reject.
(3) If , then reject and infer that service item i needs improvement ().
According to the above-mentioned evaluation rules, q service items can be subjected to fuzzy hypothesis testing to find all service items requiring improvement.
4. Fuzzy Hypothesis Testing for Importance Index
If we let
, then the data matrix of random variable
can be shown as
Then the observation values for the means, standard deviations, and
of each importance service item can be expressed as the following:
and
All service items requiring improvement are represented by the Set “SI”. For example, if
, service items 3, 7, 8, and 11 require improvement. These service items are then checked for importance. If their importance index is higher than the mean, they are prioritized for improvement in cases of limited resources. This can be represented by hypothesis testing as the following:
This gives the following test statistic:
where
The critical region is
where
is determined by
where
is the significance level and the decision rule is
Similar to the satisfaction index
, the
confidence intervals of
is
According to Buckley [
15], the
of triangular fuzzy number
is
Obviously, when
, then
. Thus, the triangular shaped fuzzy number of
is
where
The membership function of triangular fuzzy number
is
Similarly to
, the
of triangular fuzzy number of
is
The triangular fuzzy number of
is
where
Then the fuzzy membership function of
is
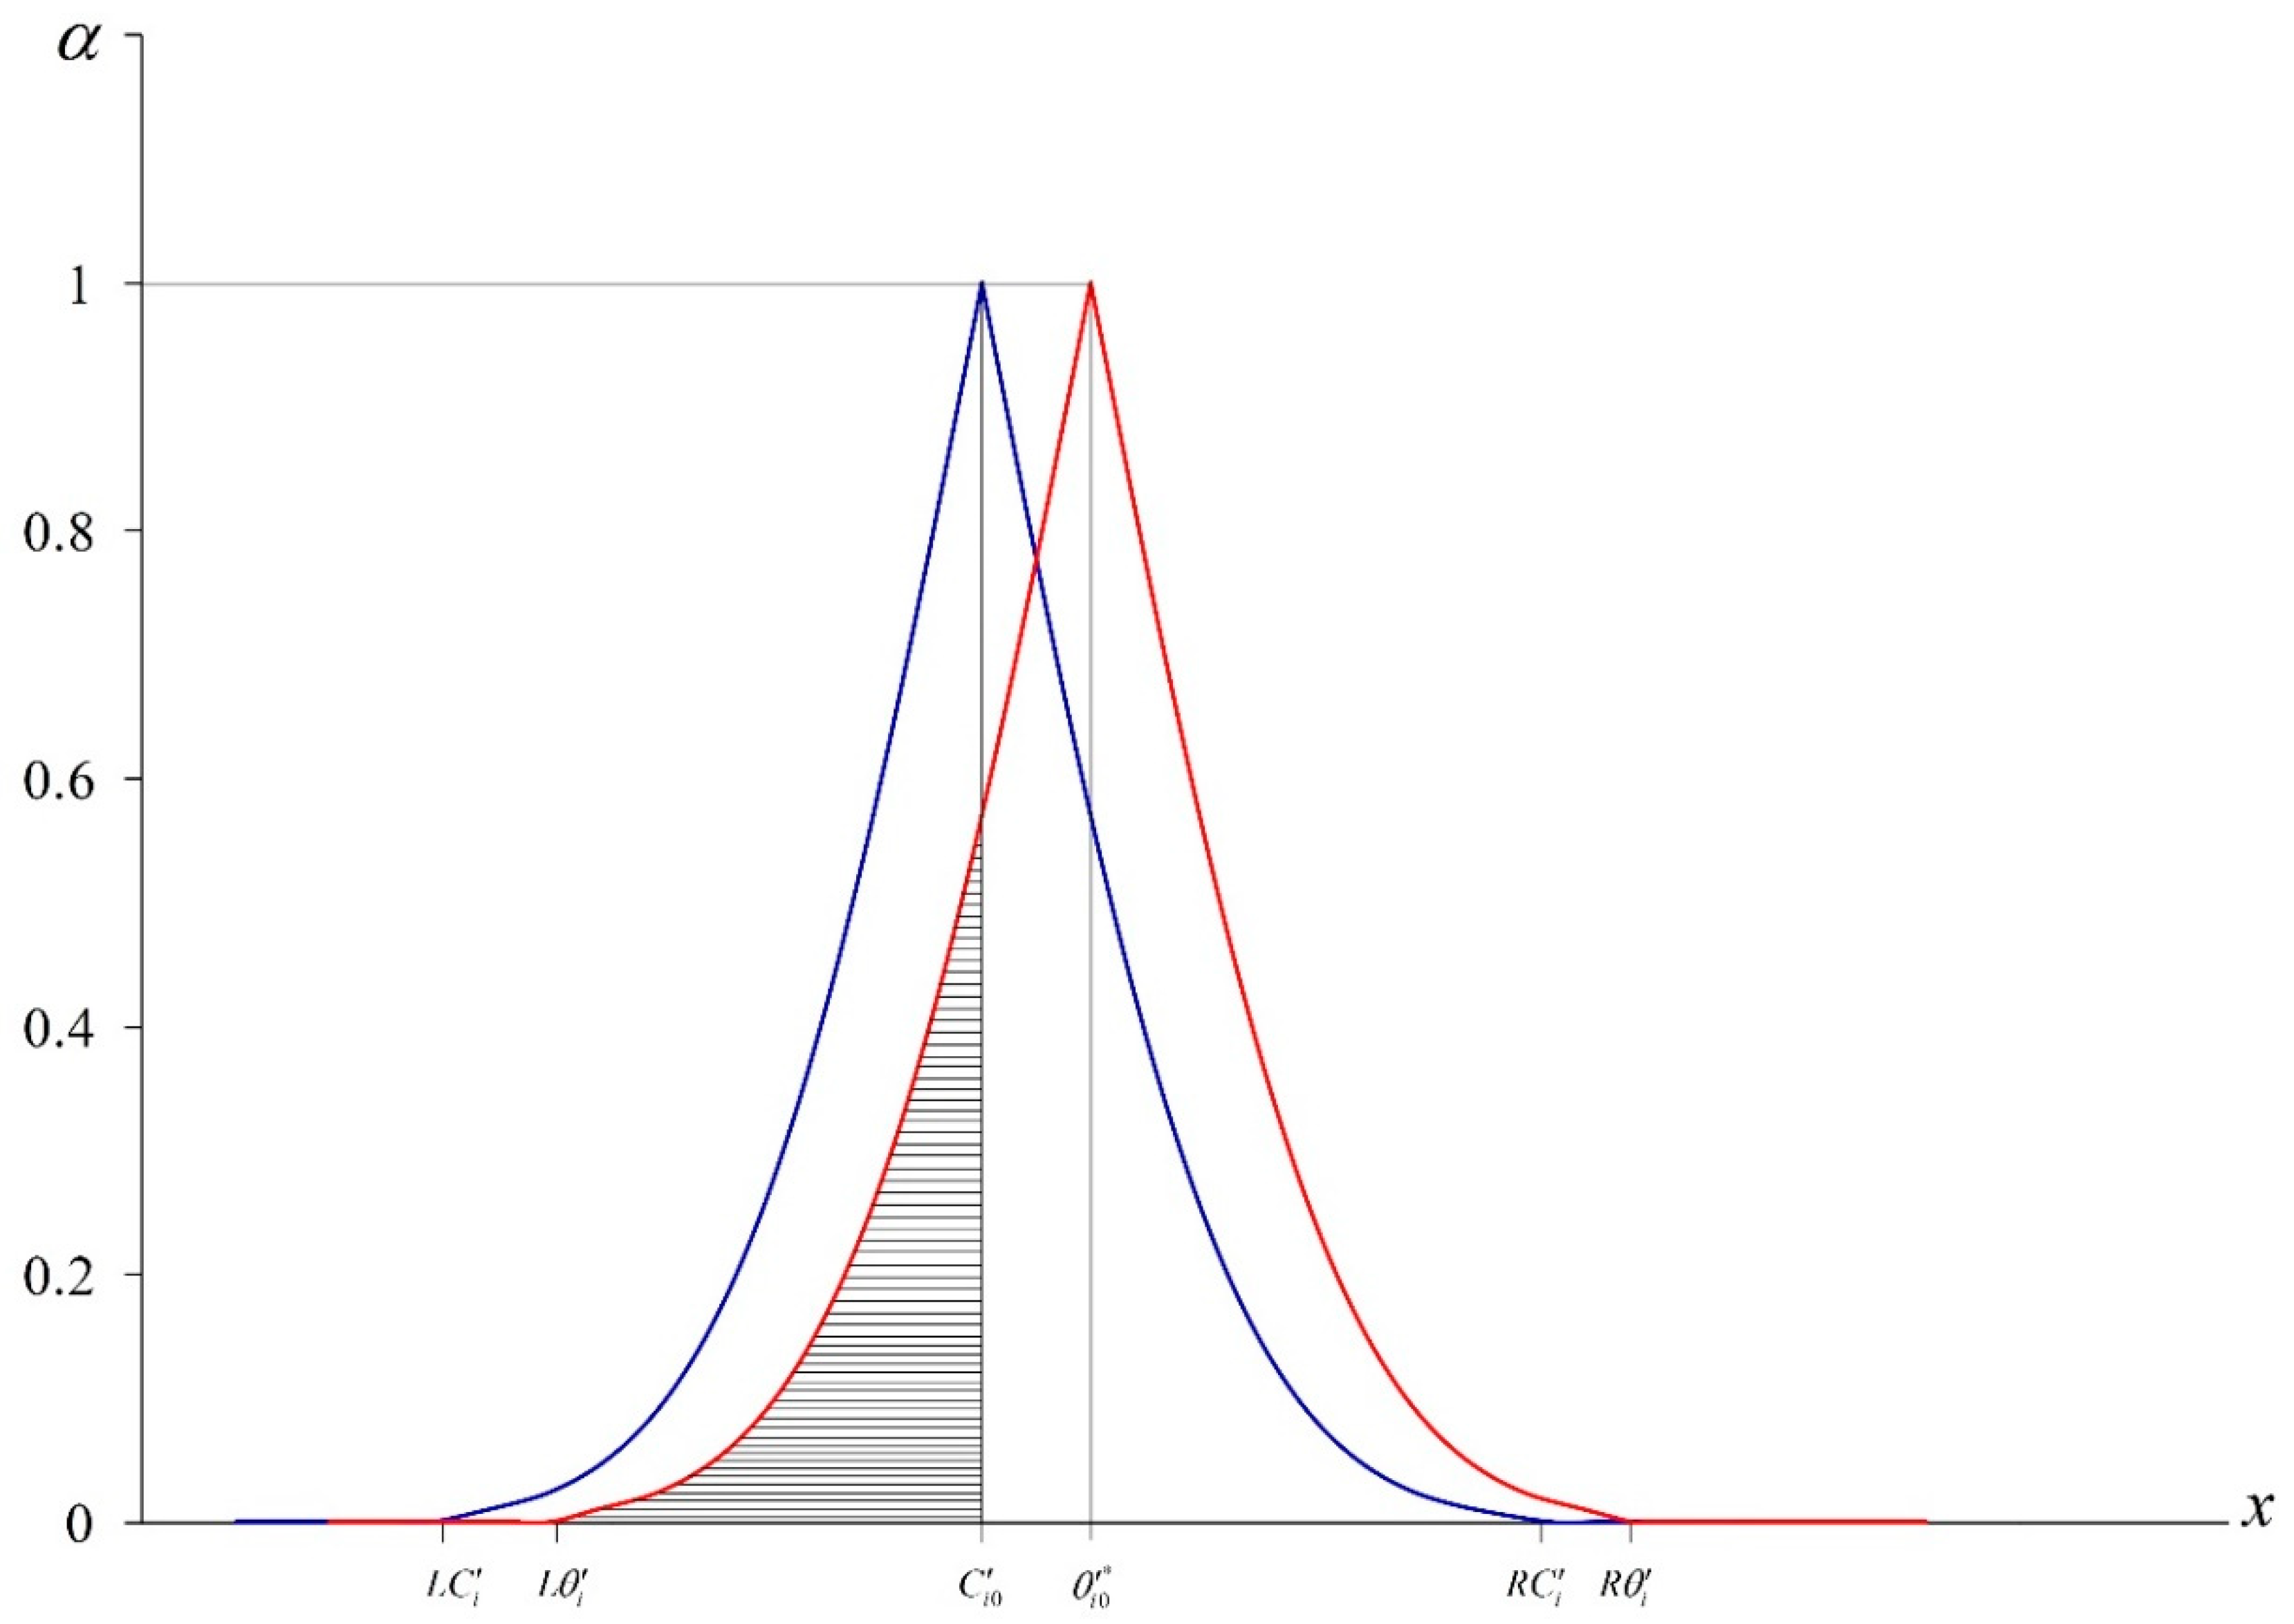
Subsequently,
and
can be represented graphically as the following (see
Figure 2):
Obviously,
where
. Similarly to
, if we let
,
and
represent the total area under the graph of
, then
.
is divided into 100 trapezoid-like blocks and block
j therein can be shown as the following:
Suppose
such that
. Then
If we let
represent the area under the graph of
but to the right of the vertical line through point
, then
.
is cut by
h′ into
h′ trapezoid-like blocks and block
j can be expressed as the following:
Now, we compute areas
and
as
and
can be shown as the following:
and
As noticed by Buckley [
15], we may cogitate employing two numbers (
) as the following:
(1). If , then do not reject and infer that service item i must be prioritized for improvement,
(2). If , then make no decision on whether to reject/not reject,
(3). If , then reject and conclude that service item i is not a priority.
5. Case Study
E-learning represents a rapidly growing trend in education. According to the 2018 survey report on digital industries by the Industrial Development Bureau of the Ministry of Economic Affairs, the worth of digital services output in Taiwan in 2017 was as high as NT
$5.01 trillion, representing an increase of 19.6% compared to 2016. E-learning is often utilized for language teaching [
20,
21]. It is forecasted that digital English learning in the Asia-Pacific area will increase by as much as 25.83% per year from 2018 to 2022 [
22]. We therefore selected a CALL system operating at three private universities in central Taiwan as a case study to manifest the presented method.
This paper applied the web-based e-learning system (WELS) questionnaire proposed by Shee and Wang [
23] to explore students’ satisfaction and perception of importance when using the selected CALL system. There are 13 questions (shown in
Table 1) in the WELS questionnaire. Five-point Likert scales were applied as the following: for satisfaction, (1) strongly disagree, (2) disagree, (3) average, (4) agree, and (5) strongly agree; for importance, (1) strongly disagree, (2) disagree, (3) average, (4) agree, and (5) strongly agree. The sample was students at three private universities using the CALL system. A total of 507 questionnaires were distributed and 433 questionnaires were recovered, representing a recovery rate of 85%. Among these, 18 questionnaires were deemed invalid, making the effective recovery rate 82%. In this paper, we establish a calculation process to complete the evaluation procedure based on the equation in
Section 3.
Step 1: The mean and standard deviation of each service item are calculated:
is calculated by Equation (15) and
and
are calculated by Equations (22) and (23). The results are input to
Table 1. Then we take service item 1 (
i = 1) for an example to describe the calculation process of these 3 statistics as the following:
Step 2: Based on Equation (16), we calculate = 0.5370 and set up hypothesis testing as the following:
,
.
Step 3: We let the significance level
and according to Equation (18) calculate
and fill in the result in
Table 1. We take service item 1 (
i = 1) for an instance to state the calculation process of
as the following:
Step 4: Based on Equations (38) and (39), we calculate
and
respectively, then calculate
and fill the result in
Table 1. Because service items 5, 6, 7, and 8 of dimension 2 all need improvement, we take these 4 items for example to describe the calculation process of
as the following:
Step 5: We set
and
. According to the evaluation rules presented in
Section 3,
(marked
*). Therefore, we reject
and conclude that service item
i needs improvement. The
values of items 5, 6, 7, and 8 are larger than 0.4, which means that service items 5, 6, 7, and 8 need improvement.
As stated above, according to the statistical testing principle (i.e., if , do not reject and service item i does not need improvement), service items 5, 6, 7, and 8 do not need improvement. However, the values of service item 5, 6, 7, 8 is much smaller than . In practices, they should be listed as improvement items. Therefore, they are revised to be improved after applying the fuzzy hypothesis testing method constructed in this paper. Obviously, this result is more reasonable than the traditional statistical testing principle.
The improvement items are confirmed by fuzzy hypothesis testing. In cases of limited resources, the items with an importance index above the mean will be prioritized for improvement. The calculation process is constructed as described in
Section 4.
Step 1: The mean and standard deviation of each service item are calculated:
is calculated by Equation (42) and
and
are calculated by Equations (49) and (50). The results are input to
Table 2. We take service item 5 (
i = 5) for an instance to describe the calculation process of these 3 statistics as the following:
Step 2: Based on Equation (44), we calculate 0.7209 and set up hypothesis testing as the following:
Step 3: We let the significance level
and according to Equation (46) calculate
. The results are input to
Table 2. Then we take service item 5 (
i = 5) for an example to describe the calculation process of
as the following:
Step 4: Based on Equations (64) and (65), we calculate
and
respectively, then calculate
and fill in
Table 2. We take service items 5, 6, 7, and 8 of dimension 2 all for example to state the calculation process of
as the following:
Step 5: We let
and
. According to the evaluation rules of
Section 4, if
, then do not reject
and infer that service item
i must be prioritized. The
values of items 5, 6, 7, and 8 are smaller than 0.2, which means that service items 5, 6, 7, and 8 must be prioritized.
6. Conclusions
Hung et al. [
9] indicated that as beta distribution is between zero and one, it is a suitable indicator of the degree of importance and satisfaction from 0% to 100%. We applied the proposed methods to the evaluation of a CALL system. We found that according to statistical testing, service items 5, 6, 7, and 8 did not need improvement. However, the
values of service items 5, 6, 7, and 8 were much smaller than
. In practice, these items would therefore be considered as requiring improvement. Following application of the proposed fuzzy hypothesis testing method, these items were re-categorized. The proposed methods were then applied to determine the importance of these service items, and all four were deemed as a priority. The major managerial insights of this study are:
(1) We have constructed a performance evaluation matrix, on the basis of the spirit of continuous improvement promoted by total quality management. Through the fuzzy hypothesis testing method presented by Buckley [
15], we have identified the characteristics considered critical to quality and determined which items should be prioritized for improvement in cases of limited resources.
(2) According to Chen et al. [
16], fuzzy hypothesis testing brings more reasonable results for those in practice than in traditional statistics. In fact, fuzzy hypothesis testing mentioned in this paper combines the statistical inference method with experts’ experiences to make accurate decision. Therefore, service item 5, 6, 7, and 8 are not missed to improve and the loss of the industries can be reduced to the lowest [
16,
24,
25,
26,
27].
(3) Based on the work of Buckley [
15] and Chen et al. [
16], we introduced confidence intervals to decreases the chance of misjudgment arising from sampling errors.
(4) This method of data collection preserves the voice of the customer, and it is relatively simple to apply, thereby increasing customers’ willingness to participate.
(5) This method only requires a small quantity of the sample size. It not only meets the industries cost benefit but also controls the timeliness and effectiveness.


