Article

An AHPSort II Based Analysis of the Inequality Reduction within European Union

by
Álvaro Labella
1,*,
Juan Carlos Rodríguez-Cohard
2,
José Domingo Sánchez-Martínez
3 and
Luis Martínez
1
1
Department of Computer Science, University of Jaén, 23071 Jaén, Spain
2
Department of Economics, University of Jaén, 23071 Jaén, Spain
3
Department of Anthropology, Geography and History, University of Jaén, 23071 Jaén, Spain
*
Author to whom correspondence should be addressed.
Mathematics 2020, 8(4), 646; https://doi.org/10.3390/math8040646
Submission received: 11 March 2020 / Revised: 6 April 2020 / Accepted: 15 April 2020 / Published: 22 April 2020
(This article belongs to the Special Issue Recent Advances and Applications in Multi-Criteria Decision Analysis)

Abstract

:
Nowadays, sustainability is an omnipresent concept in our society, which encompasses several challenges related to poverty, inequality, climate change and so on. The United Nations adopted the Agenda 2030, a plan of action formed of universal Sustainable Developments Goals (SDGs) and targets, which countries have to face in order to shift the world toward a sustainable future. One of the most relevant SDGs since the onset of the financial crisis in 2007 has been the so-called reduced inequalities, which consists of dealing with the inequality of opportunities and wealth between and within countries. However, reducing inequalities depends on many heterogeneous aspects, making it difficult to make a proper analysis that evaluates the European Union (EU) countries performance of this goal. In this study, we introduce a novel approach to evaluate the inequalities in EU countries based on a sorting a multi-criteria decision-making method called AHPSort II. This approach allows to obtain a classification of the EU countries according to their achievements in reducing inequalities to subsequently carry out a deep performance analysis with the aim of drawing conclusions as to the evolution of inequality in them along the years. The results are consistent with the main international organizations’ reports and academic literature, as shown in the Discussion Section.

1. Introduction

In 2015,the United Nations adopted Agenda 2030 [1], “a plan of action for people, planet and prosperity”, to reach a better and more sustainable future for all through the achievement of 17 Sustainable Development Goals (SDGs) and 169 associated targets. The European Union (EU) started, at the end of 2016, a strategic approach that contains, as the most relevant actions, the integration of the SDGs into all current European policies. Furthermore, the EU intends to emphasize this strategy from 2020 onwards. While the EU stressed the need for intersectoral and multilateral coordination among member countries, the European Commission undertook to provide regular reports on the progress or setbacks related to the implementation of Agenda 2030. The involvement of the EU to achieve the SDGs seems obvious, bearing in mind that “the EU has a strong starting position and track record, with a high level of economic development, social cohesion, democratic societies and a commitment to sustainable development, which is firmly anchored in the European Treaties” [2]. In fact, in 2001, it introduced a first sustainable development initiative that has been maintained and updated to the Europe 2020 Strategy, based on education and innovation (smart), reducing carbon dioxide emissions and combating climate change (sustainable) and with the capacity to create employment and reduce poverty (inclusive).
In particular, the 10th SDG (reduce inequality within and among countries) is an important goal to be studied, since it has key linkages with other goals, such as no poverty (1st), good health and well-being (3rd), quality education (4th), gender equality (5th), decent work and economic growth (8th) and others. Furthermore, it is at the heart of the social and territorial cohesion policies, which are among the main objectives of the functioning of the EU [3]. The origins of inequality and its consequences are now under intense academic and social debate which addresses either the nature of the capitalism [4] or the origins of its crisis [5,6]. For these reasons, it is interesting to know how inequality evolves in Europe in order to understand its performance, avoid its expansion and propose adequate measures preventing economic and social disorders in a region so committed against inequality as the EU is.
The European Commission, in spite of the EU member states complying largely with the SDGs (all are in the top 50 and at the forefront in objectives such as ending poverty), acknowledges that there are notable differences between and within countries in the achievement of 10th SDG. However, 22.5% of the EU population is at risk of poverty or social exclusion and 6.9% of Europeans suffer severe material deprivation. Similarly, it is stated that although 2017 was the first year in which inequality declined since the onset of the financial crisis in 2007, “income inequalities remain too large, with a continued concentration of wealth at the top. This has multiple social consequences, leading to differences in well-being and quality of life” [7]. Then, the inequality analysis and its reduction are at the center of current European motivations since novel challenges such as globalization and technological evolution are affecting and will affect European society in the medium term, according to the context marked by the different accumulation processes of income generated by work and capital today [8].
Taking into account the above premises, it is clear that reducing inequalities (10th SDG Agenda 2030) is a universal principle that all governments should implement in their policies and particularly, the EU has pushed their members to improve this specific SDG by the adoption and implementation of different policies. However, reducing inequality within and among countries is a complex goal that depends on different aspects. For this reason, it has been addressed from different perspectives and methods such as including additive functions about incomes [9,10], applying income distributions to analytical constructs [11,12], developing new inequality measures [13], DEA multi-criteria decision making (MCDM) approach [14] and using disposable data from a wide range of sources [8]. Notwithstanding, this contribution introduces a novel approach to measure the evolution of inequalities of EU countries keeping a similar view to [14] in which a MCDM view is used with the aim of sorting, into prior defined categories, the EU members and then show whether the goals set by the EU are being met by them. This proposal is based on a multi-criteria decision analysis, which deals with the process of taking decisions among a decision maker who evaluate different alternatives on several criteria [15]. Classically, most of MCDM approaches have been formulated for choice and ranking problems in which it is obtained the best alternative for the decision problem or a ranking of them [16,17,18,19,20]. Nevertheless, this contribution focuses on MCDM sorting problems, in which the alternatives are classified into several categories previously defined.
Therefore, this paper aims to evaluate the evolution of inequalities within and between different EU members since 2005 up to 2017. To achieve such goal, we define a MCDM sorting problem, in which the alternatives are represented by EU countries and evaluated by an expert according to six targets/criteria set by Agenda 2030 related to the 10th SDG. Data related to these targets for the different EU members states are periodically published by EU (https://ec.europa.eu/eurostat/web/sdi/main-tables). Finally, the countries are classified into four different classes, according to their full, moderate, poor and null performance regarding their inequality achievements. To carry out the classification of the countries, we use an Analytic Hierarchy Process (AHP) [21] approach for sorting MCDM problems so-called AHPSort II [22].

2. Materials and Methods

2.1. Materials

This section introduces the materials used in this contribution composed by a questionnaire to obtain the expert’s opinion about the 10th SDG regarding the EU countries and FLINTSTONES, a decision support system that implements AHPSort II and allows to carry out automatically all the computation related to this sorting method.

2.1.1. Questionnaire

The empirical data used in this study consists of a questionnaire response from a social policy expert familiar with Agenda 2030 and its SDGs. The questionnaire contains three sections:
  • Problem description: definition of the MCDM problem, the targets/criteria according to the definition provided by Agenda 2030 and the classes in which the countries are classified.
  • Profiles definition: the expert defines, according to AHPSort II methodology (see Section 2.2), several limiting profiles that represent the minimal value for each criterion to belong a specific class.
  • Pairwise comparisons: the expert does pairwise comparisons [23] among the different elements of the MCDM problem. The questions were answered using a 9-point Likert-type scale (e.g., 1 = equal, 3 = moderate, 5 = preferred, 7 = very preferred, 9 = extreme preferred).
The expert provides his knowledge in the questionnaire through pairwise comparisons. However, they have to know all the information related to the achievements reached by the countries regarding the SDGs in order to do proper comparisons. The EU makes available to everyone a database (https://ec.europa.eu/eurostat/data/database) that allows consulting data of different EU countries in multiple themes such as general and regional statistics, economy and finance or industry, trade and services. Additionally, this database includes a specific theme, so called Sustainable Developments Indicators, which includes information related to the SDGs defined in Agenda 2030 for each EU country. For our study, we have consulted the data related to the Goal 10, Reduced inequalities in order to measure and analyze the inequalities in EU countries. Obviously, the socio-economic characteristics of each country are different and draw conclusions about inequality for a specific country by comparing with the rest of them might lead to wrong interpretations. Nevertheless, with the provided information, in which all the data are normalized, we can measure inequality of a specific EU country taking into account its social and economic peculiarities and, by using the method introduced in Section 2.2.1, provide a classification that shows which countries are not meeting the targets set by Agenda 2030 in terms of inequality.

2.1.2. FLINTSTONES

FLINTSTONES (Fuzzy LINguisTic DeciSion TOols eNhacemEnt Suite) [24,25] is a decision software tool able to solve MCDM problems under different decision contexts. FLINTSTONES was developed under the Eclipse Rich Client Platform (RCP) focuses on the development of rich desktop application easy to maintain and extend. Such characteristics are related to its components based architecture, which consists of the implementation of small pieces of software so-called plug-ins connected each other and that compose the software application.
Initially, FLINTSTONES was developed to solve linguistic decision making problems under uncertainty by using the 2-tuple linguistic model and its extensions [26] in order to support the solution of those problems defined in linguistic and complex frameworks [24]. However, there are a large number of MCDM models that initially do not work with linguistic information and, since the main objective of FLINTSTONES is to provide assistance to researchers in solving MCDM problems of any kind and under any circumstances, an improved version of it was proposed [25]. This new version includes a new feature that allows to solve automatically sorting MCDM problems by using different sorting methods such as the AHPSort and its improved version AHPSort II.
Therefore, we use FLINTSTONES to introduce the information obtained from the expert through the questionnaire and it provides us automatically and in a precise way the classification of the EU countries by using the AHPSort II approach.

2.2. Methods

This section revises briefly the AHPSort sorting method. Additionally, the different steps of the proposed approach for the evaluation of EU countries regarding the 10th SDG are described.

2.2.1. AHPSort

It is an adaptation of the AHP method [21] for sorting MCDM problems. The AHPSort [16] aims at sorting alternatives into classes that are ordered from most to least preferred. AHPSort consists of three phases composed by eight different steps [16]:
(A)
Phase 1: Problem definition
  • It is defined the goal, the criteria c j , j = 1 , , m and alternatives a k , k = 1 , , l of the problem.
  • It is defined the classes C i , i = 1 , , n that are ordered and can have a linguistic descriptor.
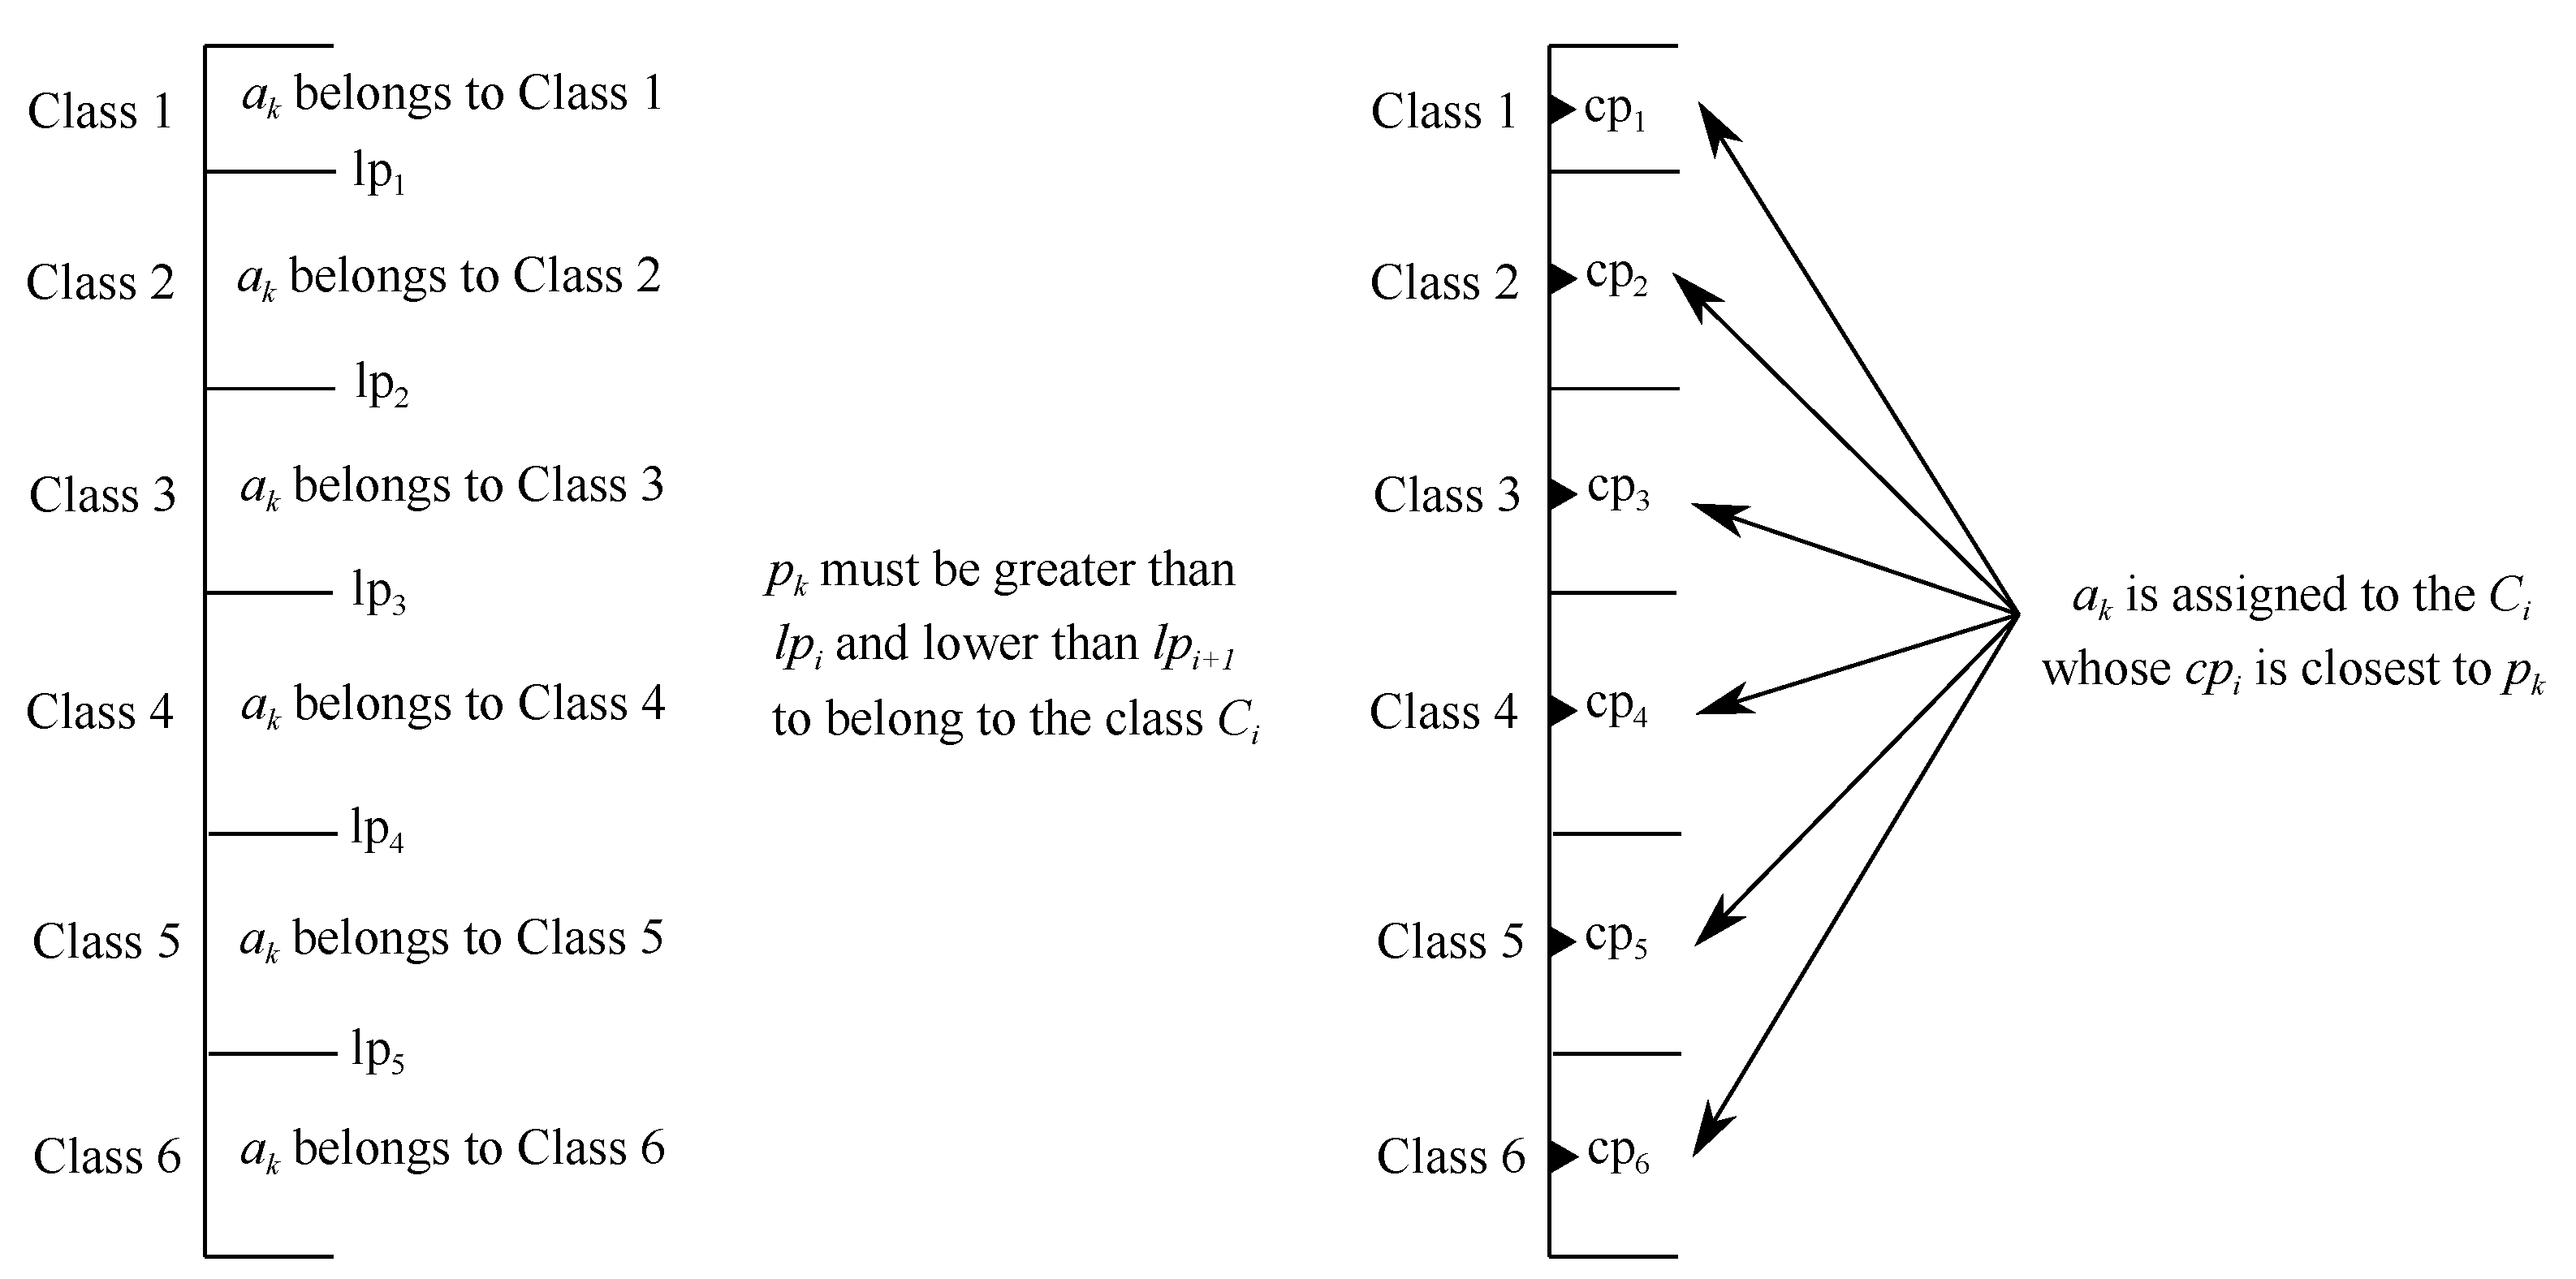
  • Eventually, it is defined the profiles of each class, C i , by means of either limiting profiles l p i j , minimum performance needed by each c j to belong to a class C i , or with local central profiles c p i j , typical example of an element belonging to the class C i on c j , (see Figure 1).
(B)
Phase 2: Evaluations
4.
To compute priority for importance of each criterion c j obtaining their weights w j by using eigenvalue method of the AHP [27].
A · p = λ · p
where A is the comparison matrix, p is the priorities/weight vector and λ is the maximal eigenvalue.
5.
To compare in a pairwise comparison matrix an alternative a k with each limiting profile l p i j or central profile c p i j for each criterion c j .
6.
From the comparison matrices, derive the local priority p k j for the alternative a k and the local priority p i j of the limiting or central profiles l p i j , c p i j with the eigenvalue method Equation (1).
(C)
Phase 3: Assignment to classes
7.
To compute global priorities p k , l p i and c p i for alternative a k , limiting and central profiles respectively by aggregating local priorities.
p k = j = 1 m p k j · w j
l p i o r c p i = j = 1 m p i j · w j
8.
The assignment of an alternative a k to a class C i is accomplished by the comparison p k with l p i or c p i (see Figure 1).
9.
Repeat process (5) to (8) for each alternative to be classified.
In [22] the AHPSort approach was updated to AHPSort II by modifying previous algorithm from step (4) onwards:
5.
For each criterion c j , select a small number of RPs s o j , o = 1 , , r well distributed on the scale of each criterion.
6.
Compare in a pairwise comparison matrix the RPs and the limiting or central profiles. From the comparison matrices, derive the local priority p o j for the RPs and the local priority p i j of the limiting or central profiles with the eigenvalue method in Equation (1).
7.
If the alternatives a k belong to the interval of two consecutive RPs s o j and s o j + 1 , the local priority p k j can be derived as:
p k j = p o j + p o + 1 j p o j s o + 1 j s o j · ( g j ( a k ) s o j )
where:
  • s o j and s o + 1 j are two consecutive RPs on criterion c j .
  • p o j and p o + 1 j are the local priorities of the two consecutive RPs.
  • g j ( a k ) is the score of the alternative a k on criterion c j .
  • p k j is the local priority of a k .
8.
To aggregate the weighted local priorities, obtaining a global priority p k for alternative a k Equation (2) and a global priority l p i or c p i for the limiting or central profiles Equation (3).
9.
Repeat steps (5) to (9) for each alternative to be classified.
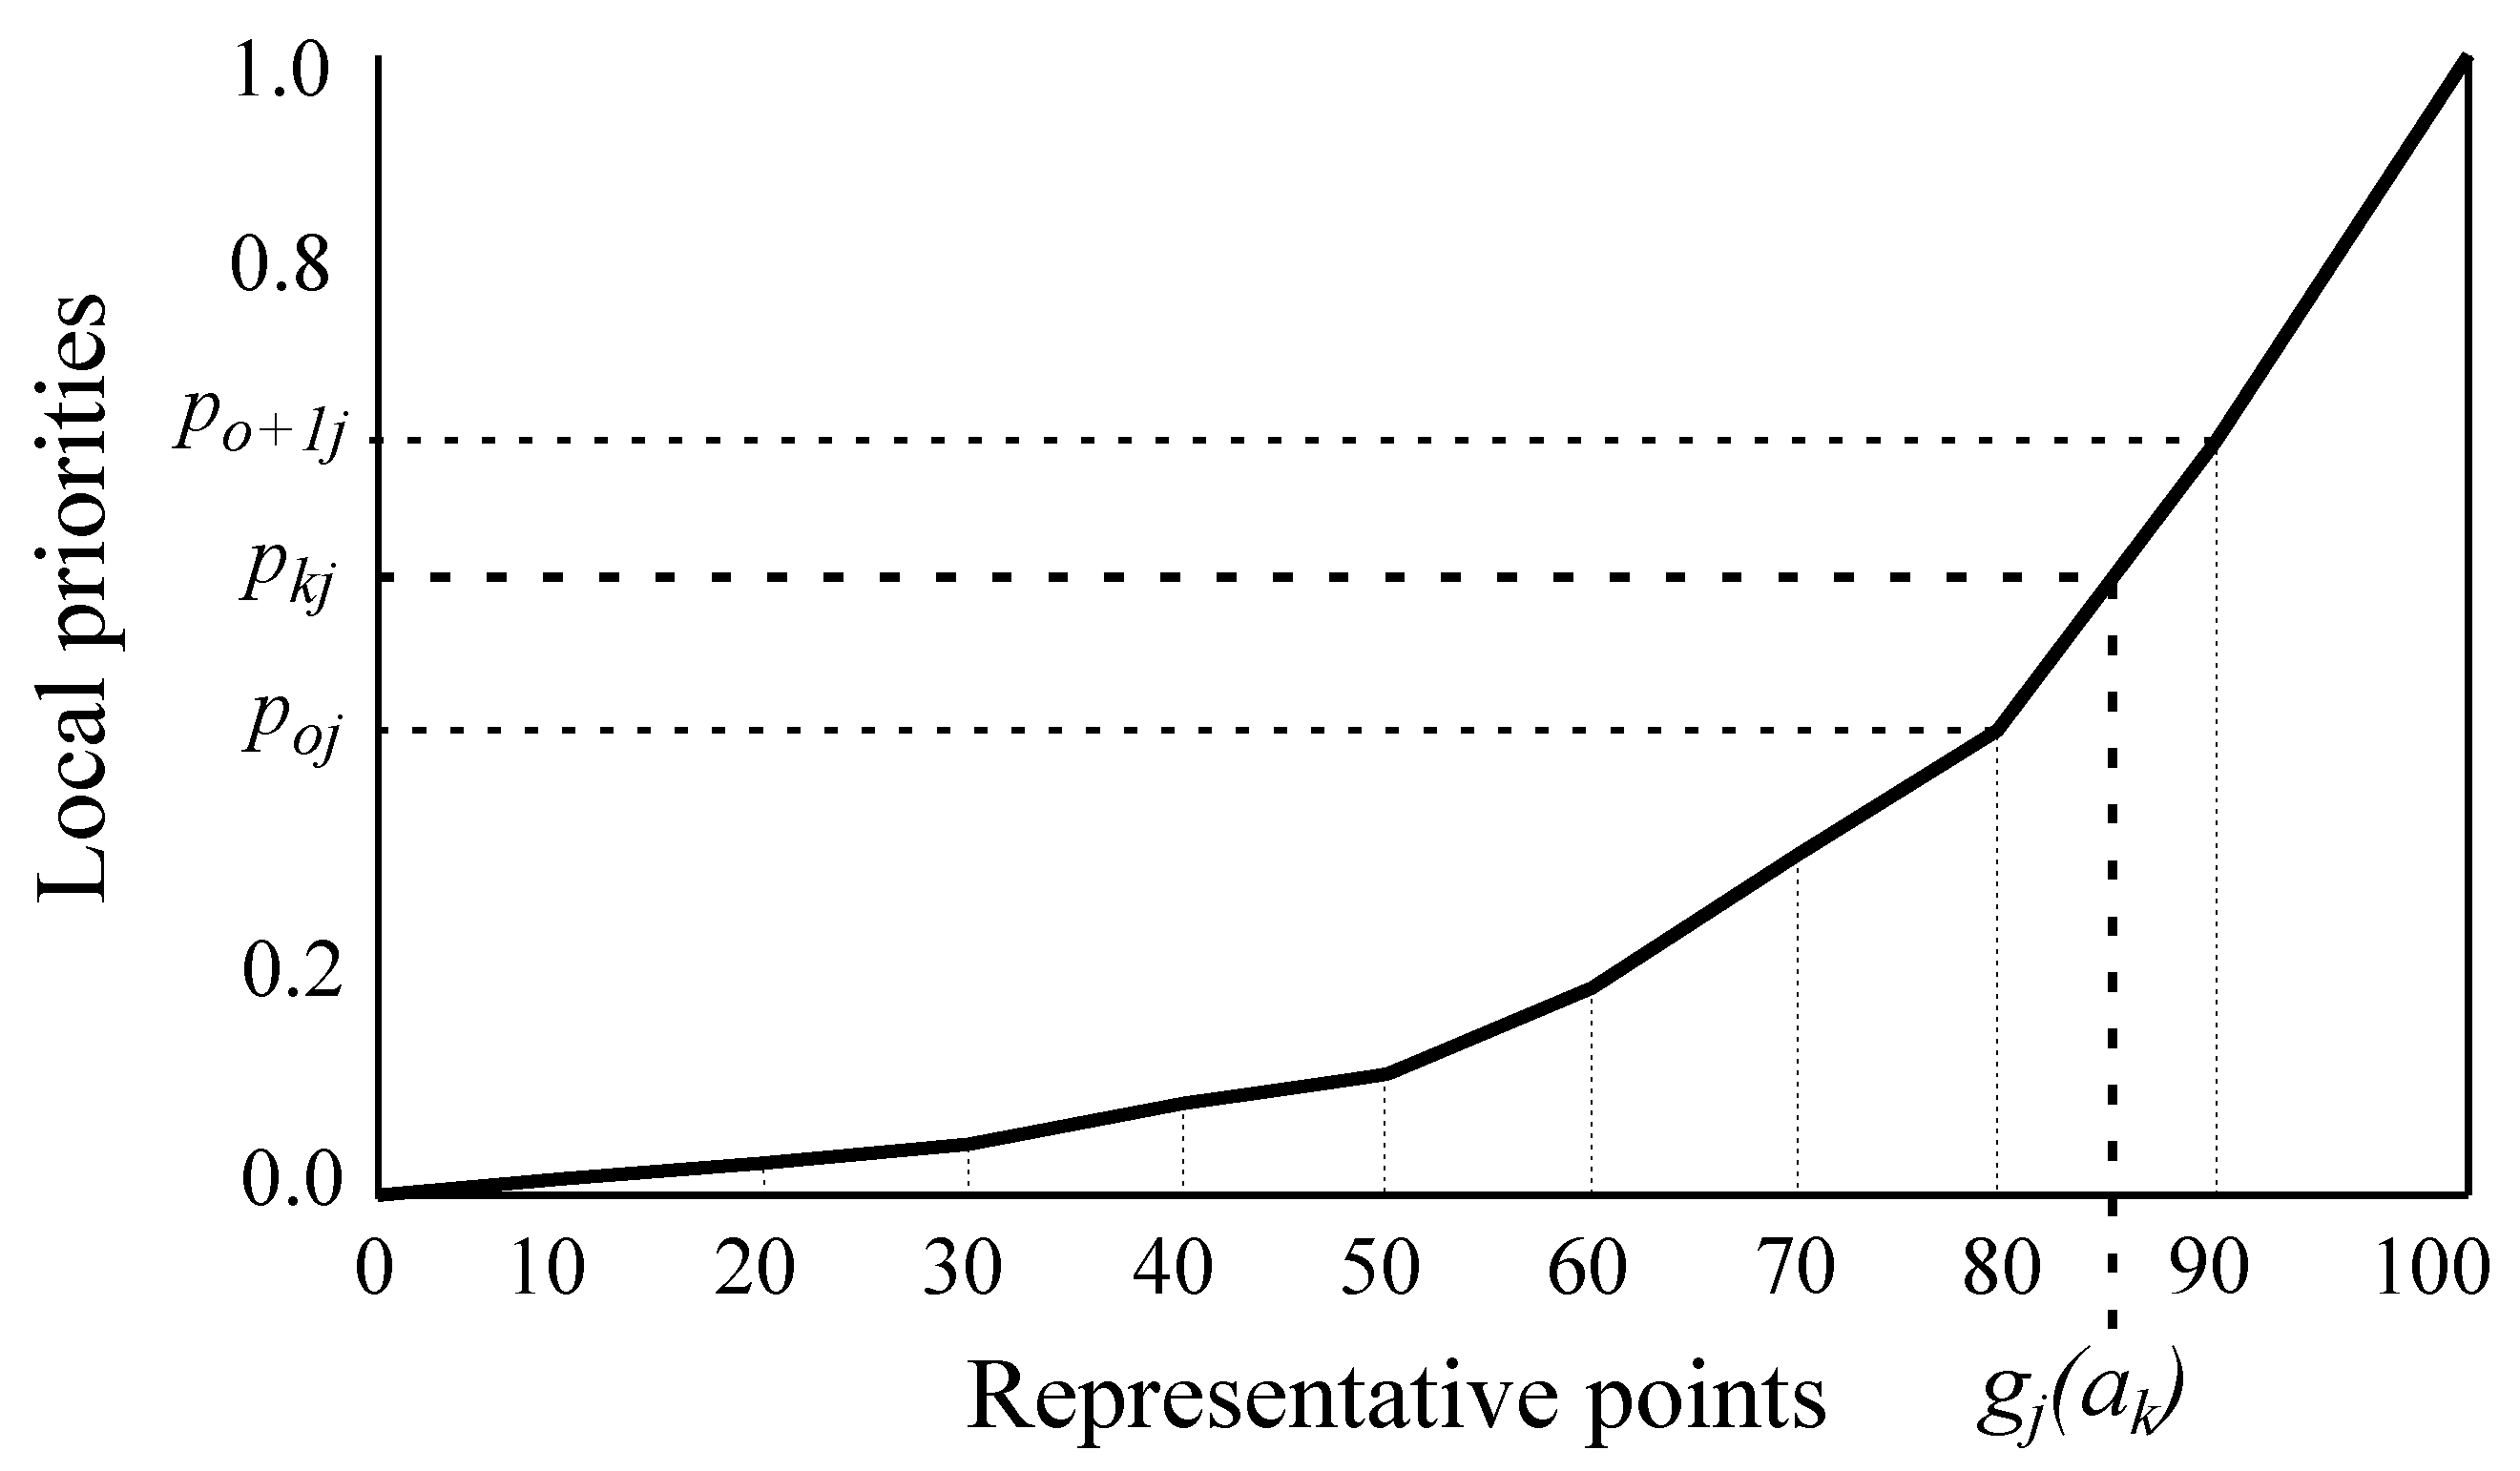
Figure 2 depicts 10 RPs on the horizontal axis and their calculated local priorities on the vertical axis. Then, a piecewise linear priority function is drawn by connecting these points. For instance, if the value of the alternative to be evaluated is 85, the local priority can be graphically found by reading the created graph.

2.2.2. MCDM Sorting Approach for Analyzing Inequality

This research introduces an approach based on sorting MCDM to analyze inequality in EU countries. The proposed approach consists of the following steps (see Figure 3):
  • Definition of the problem: a sorting MCDM problem is defined, in which one expert evaluates, in terms of inequality, 26 alternatives represented by EU countries (the countries of Croatia and Malta have not been analyzed as not all data are available for the selected criteria and years) over 6 criteria represented by targets fixed in Agenda 2030. Such criteria/targets are briefly described below:
    Purchasing power adjusted GDP per capita ( c 1 ): value of the total output of goods and services produced by an economy, less intermediate consumption, plus net taxes on products and imports.
    Adjusted gross disposable income of households per capita ( c 2 ): purchasing power of households and their ability to invest in goods and services or save for the future, by accounting for taxes and social contributions and monetary in-kind social benefits.
    Relative median at-risk-of-poverty gap ( c 3 ): distance between the median equivalised total net income of persons below the at-risk-of-poverty threshold and the at-risk-of-poverty threshold itself, expressed as a percentage of the at-risk-of-poverty threshold.
    Income distribution ( c 4 ): measures the inequality of income distribution, calculated as the ratio of total income received by the 20% of the population with the highest income to that received by the 20% of the population with the lowest income.
    Income share of the bottom 40% of the population ( c 5 ): measures the income share received by the bottom 40% of the population.
    People at risk of income poverty after social transfers ( c 6 ): people with an equivalised disposable income below the risk-of-poverty threshold, which is set at 60% of the national median equivalised disposable income (after social transfers).
    The countries can be classified into 4 different categories delimited by limiting profiles according to their Full, Moderate, Poor or Null performance in reducing inequalities goal. Such a classification is obtained for the years 2005, 2008, 2011, 2014 and 2017 in order to analyze the evolution of the countries along the years.
  • Fill in questionnaire: the expert fills in the questionnaire according to his knowledge and the data of the EU countries obtained from the database previously mentioned. Due to AHPSort II is used to obtain the classification of the EU countries, the expert is required to provide the values of the limiting profiles (see Table 1) for each criterion, the pairwise comparisons between criteria to obtain the criteria importance and the comparisons between representative points (RPs) and profiles to derive the local priorities. Regarding the RPs, we manually created six RPs that were equally spread within the range of each criterion, with the first RP ( R P 1 ) being always equal to the first value and the last one ( R P 6 ) being always equal to the max value of each criterion. Obviously, the data regarding the countries are different for each year, thus, the RPs are defined for each year (see Table 2).
  • Countries classification: the elements of the MCDM problem and the assessments provided by the expert are introduced in FLINTSTONES. Afterwards, FLINTSTONES carries out all the steps and computations regarding the AHPSort II method (see Section 2.2.1) and obtains the classification of the countries.
  • Analysis of the results: once the classification of the countries has been obtained for each year, it is possible to carry out a deep analysis of the results.

3. Results

This section shows the evaluation process to classify the EU countries by means of the approach introduced in Section 2.2.2 and a further detailed analysis of the results.

3.1. Evaluation Process

Starting from the assessments provided by the expert through the questionnaire, the relevant computations regarding AHPSort II and obtained by FLINTSTONES are:
  • Criteria priority importance: according to AHPSort’s 4th step, the criteria weights are derived from the pairwise comparison matrix between criteria (see Table 3) provided by the expert by using Equation (1).
    Remark 1.
    Note that, according to Saaty experiments [28], if the consistency ratio is less than 0.1%, then the matrix is of an acceptable consistency.
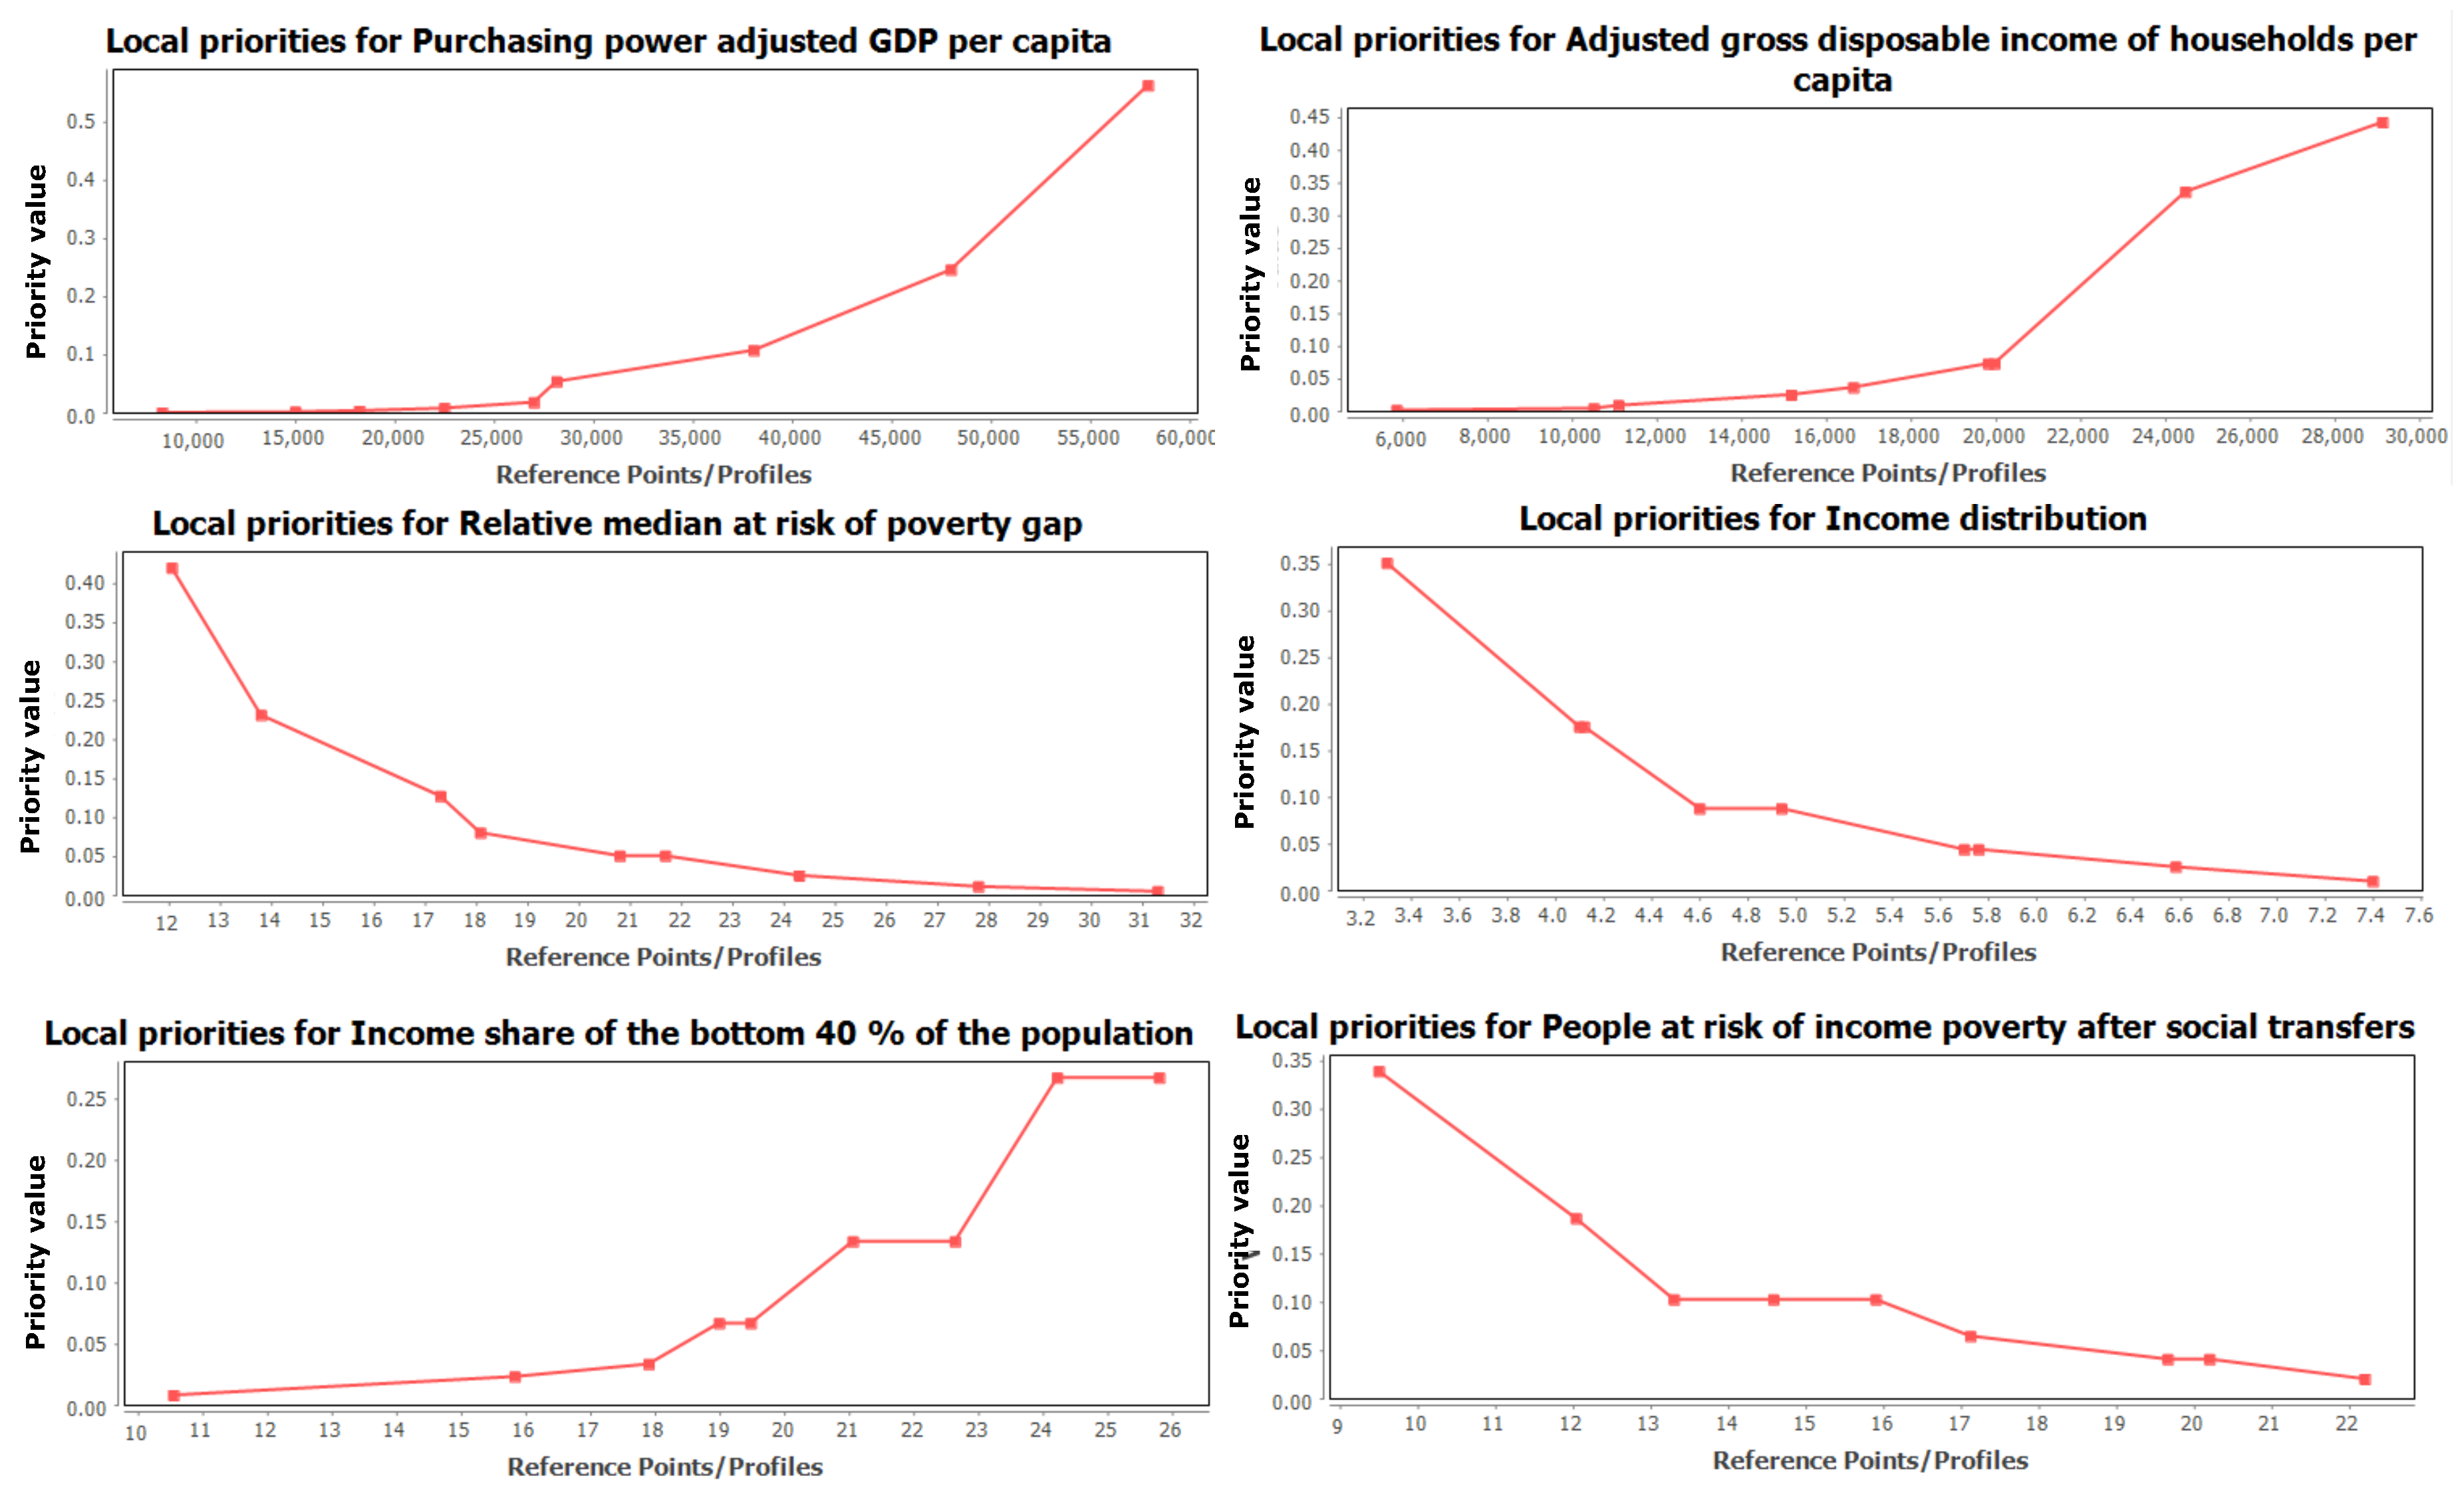
  • Local priorities: by applying Equation (1) to the pairwise comparison matrices between limiting profiles and RPs, the local priorities for both elements are derived. Then, the local priority functions for each criterion are built in order to derive the local priority for each alternative by means of Equation (4). For the sake of clarity and taking into account that the process is exactly the same for all the years, Figure 4 shows the local priority functions for each criterion and Table 4 and Table 5 the local priorities of the limiting profiles p i j and alternatives p k j for the year 2005, other years priorities are similarly computed but for reasons of clarity and avoid digression, we just show year 2005.
  • Global priorities: the local priorities are aggregated to obtain the global priorities for the profiles p i and alternatives p k by Equation (3) and Equation (2) respectively (see Table 4 and Table 5).
  • Classify countries: finally, the countries are classified by comparing the global priorities of alternatives and profiles. To show this process, for instance we are going to classify Spain into a its corresponding class. The global priority for such a country is equal to 0.053, which is compared with the global priorities of the limiting profiles, 0.032, 0.066 and 0.152. Due to we are using limiting profiles, to classify the country in the class C i , its global priority must be greater than l p i and lower than l p i + 1 . In this case, 0.032 < 0.053 < 0.066 thus, Spain is classified into the category Poor. The rest of classifications for each year are represented in Table 6 and Table 7 in Section 3.2.

3.2. Analysis of the Results

The starting point of this analysis is the year 2005 (see Figure 5), in full phase of economic expansion. The countries that achieve the objective of reducing inequalities, according to the AHPSort II method, are shown in blue color. They are concentrated in northern and central Europe: the Nordic countries, Netherlands, France, Belgium, Germany and Austria, which have important social protection systems with a long tradition. Similarly, some of the countries that have recently joined the European Union such as Czech R., Slovakia, Hungary and Slovenia, which have benefited from their inclusion in the global production chains of large German industrial companies since the beginning of the century [29,30,31], favoring the increasing complexity of their economies.
In the European periphery, the south: Spain, Italy and Greece together with the United Kingdom and Estonia present a poor reduction of inequalities. The South has great internal territorial inequalities, especially serious in the case of Italy. Noted that the liberal policies applied in the previous decade in United Kingdom have favored inequality in the expansive phase, as has also happened in Spain. Portugal and Poland, along with the Baltic republics and Romania, are the cases where the achievement of the objective of reducing inequalities is less advanced. The processes of low growth together with an inadequate institutional structure for the Portuguese case [32], or a slow transformation towards a market economy for the Eastern European countries, justify this scarce advance, which evidences a concentration of growth in social groups that capture a greater part of the benefits that are distributed in the European project [33].
With the exception of Ireland, Cyprus and Bulgaria, which are moderate in terms of the reduction of inequalities, we can undertake the analysis of the results from this starting situation with three large groups of countries: those that reach the objective, those that have a poor attainment and those that fail in the reduction of inequalities.
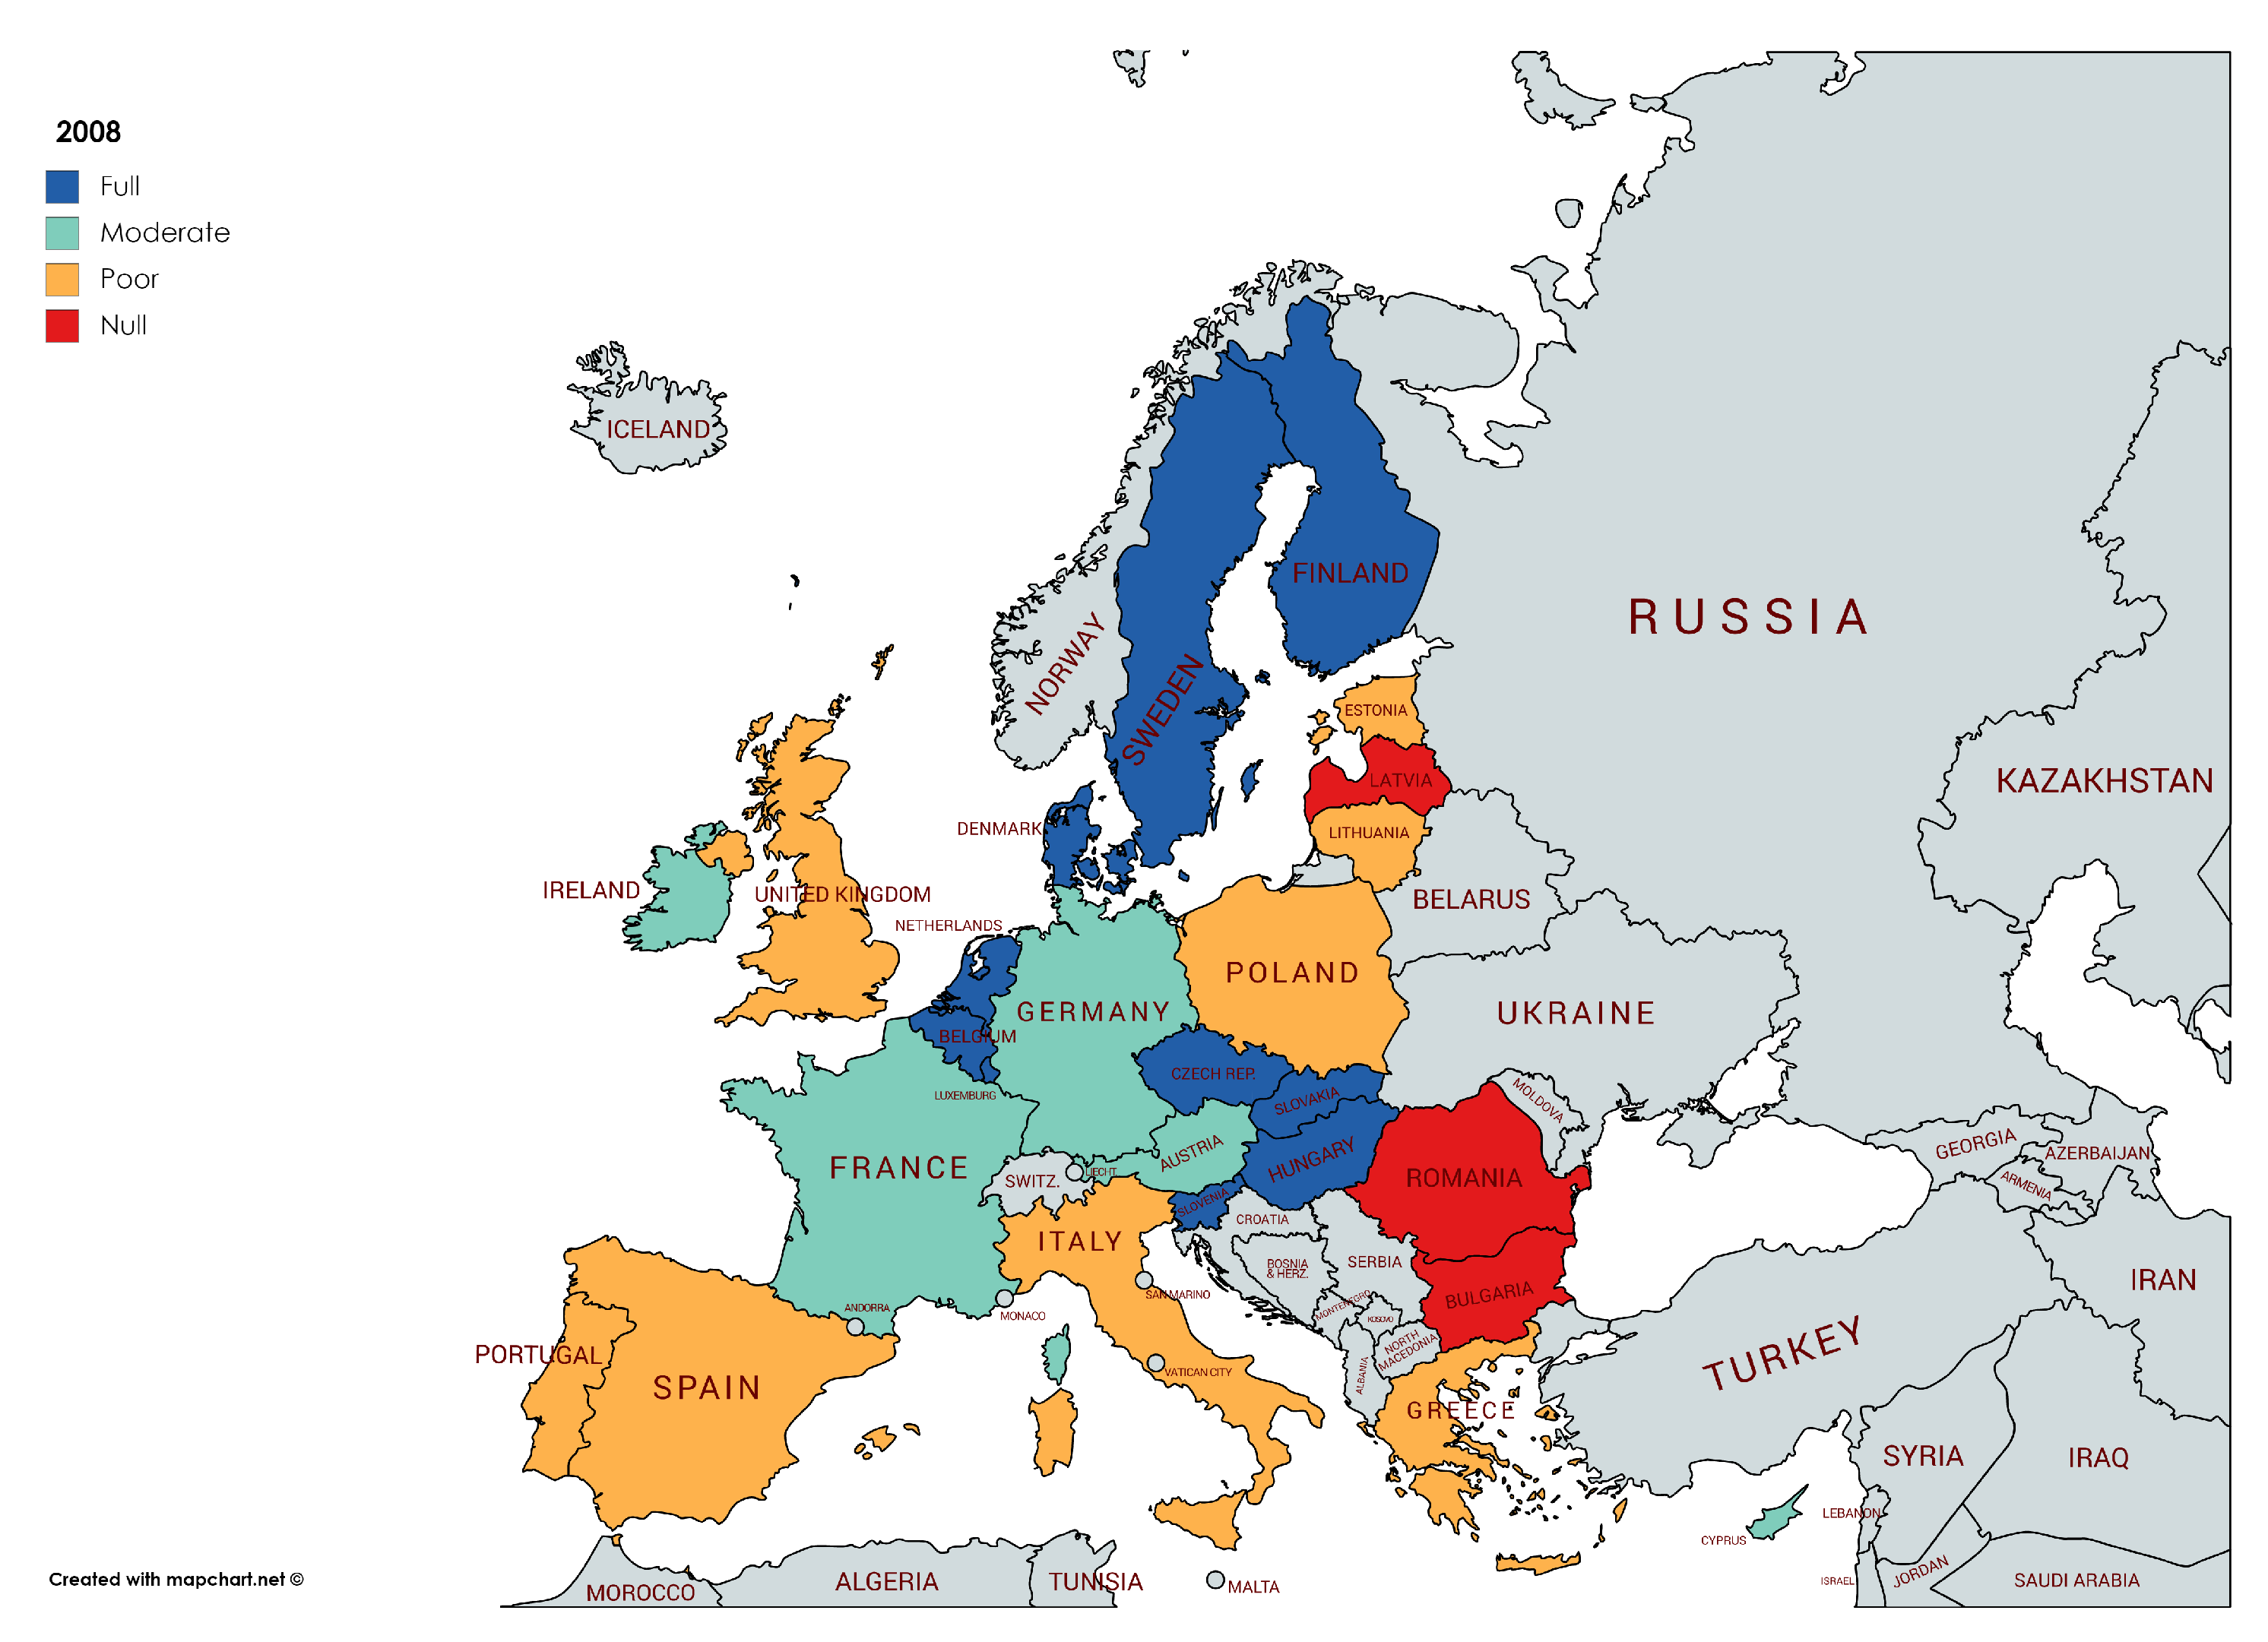
The period of expansion of the world economy ends in 2007, when the international financial crisis becomes apparent. The situation of the reduction of inequalities in Europe at that time is shown in Figure 6.
The financial crisis is hitting the European economy harshly, especially the great industrial powers of France and Germany, which are reducing their achievements on an equal footing, as well as Austria. However, the countries of the East, such as Poland and Lithuania, improve their position because of the income distribution effect that European funds are beginning to exert. On the contrary, Bulgaria, with the recent integration into the EU, worsens its performance about reducing inequalities by increasing its exposure to the market economy.
On the other hand, Portugal and Ireland are making slight progresses (see Table 6) in their fight against inequality. As a consequence of the effects that the economic recession has in these countries on the distribution of the income of capital owners in the case of Ireland [34] and the improvement of the living conditions of lower-income workers because of economic expansion in Portugal [35].
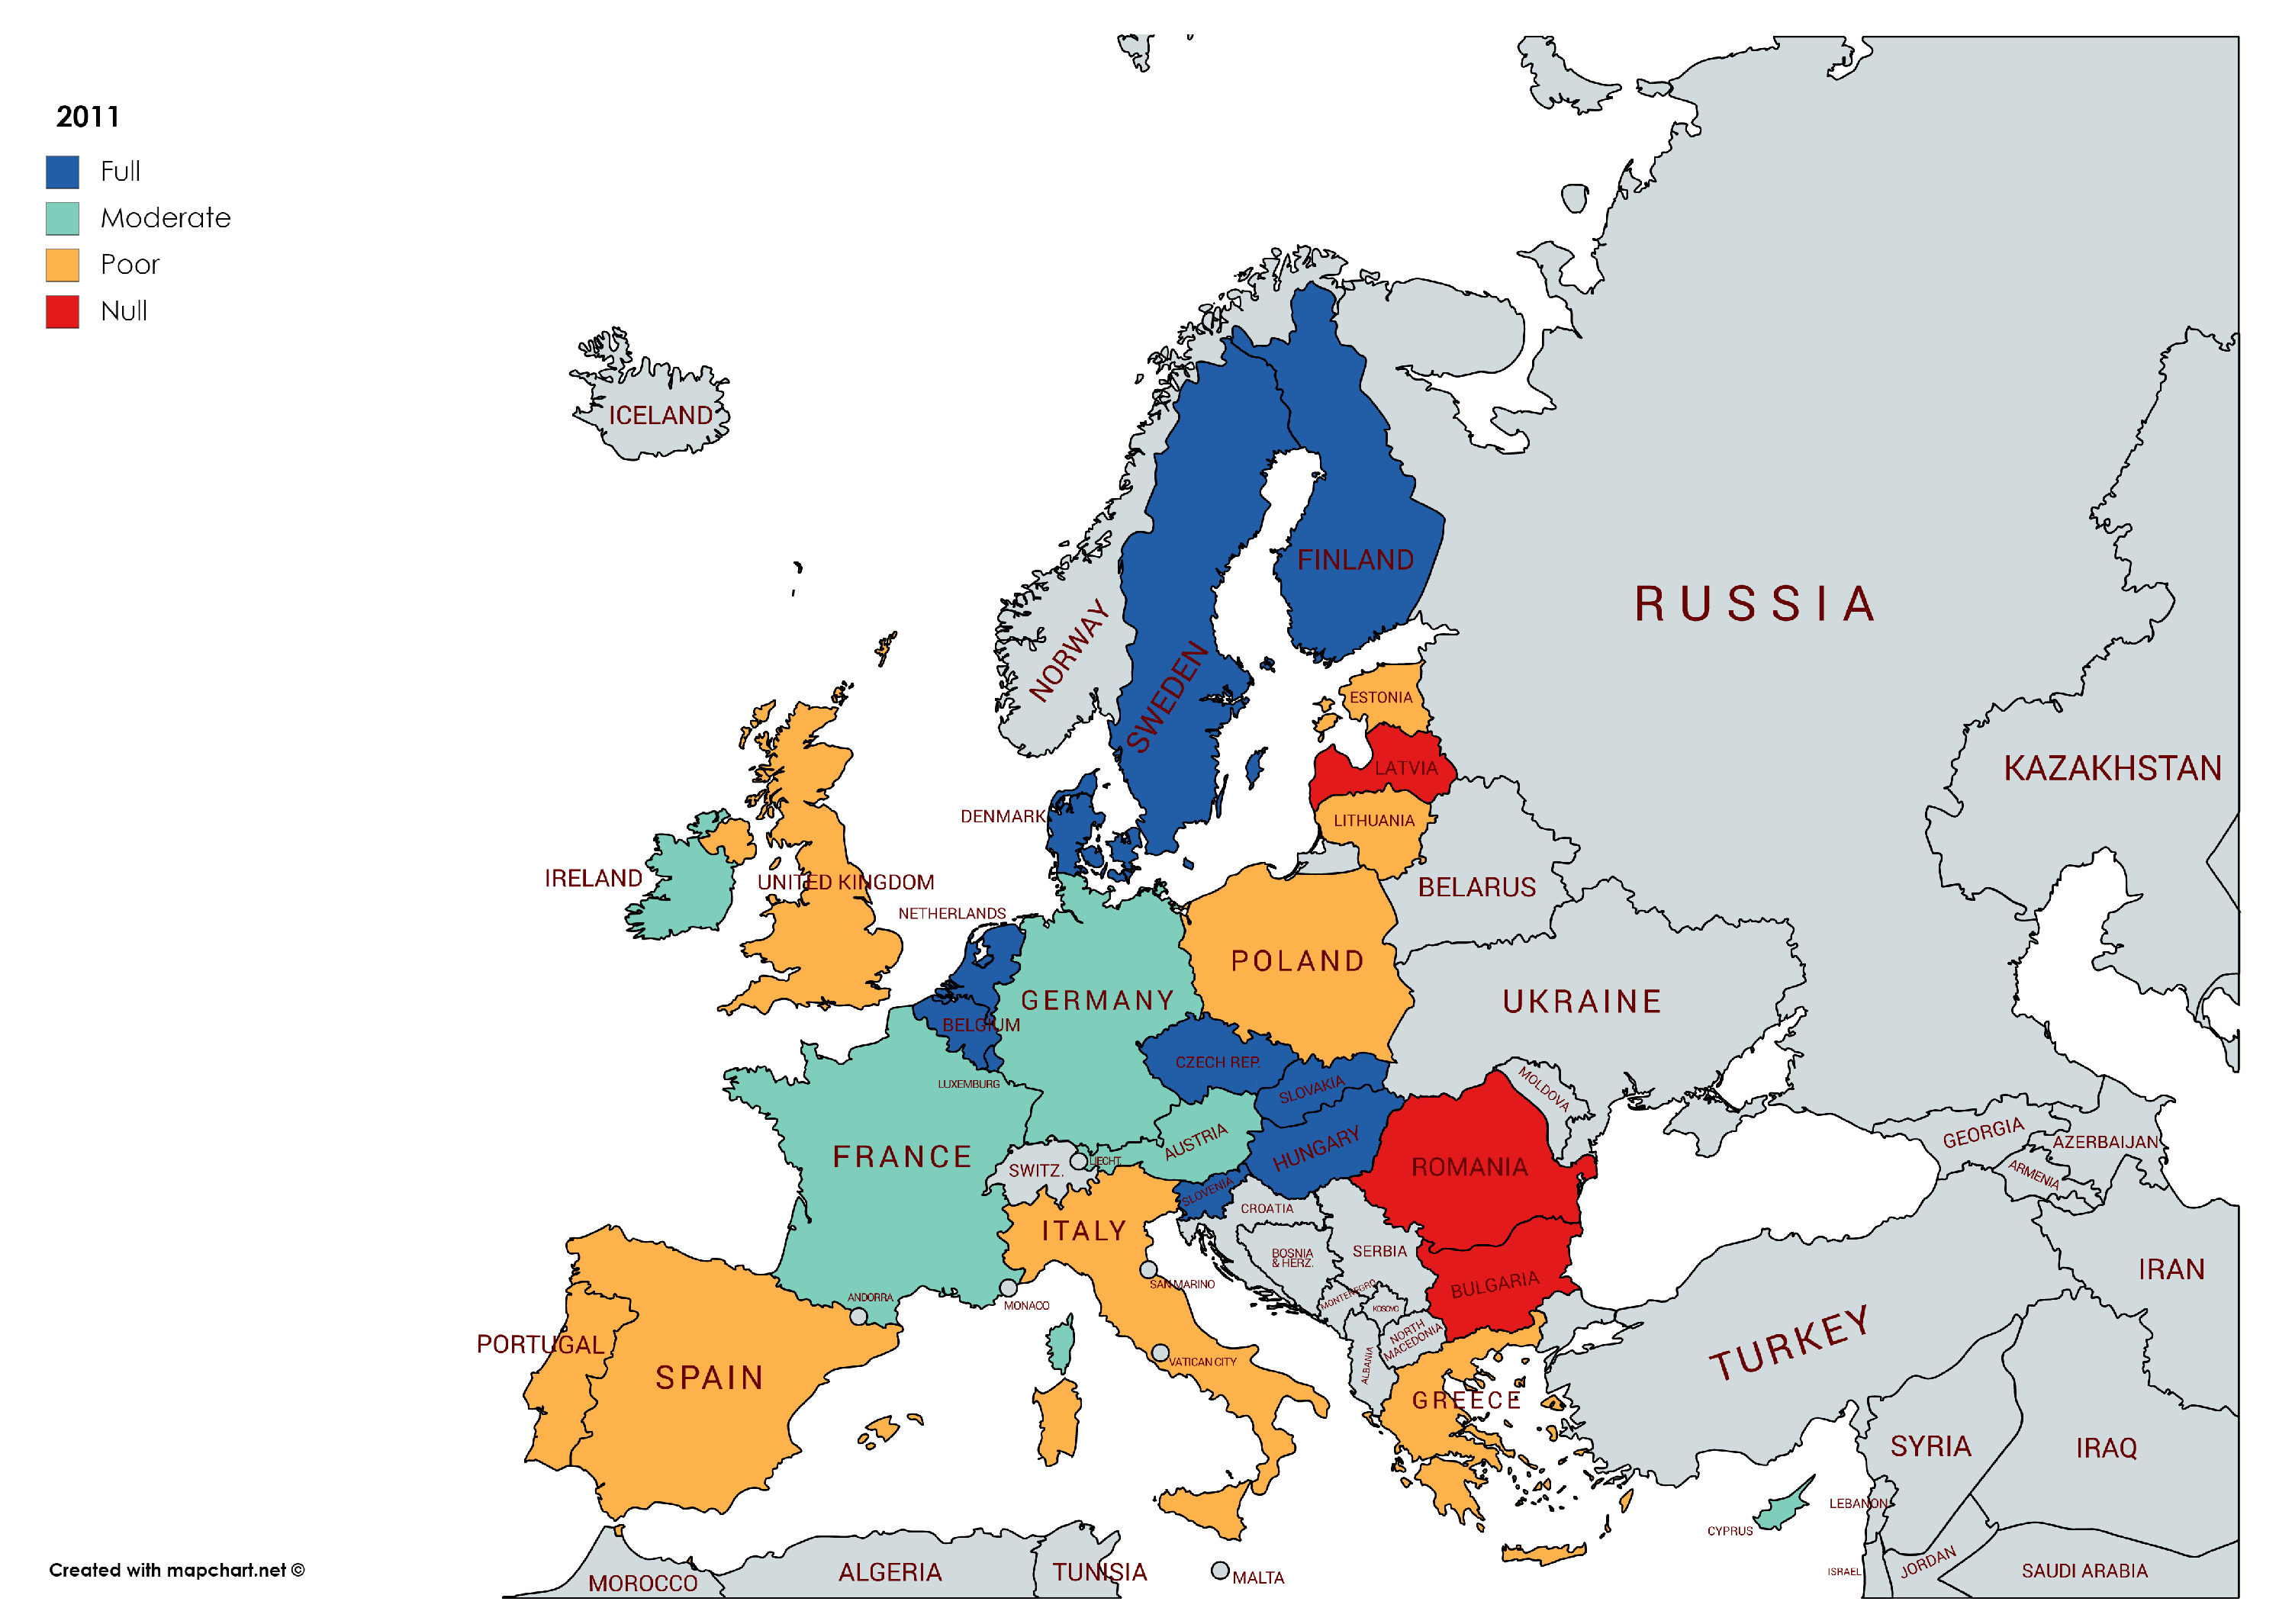
Crisis effects are more visible from 2008 on. Figure 7 shows the situation in Europe in the hardest moment of the financial crisis, when countries were most concerned about their consequences on the very common currency project. However, despite the negative impacts on GDP in 2010, causing recession in all the countries in Europe and expanding it on Portugal and Spain till 2011 [36], the categories for reducing inequality remain stable in 2011. This result suggests that inequality is not linked with growth in the short-term.
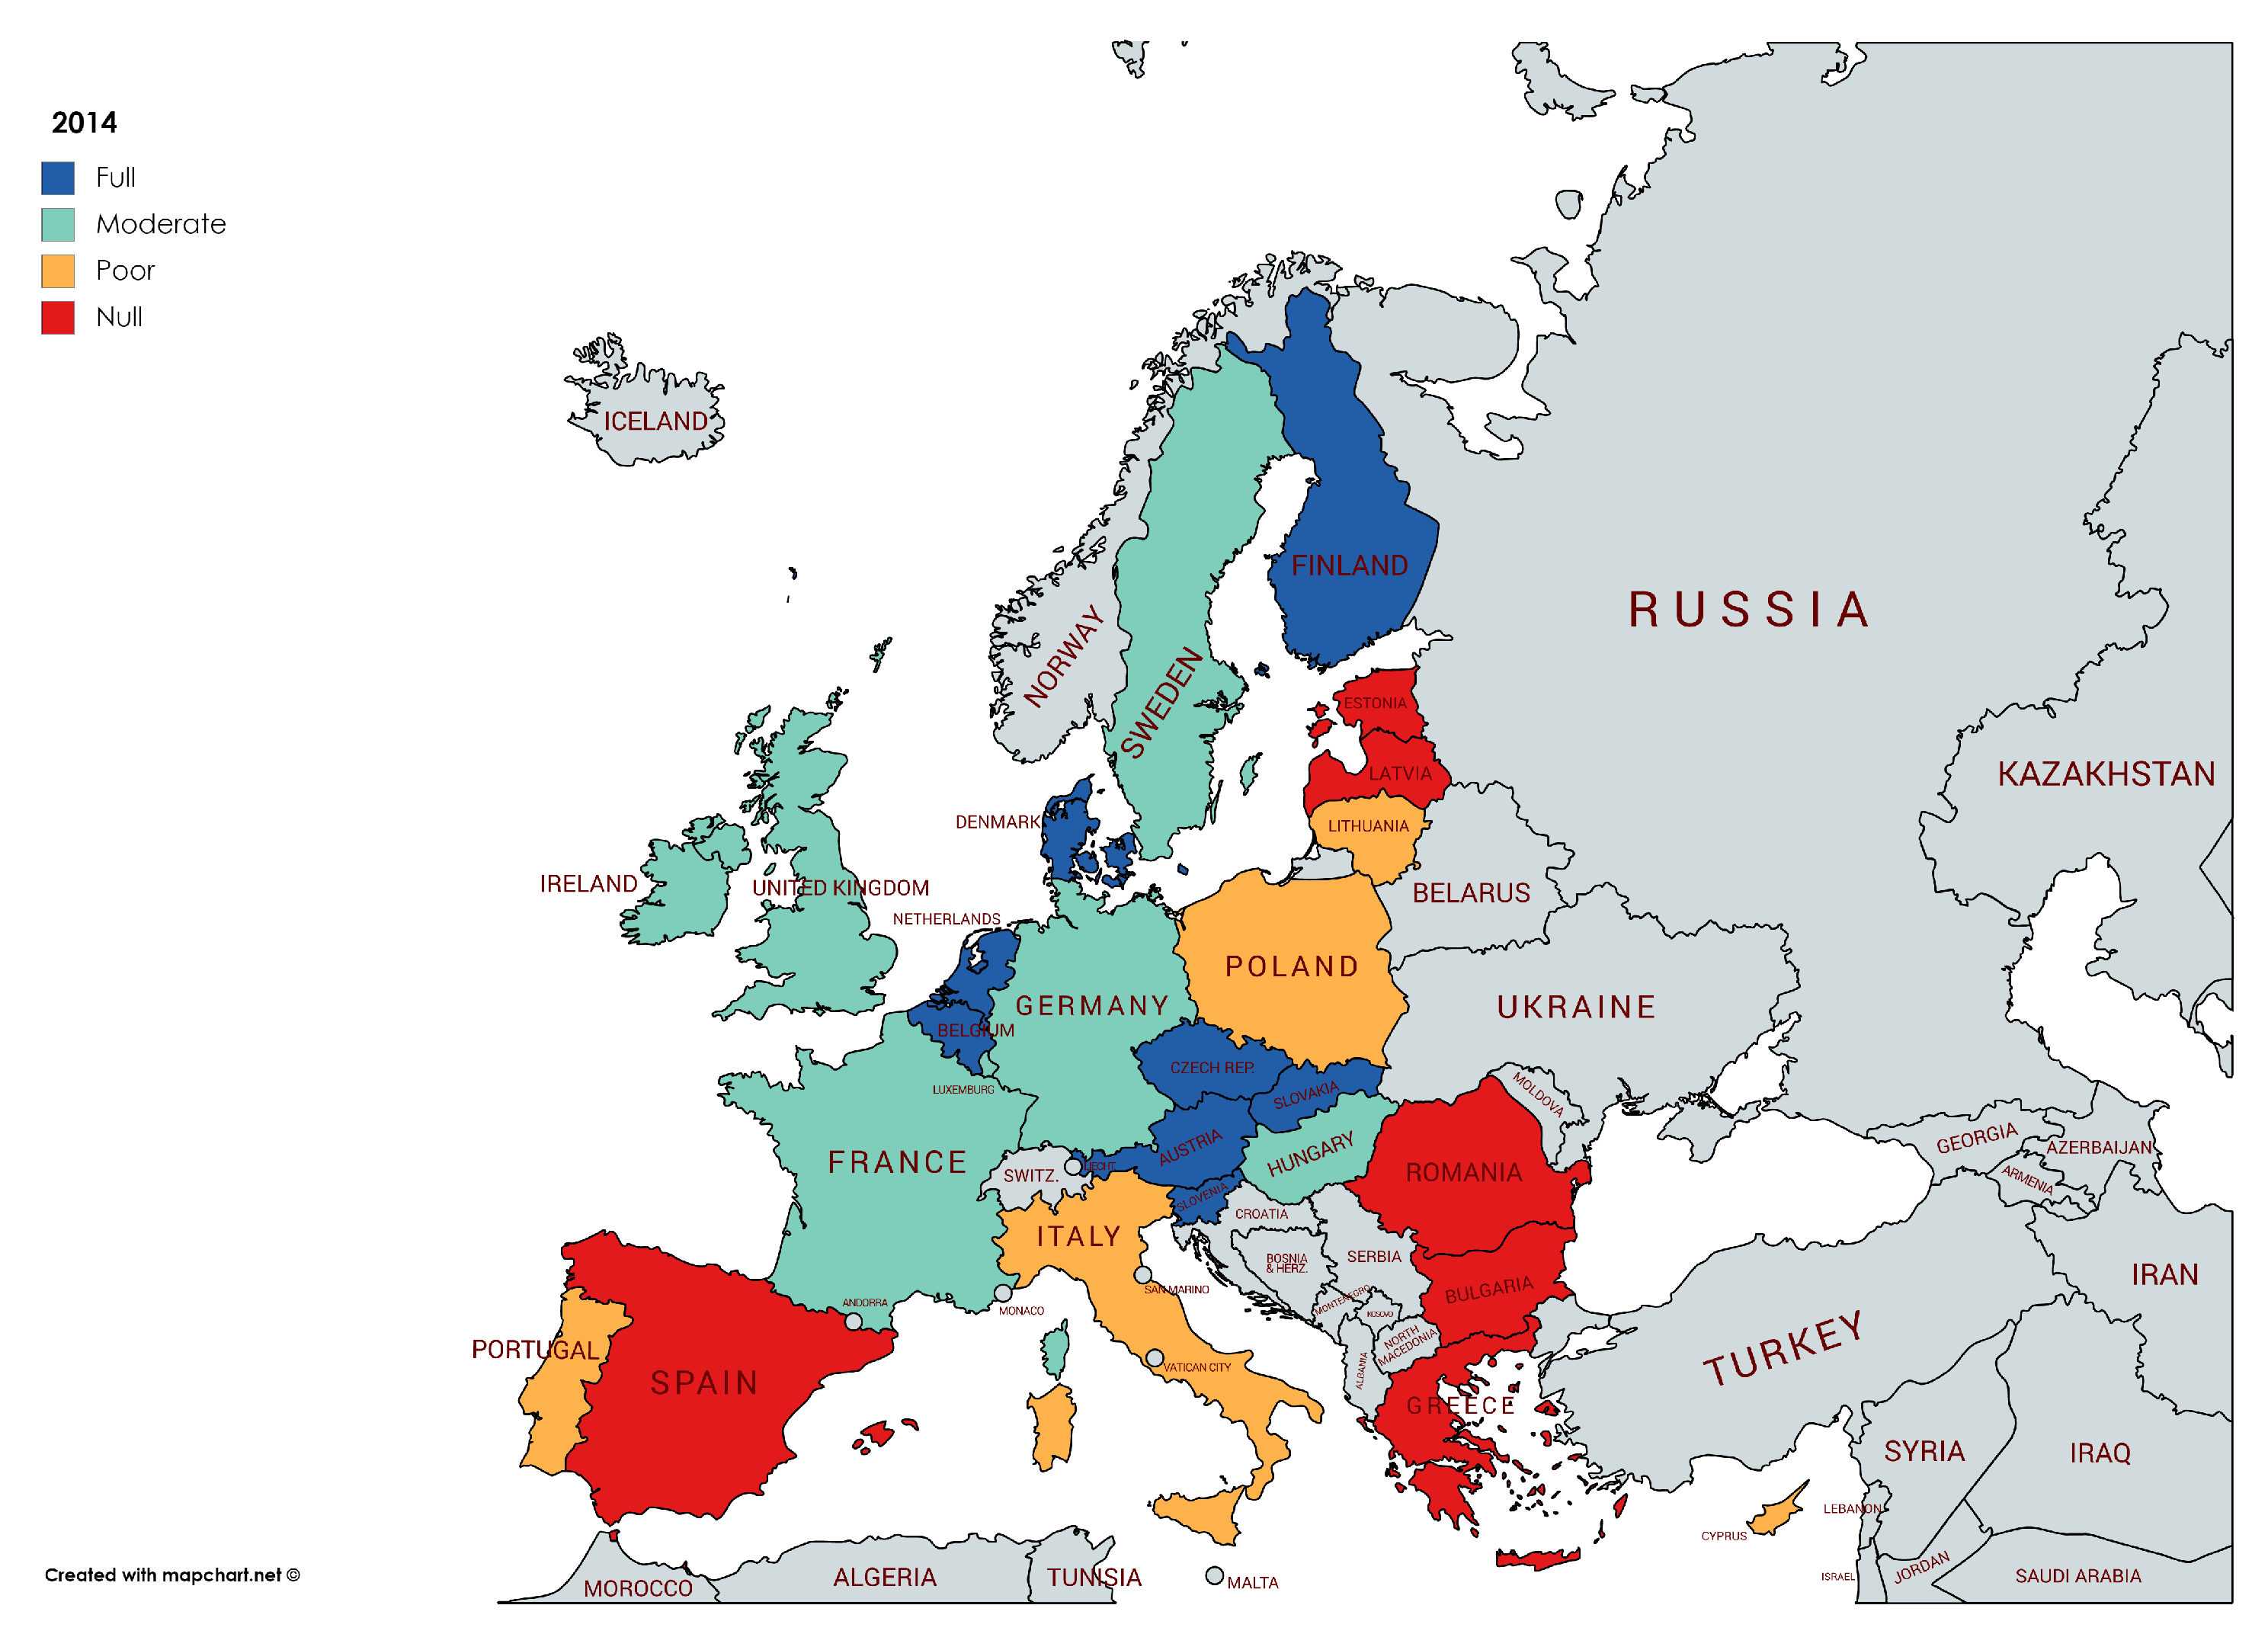
Inequality increases sharply in Europe between 2011 and 2014 due to the implementation of restrictive policies because of the idea that South countries should be more austere, committing themselves for reducing public budgets disequilibrium. However, the consequences of the austerity policies had a great impact in public employment, employment active policies and social services, producing harmful consequences on inequality across Europe [37,38,39] (see Figure 8).
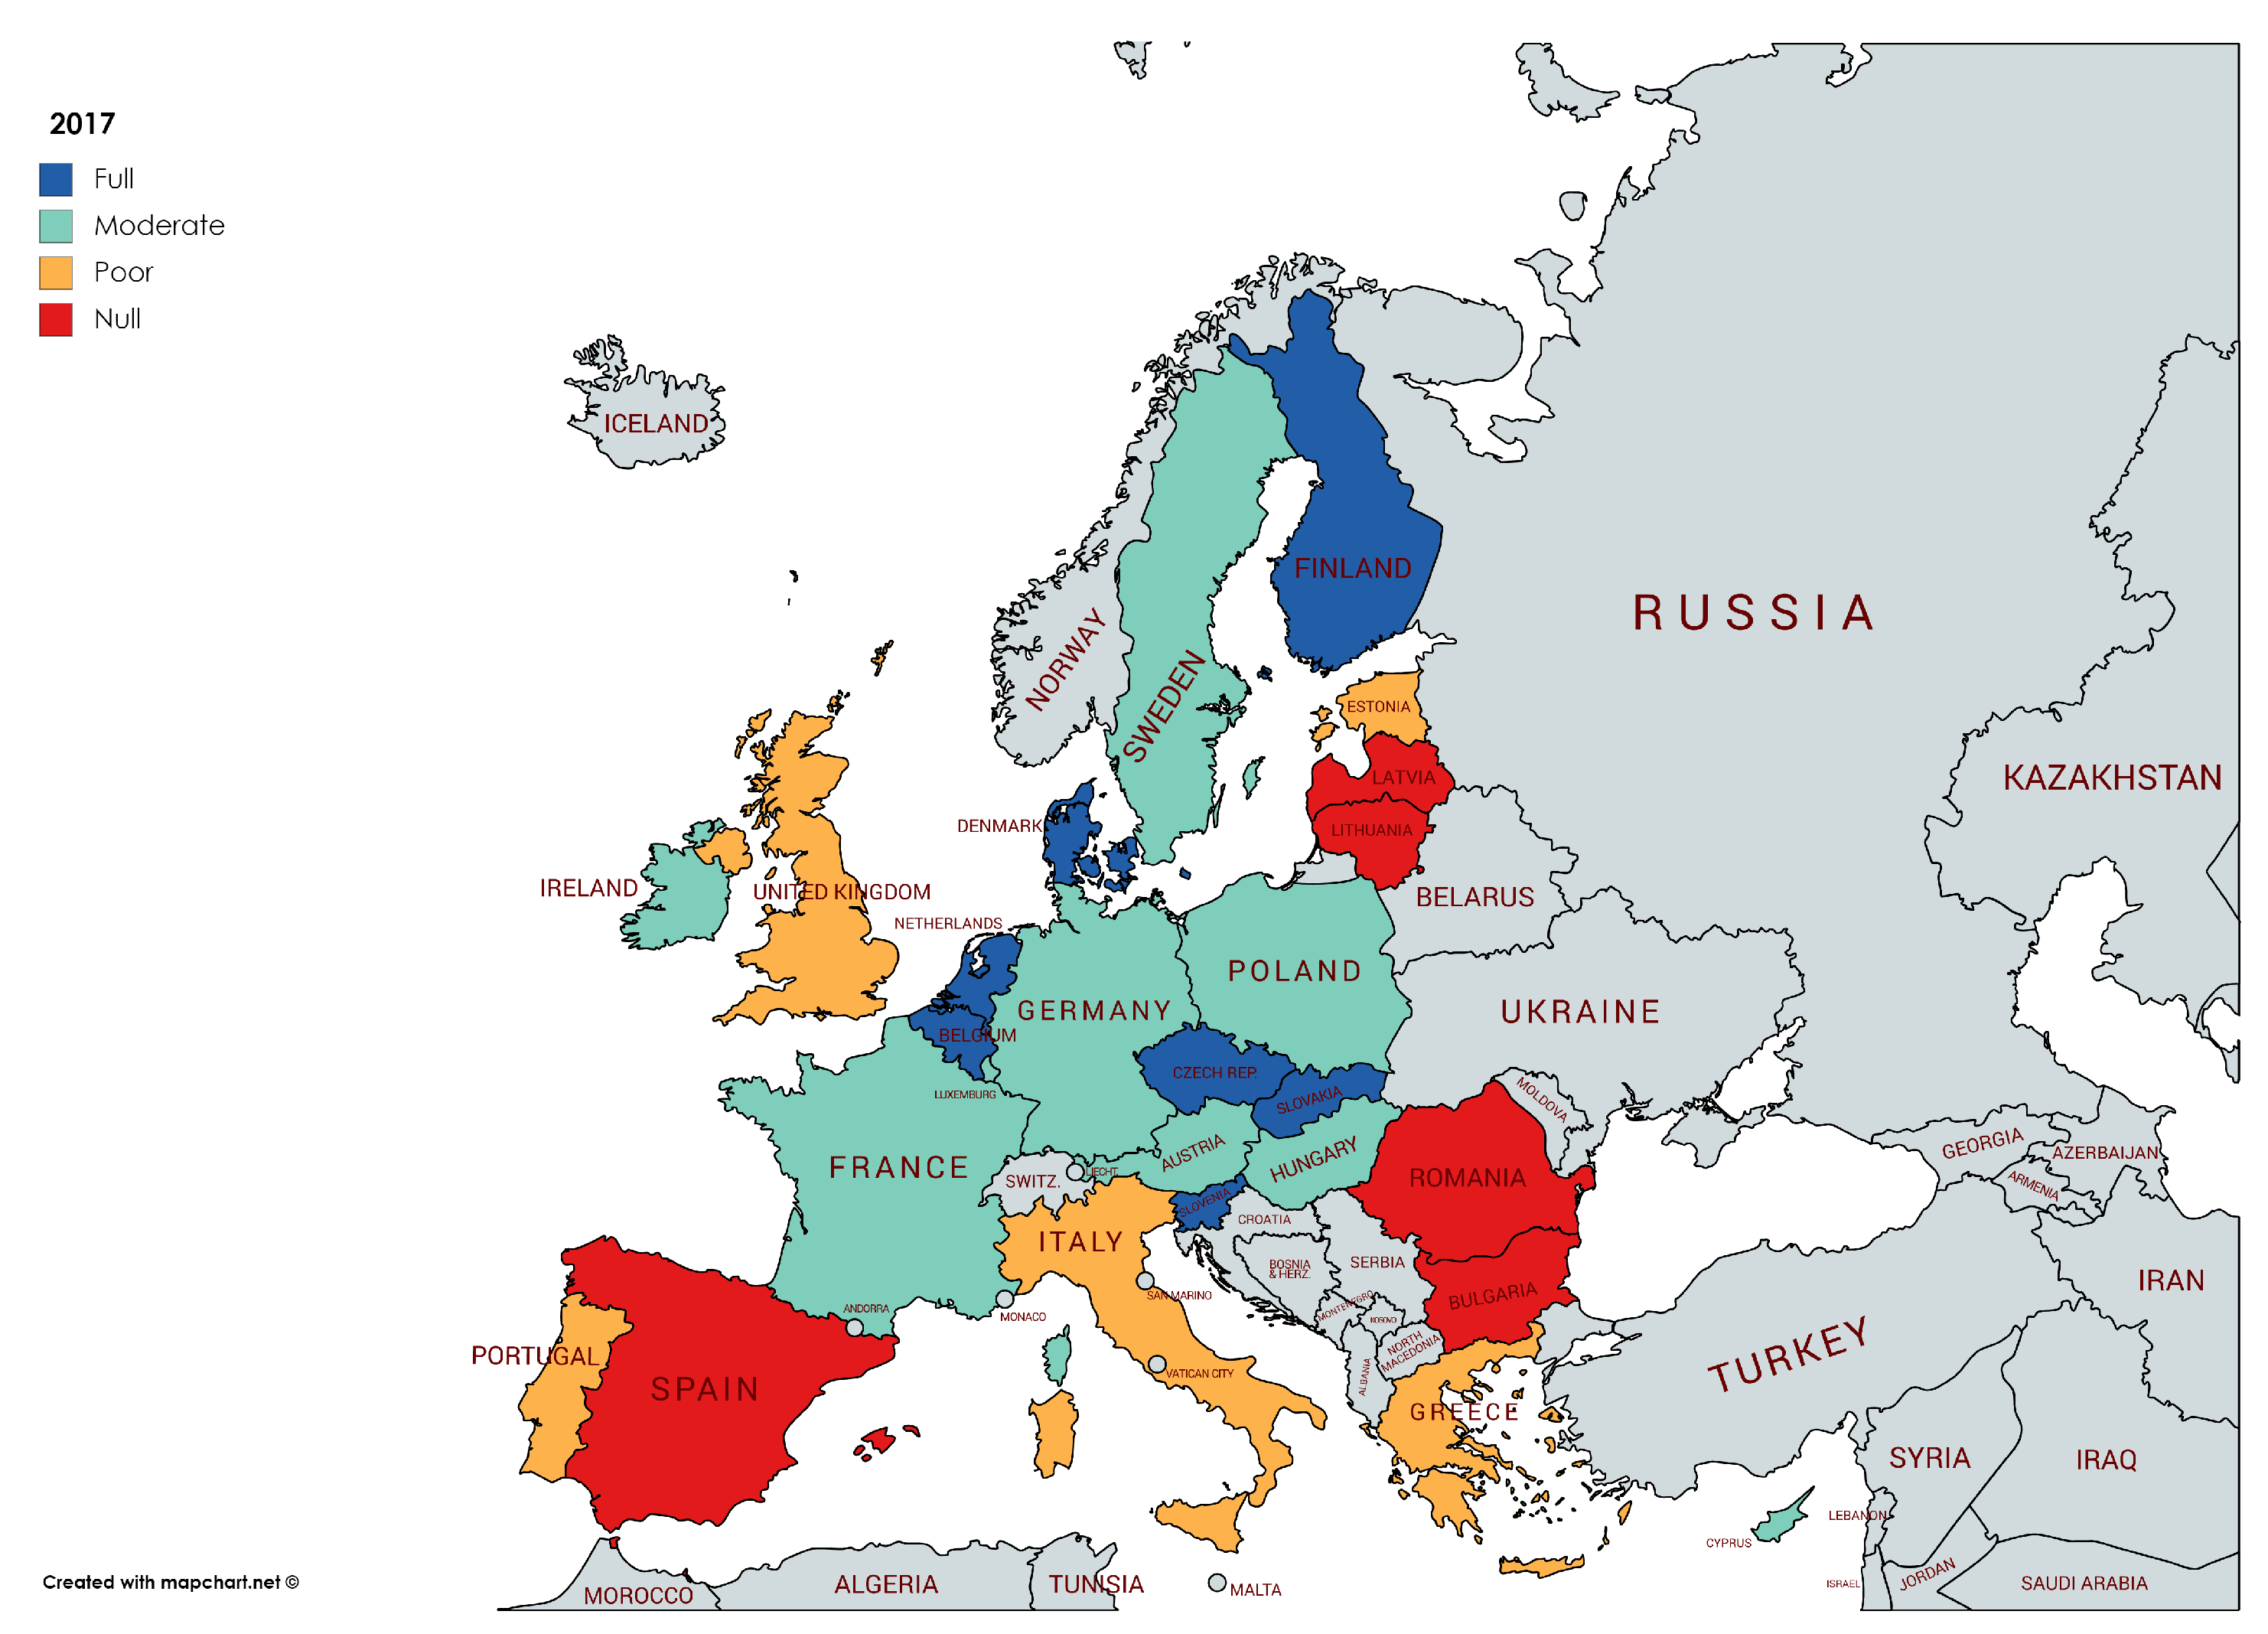
In the recovery phase, 2014–2017 the general situation in Europe does not change (see Figure 9). Inequality has even increased in Lithuania, Austria and United Kingdom, while has been reduced in Greece, Poland and Estonia, the rest of the countries keep their level of achieving the goal. If we compare the final situation in 2017 with the initial in 2005, the progress in order to reach the SDG 10th goal is negative. Peripheries do not have achieved the goal at all or have had a poor progression, but the core of Europe, that achieved fully the goal in 2005, now presents a moderate path. Then, results (see Table 7) show a regression for Europe in reaching reduced inequalities within and among countries.
The most successful countries in achieving 10th SDG during this period are Belgium, The Netherlands, Czech R., Slovenia, Slovakia, Denmark, and Finland. Poland is the country with a better progression in pursuing the goal. Is there something in common within these countries? Could we extract some policy recommendations for the less successful countries and Europe as a whole? These questions will be answered in discussion section.

3.3. Sensitive Analysis

This research presents a sorting MCDM approach whose results depend on the criteria weights. Therefore, a variation of such weights may affect to the results. Usually, a sensitive analysis is carried out in order to identify the possible changes in the ranking order of the alternatives when the criteria importance is modified. However, in our sorting approach, it is not so important the changes of the ranking as the changes in the countries classification, since one specific country may vary its position in the ranking but not its classification. For this reason, this section introduces a sensitive analysis in which we identify the minimum change needed in the weight of each criterion to make modifications in the ranking and we analyze if such new values provoke changes in the countries classification. The minimal changes applied to the weight of each criterion that provoke exchanges in the ranking and the resulting new weights for the rest of the criteria in the year 2005 are represented in Table 8.
Remark 2.
Note that, if w j and w j * are the original weight and the new weight obtained from the minimal change for the criterion c j respectively, the inferred weight w k * for the criterion c k is computed as ( 1 w j * / 1 w j ) w k .
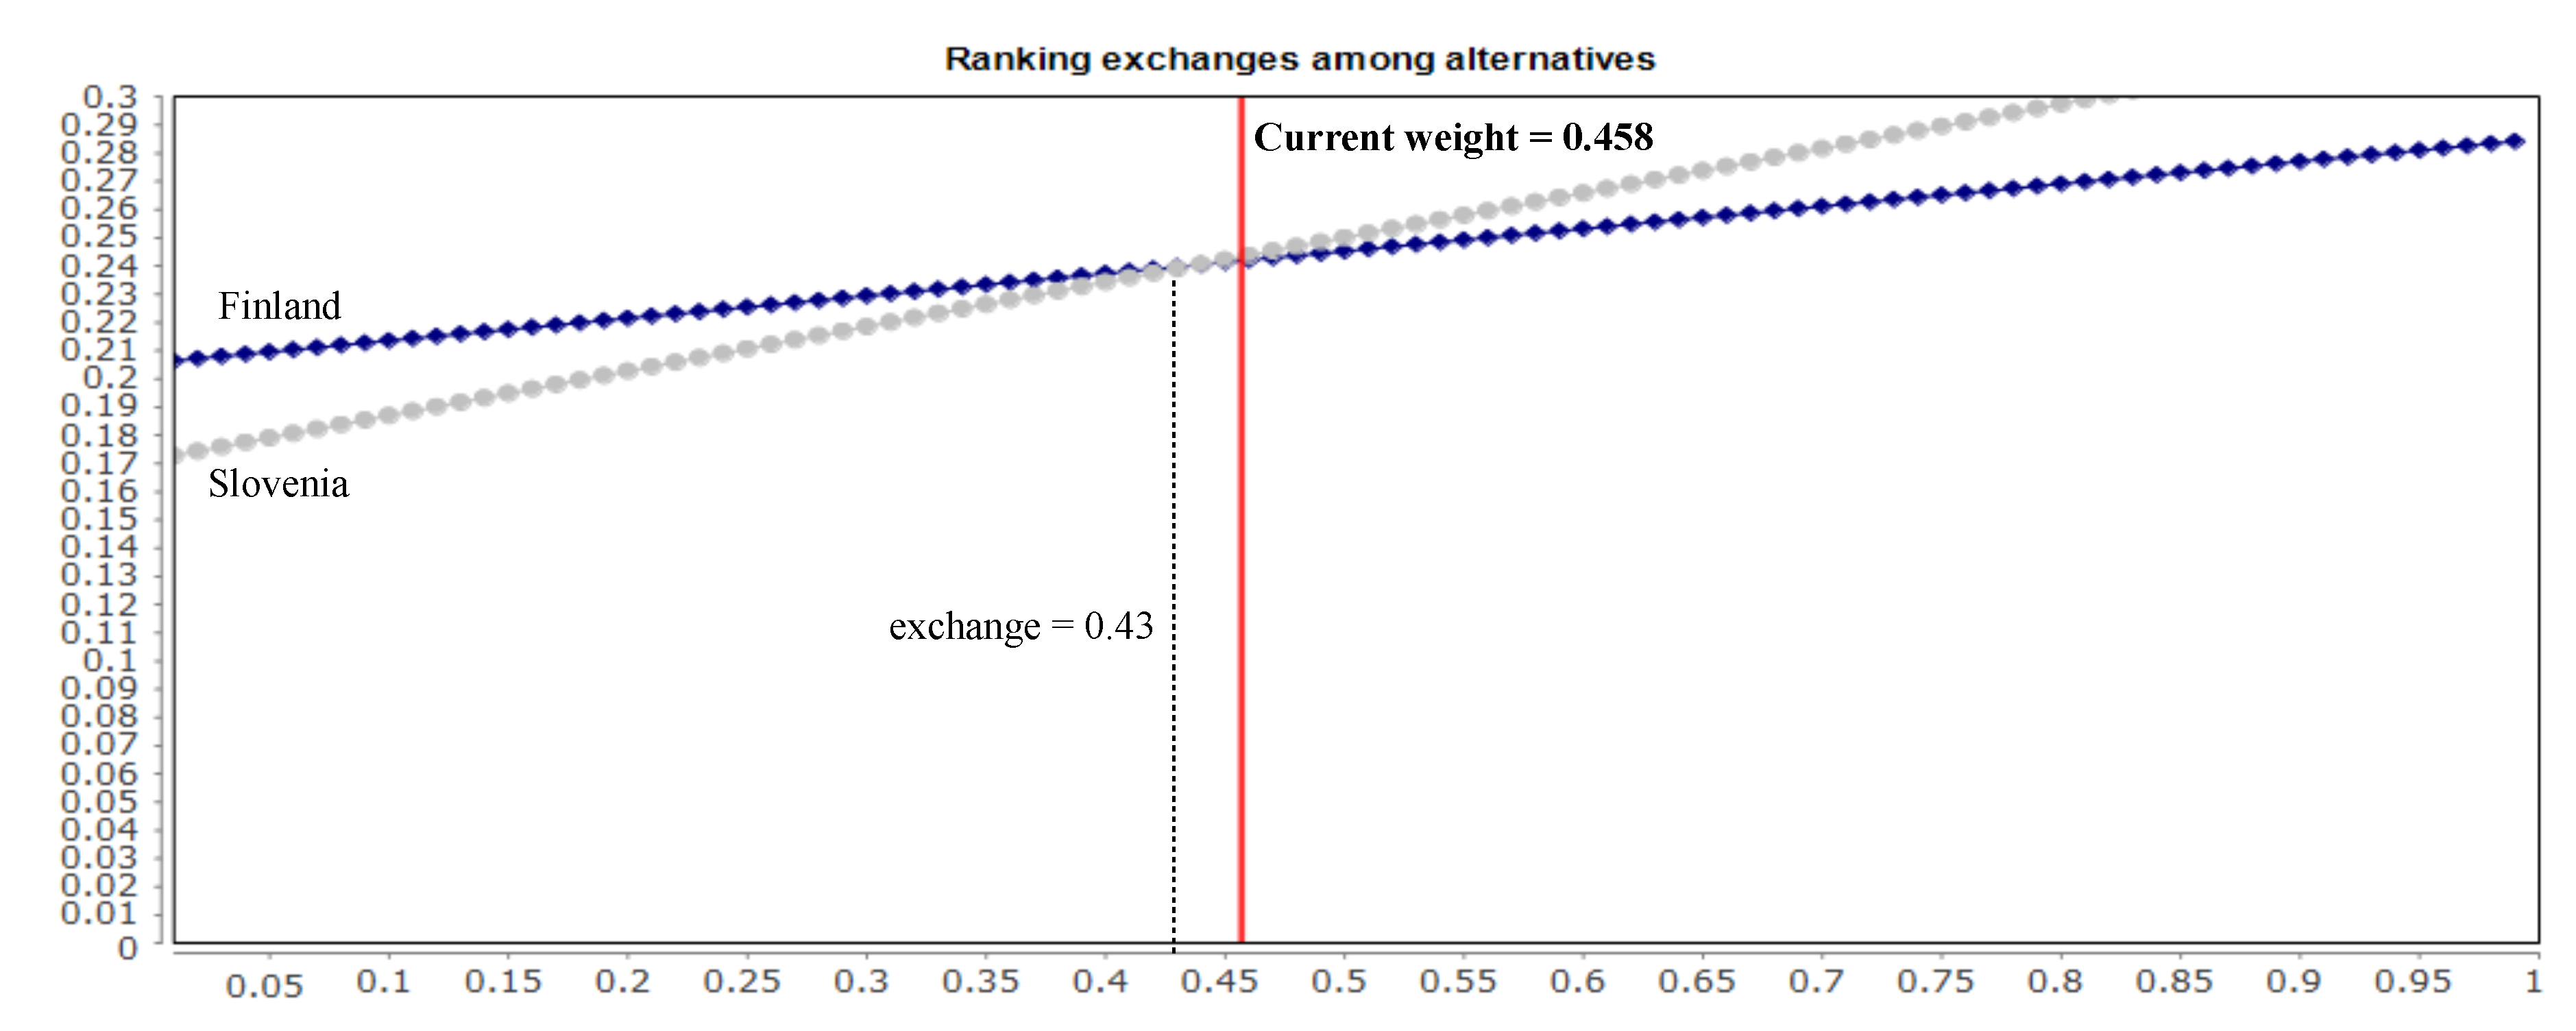
The minimal changes obtained for each criterion are computed by FLINTSTONES by following the most critical criterion approach [40], which consists of modifying the current weight of a specific criterion and identifying the minimal modification of the value of such weight that provokes a change of position in the ranking of the alternatives. Therefore, to identify the minimal change, FLINTSTONES fixes a specific weight value for the analyzed criterion (from 0.001 to 1 in increments of 0.001) and computes the weights of the rest of the criteria (see Remark 2). With the new weights, FLINTSTONES derives the global priorities of the alternatives and profiles according to the AHPSort II method’s steps and obtains the new ranking and classification. To clarify this process, Figure 10 shows the minimal change derived from the criterion c 4 . The X-axis in the plot represents the new weight for the analyzed criterion and the Y-axis the global priority of the alternatives regarding such weight. When the lines intersect means that there is a exchange of position among the alternatives for that weight. In Figure 10 we can appreciate that the minimal change in c 4 happens between the alternatives Slovenia and Finland when its weight is equal to 0.43, as it is shown in Table 8. The minimal changes of the rest of the criteria are derived in a similar way.
Remark 3.
Note that, for the sake of clarity, Figure 10 shows only the alternatives related to the minimal change for the criterion c 4 , but FLINTSTONES derives the global priorities for each new value of its weight for all the alternatives.
From the minimal changes, we carry out again the classification process by using FLINTSTONES and AHPSort II in order to check if countries classification is different with the new weights. Table 9 shows the ranking and classification of the countries in the year 2005 obtained by using the new criteria weights and we can appreciate that, despite the fact that there are changes in the ranking of the countries in terms of overall ranking and even between criteria, their classification remains the same.
Remark 4.
Similar results are obtained for the years 2008, 2011, 2014 and 2017, thus they are omitted here.

4. Discussion

The most performer countries regarding to inequalities have in common some structural characteristics in their economies and institutional systems. On the one hand, all of them have a very complex economic system connected with global value chains. This framework brings about a high level of employment, high levels of women participation in the labor market and low levels of unemployment. On the other hand, their institutional system is complex and focused in permitting equal opportunities. Some of them have a very deep welfare state, which is the case of Belgium, Finland or Denmark, with a high level of protection for unemployed and people at risk of exclusion. Homogeneous societies could be a main characteristic, given the reduced size of the countries achieving the goal.
On the other side, there are countries less connected with global economy, such as Bulgaria or Romania, and the South of Europe, with a less complex production system than the North, and a not enough developed social protection system, which has provoked an intense impact of the financial crisis in the poorest. In cases such as Italy, for instance, the inequality is not due to an increase in the income of richest but a reduction in the income of poorest [41].
Hence, we could remark two dynamics conditioning the path towards reaching the 10th SDG. The first one is in the microeconomic area: globalization process, technological change and institutional transformations in labor market affecting work flexibilization and bargaining [42,43,44,45]. The second one is macroeconomic: the push fullness of liberal ideas over social-democrat ones in Europe [4] have brought about a reduction in fiscal progressive policies, giving rise to an increasing process of inequality in a medium and long term [12].
Nowadays, inequality is not reduced only for the sake of growth, as the inverted U model proposed by [46]. The economic structures of the current world have changed dramatically since then. Income inequality within a country is the result of mechanisms involving labor markets, and multinational companies exert an important influence on wage disparities, due to their territorial strategies to make the most of globalization processes [47]. In this line, microeconomics and macroeconomics effects reinforce each other their influence on raising inequalities, since the capacity for unions to bargain has been reduced because of the dynamics of international outsourcing and offshoring.
The effects of globalization are tougher when regional and national economies are simpler. Ref. [48] demonstrate that countries exporting more complex products tend to have lower levels of income inequality than countries exporting simple products. The microeconomics sphere matters in order to prevent inequality to rise.
However, technological change is conditioning the traditional trade-off between labor and capital in favor of the second. More importantly, in the coming years artificial intelligence could alter the structure of basic occupations, which will be an important challenge to face in order of achieving the 10th SDG.
In sum, three dynamics could be identified in the labor market contributing to inequality:
  • Precariousness in the access of youths to labor market [43].
  • Reduced bargaining power of unions [45].
  • Outsourcing of more intense labor tasks [42] and, as a consequence, the emergence of false freelances [44].
In the macroeconomics sphere is important to bear in mind the effects of elites in the design of economic policies. [33] aim that some social groups push for defining policy priorities in their favor. These commitments give rise to fiscal structures seeking capture rents at expense of general interest [49,50,51].
In Europe, national institutional frameworks are very different. This could be an explanation of persisting inequalities in the long term throughout Europe [52]. As a matter of fact, besides having a strong welfare state consisting in opportunities to find good jobs and the access to good public education and health systems, three social innovation dynamics could be identified for the inequality reduction, which have been more clearly implemented in countries better achieving the goal:
  • Dynamics of sharing value between external firms and local societies [53], consisting in developing strategic local linkages for multinational companies to better compete in global value chains, instead of extracting local natural resources and using low value added human resources.
  • Some countries with a good structure of social economy, helping small entrepreneurs to reach an international capacity to compete in a global market, are in the group with full performance [54].
  • A strategic participation of workers in the decision process of big companies, which opens empowering capacities for employees to obtain better rewards for their work [55].
The institutional disparity has contributed to reduce the offsetting effects of national policies in presence of increasing inequalities process, especially in the South of Europe, whose countries have seen how austerity policies prevented compensate the social impacts of financial crisis [47]. Tendencies were worst because in Central European countries, in addition to a wider welfare state and the behavior of automatic stabilizers, there was a most reduced private indebtedness, all of which contributed to increase inequality among countries.
The most important problem derived from inequality is its capacity to pass on through generations, linked to the inequality of opportunities. Inclusive institutions should be developed in order to break this tendency, but political agendas, economic interests and regressive laws limit social mobility [56]. In fact, there is a strong influence of social and family networks in the scope of education and equality of opportunities, determining social mobility processes and their consequences on inequality [47].
Inequality is a consequence of microeconomic and macroeconomic processes, but it is also an origin of problems [57], such as polarization of societies, putting at risk social cohesion and security, and territorial disparities, since metropolitan regions record on average higher levels of standard of living than other regions [58,59].
Nevertheless, a certain level of inequality could incentive economic development, such as the cases of countries achieving 10th SDG in Europe. They are not equal societies at all, but they are far from countries with null or poor performance in reducing inequalities. The idea that European policy makers should take into account is that increasing inequality above moderate levels may cut aggregate demand and thereby European economic growth, making a vicious circle of rising inequality and slower growth [60].

5. Conclusions

The consequences of a concentration of income have been demonstrated on long-term growth [61], and the role of institutions and technical change [62,63]. Therefore, it seems logical the importance of measuring the evolution of inequalities in EU countries and evaluating the achievements reached by them according to Agenda 2030. This contribution presents a new approach to achieve such aim, in which the MCDM method AHPSort II is used to classify the EU countries into different categories according to their fulfillment of 10th SDG. The classification has been carried out in different time intervals, 2005, 2008, 2011, 2014 and 2017 and it has allowed obtaining very interesting conclusions.
The EU is concerned about inequality, which is gaining momentum in the policy debate, but there is much effort to do it for achieving 10th SDG in the coming years [64]. Social transfers are important to reduce inequality, protecting the most vulnerable and fostering economies to recover from crisis. Nevertheless, the first important idea to bear in mind is that the only relevant policy for fighting against inequality is not the redistributive one. It is necessary to act in the microeconomic sphere, since inequality has microeconomic origins too. Labor markets, innovation, education and social integration are important fields to implement new policies in order to reduce inequalities in Europe.
Labor markets policies making effective bargaining processes between workers and companies, facilitating rewarding salaries and conditions, such as minimum wages guaranteeing the standard of living in each country. Besides, social benefits in order to conciliate family and work spheres are in the core of improving microeconomic policies for reducing inequalities [65].
Innovation policies should be in the center of a seemingly new generation of industrial policies in a new context of world competition, where countries are incorporating general discontent for globalization consequences on inequalities. For Europe, a wider place-based strategy for reducing inequality and territorial disparities should be generally implemented [66], following the model of Germany and United Kingdom in Europe, but also Japan and USA, who have been pursuing competitive industrial policies for decades [67].
Education policies are key tools in the long term. State investments in education may alter the supply of skilled workers changing the wage schemes in the labor market. The experience has demonstrated that countries having spent more on education tend to have not only better skilled worker but higher educational mobility as well. Actually, social mobility is one of the elements Europe needs to reduce inequality in a medium term, and education policies and mechanisms to facilitate the transitions from schools to work are fundamental pieces for reducing the risk of increasing inequalities in Europe [68].
Austerity policies have led southern countries in Europe to a race to the bottom, which has widened social and territorial inequalities within and among countries. In order to achieve the 10th SDG a change in the policy mixed is needed to include social integration objectives. However, progressive fiscal policies face opposition of social elites who struggle for keeping their advantages for them and for their off-springs. Macroeconomic policies in tax designs should be applied to revert the inequality process in countries with a poor or null performance.
In sum, on the one hand, microeconomics actions should be attended. Developing companies’ networks, regional innovation systems, sectorial institutions and improving the level of social and economic structures are important. All this elements push territorial development processes in Europe and they are important pillars to fight against inequalities [69]. Furthermore, the latter contribute to extend the opportunities for choosing occupations and improving skills, preventing increasing inequalities from now on.
On the other hand, the future demands policy actions in the macroeconomics sphere. In the coming years a great expansion of national budgets are going to be needed in order to attend the ageing process of European society. The needs must be matched but it is responsibility of Europe to do it in a more integrated society or in a more unequal one. Social innovation policies must be implemented with the coordination of different tiers of government if Europe wants to consolidate 10th SDG. Guaranteeing equal opportunities in the access to education, health and social protection systems is compulsory for European societies. And it is important not only for the sake of reducing inequalities but also for the sake of growth processes, since they could be burdened due to the loss of potential human resources in fostering social and technical innovation in the future Europe.
Author Contributions

Conceptualization, Á.L., J.C.R.-C., J.D.S.-M. and L.M.; methodology, Á.L. and L.M.; software, Á.L.; validation, Á.L., J.C.R.-C., J.D.S.-M. and L.M.; formal analysis, J.C.R.-C. and J.D.S.-M.; investigation, Á.L., J.C.R.-C., J.D.S.-M. and L.M.; writing—original draft preparation, Á.L., J.C.R.-C., J.D.S.-M. and L.M.; supervision, L.M.; funding acquisition, L.M. All authors have read and agreed to the published version of the manuscript.

Funding

This research was funded by the Spanish Ministry of Science, Innovation and Universities through the Spanish National Research Project PGC2018-099402-B-I00.

Conflicts of Interest

The authors declare no conflict of interest.

Abbreviations

The following abbreviations are used in this manuscript:
SDGSustainable Development Goal
EUEuropean Union
MCDAMulti-criteria Decision Analysis
MCDMMulti-criteria Decision Making
AHPAnalytic Hierarchy Process
RPReference Profile
FLINTSTONESFuzzy LINguisTic DeciSion TOols eNhacemEnt Suite

References

  1. United Nations. Transforming Our World: The 2030 Agenda for Sustainable Development; United Nations, Department of Economic and Social Affairs: New York, NY, USA, 2015. [Google Scholar]
  2. European Commission. Communication from the Commission to the European Parliament, the Council, the European Economic and Social Committee and the Committee of the Regions: EU Action Plan Against Wildlife Trafficking; European Commission: Brussels, Belgium, 2016. [Google Scholar]
  3. European Union. Consolidated version of the treaty of functioning of the European Union. Off. J. Eur. Union 2012, 326, 26. [Google Scholar]
  4. Boushey, H.; DeLong, J.B.; Steinbaum, M. After Piketty: The Agenda for Economics and Inequality; Harvard University Press: Cambridge, MA, USA, 2017. [Google Scholar]
  5. Stockhammer, E. Rising inequality as a cause of the present crisis. Camb. J. Econ. 2015, 39, 935–958. [Google Scholar] [CrossRef] [Green Version]
  6. Bellettini, G.; Delbono, F.; Karlström, P.; Pastorello, S. Income inequality and banking crises: Testing the level hypothesis directly. J. Macroecon. 2019, 62, 103054. [Google Scholar] [CrossRef]
  7. European Commission. Towards a Sustainable Europe by 2030; European Commission: Brussels, Belgium, 2019. [Google Scholar]
  8. Piketty, T. About capital in the twenty-first century. Am. Econ. Rev. 2015, 105, 48–53. [Google Scholar] [CrossRef] [Green Version]
  9. Atkinson, A.B. On the measurement of inequality. J. Econ. Theory 1970, 2, 244–263. [Google Scholar] [CrossRef]
  10. Martín-Legendre, J.I. The challenge of measuring poverty and inequality: A comparative analysis of the main indicators. Eur. J. Gov. Econ. 2018, 7, 24–43. [Google Scholar] [CrossRef] [Green Version]
  11. Cowell, F.A. Measurement of inequality. Handb. Income Distrib. 2000, 1, 87–166. [Google Scholar]
  12. Blanchet, T.; Chancel, L.; Gethin, A. How unequal is Europe? Evidence from distributional national accounts. In WID. World Working Paper; World Inequality Lab: Paris, France, 2019; Volume 6. [Google Scholar]
  13. Galbraith, J.K. Inequality, unemployment and growth: New measures for old controversies. J. Econ. Inequal. 2009, 7, 189–206. [Google Scholar] [CrossRef] [Green Version]
  14. Stanícková, M. Can the implementation of the Europe 2020 Strategy goals be efficient? The challenge for achieving social equality in the European Union. Equilibrium. Q. J. Econ. Econ. Policy 2017, 12, 383–398. [Google Scholar] [CrossRef] [Green Version]
  15. Roy, B. The optimisation problem formulation: Criticism and overstepping. J. Oper. Res. Soc. 1981, 32, 427–436. [Google Scholar] [CrossRef]
  16. Ishizaka, A.; Pearman, C.; Nemery, P. AHPSort: An AHP-based method for sorting problems. Int. J. Prod. Res. 2012, 50, 4767–4784. [Google Scholar] [CrossRef]
  17. Figueira, J.; Greco, S.; Ehrgott, M. Multiple Criteria Decision Analysis: State of the Art Surveys; Springer Science & Business Media: New York, NY, USA, 2005; Volume 78. [Google Scholar]
  18. Aguaron, J.; Teresa Escobar, M.; Maria Moreno-Jimenez, J.; Turon, A. AHP-Group Decision Making Based on Consistency. Mathematics 2019, 7, 242. [Google Scholar] [CrossRef] [Green Version]
  19. Kang, H.Y.; Lee, A.H.I.; Chan, Y.C. An Integrated Fuzzy Multi-Criteria Decision-Making Approach for Evaluating Business Process Information Systems. Mathematics 2019, 7, 982. [Google Scholar] [CrossRef] [Green Version]
  20. Sun, C.; Li, S.; Deng, Y. Determining Weights in Multi-Criteria Decision Making Based on Negation of Probability Distribution under Uncertain Environment. Mathematics 2020, 8, 191. [Google Scholar] [CrossRef] [Green Version]
  21. Saaty, T.L. Decision Making for Leaders: The Analytic Hierarchy Process for Decisions in a Complex World; RWS Publications: Pittsburgh, PA, USA, 1990. [Google Scholar]
  22. Miccoli, F.; Ishizaka, A. Sorting municipalities in Umbria according to the risk of wolf attacks with AHPSort II. Ecol. Indic. 2017, 73, 741–755. [Google Scholar] [CrossRef] [Green Version]
  23. Forman, E.H.; Selly, M.A. Decision by Objectives: How to Convince Others That You Are Right; World Scientific: London, UK, 2001. [Google Scholar]
  24. Estrella, F.J.; Espinilla, M.; Herrera, F.; Martínez, L. FLINTSTONES: A fuzzy linguistic decision tools enhancement suite based on the 2-tuple linguistic model and extensions. Inf. Sci. 2014, 280, 152–170. [Google Scholar] [CrossRef]
  25. Labella, Á.; Martínez, L. FLINTSTONES 2.0 an Open and Comprehensive Fuzzy Tool for Multi-criteria Decision Analysis. In Proceedings of the International Conference on Intelligent and Fuzzy Systems, Istanbul, Turkey, 23–25 July 2019; pp. 762–769. [Google Scholar]
  26. Martínez, L.; Rodriguez, R.M.; Herrera, F. 2-Tuple Linguistic Model. In The 2-tuple Linguistic Model; Springer: Berlin/Heidelberg, Germany, 2015; pp. 23–42. [Google Scholar]
  27. Costa, C.A.B.; Vansnick, J.C. A critical analysis of the eigenvalue method used to derive priorities in AHP. Eur. J. Oper. Res. 2008, 187, 1422–1428. [Google Scholar] [CrossRef]
  28. Saaty, T.L. A scaling method for priorities in hierarchical structures. J. Math. Psychol. 1977, 15, 234–281. [Google Scholar] [CrossRef]
  29. OECD. OECD Economic Surveys: Hungary 2005; Organisation for Economic Co-operation and Development: Paris, France, 2005. [Google Scholar]
  30. OECD. OECD Economic Surveys: The Slovak Republic 2005; Organisation for Economic Co-operation and Development: Paris, France, 2005. [Google Scholar]
  31. OECD. OECD Economic Surveys: Czech Republic 2006; OECD: Paris, France, 2006. [Google Scholar]
  32. OECD. OECD Economic Surveys: Portugal 2006; OECD: Paris, France, 2006. [Google Scholar]
  33. Acemoglu, D.; Robinson, J.A. De facto political power and institutional persistence. Am. Econ. Rev. 2006, 96, 325–330. [Google Scholar] [CrossRef] [Green Version]
  34. Hearne, R.; McMahon, C.T. Cherishing All Equally 2016: Economic Inequality in Ireland; TASC: Milpitas, CA, USA, 2016. [Google Scholar]
  35. Rodrigues, C.; Andrade, I. Growing Inequalities And Their Impacts in Portugal; GINI Country Report for Portugal; AIAS: Washington, DC, USA, 2013. [Google Scholar]
  36. Puig, S.; Sánchez, Á. Portugal versus Spain: An Iberian Economic Saga: Elcano Royal Institute/Fundación Real Instituto Elcano: Madrid, Spain, 2018.
  37. Boyer, R. The four fallacies of contemporary austerity policies: The lost Keynesian legacy. Camb. J. Econ. 2012, 36, 283–312. [Google Scholar] [CrossRef]
  38. McKee, M.; Karanikolos, M.; Belcher, P.; Stuckler, D. Austerity: A failed experiment on the people of Europe. Clin. Med. 2012, 12, 346–350. [Google Scholar] [CrossRef]
  39. Busch, K.; Hermann, C.; Hinrichs, K.; Schulten, T. Euro Crisis, Austerity Policy and the European Social Model; International Policy Analysis, Friedrich Ebert Foundation: Berlin, Germany, 2013. [Google Scholar]
  40. Evangelos, T. Multi-Criteria Decision Making Methods: A Comparative Study; Kluwer Academic Publication: Dordrecht, The Netherland, 2000; Volume 4. [Google Scholar]
  41. Baldini, M. Perché aumenta la disuguaglianza in Italia. Available online: https://www.lavoce.info/archives/52760/perche-aumenta-la-disuguaglianza-in-italia/ (accessed on 28 December 2019).
  42. Anderton, B.; Brenton, P.; Oscarsson, E. Outsourcing and Inequality; Centre European Policy Studies: Brussels, Belgium, 2002. [Google Scholar]
  43. Lodovici, M.S.; Semenza, R. Precarious Work and High-Skilled Youth in Europe; FrancoAngeli: Milan, Italy, 2012; Volume 937. [Google Scholar]
  44. Eurofound. Fraudulent Contracting of Work: Bogus Self-Employment (Czech Republic, Spain and UK); Eurofound: Dublin, Ireland, 2017. [Google Scholar]
  45. Weil, D. Income Inequality, Wage Determination, and the Fissured Workplace. In After Piketty: The Agenda for Economics and Inequality; Harvard University Press: Cambridge, UK, 2017; pp. 209–231. [Google Scholar]
  46. Kuznets, S. Economic growth and income inequality. Am. Econ. Rev. 1955, 45, 1–28. [Google Scholar]
  47. Franzini, M.; Pianta, M. Explaining Inequality; Routledge: London, UK, 2015. [Google Scholar]
  48. Hartmann, D.; Guevara, M.R.; Jara-Figueroa, C.; Aristarán, M.; Hidalgo, C.A. Linking economic complexity, institutions, and income inequality. World Dev. 2017, 93, 75–93. [Google Scholar] [CrossRef] [Green Version]
  49. Tullock, G. The welfare costs of tariffs, monopolies, and theft. Econ. Inq. 1967, 5, 224–232. [Google Scholar] [CrossRef]
  50. Krueger, A.O. The political economy of the rent-seeking society. Am. Econ. Rev. 1974, 64, 291–303. [Google Scholar]
  51. Zeckhauser, R. Toward a Theory of the Rent-Seeking Society; Univ. Chicago Press: Chicago, IL, USA, 1982. [Google Scholar]
  52. Acemoglu, D.; Robinson, J.A. Why Nations Fail: The Origins of Power, Prosperity, and Poverty; Crown Books; The Crown Publishing Group: New York, NY, USA, 2012. [Google Scholar]
  53. Porter, M.; Kramer, M. Creating Shared Value; Harvard Business Review: Cambridge, MA, USA, 2011. [Google Scholar]
  54. Monzón, J.L.; Chaves, R. Recent Evolutions of the Social Economy in the European Union; European Economic and Social Committee: Brussels, Belgium, 2017; Volume 10, p. 191345. [Google Scholar]
  55. McGaughey, E. The codetermination bargains: The history of German corporate and labour law. Columbia J. Eur. Law 2016, 23. [Google Scholar] [CrossRef] [Green Version]
  56. Hackl, A. Mobility equity in a globalized world: Reducing inequalities in the sustainable development agenda. World Dev. 2018, 112, 150–162. [Google Scholar] [CrossRef]
  57. Dijkstra, L.; Poelman, H.; Rodríguez-Pose, A. The Geography of EU Discontent; Regional Studies Association: London, UK, 2019; pp. 1–17. [Google Scholar]
  58. Veneri, P.; Murtin, F. Where is Inclusive Growth Happening? Mapping Multi-Dimensional Living Standards in OECD Regions; OECD Publishing: Paris, France, 2016. [Google Scholar]
  59. Odendahl, C.; Springford, J.; Johnson, S.; Murray, J. The Big European Sort? The Diverging Fortunes of Europe’s Regions; CER: London, UK, 2019. [Google Scholar]
  60. Wade, R.H. Is globalization reducing poverty and inequality? Int. J. Health Serv. 2004, 34, 381–414. [Google Scholar] [CrossRef]
  61. Herzer, D.; Vollmer, S. Inequality and growth: Evidence from panel cointegration. J. Econ. Inequal. 2012, 10, 489–503. [Google Scholar] [CrossRef]
  62. Cristini, A.; Fazzari, S.; Greenberg, E.; Leoni, R. Cycles, Growth and the Great Recession; Routledge: London, UK, 2014. [Google Scholar]
  63. Ferri, P.; Cristini, A.; Variato, A.M. Income shares, wealth and growth. EconomiA 2016, 17, 254–264. [Google Scholar] [CrossRef] [Green Version]
  64. Rodríguez-Pose, A. The revenge of the places that don’t matter (and what to do about it). Camb. J. Reg. Econ. Soc. 2018, 11, 189–209. [Google Scholar] [CrossRef]
  65. Berg, J. Labour Markets, Institutions and Inequality: Building Just Societies in the 21st Century; Edward Elgar Publishing: Cheltenham, UK, 2015. [Google Scholar]
  66. Bailey, D.; Pitelis, C.; Tomlinson, P.R. A place-based developmental regional industrial strategy for sustainable capture of co-created value. Camb. J. Econ. 2018, 42, 1521–1542. [Google Scholar] [CrossRef]
  67. Mazzucato, M. The Entrepreneurial State: Debunking Public vs. Private Sector Myths; Anthem Press: London, UK, 2015; Volume 1. [Google Scholar]
  68. OECD. Broken Social Elevator?: How to Promote Social Mobility; Organization for Economic: Paris, France, 2018. [Google Scholar]
  69. Vázquez-Barquero, A.; Rodríguez-Cohard, J.C. Local development in a global world: Challenges and opportunities. Reg. Sci. Policy Pract. 2019, 11, 885–897. [Google Scholar] [CrossRef]
Figure 1. Sorting with limiting and central profiles.
Mathematics 08 00646 g001
Figure 2. Computing the local priority for alternative a k by Equation (4).
Mathematics 08 00646 g002
Figure 3. Resolution scheme.
Mathematics 08 00646 g003
Figure 4. Local priority functions in 2005.
Mathematics 08 00646 g004
Figure 5. Classification EU countries in 2005.
Mathematics 08 00646 g005
Figure 6. Classification EU countries in 2008.
Mathematics 08 00646 g006
Figure 7. Classification EU countries in 2011.
Mathematics 08 00646 g007
Figure 8. Classification EU countries in 2014.
Mathematics 08 00646 g008
Figure 9. Classification EU countries in 2017.
Mathematics 08 00646 g009
Figure 10. Minimal change for the criterion c 4 .
Mathematics 08 00646 g010
Table 1. Limiting profiles.
Criteria l p 1 l p 2 l p 3
c 1 27,00022,50015,000
c 2 19,96716,63911,093
c 3 12.0618.0821.69
c 4 4.14.65.7
c 5 18.9915.8310.55
c 6 13.315.920.2
Table 2. Reference points per year.
YearCriteria P R 1 P R 2 P R 3 P R 4 P R 5 P R 6
2005 c 1 830018,22028,14038,06047,98057,900
c 2 586310,51615,16919,82224,47529,128
c 3 13.817.320.824.327.831.3
c 4 3.34.124.945.766.587.4
c 5 17.919.4821.0622.6424.2225.8
c 6 9.512.0414.5817.1219.6622.2
2008 c 1 11,10022,56034,02045,48056,94068,400
c 2 762612,31717,00821,69926,39031,081
c 3 14.518.0621.6225.1828.7432.3
c 4 3.44.184.965.746.527.3
c 5 16.918.5620.2221.8823.5425.2
c 6 9.012.3815.7619.1422.5225.9
2011 c 1 11,80023,30034,80046,30057,80069,300
c 2 867812,897.817,117.621,337.425,557.229,777
c 3 13.517.1420.7824.4228.0631.7
c 4 3.54.14.75.35.96.5
c 5 18.419.6620.9222.1823.4424.7
c 6 9.812.314.817.319.822.3
2014 c 1 500019,18033,36047,54061,72075,900
c 2 586311,22716,59121,95527,31932,681
c 3 13.518.6623.8228.9834.1439.3
c 4 3.14.385.666.948.229.5
c 5 15.117.2419.3821.5223.6625.8
c 6 7.911.6815.4619.2423.0226.8
2017 c 1 14,80027,02039,24051,46063,68075,900
c 2 10,87515,236.219,597.423,958.628,319.832,681
c 3 13.717.8622.0226.1830.3434.5
c 4 3.44.365.326.287.248.2
c 5 16.518.219.921.623.325.0
c 6 9.112.014.917.820.723.6
Table 3. Criteria pairwise comparison matrix.
c 1 c 2 c 3 c 4 c 5 c 6 Weight
c 1 171/21/71/51/20.067
c 2 1/711/71/91/91/80.021
c 3 2711/61/310.101
c 4 7961270.458
c 5 5931/2130.251
c 6 2811/71/310.102
Inconsistency ratio = 0.06.
Table 4. Local and global limiting profiles priorities in 2005.
c 1 c 2 c 3 c 4 c 5 c 6 Global Priority
l p 1 0.0010.0090.420.1760.0080.1030.152
l p 2 0.080.0360.080.0880.0230.1030.066
l p 3 0.0180.0730.050.0440.0670.0410.032
Table 5. Local and global alternatives priorities in 2005.
Country c 1 c 2 c 3 c 4 c 5 c 6 Global Priority
Sweden0.0580.0570.0910.3510.2670.3390.277
Denmark0.0580.0470.1780.3070.2670.2010.251
Slovenia0.0060.0230.0690.3290.2670.1760.243
Finland0.0240.0470.2310.2850.2570.2070.242
Czech R.0.0040.0150.0790.2630.2660.2850.225
Luxembourg0.5620.4420.0740.2190.2060.1030.217
Austria0.0630.2250.2010.2410.2320.1490.213
Germany0.0340.1950.0710.2410.2570.1760.207
Netherlands0.0750.1410.050.1970.2060.2670.183
Slovakia0.0010.0040.0330.2190.2320.1030.173
France0.0150.1100.1510.1970.1640.1230.163
Hungary0.0010.0090.0770.1970.1810.1030.154
Belgium0.0550.0980.0970.1970.1470.1030.153
Cyprus0.010.0450.0660.1430.1340.0960.117
Bulgaria00.0020.0100.0290.2670.0540.087
Ireland0.0880.0690.0570.0840.1060.0410.082
Italy0.0140.0730.0280.050.0890.0450.055
Spain0.10.0470.020.0550.080.0410.053
United Kingdom0.0370.1280.0450.0410.0670.0470.05
Greece0.0070.0410.0290.0430.0720.0410.046
Estonia0.0010.0030.0280.0410,0670.0540.044
Poland0.0010.0030.0070.0250.0520.0380.029
Latvia0.0010.0030.0120.0230.0460.0430.028
Portugal0.0050.0290.0180.0170.0330.0430.023
Lithuania0.0010.0040.0100.0190.0360.0380.023
Romania00.0020.0050.010.0460.020.018
Table 6. Ranking of EU countries regarding reducing inequalities achievements in 2005 and 2008.
Ranking 2005Ranking 2008
1. Sweden14. Cyprus1. Czech R.14. Ireland
2. Denmark15. Bulgaria2. Slovakia15. Germany
3. Slovenia16. Ireland3. Slovenia16. Estonia
4. Finland17. Italy4. Denmark17. Poland
5. Czech R.18. Spain5. Hungary18. Italy
6. Luxembourg19. United Kingdom6. Sweden19. United Kingdom
7. Austria20. Greece7. Finland20. Spain
8. Germany21. Estonia8. Netherlands21. Greece
9. Netherlands22. Poland9. Luxembourg22. Portugal
10. Slovakia23. Latvia10. Belgium23. Lithuania
11. France24. Portugal11. France24. Bulgaria
12. Hungary25. Lithuania12. Austria25. Romania
13. Belgium26. Romania13. Cyprus26. Latvia
Table 7. Ranking of EU countries regarding reducing inequalities achievements in 2011, 2014 and 2017.
Ranking 2011Ranking 2014Ranking 2017
1. Czech R.14. Germany1. Czech R.14. United Kingdom1. Czech R.14. Cyprus
2. Slovenia15. Ireland2. Finland15. Germany2. Finland15. Poland
3. Finland16. Poland3. Netherlands16. Poland3. Slovenia16. Luxembourg
4. Netherlands17. United Kingdom4. Slovenia17. Cyprus4. Slovakia17. United Kingdom
5. Slovakia18. Estonia5. Belgium18. Italy5. Belgium18. Estonia
6. Hungary19. Italy6. Slovakia19. Lithuania6. Netherlands19. Portugal
7. Belgium20. Portugal7. Denmark20. Portugal7. Denmark20. Italy
8. Luxembourg21. Lithuania8. Austria21. Estonia8. Hungary21. Greece
9. Denmark22. Greece9. France22. Latvia9. France22. Latvia
10. Sweden23. Spain10. Luxembourg23. Greece10. Austria23. Spain
11. Austria24. Romania11. Sweden24. Spain11. Sweden24. Romania
12. Cyprus25. Latvia12. Hungary25. Bulgaria12. Germany25. Lithuania
13. France26. Bulgaria13. Ireland26. Romania13. Ireland26. Bulgaria
Table 8. Minimal changes in criteria weights for modifying ranking and new weights in 2005.
Minimal ChangeWeights
c 1 +0.023(0.09, 0.021, 0.098, 0.446, 0.245, 0.1)
c 2 +0.019(0.066, 0.04, 0.099, 0.449, 0.246, 0.1)
c 3 +0.009(0.067, 0.021, 0.11, 0.453, 0.248, 0.101)
c 4 −0.028(0.071, 0.022, 0.106, 0.43, 0.264, 0.107)
c 5 −0.031(0.07, 0.022, 0.105, 0.477, 0.22, 0.106)
c 6 −0.042(0.071, 0.022, 0.105, 0.479, 0.263, 0.06)
Table 9. Ranking of EU countries regarding reducing inequalities achievements in 2005 according to the new criteria weights.
c 1 c 2 c 3 c 4 c 5 c 6 Overall
1. Sweden1. Sweden1. Sweden1. Sweden1. Sweden1. Sweden1. Sweden
2. Denmark2. Denmark2. Denmark2. Denmark2. Denmark2. Denmark2. Denmark
3. Slovenia3. Slovenia3. Finland3. Finland3. Slovenia3. Slovenia3. Slovenia
4. Finland4. Finland4. Slovenia4. Slovenia4. Finland4. Finland4. Finland
5. Luxembourg5. Luxembourg5. Czech R.5. Czech R.5. Czech R.5. Luxembourg5. Czech R.
6. Czech R.6. Czech R.6. Luxembourg6. Luxembourg6. Luxembourg6. Czech R.6. Luxembourg
7. Austria7. Austria7. Austria7. Austria7. Austria7. Austria7. Austria
8. Germany8. Germany8. Germany8. Germany8. Germany8. Germany8. Germany
9. Netherlands9. Netherlands9. Netherlands9. Netherlands9. Netherlands9. Netherlands9. Netherlands
10. Slovakia10. Slovakia10. Slovakia10. Slovakia10. Slovakia10. Slovakia10. Slovakia
11. France11. France11. France11. France11. France11. France11. France
12. Belgium12. Belgium12. Belgium12. Hungary12. Belgium12. Hungary13. Hungary
13. Hungary13. Hungary13. Hungary13. Belgium13. Hungary13. Belgium13. Belgium
14. Cyprus14. Cyprus14. Cyprus14. Cyprus14. Cyprus14. Cyprus14. Cyprus
15. Bulgaria15. Bulgaria15. Bulgaria15. Bulgaria15. Ireland15. Bulgaria15. Bulgaria
16. Ireland16. Ireland16. Ireland16. Ireland16. Bulgaria16. Ireland16. Ireland
17. Italy17. Italy17. Italy17. Italy17. Italy17. Italy17. Italy
18. Spain18. Spain18. Spain18. Spain18. Spain18. Spain18. Spain
19. United Kingdom19. United Kingdom19. United Kingdom19. United Kingdom19. United Kingdom19. United Kingdom19. United Kingdom
20. Greece20. Greece20. Greece20. Greece20. Greece20. Greece20. Greece
21. Estonia21. Estonia21. Estonia21. Estonia21. Estonia21. Estonia21. Estonia
22. Poland22. Poland22. Poland22. Poland22. Poland22. Poland22. Poland
23. Latvia23. Latvia23. Latvia23. Latvia23. Latvia23. Latvia23. Latvia
24. Portugal24. Portugal24. Portugal24. Portugal24. Portugal24. Portugal24. Portugal
25. Lithuania25. Lithuania25. Lithuania25. Lithuania25. Lithuania25. Lithuania25. Lithuania
26. Romania26. Romania26. Romania26. Romania26. Romania26. Romania26. Romania