Article

Elementary Error Model Applied to Terrestrial Laser Scanning Measurements: Study Case Arch Dam Kops

Institute of Engineering Geodesy, University of Stuttgart, Geschwister-Scholl-Str. 24D, 70174 Stuttgart, Germany
*
Author to whom correspondence should be addressed.
Mathematics 2020, 8(4), 593; https://doi.org/10.3390/math8040593
Submission received: 18 March 2020 / Revised: 7 April 2020 / Accepted: 10 April 2020 / Published: 15 April 2020
(This article belongs to the Special Issue Stochastic Models for Geodesy and Geoinformation Science)

Abstract

:
All measurements are affected by systematic and random deviations. A huge challenge is to correctly consider these effects on the results. Terrestrial laser scanners deliver point clouds that usually precede surface modeling. Therefore, stochastic information of the measured points directly influences the modeled surface quality. The elementary error model (EEM) is one method used to determine error sources impact on variances-covariance matrices (VCM). This approach assumes linear models and normal distributed deviations, despite the non-linear nature of the observations. It has been proven that in 90% of the cases, linearity can be assumed. In previous publications on the topic, EEM results were shown on simulated data sets while focusing on panorama laser scanners. Within this paper an application of the EEM is presented on a real object and a functional model is introduced for hybrid laser scanners. The focus is set on instrumental and atmospheric error sources. A different approach is used to classify the atmospheric parameters as stochastic correlating elementary errors, thus expanding the currently available EEM. Former approaches considered atmospheric parameters functional correlating elementary errors. Results highlight existing spatial correlations for varying scanner positions and different atmospheric conditions at the arch dam Kops in Austria.

1. Introduction

One of the main tasks in engineering geodesy is deformation and displacement monitoring of structures such as buildings, bridges, towers, dams, tunnels or other infrastructure works (cf. [1,2]). Independent of the measurement method, geodetic sensors are used to gather data either in a continuously manner or within different epochs. In both cases, these prerequisites are essential: a common geodetic reference system for all the epochs, knowledge about the deformation process and a stochastic model that describes the uncertainty of the measurements. Classical geodetic measurement methods like Global Navigation Satellite System (GNSS), total station, leveling, etc. have been used for decades in terrestrial point-wise monitoring and have well established and broadly accepted stochastic models [3]. Although highly reliable, point-wise acquisition methods have their limitations if objects with complex shapes like curved facades, high-rise buildings or arch dams, require deformation monitoring. Here is where area-wise deformation analysis covers the gap by implying measurement methods capable of remotely measuring a large area of the observed object [4]. To gain an impression of recent applications, the reader is referred to [5,6,7]. One recent method is Terrestrial Laser Scanning (TLS). Terrestrial Laser Scanners (TLSs) are active multi-sensor systems used to measure the three-dimensional geometry of a given surrounding within a certain range (cf. [8,9]). Laser scanners got more precise, compact and affordable in the past 20 years [10], but neither instrument manufacturers nor the scientific communities have reached common ground in what concerns all TLS influencing error sources. This is commonly known as the TLS error budget or TLS stochastic model; which is currently still unsatisfactory [11]. Neuner et al. [12] give an overview of the available point cloud modeling methods used in engineering geodesy together with their stochastic models and state that none of them is established. Generally, a stochastic model is a mathematical model that describes real-life phenomena that are characterized by the presence of uncertainty [13]. In any case of direct and indirect measurements [14], the stochastic model can be expressed by a variance-covariance matrix (VCM) [15]. If knowledge about the existing correlations between all observations is missing, the VCM is reduced to a diagonal matrix poorly resembling the complex nature of all the error sources (cf. [11]). This consequently leads to possibly wrong decisions in the TLS deformation analysis [16] or inappropriate estimations of a specific surface. (cf. [7]).
To overcome this issue, the Elementary Error Model (EEM) can be used to define the stochastic model of TLS observations in form of a VCM that considers correlations. Previous work of Kauker and Schwieger [17] sets the foundation of applying the EEM on TLS measurements. To that point, the EEM model was applied on a TLS of panoramic type [9] and the atmospheric elementary errors were considered functional correlating. Continuing this line of work, the current contribution introduces a model for long-range hybrid type TLSs and classifies the atmospheric elementary errors as stochastic correlating for the first time. The latter is possible due to derived correlations between atmospheric parameters in the research area. Results are shown on airside point clouds of the Kops arch dam in Vorarlberg, Austria.
In the second section of this paper, the EEM theory is reviewed for comprehension. Section 3 describes the application of EEM on a Riegl VZ-2000 hybrid TLS (RIEGL Laser Measurement Systems GmbH, Horn, Austria) together with meteorological elementary errors and their influences on the distance measurements and vertical angles. The study case and outcomes are presented in Section 4 and Section 5 concludes this contribution.

2. Elementary Error Model Theory

2.1. General Remarks about Stochastic Models

The purpose of a stochastic model is to describe the statistical properties of variables [18]. There are many possibilities of describing the propagation of uncertainty of these variables. Out of these, some are most commonly used in measurements; these are: Guide to the Expression of Uncertainty in Measurement (GUM) [19], Monte Carlo Method (MCM) [20] and the variance covariance propagation law (cf. [21]). Only the last two will be briefly discussed with regard to the assumed models. On one side, in the MCM n random variables are numerically processed without having any knowledge about neither the linear/non-linear nature of the random variables nor their statistical distribution. Based on the outcomes, the statistical distribution is derived with corresponding parameters such as expected value, standard deviation, skewness and kurtosis. One disadvantage is that the model is computed n times, which increases computation time drastically. For more details the reader is referred to [20,22]. On the other side, variance covariance propagation law assumes normal distributed random values and linear or linearized models. Outcomes are likewise normally distributed and the statistical parameters are completely described by the expected value and standard deviation. This is an advantageous method, since the linear or linearized functional model is only computed once [18], therefore reducing computation time. It is also the main reason of adopting it for the EEM of TLS measurements, where the observations number easily reaches a few hundred thousand or a few million. To support this hypothesis, Aichinger and Schwieger [23] proved after using MCM for TLS observations for different scanning configurations that in 90% of the cases, linear models can be assumed with a significance level of α = 0.003. Therefore, assuming a linear model for TLS observations is acceptable for most cases, even if observations have a non-linear nature. Regarding the numerical estimates introduced later, it is mentioned that no method of estimating the outcome’s precision is currently used. This may be achieved in the future with the help of Variance Component Estimation (VCE) based on [24,25], or a review of [26]. Our intention is to use sensitivity analysis (cf. [27,28]) and inspect how the input estimates influence the outcomes. All of these aspects will be prospectively presented in a different publication.

2.2. Elementary Error Theory

The general theory of the elementary error model was simultaneously defined by Hagen [29] and Bessel [30]. Later on, the model was elegantly presented by Pelzer [21] and extended by Schwieger [31]. Some of its applications can be found in exemplifying the error impact on several geodetic measurement methods like electronic distance measurement (EDM) instruments [32], GNSS observations [33] or recently TLS measurements [17].
According to the EEM theory, each realization of a measured random quantity differs from its expected value by a random deviation ε [31]. It is assumed that ε is comprised by the sum of countless, small elementary errors. Their absolute value is supposed to be equal and the probability of a positive and negative sign is likewise presumably equal [29]. The presumption of standard normal distribution of these errors is supported by an infinite number of elementary errors with infinitely small absolute values. Their impact on the observations can be modeled by using error vectors and influencing matrices. These matrices resemble the effect on the covariance matrix of observations. Three types of impacts are considered: non-correlating error vectors δ k , functional correlating error vector ξ and stochastic correlating error vectors γ h [31]. For each error type, corresponding influencing matrices are defined as follows: p matrices D k for non-correlating errors, one matrix F for functional correlating errors and q matrices G h for stochastic correlating errors. Therefore, the random deviation vector ε results as a sum of all elementary errors accordingly:
ε = k = 1 p D k · δ k + F · ξ + h = 1 q G h · γ h .
These influencing matrices have different structures depending on the elementary errors effects on the observations. Hereby, matrices D k and G h are symmetrical diagonal matrices because each elementary error of the non-correlating and stochastic correlating group influences exactly one measurement quantity functionally. The matrix F is fully populated because one functional correlating error may impact several measurement quantities [31]. Defining the functional relationships between observations l 1 l n and the elementary errors δ ,   ξ and γ allows the calculation of the partial derivatives that populate the influencing matrixes as follows:
D k = [ l 1 δ 1 k 0 0 0 l 2 δ 2 k 0 0 0 l n δ n k ] , F = [ l 1 ξ 1 l 1 ξ 2 l 1 ξ m l 2 ξ 1 l 2 ξ 2 l 2 ξ m l n ξ 1 l n ξ 2 l n ξ m ] , G h = [ l 1 γ 1 h 0 0 0 l 2 γ 2 h 0 0 0 l n γ n h ] .
Applying the law of propagation of variance on Equation (1) yields the so called “synthetic covariance matrix” Σ l l which by definition has the following form [33]:
Σ l l = k = 1 p D k · Σ δ δ , k · D k T + F · Σ ξ ξ · F T + h = 1 q G h · Σ γ γ , h · G h T ,
where each covariance matrix of the elementary errors is defined and structured as shown below. The covariance matrices for non-correlating errors Σ δ δ , k and functional correlating errors Σ ξ ξ are diagonal matrices having the elementary error’s variances on the main diagonal. As a result of the possible covariances of the stochastic correlating errors, the corresponding matrix Σ γ γ , h may be fully populated.
Σ δ δ , k = [ σ 1 k 2 0 0 0 σ 2 k 2 0 0 0 σ n k 2 ] , Σ ξ ξ = [ σ 1 2 0 0 0 σ 2 2 0 0 0 σ m 2 ] , Σ γ γ , h = [ σ 1 h 2 σ 12 h σ 1 n h σ 12 h σ 2 h 2 σ 2 n h σ 1 n h σ n h 2 ] .
The challenging part is finding variances for all groups of errors and covariances for stochastic correlating errors. Correlations between the elementary errors are assumed to be zero. The variances may however be extracted from instrument manufacturers reports (cf. Section 3.2), empirical values (cf. Section 3.3) or an estimation based on the maximum error impact. In the last case, Pelzer [21] states that if the probability distribution is known, the standard deviation of an elementary error can be estimated with regard to its maximum error. Therefore, if a variable follows a rectangular distribution, the standard deviation is retrieved by multiplying the maximum error with 0.6. In case of a triangular distribution, multiplication is done by 0.4 and for normal distributions by 0.3. In what concerns the stochastic correlating group, values for the correlations must be supported by empirical values or literature. They represent stochastic relations for multi-dimensional normal distributed observations [17]. If the terms of Equation (3) are to be summed up, it can be seen that according to the matrices structures (see Equations (2) and (4)) the individual results are as follows: for non-correlating errors—a diagonal matrix, for functional and stochastic correlating errors—fully populated matrices. Thus, the synthetic variance-covariance matrix Σ l l is also fully populated and illustrates the existing observation variances and covariances and indirectly their correlations.

3. Elementary Error Theory for Terrestrial Laser Scanners

3.1. Error Soruces in Terrestrial Laser Scanning

In order to apply the EEM on laser scanners, the error sources need to be identified and classified. As any measurement instrument, TLSs are realizations of an idealistic measurement system, therefore affected by physical manufacturing limitations. Even if the instrument itself would be hypothetically flawless, all measurements would be affected by the environment through which the electromagnetic waves are traveling (cf. [34]). Other error sources are related to the measured object properties such as surface material, roughness and color. These play an important role on the distance measurements and strongly depend on the used wavelength [35]. According to other authors (cf. [36]), scanning geometry is also considered an error source. Only instrumental and environmental error sources are treated in this contribution.
For a better understanding of how the TLS observations affect the coordinates (Figure 1), the mathematical relations between range (R), horizontal angle (λ), vertical angle (θ) and Cartesian coordinates (X, Y, Z) are described generically as follows:
X = R · sin ( λ ) · cos ( θ ) ,   R = X 2 + Y 2 + Z 2 , Y = R · sin ( λ ) · sin ( θ ) ,   λ = atan ( X Y ) ,   Z = R · cos ( θ ) ,   θ = acos ( Z R ) .

3.2. Instrumental Elementary Errors

In comparison to the panorama TLSs architecture, the hybrid scanner architecture is less present in commercially available TLSs. This may be a reason for the reduced amount of scientific publications on calibration models for hybrid scanners. Even though it measures basically the same type of polar coordinates, calibration parameters (CPs) are of a more complex nature (cf. [37]). The most common example is the rotating polygon mirror used for deflecting the laser beam. On one side, the distance varies at each mirror position and on the other side, the EDM source is usually mounted with an offset from the rotation axis, not to mention that it may be intentionally tilted. Further on, a classification of the instrumental errors is necessary. Firstly, an explanation is given about how the errors are considered and afterwards numerical values are given.
To begin with, the non-correlating elementary errors are considered. These are measurement noise for angle and range measurements, which are not directly specified by the manufacturer. For range measurement, there is an entry for accuracy and one for precision. As defined by Riegl Laser Measurement Systems GmbH (Horn, Austria) [38], precision is the degree to which further measurements show the same result. If the definition of standard deviation is considered, it expresses how widely the random variable is spread out relative to the mean value of the sample [39]. Therefore, the given value for precision will be used as an indicator for instrument internal range noise at all measured ranges (see Table 1). For angle measurements, the data sheet of the instrument offers only “angle resolution” without further details. According to Wunderlich et al. [40], angular resolution can be interpreted as measurement precision (one sigma), therefore the same convention is used (see Table 1). The terms are generally presented in Equation (6) and their values are found in Table 1. Having this, the first term of Equation (2) and the first term of Equation (4) are now defined as follows:
Σ δ δ , k = [ σ λ 2 0 0 0 σ θ 2 0 0 0 σ R 2 ] ,   D = I .
The influencing matrix D is the identity matrix, because no transformation from the coordinate space into observation space is needed at this moment. Only after the complete synthetic VCM is computed, a transformation based on Equation (5) is made from observation space to coordinate space.
Regarding the functional model of observations, a model defined by Lichti [41] and Lichti [42], later simplified by Schneider [43] is adopted. The latter applied it on a Riegl LMS-420i and could successfully improve the results after calibration. The simplification is mostly justified by the fact that not all of the CPs can be classified as significant after a calibration. Furthermore, if they are highly correlated they only reduce the validity of the model. Some of them are negligible, some are not determinable or separable, and therefore the used model is restricted to the minimum number of CPs identified as significant [37]. For more details about these parameters, the reader is advised to consult [37,43]. Following [43], the CPs for each observation can be defined as stated:
Δ R = a 0 + a 1 R + a 2 R 2 , Δ λ = b 1 sec ( θ ) + b 2 tan ( θ ) + b 3 sin ( λ ) + b 4 cos ( λ ) + arcsin ( b 5 R ) + b 6 sin ( 2 λ ) + b 7 cos ( 2 λ ) + b 8 cos ( 3 λ ) ,   Δ θ = c 0 + c 1 sin ( θ ) + c 2 cos ( θ ) + arcsin ( c 3 / R ) + c 4 cos ( 3 λ ) ,
where a 0 is the zero point error, a 1 scale error, a 2 quadric scale error, b 1 collimation axis error, b 2 horizontal axis error, b 3 and b 4 first and second horizontal circle eccentricity, b 5 eccentricity of the collimation axis with respect to the vertical axis, b 6 and b 7 non-orthogonality of the plane containing the horizontal angle encoder and the vertical axis, b 8 empirical parameter for compensation of remaining systematic effects, c 0 vertical circle index error, c 1 and c 2 first and second vertical circle eccentricity, c 3 eccentricity of the collimation axis with respect to the trunnion axis, c 4 empirical parameter to model a sinusoidal errors function of the horizontal direction with period of 120° (cosine term).
Out of all CPs, only some of them have numerical values and were determined as significant after calibration by Schneider [43]. For the EEM, variances of the CPs are introduced in the middle term of Equation (4) and the F matrix contains the partial derivatives of Equation (7). The values for the variances are presented in Table 1 with adopted dimensions for the Riegl VZ-2000 scanner. Further investigations on the hybrid scanner architecture are in progress based on the foundations set in [44].

3.3. Meteorological Elementary Errors

3.3.1. Influences on the Distance Measurement

Similar to EDM of total stations, distance measurements in TLS, are influenced by air temperature and air pressure; in any case for long distances. Partial water vapor pressure is intentionally neglected due to its small influence. Most TLSs use near-infrared light for measuring distances. As known, the speed of light traveling through the atmosphere’s different layers is diminished in comparison to the speed of light in vacuum. The atmospheric correction increases proportionally with the measured distance [34]. In case of ranges up to 200 m, these corrections may be neglected, but it cannot be neglected for long range scanners (e.g., Riegl VZ-2000) that measures up to 2050 m. According to manufacturer’s specifications, the Riegl scanner has an atmospheric correction model implemented in the instrument, meaning that distances are corrected based on the introduced parameters for temperature, pressure and relative humidity. Information of how this happens can be taken from the RiSCAN Pro software documentation [45] and further inspected in the IAG 1999 resolutions [46]. The authors retain from explaining the whole process of retrieving the influencing coefficients for distance measurement and directly give the formula implemented in the EEM:
Δ n · 10 6 = 0.93 · Δ t + 0.27 · Δ p , Δ R = R · Δ n ,
where Δ n is the the change of the group refractive index of light, Δ t is change in temperature (°C) and Δ p is change in pressure (hPa). Finally, the change in range Δ R is given. Note that these parameters are calculated for a mean atmosphere of 17 °C, 1000 hPa pressure and a wavelength of λ = 1550 nm. Interpreting this in terms of parts per million (ppm) depending on the two atmospheric parameters in standard conditions, a change in t of 1 °C affects the distance and refractive index by 0.93 ppm, a change in air pressure of 10 hPa yields a −2.7 ppm correction on the distance. For more details about this topic, the reader can consult [47] or [34].

3.3.2. Influences on the Vertical Angle Measurement

In addition to the effects on distance measurements of any electro-optical measurement, atmospheric refraction also influences the vertical angle measurements. This effect causes image scintillation, often obvious in its extreme case when temperature gradients near the ground are high (e.g., in the desert or on a highway in hot summer days). This mostly affects angle measurements and is likewise important in geodesy, receiving much attention in transferring heights by trigonometric leveling. Nevertheless, this effect also occurs in TLS measurements and has been empirically studied by Friedli et al. [48]. The reader is advised to consult this work for understanding how refraction angles can be determined with the aid of reference values from total station measurements.
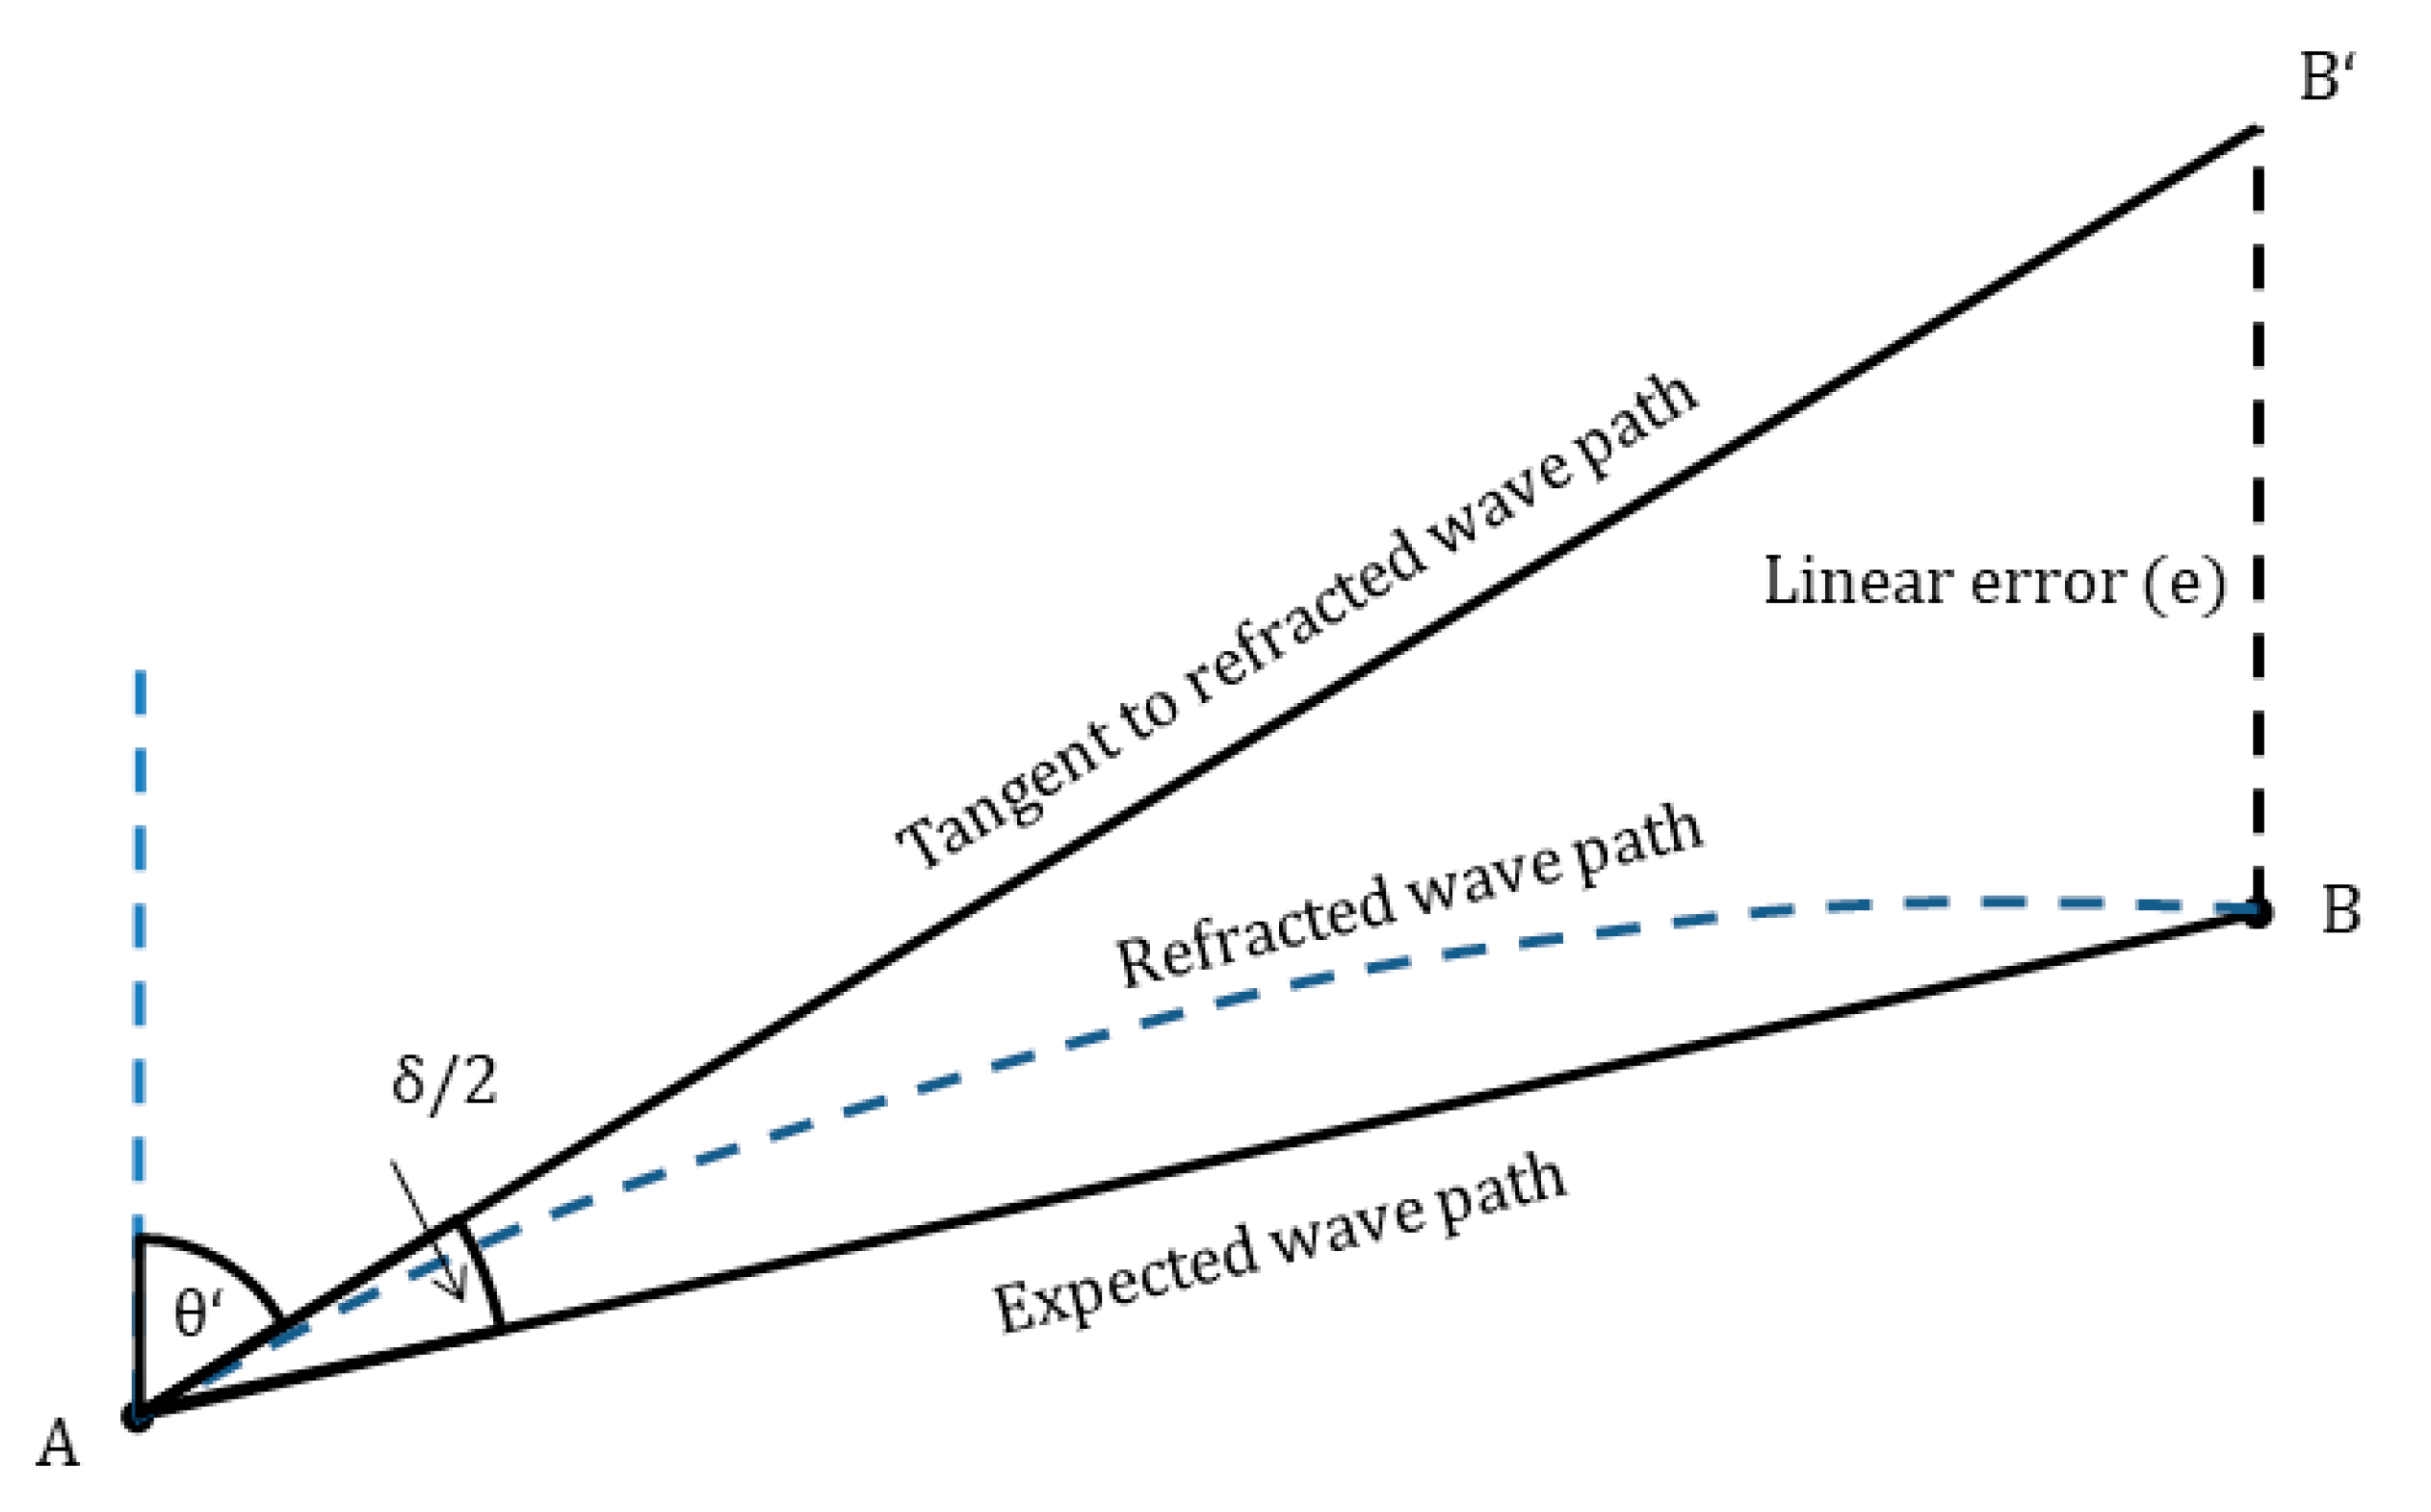
Figure 2 denotes the effects of atmospheric refraction out of which the refraction angle correction δ / 2 is of further interest. This angle is given between the expected wave path and apparent line of sight also called tangent to refracted wave path. For more details about how δ / 2 is deduced, refer to [49]. There are different ways of expressing the refraction angle correction, but only one has been chosen based on its simplicity and implemented in the EEM. The choice is not relevant in case of stochastic modeling. The corrected vertical angle can be therefore computed [49]:
θ = θ + δ 2 , δ 2 = R 2 · E R · k · ρ ,
where θ is the corrected vertical angle, θ the measured vertical angle, R measured range, E R Earth’s middle radius (6381 km), k refraction coefficient and ρ conversion constant between angle measurement units (degrees or grads) and radians. The coefficient of refraction k is usually needed to account for the curved light path from one point to another. It is defined as a ratio between the Earth radius and the radius of the line of sight which is mostly convex [50]. Very often, the Gaussian value of k = +0.13 is used by default as a setting for total station measurements, hoping that it holds true for most applications [51]. Nevertheless, k strongly varies throughout the day and is directly dependent on the temperature gradient T / Z (K/m) (cf. [52]). If the refraction coefficient of a particular point is of interest, the local refraction coefficient k l o c is given as a function dependent on temperature, pressure and the local temperature gradient (cf. [49,52]):
k l o c = 503 · p T 2 · ( 0.0343 + T Z ) ,
where p is pressure (hPa), T is temperature in (K) and T / Z (K/m) is the temperature gradient at a certain point. The term k l o c is used instead of an average k in Equation (9) for further purposes. As noticed in Equation (10), temperature gradient strongly determines the size of the local refraction coefficient; hence, its variation from ground level up to 100 m above the ground, as relevant for the later given examples, will be discussed. This is defined in meteorology or climate research under the name of micro- and local climate [53]. Hirt et al. [54] use the terms higher, intermediate and lower atmosphere to define the variation of the vertical temperature gradient (VTG) within a given range. By higher atmosphere, the layers from 100 m and above the ground surface are addressed. The VTG in this part of the troposphere has values around −0.006 K/m and is fairly independent of the Earth’s surface temperature [54]. The next layer, the intermediate atmosphere between 20–30 m and 100 m is weakly influenced by the ground temperature and has an average value for the VTG of −0.01 K/m. This is where the refraction coefficient has an average value of +0.15 and it is also the layer to which the Gaussian value is most appropriate. Going a level lower, the first layer, considered the lower atmosphere is where ground temperature reaches its maximum influence on the VTG. Several studies, summarized in [54], showed variations of the refraction coefficient between −3.5 and 3.5. Noteworthy are the empirical findings of Hennes [55] in which the local refraction coefficient reaches values of −2.9 (from a VTG of −0.5 K/m) leading to a concave curvature of the light path, contrasting the common belief about the chord being convex in almost all cases. Nevertheless, a less drastic value of −0.2 K/m is used in the current study, resembling an average value for this layer.
Similar as in Section 3.3.1, the influencing coefficients are determined after computing the partial derivatives of Equations (9) and (10). Therefore, numeric values have been exemplary computed with the same conditions as stated before (t = 17 °C, p = 1000 hPa, VTG = −0.01 K/m) at a distance of 1000 m. The change in the measured vertical angle (in radians) is given by:
Δ θ · 10 6 = 0.08 · Δ t + 0.01 · Δ p + 468.17 · Δ V G T ,
where Δ θ is the the change in the measured vertical angle, Δ t is change in temperature (°C), Δ p is change in pressure (hPa) and Δ V G T is the change in vertical temperature gradient. In other words, a change in temperature of 10 °C affects the vertical angle by −0.8 μrad (−0.05 mgon), a change in air pressure of 10 hPa affects the vertical angle by 0.1 μrad (+0.006 mgon) and the most significant factor, a change in the VGT of 1 K/m results in a change of the angle with 468.17 μrad (29.8 mgon). This is not to be confused with the systematic effect of the refraction angle correction δ / 2 . For comprehension, for the above stated conditions and at 1000 m, δ / 2 has a value of 0.7 mgon, which leads to a value of the linear error e = 11.4 mm. The intention is not to correct these systematic effects, but to show how varying temperature and pressure influence the error of position.
Although often not considered, air pressure also follows a gradient. This is less variable than the VGT and according to the Deutscher Wetterdienst Lexikon [56], the pressure gradient throughout the mentioned atmospheric layers is δp/δz = −0.125 hPa. This information will also be further used.
All these layer definitions and given values are adopted further in Section 3.4 to derive the necessary variances and covariances needed in the EEM.

3.4. Atmospheric Errors as Stochastic Correlating Errors

In most terrestrial precision measurements, if the atmospheric parameters temperature, pressure and relative humidity are needed, they are measured at the station point and in some cases near the observed object or second station point. For corrections, an averaged value of these parameters is used in most cases. This may hold true for airborne laser scanning, where the average between aircraft and ground temperature is sufficient [57], but in TLS, the situation changes. In addition to this, it was shown (cf. [48,54]) that even within a short time span, these may present strong variations and there is no straightforward method of correcting the measurement values dependent on these temporal variations. For this reason, modeling the impacts on the observations needs to be done stochastically. To do so, a VCM of the varying terms air temperature (t), air pressure (p) and VGT (g) is needed. The challenge is to fully populate the VCM Σ γ γ , h from Equation (4) so that existing correlations between all elementary errors are known. This will have the general form in case of t, p and g (only upper diagonal presented) as follows:
Σ γ γ , a t m = [ s t 1 2 s t 1 p 1 s t 1 g 1     s t 1 t 2 s t 1 p 2 s t 1 p 2 s t 1 t m s t 1 p m s t 1 g m s p 1 2 s p 1 g 1 s p 1 t 2 s p 1 p 2 s p 1 g 2 s p 1 t m s p 1 p m s p 1 g m s g 1 2 s g 1 t 2 s g 1 p 2 s g 1 g 2 s g 1 t m s g 1 p m s g 1 g m s t 2 2 s t 2 p 2 s t 2 p 2 s t 2 t m s t 2 p m s t 2 g m s p 2 2 s p 2 g 2 s g 2 2 s t m 2 s t m p m s t m g m s t m 2 s p m g m s g m 2 ]
The main diagonal is not difficult to fill in, according to what will be explained next, but the rest of the elements on all the upper and implicitly lower part of the same matrix are actually the challenge. To overcome this, correlation coefficients between t, p and g are computed for the given spatial distribution of all observations. This will be further on explained.
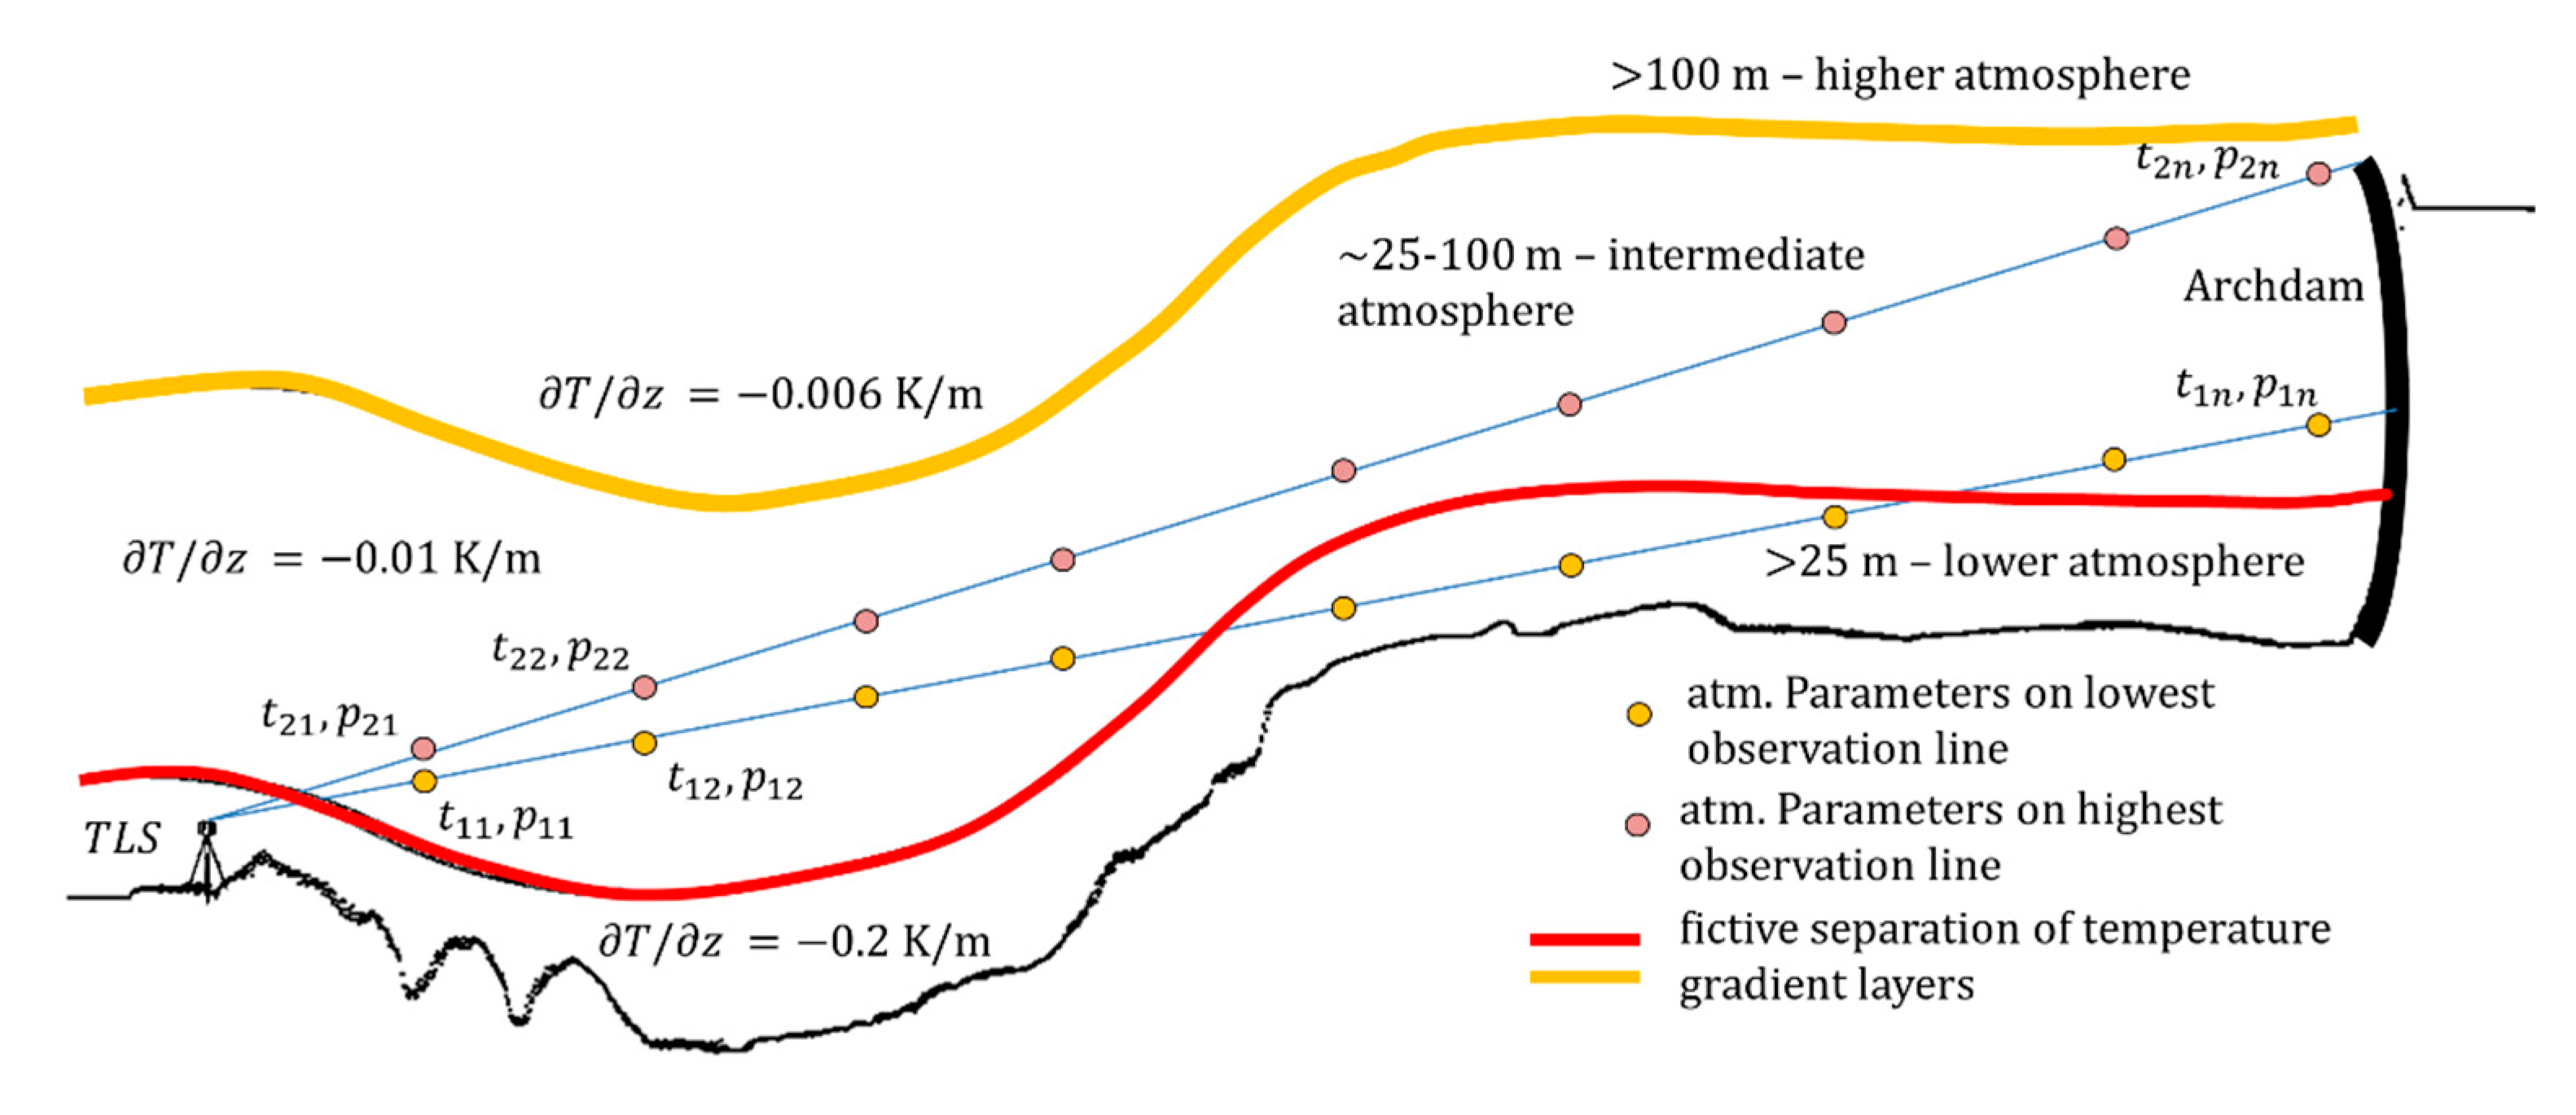
As in any terrestrial electro-optical measurement, in TLS observations light travels from the instrument to the measured object and back. Due to varying atmospheric conditions, it will be perturbed throughout the whole path and in order to evaluate how air temperature, air pressure and VTG vary along the path, pre-knowledge about these parameters (cf. Section 3.3.2) is used in a combined way with spatial information. Suppose a laser scanner is stationed at a certain distance near a tall object and observations are possible from the base to the tip of that object. If a rough digital terrain model (DTM) of the area is available, then the local topography is known, which further allows a classification of the VGT depending on how the topography varies. Simply explained, the limits of the gradient layers can be defined as surfaces with an offset from ground level according to how meteorologists have defined these limits (Figure 3 left). The yellow surface defines the separating layer at about 25 m between the lower and intermediate atmosphere; the red layer is the separation between intermediate and higher atmosphere at about 100 m above the ground. In order to have a better overview of the further steps, a vertical section is selected and exemplified in Figure 3 right.
It is necessary to roughly know the position of the scanner on the DTM. This is often referred to as georeferencing, but in this case the accuracy of the scanner’s position is not of high importance, therefore an approximation suffices. In most cases, the air temperature and air pressure is measured near the laser scanner, usually at the instrument height. According to the situation depicted above, this is true for temperature and pressure only near the laser scanner, but the interest is in gaining information about the atmospheric parameters along the whole measurement path. Therefore, in the next step the observation lines are reconstructed in relation to the scanner position on the DTM. This directly shows which observation line passes through which atmospheric layer. Only two of them are depicted by the blue lines in Figure 3 right, but the same principle applies for all the rest. Further on, a series of points along these lines are selected; denoted by the yellow and pink circles. Point spacing along the observation line may be done subjectively; but a uniform distribution between scanner and object is suggested for representative results. Each of these points receive values for t, p and g, determined according to their position in space and in relation to the measured atmospheric parameters at the station point denoted by “TLS” in Figure 3 right. For example, along the lowest observation line, each yellow point will receive a value starting from t 11 , p 11 , g 11 to t 1 n , p 1 n , g 1 n . The individual values are extrapolated according to the individual position. If more measurements of the atmospheric parameters at other positions within the DTM are available, they can be considered within the extrapolation processes. This applies for all the other observation lines, until the highest one is reached. In this case, the pink points (Figure 3 right) receive t m 1 , p m 1 , g m 1 to t m n , p m n , g m n . Notice that the points are chosen on the same vertical line, fact that will be explained later. Having series of values for all three parameters along all observation lines allows the computation of variances and covariances along and between each observation line according to:
s a 2 = 1 n 1 · i = 1 n ( a i a i ¯ ) 2 , s a i , a j = 1 n 1 · i , j = 1 n ( a i a i ¯ ) · ( a j a j ¯ ) ,
where s a 2 is the empirical standard deviation computed for each of the three atmospheric parameters. The value a i and a j are replaced consecutively by t i , p i , g i and n is the number of points along each observation line, s a i , a j is the empirical covariance between pairs of the three parameters. To exemplify this, the general VCM Σ γ γ , a t m for one observation line has the following form:
Σ γ γ , a t m = [ s t 2 s t p s t g s t p s p 2 s p g s t g s p g s g 2 ] .
Out of this VCM, a correlation matrix is computed, out of which correlation coefficients are extracted. For example, along each line, the correlation matrix R a t m is obtained and contains the following correlation coefficients r t p , r t g , r p g . This is valid for all lines up to the n-th observation.
R a t m = 1 d i a g ( Σ γ γ , a t m ) · Σ γ γ , a t m · 1 d i a g ( Σ γ γ , a t m ) = [ 1 r t p r t g r t p 1 r p g r t g r p g 1 ] .
This is valid along observation lines and helps at filling in the block matrices on the main diagonal of VCM from Equation (12) with submatrices like in Equation (14). For all other elements of Σ γ γ , a t m the covariances are computed with the help of the correlation coefficients according to:
s i j = r i j · s i · s j .
The values for s i and s j are computed along each observation line with the help of Equation (13). Following Equation (15), a set of values for r t p , r t g , r p g is obtained. In addition to these, the correlation coefficients of the same parameters (tt, pp and gg) between the observation lines have to be determined r t t , r p p , r g g and to accomplish this, VCMs and correlation matrices are computed between each parameter of the observation lines (e.g., t 11 and t m 1 ). This is also the reason why it is relevant to have the yellow and pink points on the same vertical line. In this way values for each of the atmospheric parameters are treated as series of values for the same dimension, in this case vertical direction. A drawback of this proposal is that a number of n TLS observations leads to a number of n ! / ( n 3 ) ! permutations of correlation coefficients. This means that for e.g., 200 values taken three times (t, p, g) one would obtain a number of 7,880,400 correlation coefficients that need to be properly arranged in Σ γ γ , a t m . This is currently not achievable due to technical reasons for TLS observations where the number of observations easily reaches a few million. Therefore, one generic value is taken for each of the coefficients r t p , r t g , r p g and r t t , r p p , r g g . Numeric values are computed between the lowest and highest observation line taken from the vertical section as denoted in Figure 3 right. Finally, the individual values for the covariances are computed based on Equation (16) and then introduced in Σ γ γ , a t m like in Equation (12). Returning to the EEM, now that the matrix Σ γ γ , a t m is available, the influencing matrix G h from Equation (2) must be properly filled. The complete matrix is a block matrix that has the partial derivatives of the observations with respect to t, p and g, as presented in Equation (17).
G a t m = [ G 1 0 0 0 G 2 0 0 0 G n ] ,   G i = [ λ t λ p λ g θ t θ p θ g R t R p R g ] ,
where i = 1 n and G 1 to G n are block matrices that have the partial derivatives as shown above. Effects on the horizontal angles have not been discussed and are not considered in this model. Therefore, the first line of each block g will be filled with 0. The second line includes the coefficients presented in Section 3.3.2 in Equation (11) and this is the only line that has influencing values for all variations in the fully populated VCM (Equation (12)); the last line of g has the influencing values presented in Section 3.3.1, Equation (8) with the last element 0. The numerical values must be computed with regard to given atmospheric conditions and at a given range for each situation. Finally, the last term of the synthetic VCM can be computed and therefore the influences of instrumental and atmospheric parameters can be combined. In the upcoming section, the whole methodology presented until now will be applied for TLS point clouds of an arch dam.

4. Study Case: Arch Dam Kops

The Kops water dam is a storage concrete dam built between 1962 and 1969 in Vorarlberg, Austria. It is considered a hybrid dam made out of a gravity dam and an arch dam with artificial counterfort or abutment. It retains a volume of almost 43 million m3 of water, thus creating the 1 km2 “Kopssee” lake [58]. Only measurements of the downstream (airside) arch dam are considered. For this reason, its dimensions are mentioned to give a general impression. The crown spans over 400 m, its height is 122 m from foundation to crest and has a crest width of 6 m. Between 29 July and 2 August 2019, a first measurement campaign of the Kops dam took place and part of the results from another type of laser scanner are presented by Kerekes and Schwieger [59]. Further on, the EEM is applied on point clouds acquired with the Riegl VZ-2000 from varying positions.
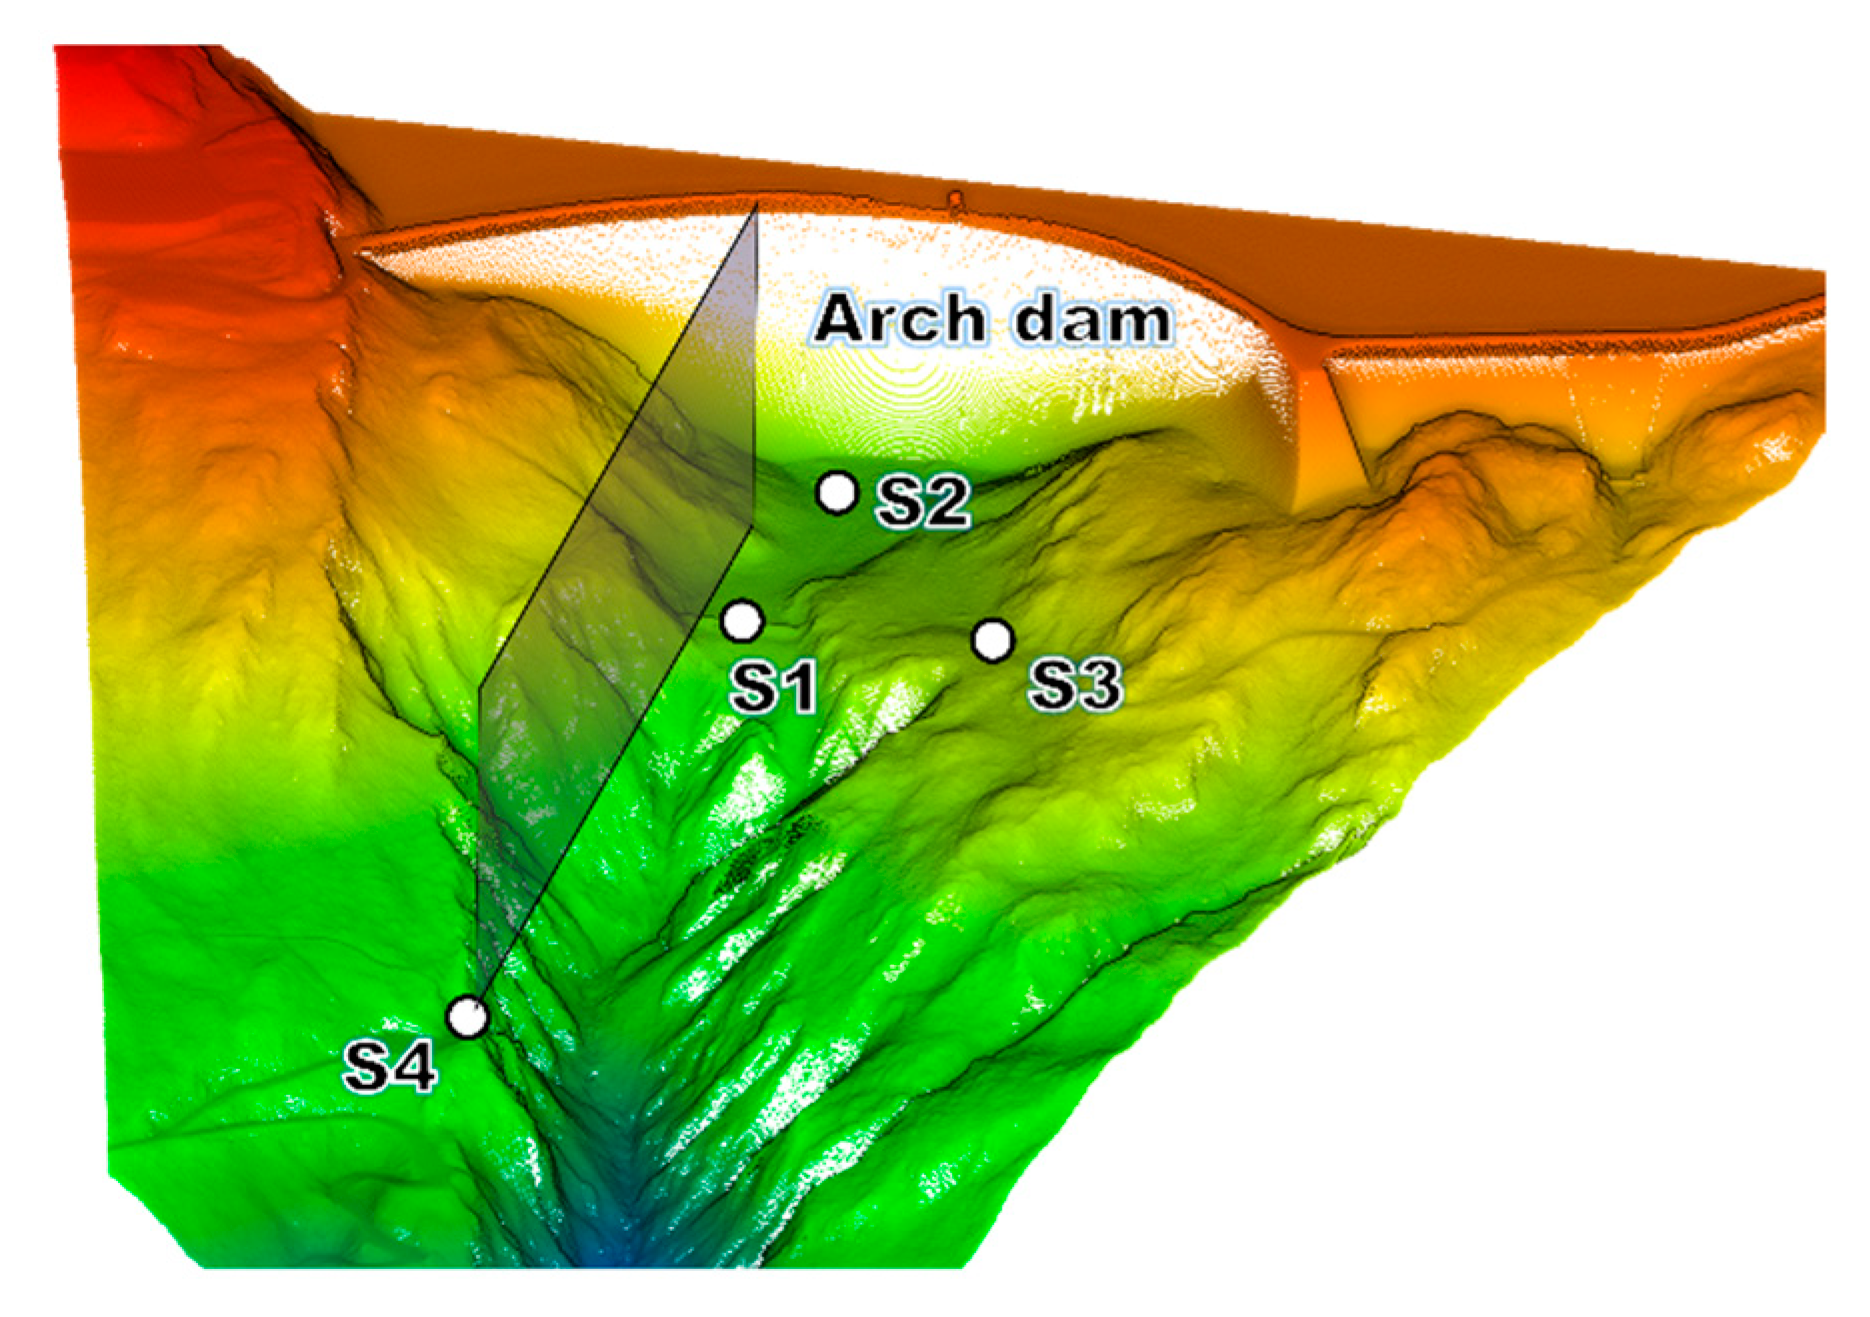
In order to apply the EEM for meteorological elementary errors as described in Section 3.4, a DTM for the area of interest was cordially made available by the “Landesamt für Vermessung und Geoinformation” Land Vorarlberg, Austria. TLS Point clouds were acquired from four different station points. Figure 4 shows the distribution of these on the DTM together with an example of a vertical section plane out of which temperature and pressure are extracted. Results will be presented for all four station points (S1–S4).
In order to have an overview about the varying scanning configurations and atmospheric conditions, Table 2 summarizes all the relevant parameters.
Considering the harsh local topography with steep slopes and vegetation, only the four station points depicted in Figure 4 were measurable within reasonable time, effort and coverages of the dam airside. With exception of S4, all other point clouds cover more than 80% of the airside surface. Weather recordings were made at each station point at the instrument height approx. 2 m above ground height with the Greisinger precision Thermo-, Barometer GTD1100 (Greisinger GmbH, Regenstauf, Germany). According to the technical specifications, air temperature is measured with an accuracy of +/−1% of the reading in the interval −10 °C to +50 °C and air pressure with +/−1.5 hPa in the interval of 750 hPa to 1100 hPa [60]. These accuracies are considered in the process of determining t and p. As regards the VGT, an empirical value for the uncertainty can be found in [55] for an Alpine region:
σ V G T = 1 12 · ( V G T m a x V G T m i n ) 2 ,
where a value for σ V G T = 0.25 K/m in case of the Alpine region in the lower atmosphere is given and V G T m a x and V G T m i n are the upper and lower numerical recorded values for the VGT [55].
In case of the other two layers, no empirical values for variances have been found to the best of the author’s knowledge. Due to this, values are obtained by multiplying the VGT value with 0.3 following the explanation in Section 2.1; these variations are likewise considered in determining the values for t.
For all station points the same methodology is applied, but the vertical section is only visualized in the case of S4 (Figure 5). The authors consider this case the most interesting since the distance to the dam is the longest and observations pass through different atmospheric layers more than once.
Almost half of the observation lines in this profile pass through the lower layer twice, meaning that variances of temperature and VGT affect the lowest points in the point cloud more than the ones obtained from observations that travel through a more stable atmospheric layer. This is confirmed further when analyzing the error of position in the point cloud. To have an overview of all variances and spatial correlation coefficients, Table 3 presents them for all station points.
The last pairs of correlation coefficients r p t , r g t , r g p are not in the table because they have the same value with r t p , r t g , r p g . Note that these values resemble the spatial correlations only. The subject of temporal correlations will be addressed in a future publication after a second measurement epoch is available. The variances and correlation coefficients from Table 3 are used to finally create a VCM Σ γ γ , a t m for the atmospheric elementary errors for each station point. In case of the instrumental errors, all the values are the same as stated in Table 1 since the same instrument was used in all station points.
The EEM is implemented in Matlab—MathWorks and currently limited to handling VCMs having sizes of up to 21,000 × 21,000 cells. More details about this can be found in [59]. Before applying the EEM on the point clouds, only points on the dam are selected and a subsampling is done. Consequently, the complete point cloud contains points on the dam airside with a distance of 1.5 m between them. Additional to this, vertical sections on the dam are analyzed since much attention was accorded to how atmospheric parameters vary along vertical profiles. The point spacing in the section is denser with an average distance of 15 cm between the points. This is done due to technical restriction mentioned above.
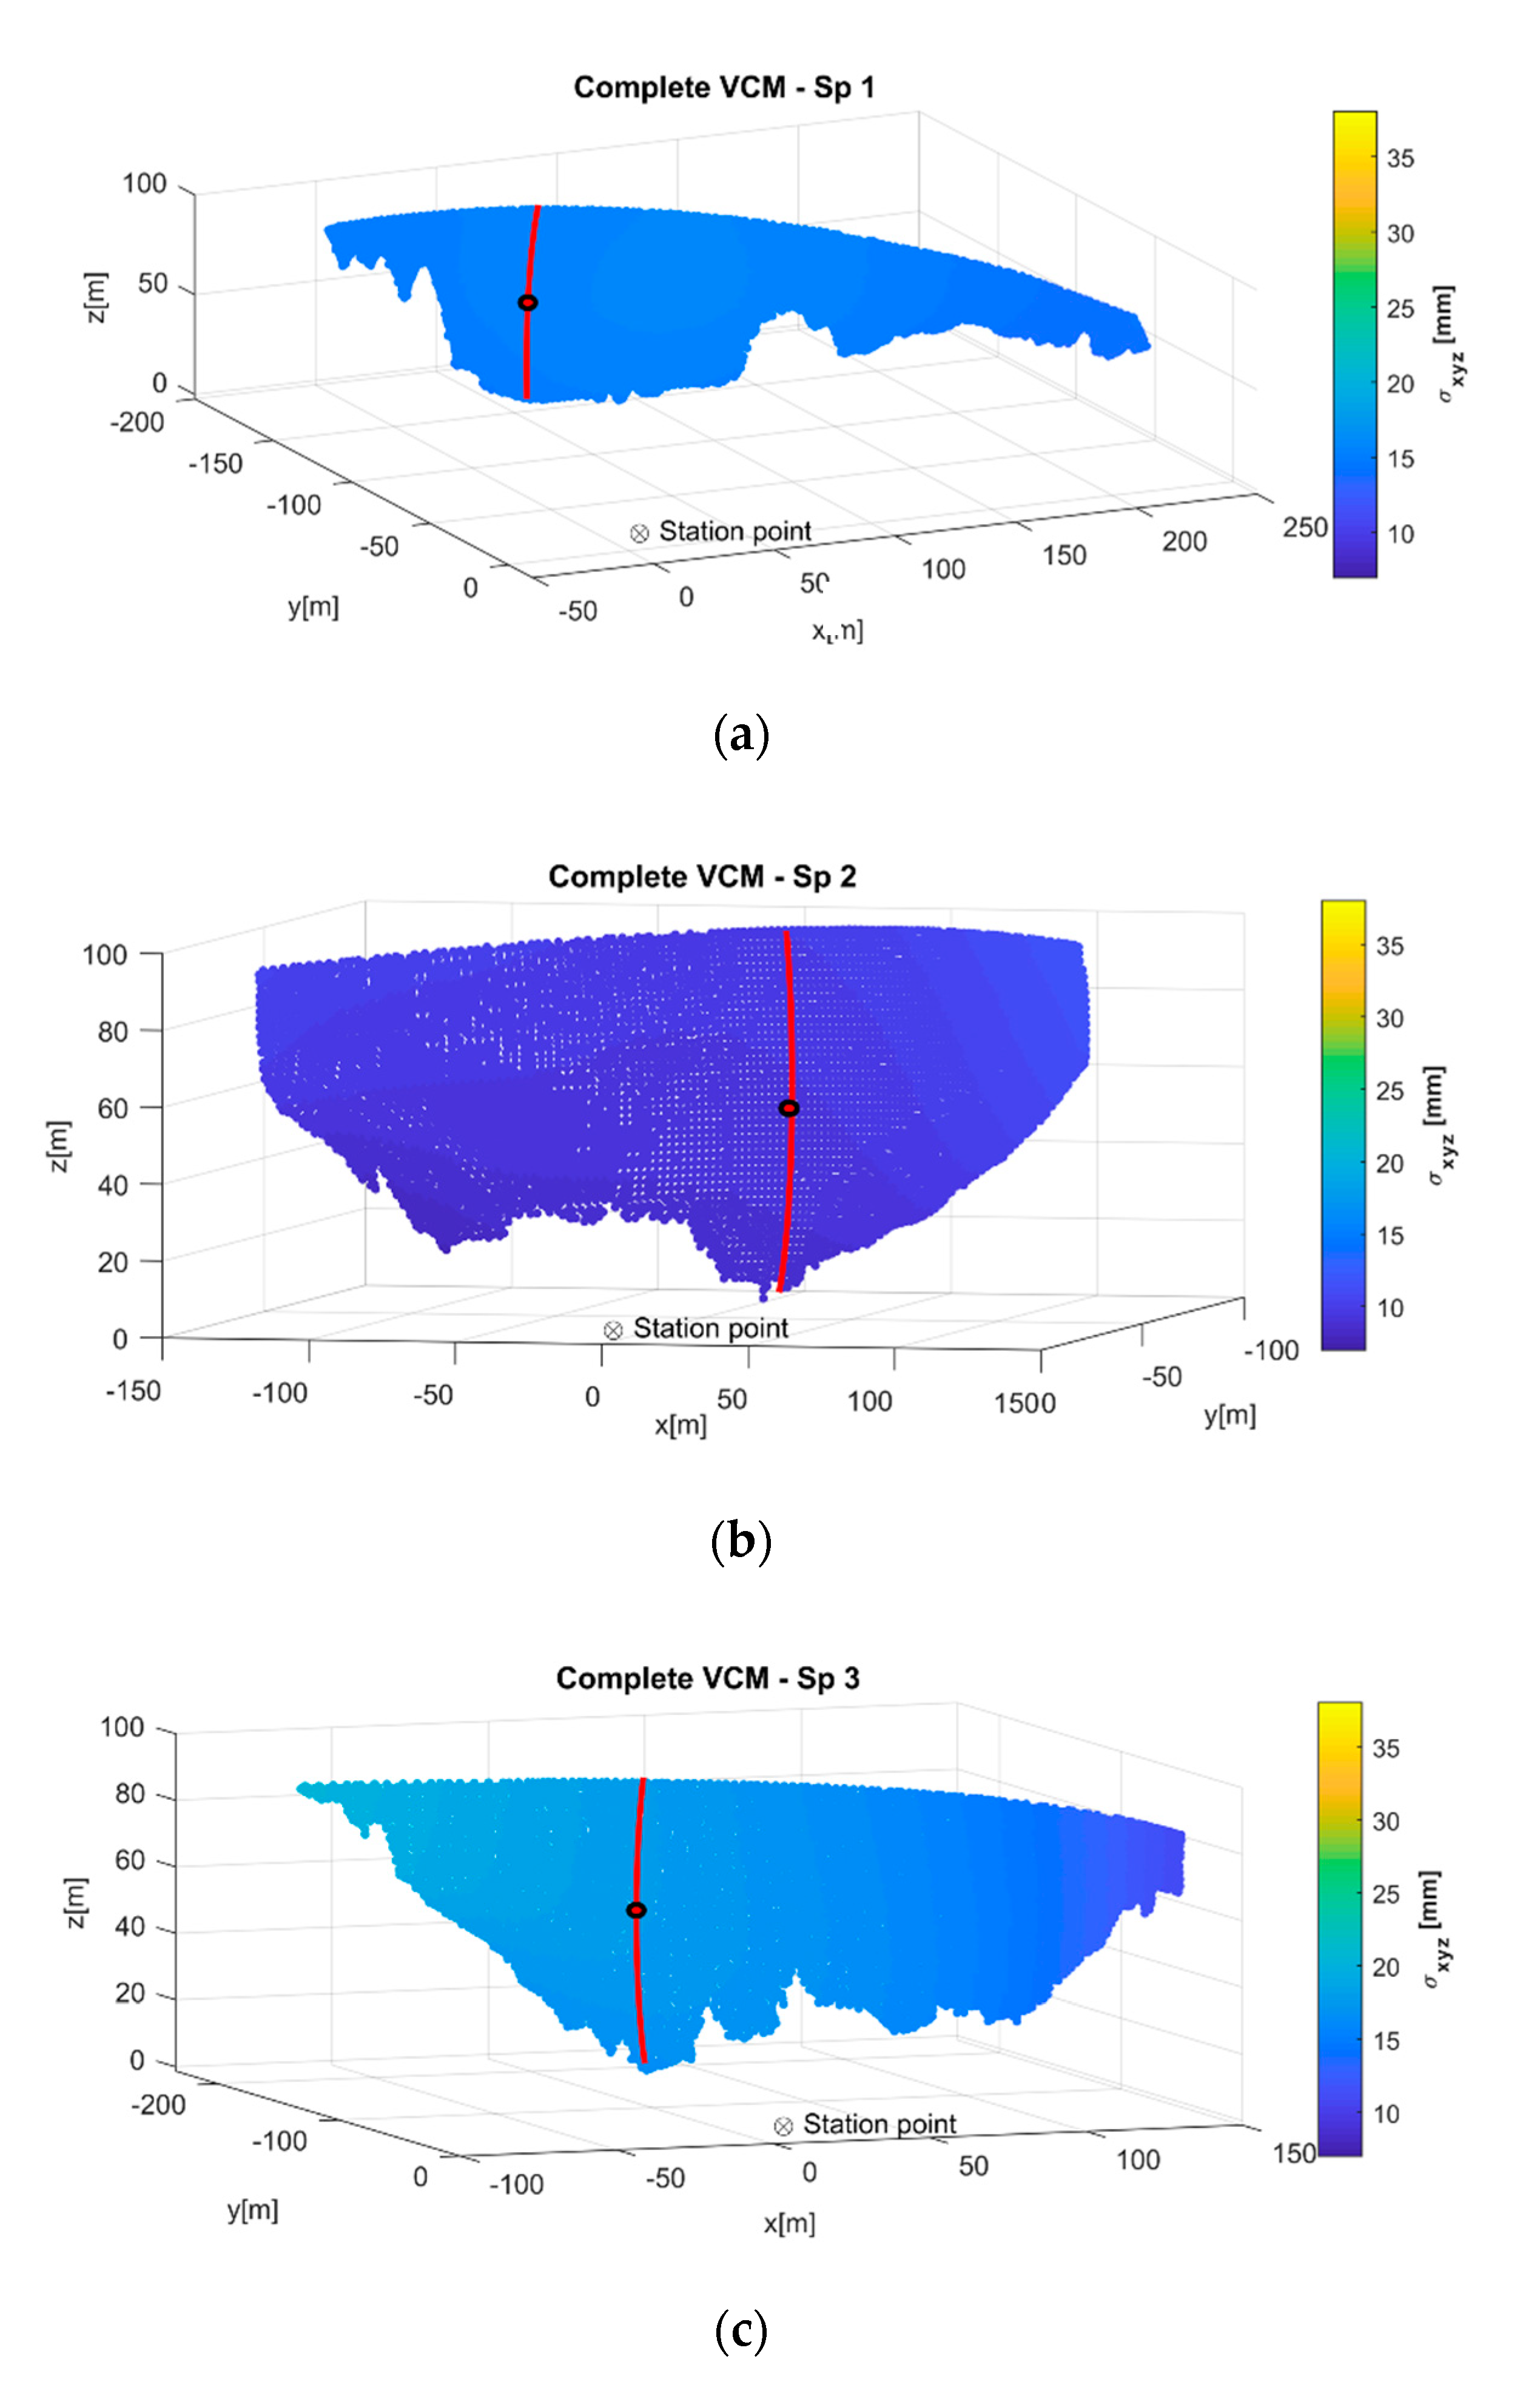
Coordinates (X, Y, Z) are considered instead of observations (R, λ, θ), because the VCM will be used for estimating the geometric primitives of a B-Spline surface in the future [59]. Therefore, the synthetic VCM is computed in observation space and then transformed with the help of equations 5 to coordinate space. Results are presented with regard to the error of position, spatial correlations along a vertical line chosen to be as long as possible along the scan (Figure 6) and contribution of all variances to the error budget in case of a single point.

4.1. Error of Position

The main diagonal of the synthetic VCM in coordinate space contains the variances for each point in the point cloud. The error of position is computed according to [21]:
σ x y z _ i = σ x i 2 + σ y i 2 + σ z i 2 .
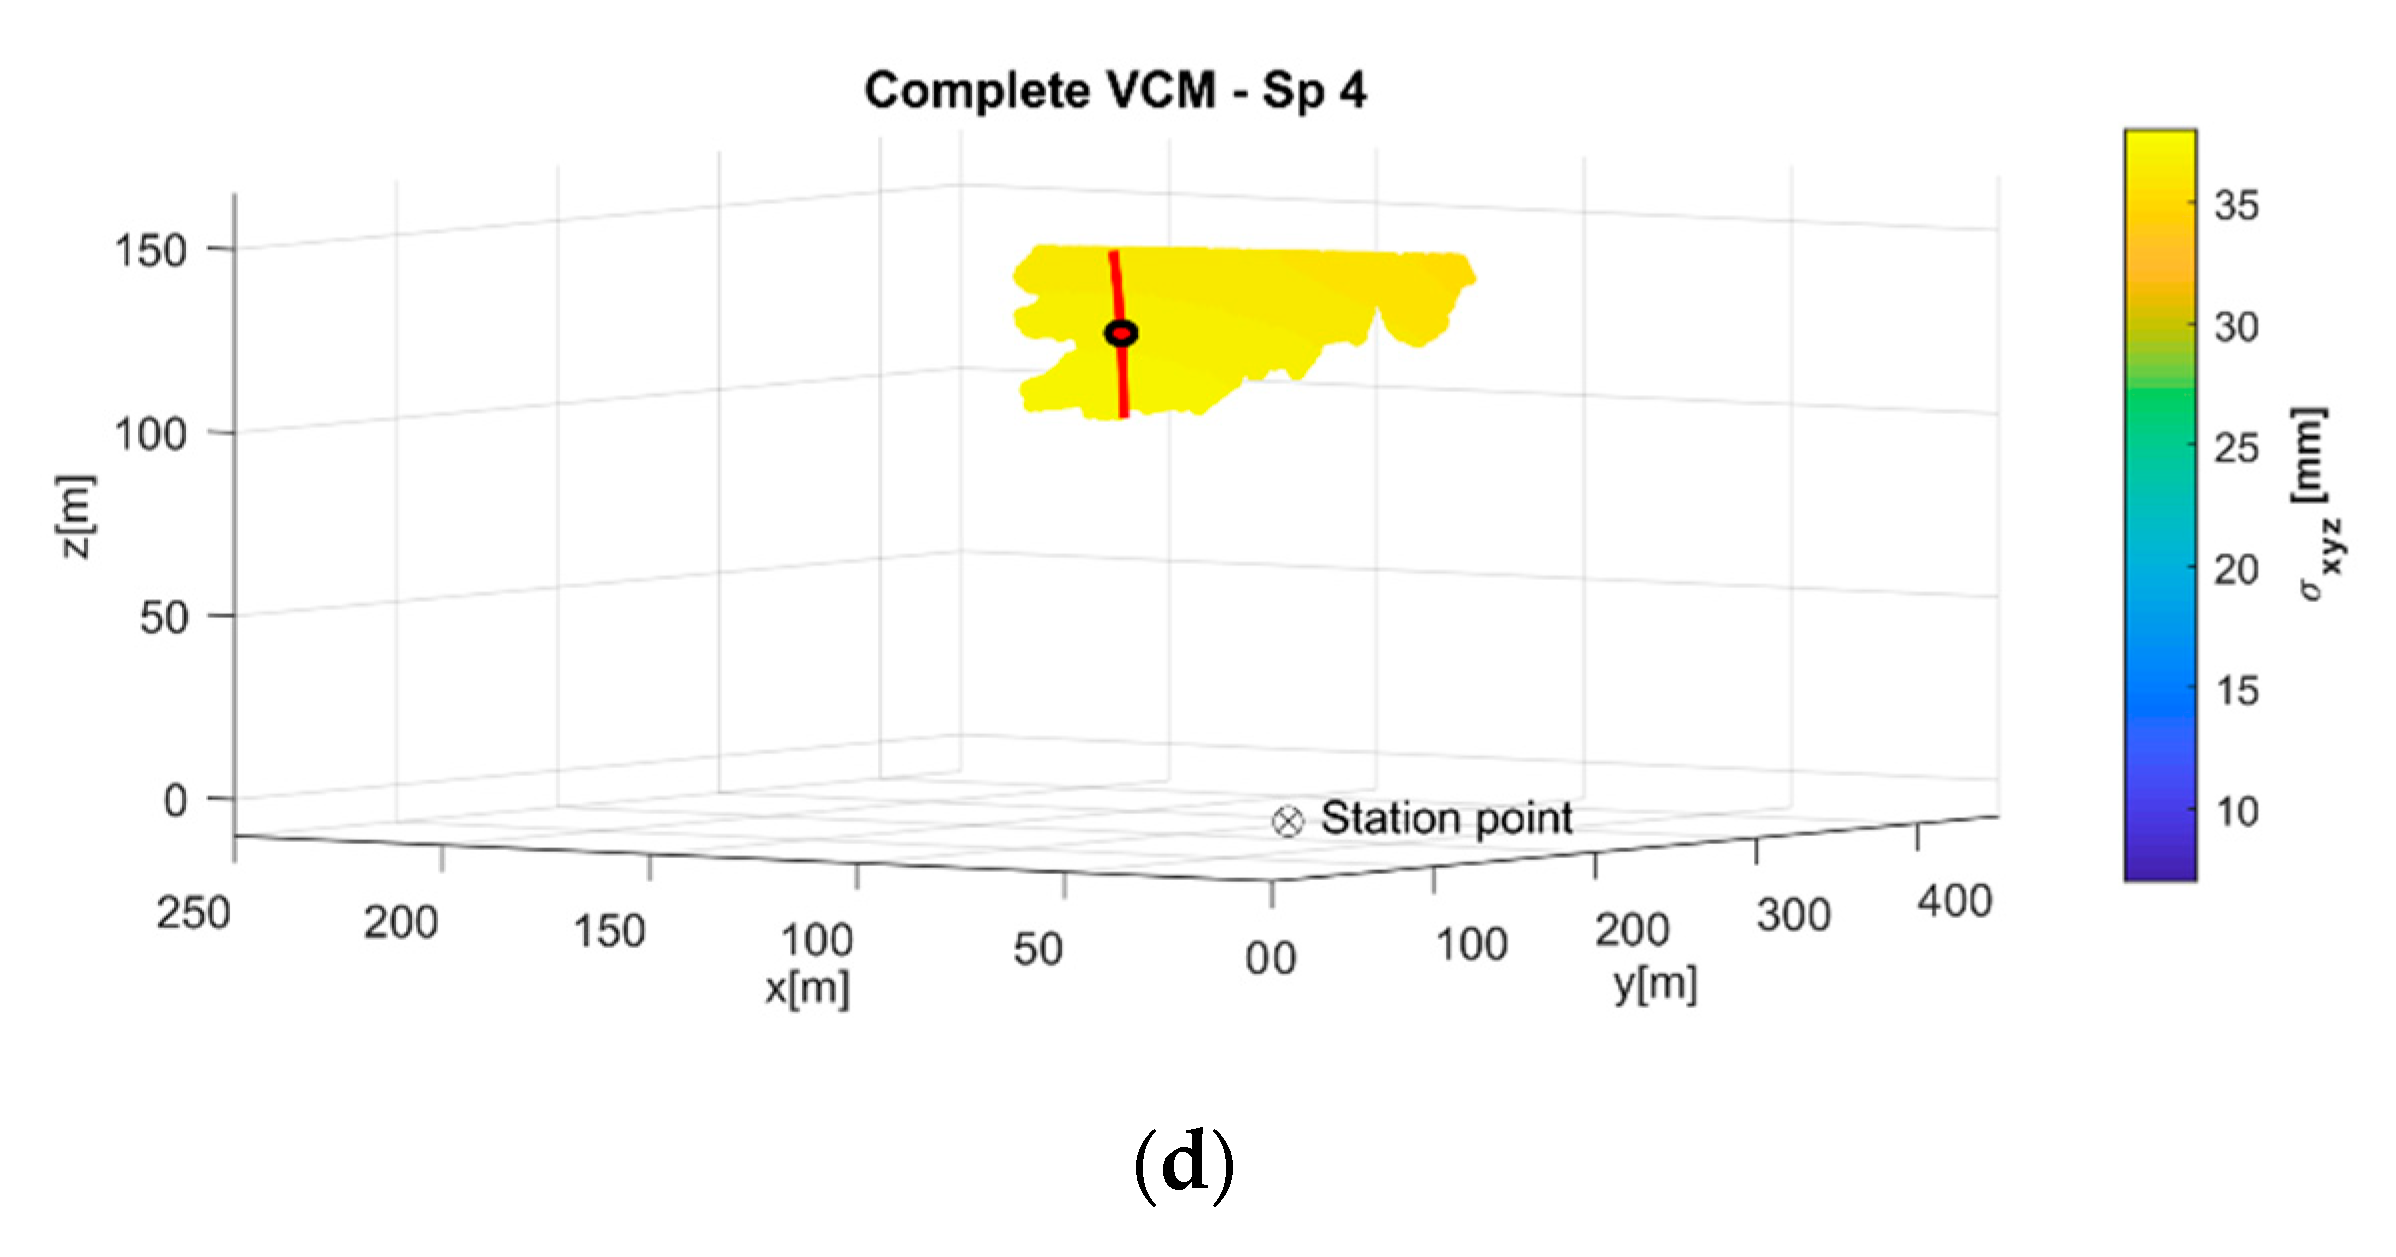
Points are visualized with respect to their position in space (local coordinate system) relative to the laser scanner position (0, 0, 0) and the dimension of the error of position is given on a color scale. Figure 6 exemplary shows the results obtained from all four station points, the selected vertical section and a point for which the percentage contribution of the variances is given later on.
Here the coverage of the air side can be seen for the first time. As expected from Figure 4, S1 to S3 cover most of the dam’s airside, whilst S4 (Figure 6d) has the smallest coverage due to height difference and vegetation. Outcomes led to average errors of position, as follows: S1 − σ ¯ x y z = 15.2 mm, S2 − σ ¯ x y z = 9.6 mm, S3 − σ ¯ x y z = 16.4 mm and S4 − σ ¯ x y z = 36.5 mm. A common color scale was chosen to maintain comparability; this is why the reader is asked to consult the digital version of the paper. At a first glance, it can be seen in which way the errors of position are distance dependent, with the smallest values for S2 (Figure 6b) which is the nearest point and the biggest value for S4 (Figure 6d) at a distance of 466 m. Both S1 and S3 (Figure 6a,c) present similar results due to the similar measurement configuration. At a closer inspection of the scan from S4, it can be seen how the error of position decreases with height, reaching a minimum at the crest (dark yellow). The lowest part has the highest values for the error of position (bright yellow). This resembles the smaller variation of the VGT (see Table 3) for TLS observations that pass through more stable atmospheric layers.

4.2. Spatial Correlations Along Vertical Sections

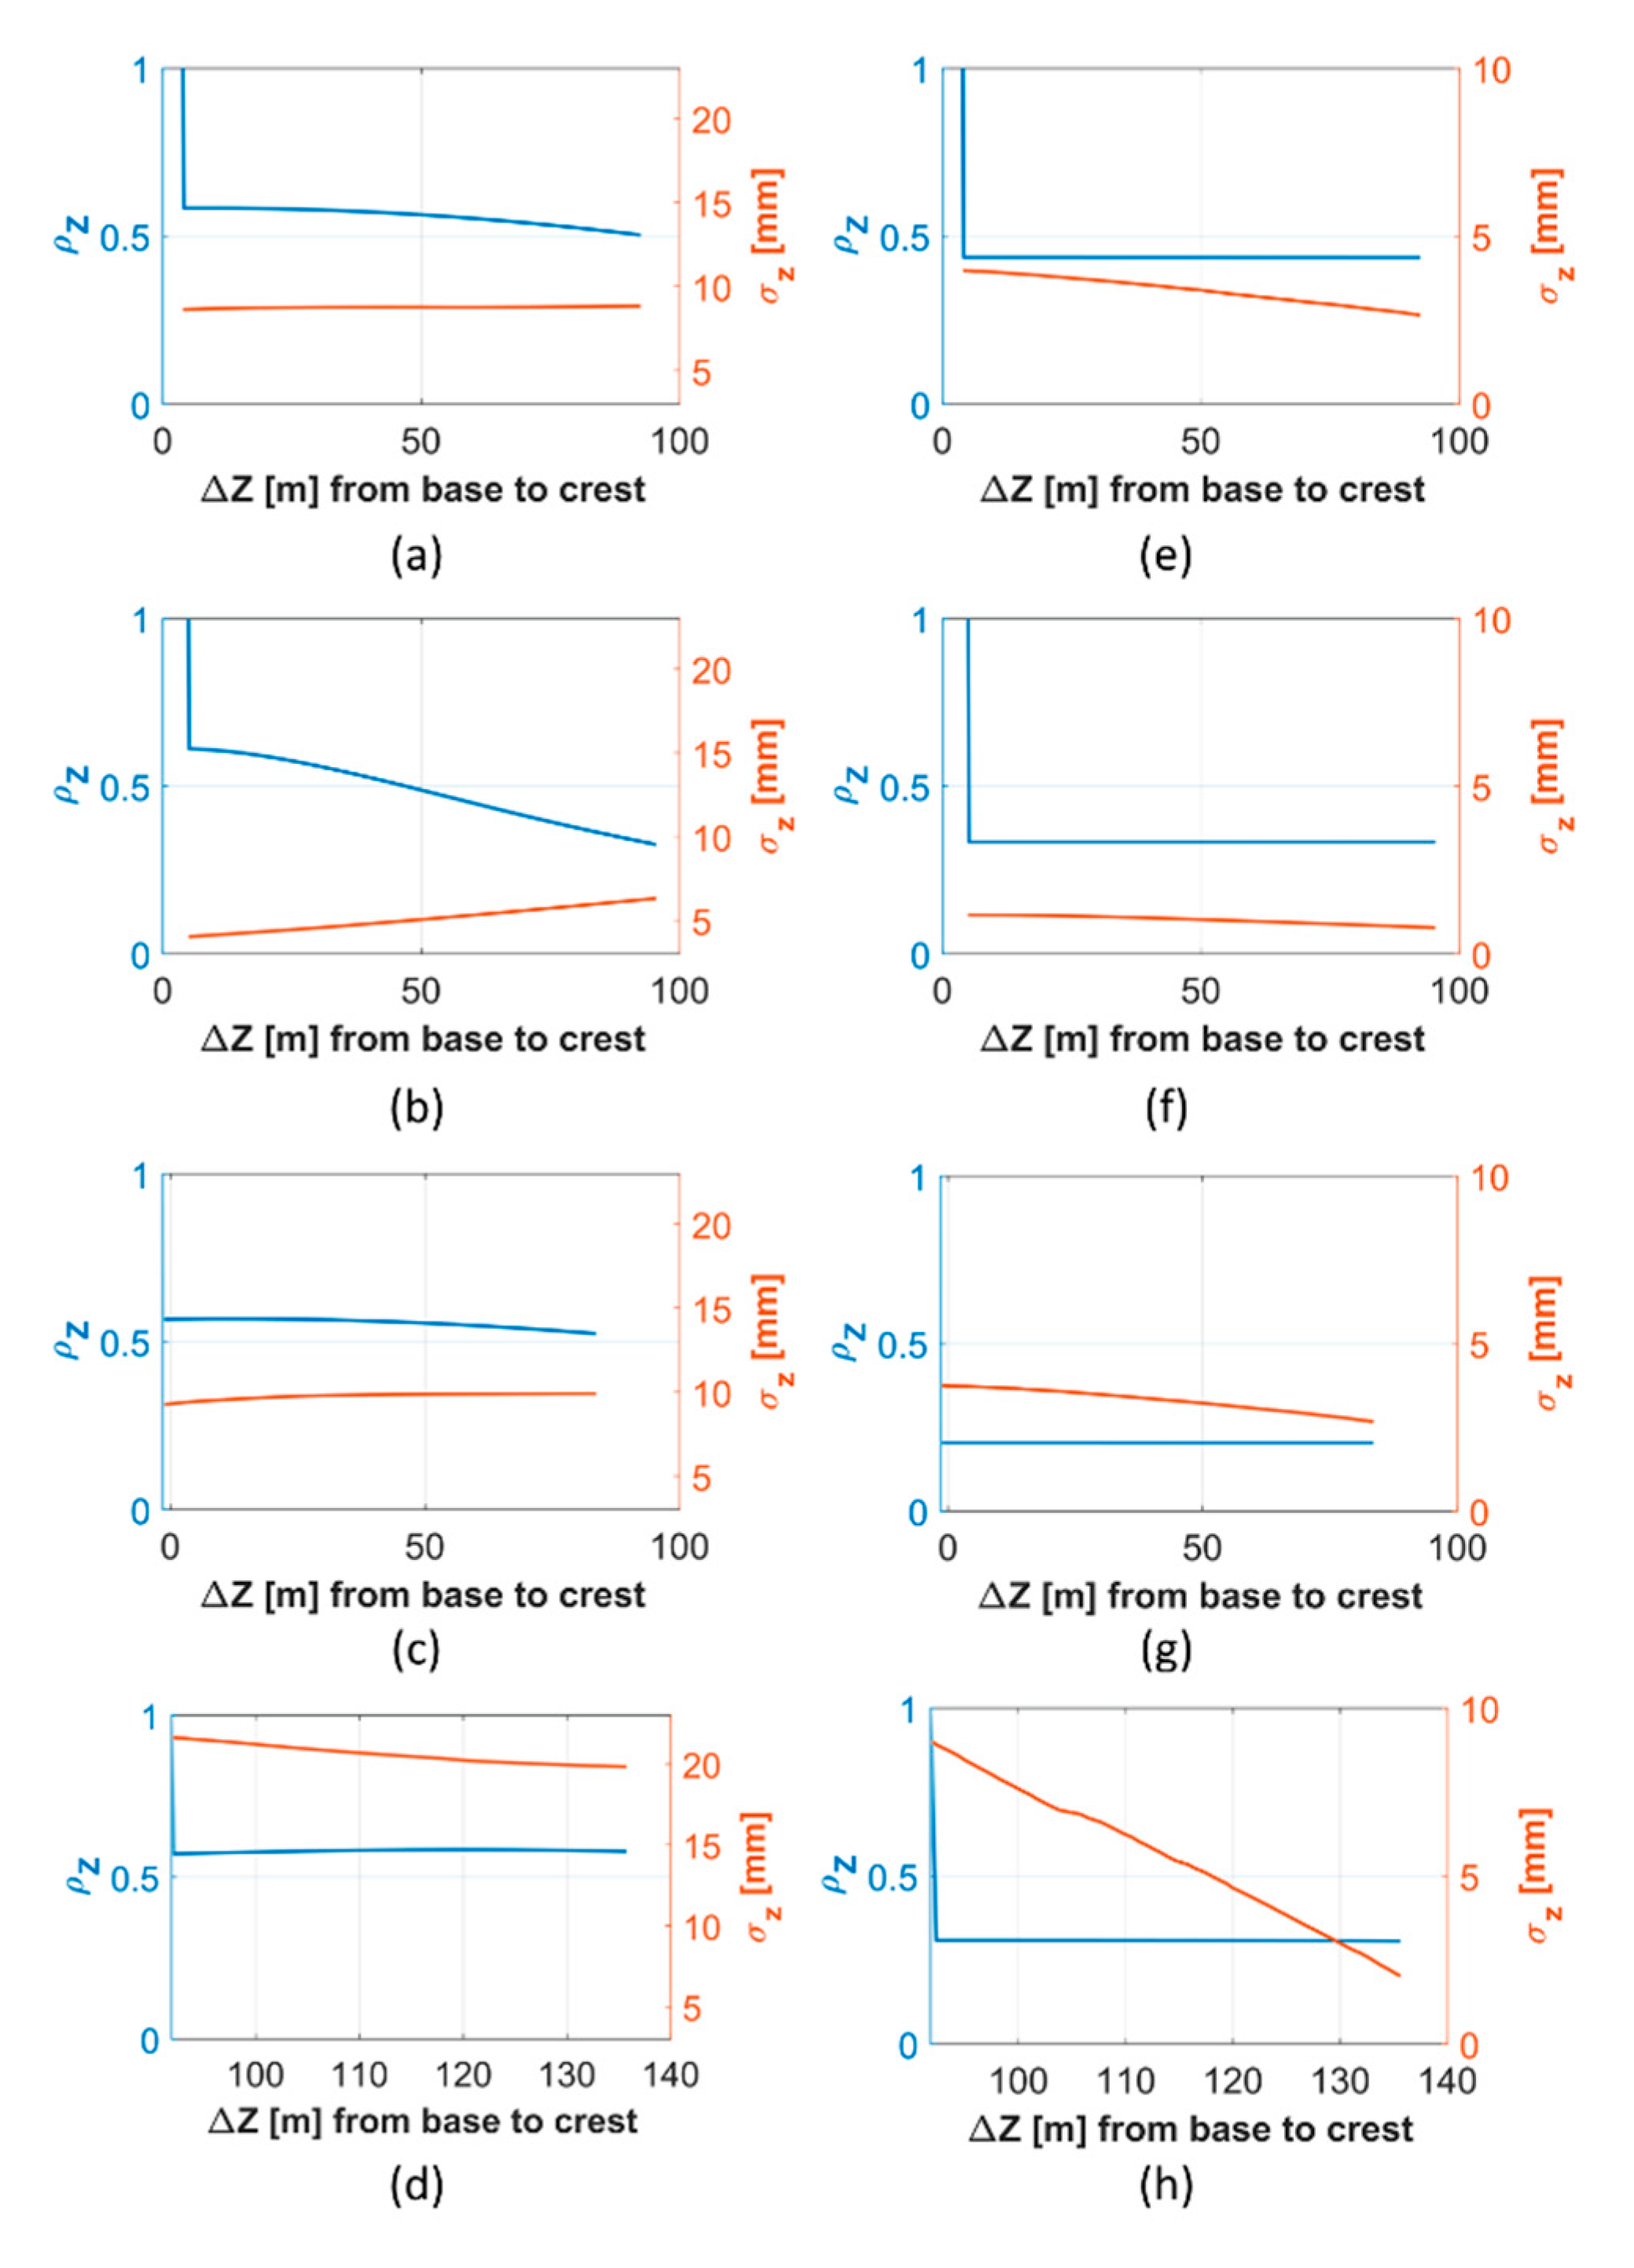
Existing correlations can be analyzed after computing a correlation matrix based on the VCM (Equation (15)). Generally, high correlations are an indication for high variances. Previous publications of the EEM for TLS topic (cf. [17]) treated atmospheric elementary errors as functional correlating. In this contribution, atmospheric elementary errors were treated stochastic correlating (cf. Section 3.4) for the first time. This leads to different spatial correlations than have not been discussed before. For this reason, special attention is offered to the stochastic correlating errors and presented in parallel with the ones obtained from the complete VCM where instrumental errors also influence the results. For each station point, one vertical section has been selected and spatial correlations are presented between the lowest point of the section and all other. The analysis is made only for the height coordinates Z. Results do not change if observations would be analyzed instead. The reason for choosing only one vertical section is that emphasis is put on how the stochastic correlating errors influence the correlations and height error of position in comparison with the complete VCM of the same station point. These cases are shown in parallel. In the first case, the EEM considers instrumental and atmospheric errors (Figure 6 left side) and in the second only atmospheric errors are considered in the EEM (Figure 6 right side).
Analyzing all correlations when instrumental and atmospheric elementary errors are considered, values are in almost all cases higher than 0.5 (Figure 7a,c,d) and present a linear decrease with increasing height. The same effect is noticed with the standard deviations of the heights that remain at approximately the same level. The exception to this is S2 (Figure 7b) where the correlations decrease with height and standard deviation increases. This is the station point with the smallest distance to the dam; therefore, an explanation for this effect is analyzed in the next section. Correlations in case of the atmospheric errors all show a linear behavior (Figure 7e–h), but at different levels. As maybe presumed, the standard deviations are very small at these distances and given level of variation for the atmospheric parameters, but the most interesting finding is at S4 (Figure 7h) where the decrease in standard deviation of height is obvious, explaining the presumption made in Section 4.1 that the upper observations travel through more stable layers of the atmosphere and are less affected by variations. This may lead to the thought that scans for e.g., objects over a valley are more reliable than those acquired from parallel to the ground level. This is partly true, since VGT may also be stable for a short period of time at ground level; therefore, this issue strongly depends on the topography and local conditions. If the conditions in Table 2 are reviewed, it can be seen that similar atmospheric conditions do not necessarily lead to a similar level of correlation, for example point clouds from S2 and S4 where acquired under differing conditions, but led to a similar level of correlation for the atmospheric elementary errors.

4.3. Contribution of the Elementary Errors Variances to the Overall Error Budget

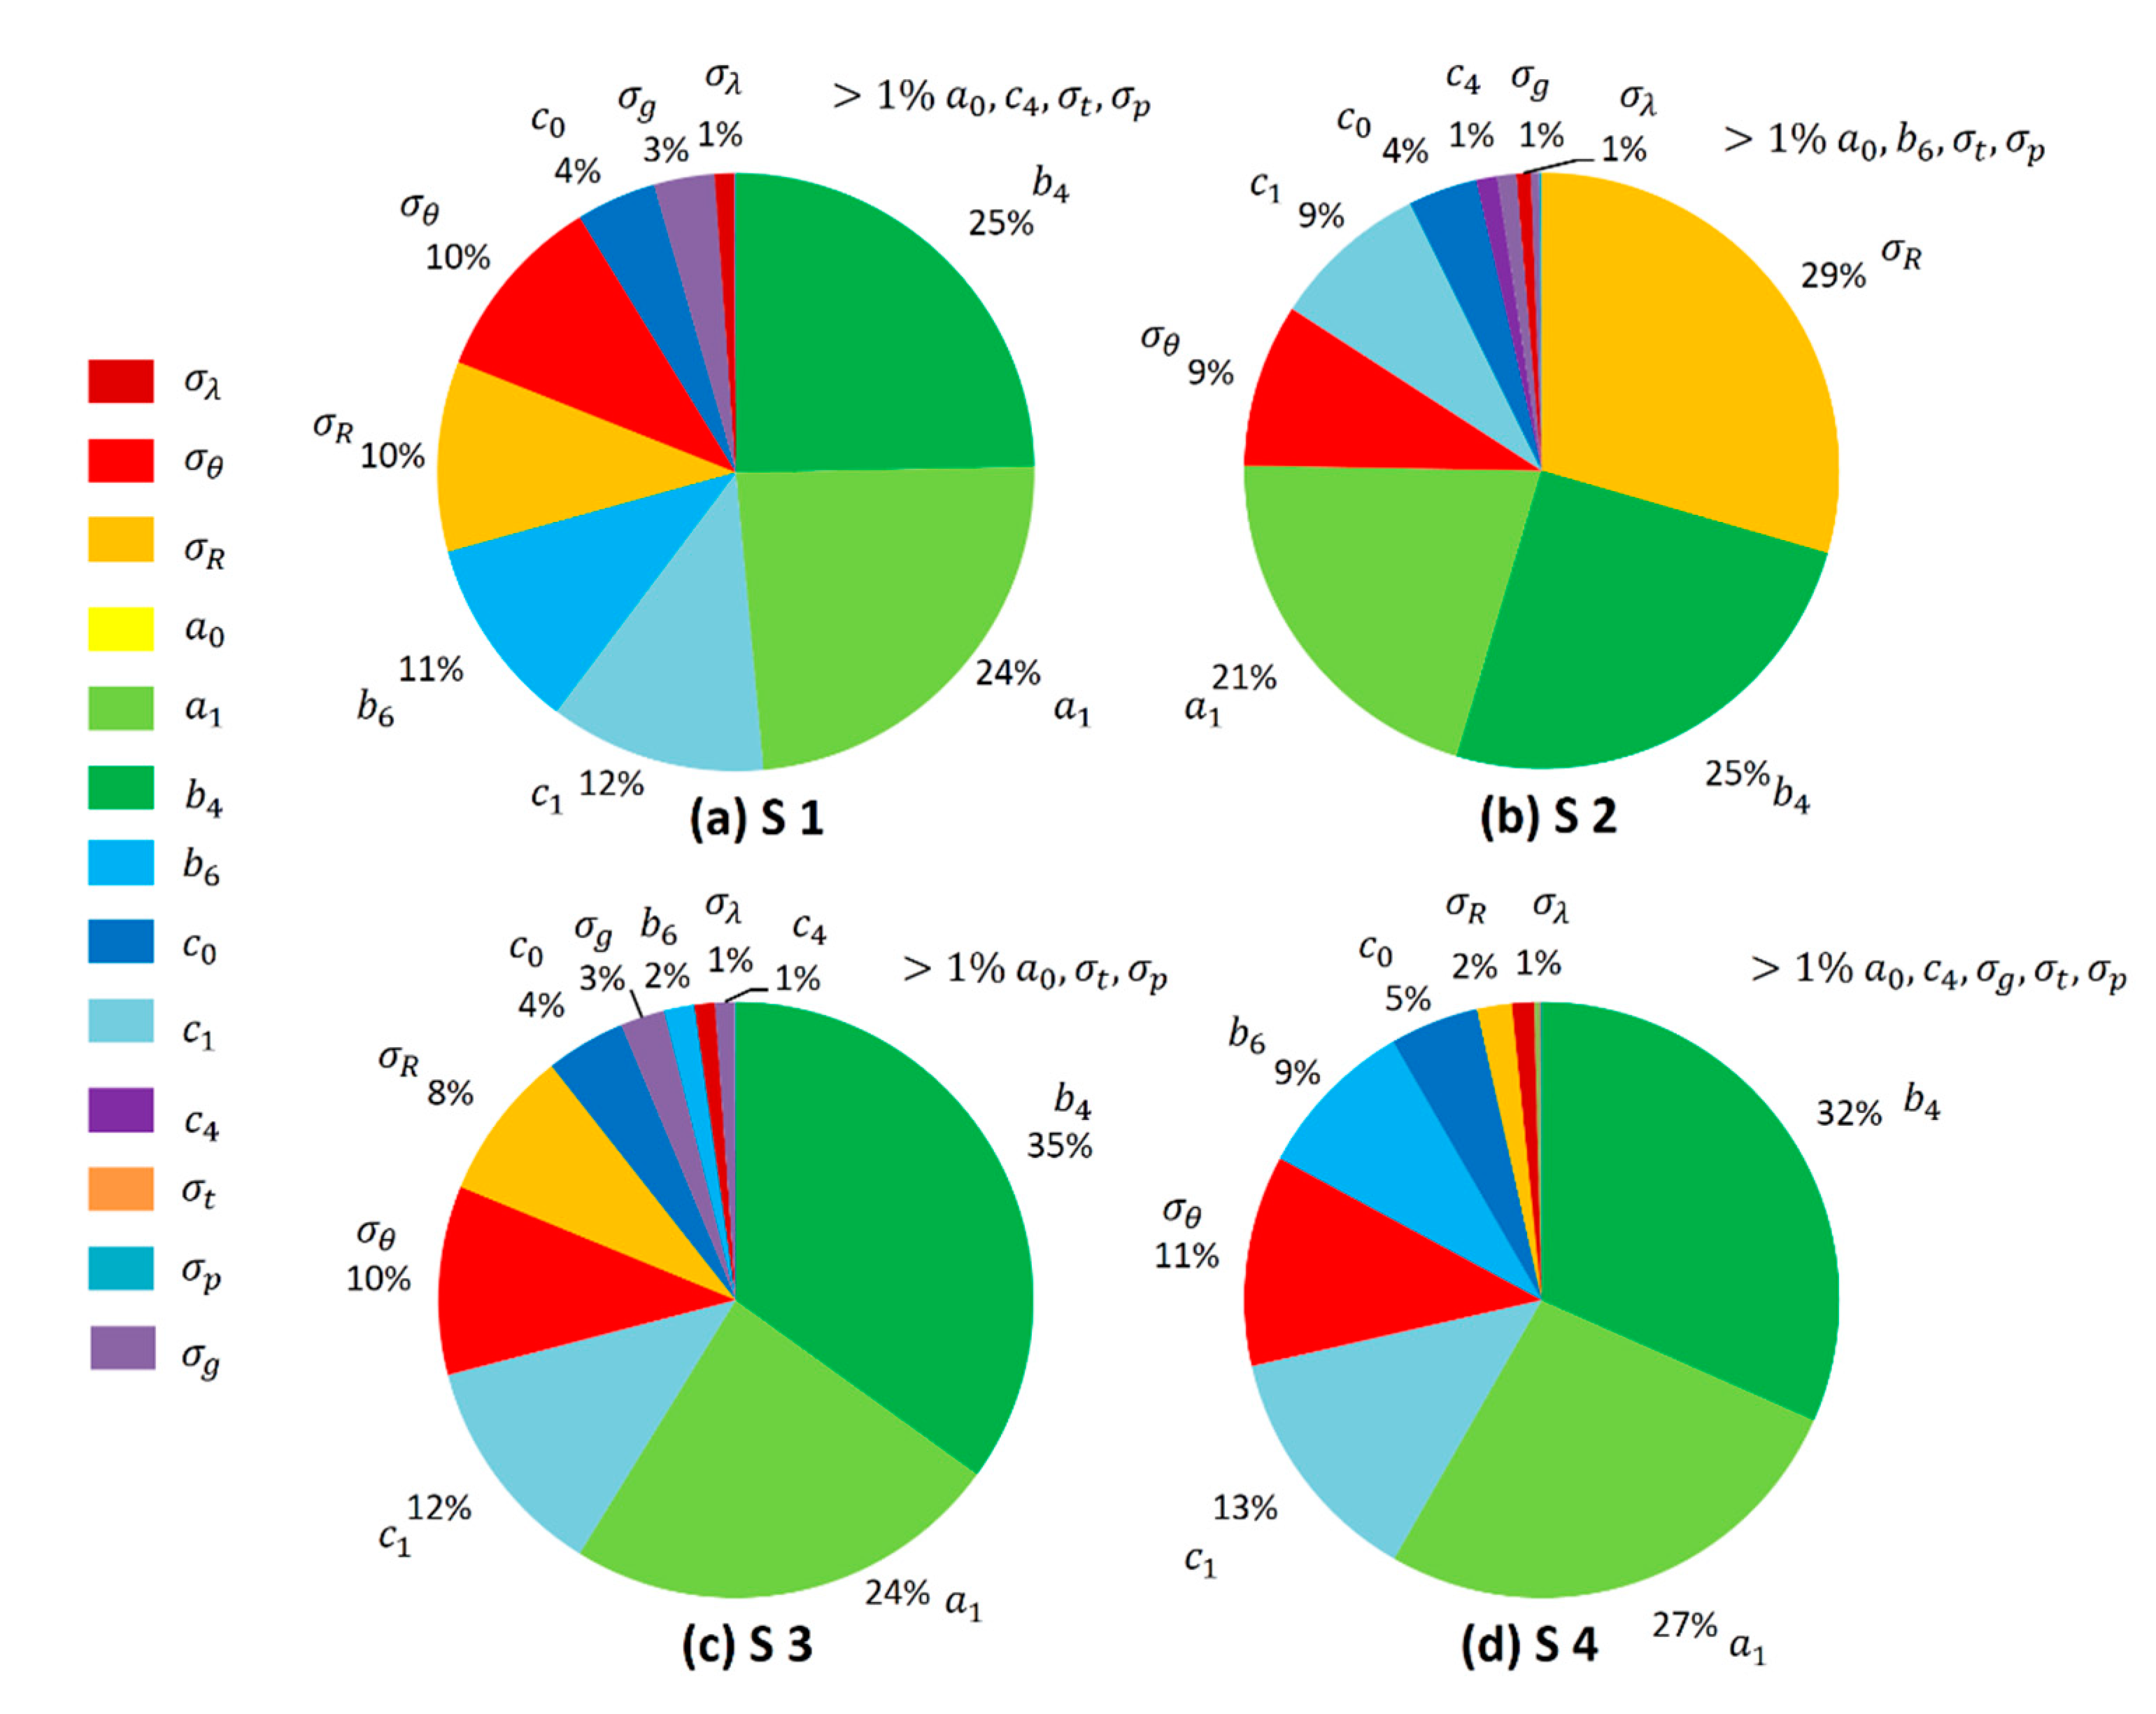
The points depicted in Figure 6 (red circles) are chosen to analyze the contribution of variances to the whole error budget. Note that here, all dimensions (X, Y, Z) are considered and not only Z as in the section before. For the first three station points, they are approximately at the same level. In case of S4, this is not possible since that part of the dam cannot be scanned.
In all situations, instrumental errors make up the majority of the error budget (Figure 8). The parameters b 4 —horizontal circle eccentricity, a 1 —scale error and c 1 —horizontal circle eccentricity comprise in all cases more than 50% of the error budget. It can also be seen that some instrumental errors are negligible (e.g., a 0 ) since they remain under the 1% quote. In the previous section, the standard deviations for Z are affected by instrumental errors of the vertical angle encoder ( c 0 , c 1 ,   c 4 ) and vertical angle noise σ θ . It is also seen how this phenomenon is almost independent of distance and scanning configuration. Just to outline some of the instrumental errors, σ θ is always between 9% and 11%, c 1 between 9% and 13% and c 0 4% with exception to S4.
The elementary errors for air temperature and air pressure at this level of variance (see Table 3) fall into the same category remaining under the quote of 1%, fact related to the small influencing coefficients in Equation (11). The contribution of the VGT reaches 3% of the error budget for S1 (Figure 8a) and S3 (Figure 8c). This is explainable by the fact that a large part of the observations are in the lower atmosphere layer, where the VGT instability is known to be higher (cf. [53]). A higher level of variance would generally lead to higher contributions to the error budget, but this is planned to be studied further for longer ranges and within different timespans.

5. Conclusions

Throughout this contribution, a method of defining a stochastic model for TLS observations was presented. At the time being, this model considers instrumental errors of long-range laser scanners and meteorological error sources.
The EEM is improved by directly introducing the existing spatial correlations into the synthetic VCM, without the need to compute them each time. This will confirm the EEM advantages when a second measurement epoch is available. It was also shown that some of the instrumental and atmospheric elementary errors can be neglected at the given level of variance, having a contribution of less than 1% to the complete error budget. Within this contribution, the line of previous EEM publications was continued with the introduction of atmospheric elementary errors treated as stochastic correlating and the introduction of a functional model for hybrid laser scanners. The newly achieved VCM plays an important role in surface estimations as already shown in [7]. Other possible applications that may benefit from this model can be encountered in landslide, glacier or rock cliff monitoring.
Resuming the newly discussed topics, it can be mentioned that:
  • the functional model was adapted for the instrumental errors of the Riegl VZ-2000 scanner;
  • a deterministic approach was used to consider the spatial distribution of the atmospheric errors;
  • the atmospheric elementary errors were included in the EEM as stochastic correlating errors;
  • the error of position was presented in relation to the scanner position (geometric configuration) and yielded average values between 9 mm and 37 mm for ranges of 88 m to 456 m;
  • spatial correlations have been analyzed with respect to a vertical section in each case;
  • the contribution of individual error sources outlined the fact that instrumental errors have the biggest impact on the error of position.
As regards the topics under research, the EEM for TLS measurements is still lacking object related elementary errors. This implies using existing studies for different materials scanned from different positions at different ranges and include these errors into the stochastic correlating group. The authors intend to use intensity values of the reflected laser beam, as introduced by Wujanz et al. [61]. Having done this would make the EEM a powerful tool for generating a TLS stochastic model that considers all important error sources. Another topic under research is the sensitivity analysis of the input parameters. After completing the stochastic model, attention will be accorded to the impact of each individual input parameter on the outcomes. This allows an estimation of the optimal scanning configuration.

Author Contributions

Methodology, G.K. and V.S.; software, G.K.; validation, V.S. and G.K.; formal analysis, G.K.; resources, G.K. and V.S.; data acquisition, G.K.; writing—original draft preparation, G.K.; writing—review and editing, V.S.; supervision, V.S.; project administration, V.S. All authors have read and agreed to the published version of the manuscript.

Funding

This research was funded by DFG (German Research Foundation), SCHW 838/7-3 within the project IMKAD II “Integrated space-time modeling based on correlated measurements for the determination of survey configurations and the description of deformation processes”. The project is also associated with Cluster of Excellence Integrative Computational Design and Construction for Architecture (IntCDC) and supported by the DFG under Germany’s Excellence Strategy—EXC 2120/1—390831618.

Acknowledgments

The authors also express their gratitude to Illwerke vkv AG, especially thanking Ralf Laufer for supporting the measurement campaign in 2019. Acknowledgment also goes to “Landesamt für Vermessung und Geoinformation” Land Vorarlberg for making LiDAR data available for the research area around the Kops lake.

Conflicts of Interest

The authors declare no conflict of interest.

References

  1. Uren, J.; Price, B. Surveying for Engineers, 5th ed.; Palgrave Macmillan: New York, NY, USA, 2010. [Google Scholar]
  2. Kuhlmann, H.; Schwieger, V.; Wieser, A.; Niemeier, W. Engineering Geodesy-Definition and Core Competencies. J. Appl. Geod. 2014, 8, 327–334. [Google Scholar] [CrossRef] [Green Version]
  3. Ogundare, J.O. Precision Surveying: The Principles and Geoamtics Practice; John Wiley & Sons, Inc.: Hoboken, NY, USA, 2016; pp. 8–13. [Google Scholar]
  4. Wunderlich, T.; Niemeier, W.; Wujanz, D.; Holst, C.; Neitzel, F.; Kuhlmann, H. Areal Deformation Analysis from TLS Point Clouds–The Challenge. Allg. Vermess. 2016, 123, 340–351. [Google Scholar]
  5. Paffenholz, J.A.; Stenz, U.; Wujanz, D.; Neitzel, F.; Neumann, I. 3DPunktwolken-basiertes Monitoring von Infrastrukturbauwerken am Beispiel einer historischen Gewölbebrücke. In Proceedings of the TLS 2017 Seminar DVW-Schriftreihe, Band 88/2017, Fulda, Germany, 11–12 December 2017. [Google Scholar]
  6. Kermarrec, G.; Alkhatib, H.; Neumann, I. On the Sensitivity of the Parameters of the Intensity-Based Stochastic Model for Terrestrial Laser Scanner. Case Study: B-Spline Approximation. Sensors 2018, 18, 2964. [Google Scholar] [CrossRef] [PubMed] [Green Version]
  7. Harmening, C.; Neuner, H. A spatio-temporal deformation model for laser scanning point clouds. J. Geod. 2020, 94, 26. [Google Scholar] [CrossRef] [Green Version]
  8. Mettenleiter, M.; Härtl, F.; Kresser, S.; Fröhlich, C. Laserscanning—Phasenbasierte Lasermesstechnik für die Hochpräzise und Schnelle Dreidimensionale Umgebungserfassung; Süddeutscher Verlag onpact GmbH: Munich, Germany, 2015; pp. 4–5. [Google Scholar]
  9. Staiger, R. Terrestrial Laser Scanning Technology-Systems and Applications. In Proceedings of the 2nd FIG Regional Conference, Marrakech, Morocco, 2–5 December 2003. [Google Scholar]
  10. Wieser, A.; Pfaffenholz, J.-A.; Neumann, I. Sensoren, Features und Physik-Zum aktuellen Stand der Entwicklung bei Laserscannern. In Proceedings of the TLS 2019 Seminar, DVW-Schriftreihe, Band 96/2019, Fulda, Germany, 2–3 December 2019. [Google Scholar]
  11. Kuhlmann, H.; Holst, C. Flächenhafte Abtastung mit Laserscanning-Messtechnik, flächenhafte Modellierung und aktuelle Entwicklungen im Bereich des terrestrischen Laserscanning. In Ingenieurgeodäsie-Handbuch der Geodäsie; Schwarz, W., Ed.; Springer: Berlin, Germany, 2018; pp. 203–205. [Google Scholar]
  12. Neuner, H.; Holst, C.; Kuhlmann, H. Overview on Current Modelling Strategies of Point Clouds for Deformation Analysis. Allg. Vermess. 2016, 123, 328–339. [Google Scholar]
  13. Borovkov, K. Elements of Stochastic Modelling; World Scientific Publishing Co. Pte. Ltd.: Singapore, 2014; pp. 3–4. [Google Scholar]
  14. Niemeier, W. Ausgleichungsrechnung, 2nd ed.; Walter de Gruyter: Berlin, Germany, 2008; pp. 31–33. [Google Scholar]
  15. Matthias, H.J. Bedeutung und Konstruktion von Kovarianzen in der Messtechnik. Ph.D. Thesis, Institut für Geodäsie und Photogrammetrie an der Eidgenössischen Technischen Hochschule Zürich, Mitteilungen Nr. 41, Zürich, Switzerland, 1992. [Google Scholar]
  16. Zhao, X.; Kermarrec, G.; Kargoll, B.; Alkhatib, H.; Neumann, I. Influence of the simplified stochastic model of TLS measurements on geometry-based deformation analysis. J. Appl. Geod. 2019, 13, 199–214. [Google Scholar] [CrossRef]
  17. Kauker, S.; Schwieger, V. A synthetic covariance matrix for monitoring by terrestrial laser scanning. J. Appl. Geod. 2017, 11, 77–87. [Google Scholar] [CrossRef]
  18. Schweitzer, J.; Schwieger, V. Modeling and Propagation of Quality Parameters in Engineering Geodesy Processes in Civil Engineering. In Proceedings of the 1st International Workshop on the Quality of Geodetic Observation and Monitoring Systems, Munich, Germany , 13–15 April 2011; Kutterer, H., Seitz, F., Alkhatib, H., Schmidt, M., Eds.; Springer: Cham, Switzerland, 2015. [Google Scholar]
  19. ISO/IEC Guide 98-3:2008: Uncertainty of Measurement—Part 3: Guide to the Expression of Uncertainty in Measurement (GUM:1995); International Organization for Standardization: Genève, Switzerland, 2008.
  20. Metropolis, N.; Ulam, S. The Monte Carlo Method. J. Am. Stat. Assoc. 1949, 44, 335–341. [Google Scholar] [CrossRef] [PubMed]
  21. Pelzer, H. Grundlagen der Mathematischen Statistik und der Ausgleichungsrechung. In Geodätische Netze in Landes- und Ingenieurvermessung; Pelzer, H., Ed.; Konrad Wittwer: Stuttgart, Germany, 1985. [Google Scholar]
  22. Koch, K.R. Determining uncertainties of correlated measurements by Monte Carlo simulations applied to laserscanning. J. Appl. Geod. 2008, 2, 139–147. [Google Scholar] [CrossRef]
  23. Aichinger, J.; Schwieger, V. Influence of scanning parameters on the estimation accuracy of control points of B-spline surfaces. J. Appl. Geod. 2018, 12, 157–167. [Google Scholar] [CrossRef]
  24. Förstner, W. Ein Verfahren zur Schätzung von Varianz-und Kovarianzkomponenten. Allg. Vermess. 1979, 86, 446–453. [Google Scholar]
  25. Koch, K.R. Parameterschätzung Und Hypothesentests in Linearen Modellen, 1st ed.; Ed. Dümmler: Bonn, Germany, 1980; pp. 245–259. [Google Scholar]
  26. Teunissen, P.J.G.; Amiri-Simkooei, A.R. Least-squares variance component estimation. J. Geod. 2008, 82, 65–82. [Google Scholar] [CrossRef] [Green Version]
  27. Niemeier, W.; Hollman, R. Haputkomponenten- und Sensitivitätsanalyse Geodätischer Netzte aufgezeigt am Überwachungsnetz Varna; WAdFV Hanover, Nr. 133; Hanover, Germany, 1984; pp. 61–72. [Google Scholar]
  28. Saltelli, A.; Chan, K.; Scott, E.M. (Eds.) Sensitivity Analysis, 1st ed.; John Wiley and Sons: New York, NY, USA, 2000. [Google Scholar]
  29. Hagen, G. Gründzuge der Wahrscheinlichkeits-Rechnung; Ed. Dümmler: Berlin, Germany, 1837. [Google Scholar]
  30. Bessel, F.W. Untersuchung über die Wahrscheinlichkeit der Beobachtungsfehler. Astron. Nachr. 1837, 15, 369–404. [Google Scholar]
  31. Schwieger, V. Ein Elementarfehlermodell für GPS Überwachungsmessungen; Schriftenreihe der Fachrichtung Vermessungswesen der Universität Hannover: Hanover, Germany, 1999; Volume 231. [Google Scholar]
  32. Augath, W. Lagenetze, Geodätische Netze in Landes-und Ingenieurvermessung. In Geodätische Netze in Landes-und Ingenieurvermessung; Pelzer, H., Ed.; Konrad Wittwer: Stuttgart, Germany, 1985. [Google Scholar]
  33. Schwieger, V. Determination of Synthetic Covariance Matrices–An Application to GPS Monitoring Measurements. In Proceedings of the 15th European Signal Processing Conference EUSIPCO 2007, Poznan, Poland, 3–7 September 2007. [Google Scholar]
  34. Rüeger, J.M. Electronic Distance Measurement: An Introduction, 3rd totally revised ed.; Springer: Berlin, Germany, 1990. [Google Scholar]
  35. Jutzi, B. Analyse der zeitliche Signalform von Rückgestreuten Laserpulse. Ph.D. Thesis-DGK, Reihe C, Heft Nr. 611, Technical University of Munich, Munich, Germany, 2007. [Google Scholar]
  36. Soudarissanane, S.S. The Geometry of Terrestrial Laser Scanning-identification of Errors, Modeling and Mitigation of Scanning Geometry. Ph.D. Thesis, Technical Universit of Delf, Delft, The Netherlands, 2016. [Google Scholar]
  37. Chow, J.C.K.; Lichti, D.D.; Glennie, C.; Hartzell, P. Improvements to and Comparison of Static Terrestrial LiDAR Self-Calibration Methods. Sensors 2013, 13, 7224–7249. [Google Scholar] [CrossRef] [PubMed] [Green Version]
  38. Riegl Laser Measurement Systems GmbH, Horn, Austria. Datasheet of Riegl VZ-2000. Available online: http://www.riegl.com (accessed on 20 January 2020).
  39. Rabinovich, S.G. Evaluating Measurement Accuracy—A Practical Approach, 3rd ed.; Springer International Publishing AG: Cham, Switzerland, 2017. [Google Scholar]
  40. Wunderlich, T.H.; Wasmeier, P.; Ohlmann-Lauber, J.; Schäfer, T.H.; Reidl, F. Objective Specifications of Terrestrial Laserscanners—A Contribution of the Geodetic Laboratory at the Technische Universität München. Blaue Reihe des Lehrstuhls für Geodäsie 2013, 21, 8–10. [Google Scholar]
  41. Lichti, D. Error modeling, calibration and analysis of an AM-CW terrestrial laser scanner system. ISPRS J. Photogramm. Remote Sens. 2007, 66, 307–324. [Google Scholar] [CrossRef]
  42. Lichti, D. Terrestrial laser scanner self-calibration: Correlation sources and their mitigation. ISPRS J. Photogramm. Remote Sens. 2010, 65, 93–102. [Google Scholar] [CrossRef]
  43. Schneider, D. Calibration of a Riegl LMS-Z420i based on a Multi-Station Adjustment and a Geometric Model with Additional Parameters. In Proceedings of the Laser Scanning 2009, IAPRS, Vol. XXXVIII, Part 3/W8, Paris, France, 1–2 September 2009; Bretar, F., Pierrot-Deseilligny, M., Vosselman, G., Eds.; [Google Scholar]
  44. Fröhlich, C. Aktive Erzeugung korresnpondierender Tiefen-und Reflektivitätsbilder und ihre Nutztung zur Umgebungserfassung. Doctoral Thesis, Leibniz Universität Hannover, Munich, Germany, 1996. [Google Scholar]
  45. Riegl Laser Measurement Systems GmbH, Horn, Austria RiSCAN Pro Software Help Documentation. 2015. Available online: http://www.riegl.com/products/software-packages/riscan-pro/ (accessed on 20 January 2020).
  46. International Association of Geodesy. IAG Resolutions adopted at the XXIIth General Assembly in Birmingham 1999. Available online: https://iag.dgfi.tum.de/fileadmin/IAG-docs/IAG_Resolutions_1999.pdf (accessed on 19 January 2020).
  47. Reshetyuk, Y. Self-Calibration and Direct Georeferencing in Terrestrial Laser Scanning. Ph.D. Thesis, Universitetsservice, US AB, Stockholm, Sweden, 2009. [Google Scholar]
  48. Friedli, E.; Presl, R.; Wieser, A. Influence of atmospheric refraction on terrestrial laser scanning at long range. In Proceedings of the 4th Joint International Symposium on Deformation Monitoring (JISDM), Athens, Greece, 15–17 May 2019. [Google Scholar]
  49. Joeckel, R.; Stober, M.; Huep, W. Elektronische Entferungs- und Richtungsmessung und ihre Integration in aktuelle Positionierungsverfahren; Wichmann Verlag: Heidelberg, Germany, 2008; pp. 221–225. [Google Scholar]
  50. Kahmen, H. Angewandte Geodäsie: Vermessungskunde, 20th ed.; Walter de Gruyter: Berlin, Germany, 2006; pp. 459–460. [Google Scholar]
  51. Brunner, F.K. Geodetic Refraction: Effects of Electromagnetic Wave Propagation through the Atmosphere; Springer: Berlin, Germany, 1984; pp. 2–3. [Google Scholar]
  52. Brocks, K. Vertikaler Temperaturgradient und terrestrische Refraktion, insbesondere im Hochgebirge; Band III, Heft 4; Publications Meteorological Institute University of Berlin: Berlin, Germany, 1939. [Google Scholar]
  53. Geiger, R.; Aron, R.H.; Todhunter, P. The Climate near the Ground, 6th ed.; Rowman & Littlefield Publishers, Inc.: Oxford, UK, 2003. [Google Scholar]
  54. Hirt, C.; Guillaume, S.; Wisbar, A.; Bürki, B.; Sternberg, H. Monitoring of the refraction coefficient in the lower atmosphere using a controlled setup of simultaneous reciprocal vertical angle measurements. J. Geophys. Res. 2010, 115, D21102. [Google Scholar] [CrossRef] [Green Version]
  55. Hennes, M. Das Nivelliersystem-Feldprüfverfahren nach ISO 17123-2 im Kontext refraktiver Störeinflüsse. Allg. Vermess. 2006, 3, 85–94. [Google Scholar]
  56. Deutscher Wetterdienst. URL. Available online: https://www.dwd.de/DE/service/lexikon/lexikon_node.html (accessed on 20 February 2020).
  57. Beraldin, J.A.; Blais, F. Laser Scanning Technology. In Airborne and Terrestrial Laser Scanning; Vosselman, G., Maas, H.-G., Eds.; Whittles Publishing: Dunbeath, UK, 2010; pp. 14–15. [Google Scholar]
  58. Illwerke vkw, AG. Available online: https://www.illwerkevkw.at/kopssee.htm (accessed on 22 January 2020).
  59. Kerekes, G.; Schwieger, V. Determining Variance-covariance Matrices for Terrestrial Laser Scans: A Case Study of the Arch Dam Kops. In in Proceedings of the INGEO & SIG 2020, Dubrovnik, Croatia, 1–4 April 2020. Before print. [Google Scholar]
  60. GHM Messtechnik GmbH. Product specifications GTD 1100. 2020; Available online: https://www.greisinger.de/files/upload/de/produkte/kat/k19_095_DE_oP.pdf (accessed on 20 January 2020).
  61. Wujanz, D.; Burger, M.; Mettenleiter, M.; Neitzel, F. An intensity-based stochastic model for terrestrial laser scanners. ISPRS J. Photogramm. Remote Sens. 2017, 125, 146–155. [Google Scholar] [CrossRef]
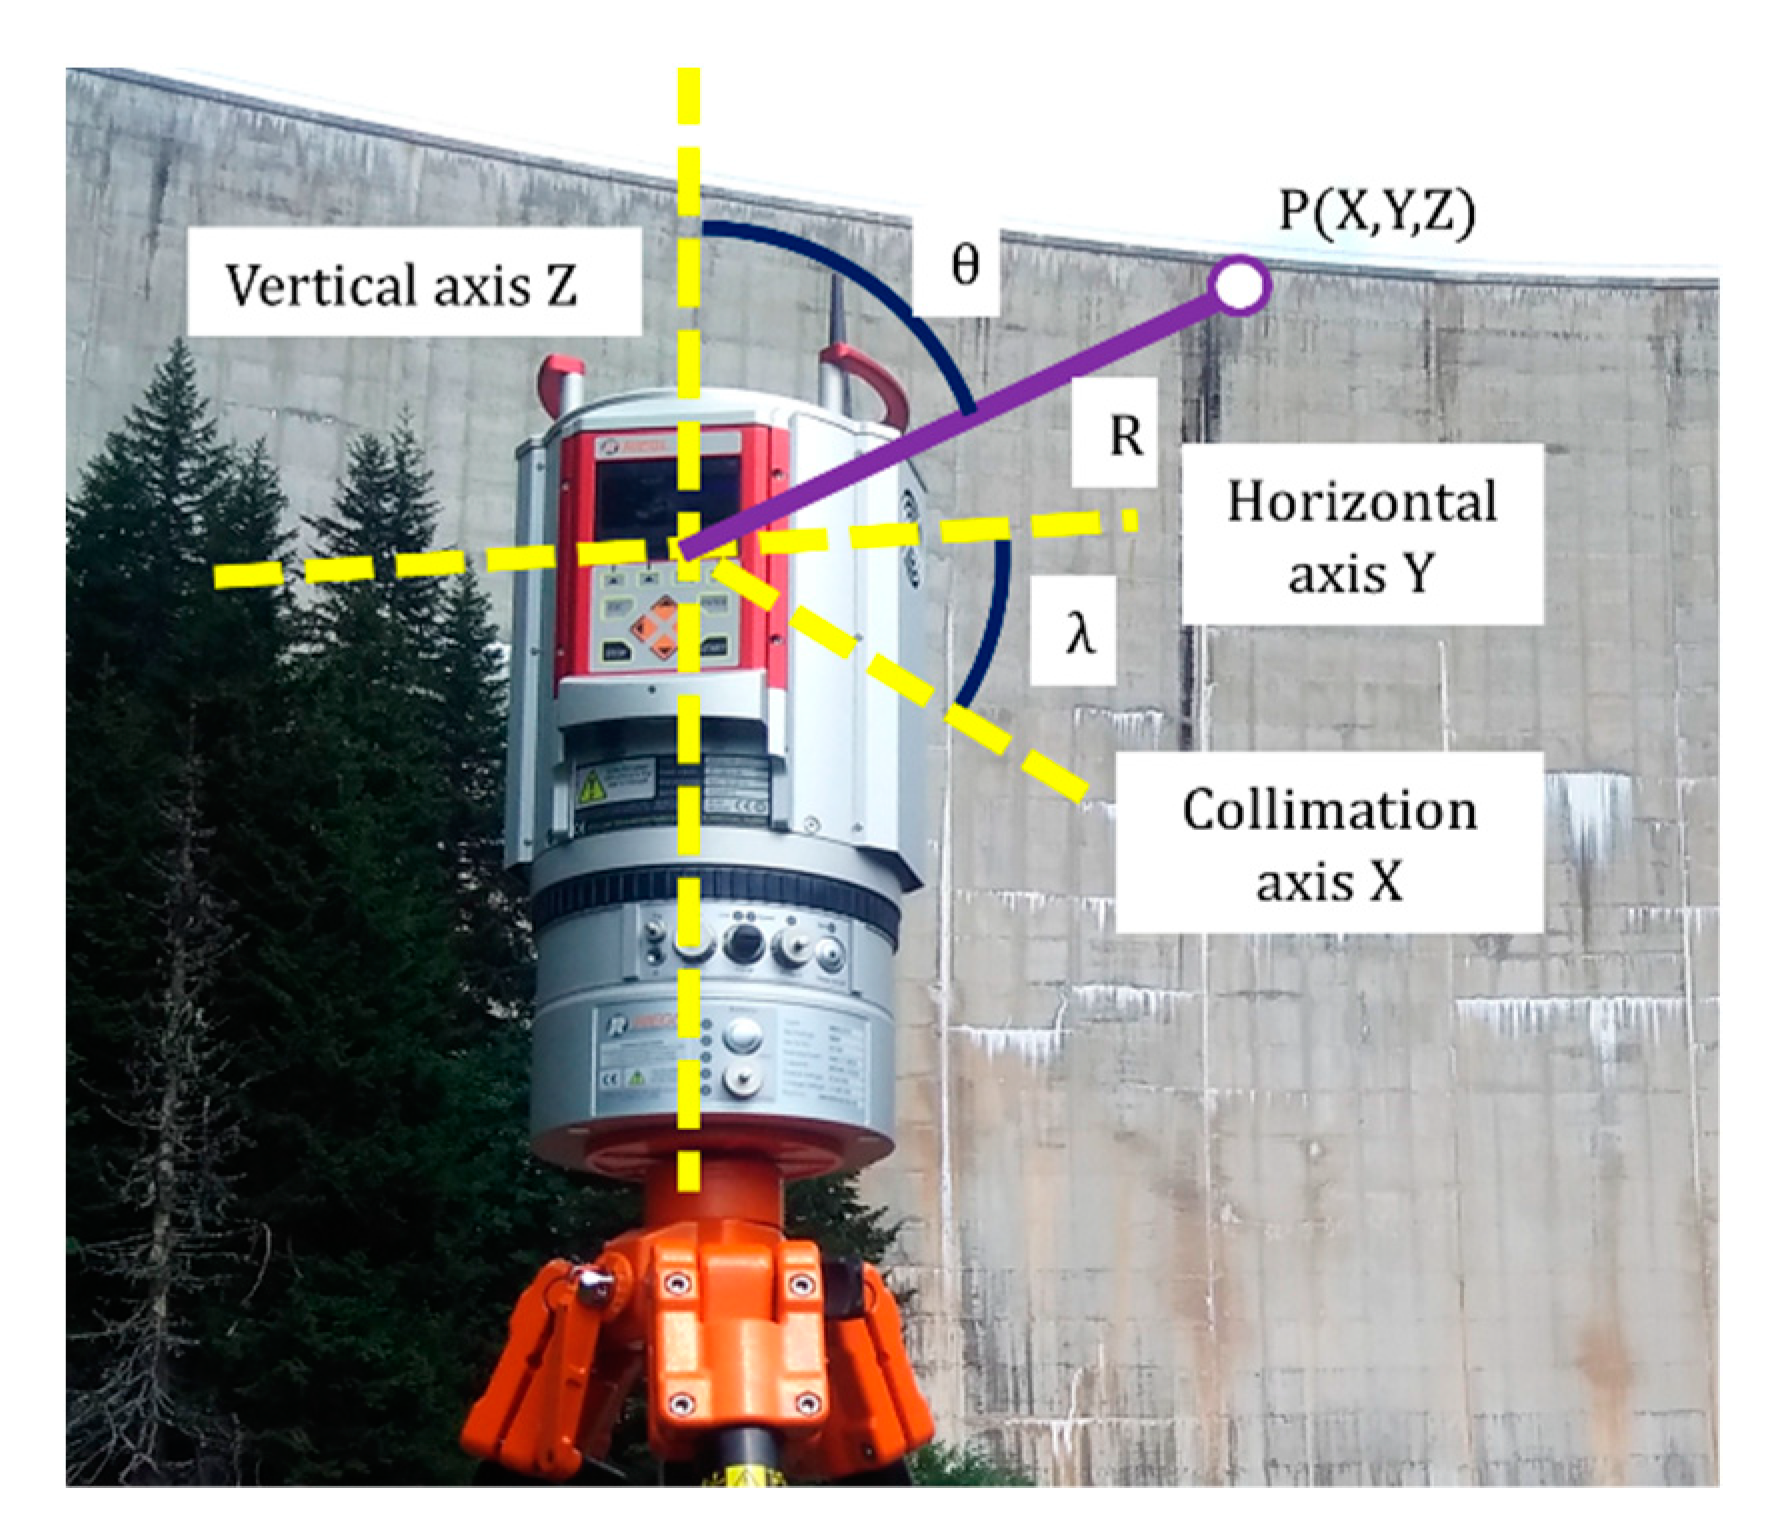
Figure 1. Example of Riegl Terrestrial Laser Scanner (TLS) and main axes.
Mathematics 08 00593 g001
Figure 2. The effects of atmospheric refraction (after [3]).
Mathematics 08 00593 g002
Figure 3. (Left) Spatial separation of vertical temperature gradient (VGT) layers; (right) one section of the spatial VGT model.
Mathematics 08 00593 g003
Figure 4. TLS station points and vertical section on digital terrain model (DTM) (Source for DTM: LiDAR Data obtained from Land Vorarlberg, Austria—data.vorarlberg.gv.at).
Mathematics 08 00593 g004
Figure 5. Vertical section through the terrain and temperature gradient fictive separation.
Mathematics 08 00593 g005
Figure 6. Example of error of position distribution on point clouds, selected vertical sections (red lines) and selected points (red circles). Scanning station points are (a) S1, (b) S2, (c) S3, (d) S4.
Mathematics 08 00593 g006aMathematics 08 00593 g006b
Figure 7. Left: spatial correlations, standard deviations (height)—complete synthetic VCM (a) S1, (b) S2, (c) S3, (d) S4; right: spatial correlations, standard deviations (height)—synthetic VCM with atmospheric elementary errors only (e) S1, (f) S2, (g) S3, (h) S4.
Mathematics 08 00593 g007
Figure 8. The contribution of variances for instrumental and atmospheric elementary errors in percent for (a) S1, (b) S2, (c) S3, (d) S4. For parameter names, see Section 3.2 and Section 3.4.
Mathematics 08 00593 g008
Table 1. Classification of instrumental errors and their dimensions.
Type of ErrorParameterStandard Deviation
Non-correlating errorsRange noise σ R = 5   m m
Angle noise (λ, θ) σ λ = 0.55   m g o n
σ θ = 1.66   m g o n
Functional correlating errors a 0 σ = 0.34   m m
a 1 σ = 40   p p m
b 4 σ = 3.18   m g o n
b 6 σ = 1.91   m g o n
c 0 σ = 1.08   m g o n
c 1 σ = 1.85   m g o n
c 4 σ = 0.64   m g o n
Table 2. Overview of scanning configurations and atmospheric conditions.
Station PointShortest Horizontal Distance from Scanner to DamMean Distance to DamWeather Conditions
S1180 [m]194 [m]t = 16 °C, p = 941 mbar
S288 [m]119 [m]t = 15 °C, p = 942 mbar
S3196 [m]203 [m]t = 23 °C, p = 832 mbar
S4456 [m]466 [m]t = 24 °C, p = 840 mbar
Table 3. Overview of variances and spatial correlation coefficients for atmospheric elementary errors.
Station PointTemperature Variance from Lowest to Highest Line ( σ t 1 σ t n )Temperature Variance from Lowest to Highest Line ( σ p 1 σ p n )Temperature Variance from Lowest to Highest Line ( σ g 1 σ g n )Correlation Coefficients
r t t r p p r g g r t p r t g r p g
S10.28 … 2.36 °C1.55 … 3.36 hPa0.25 … 0.17 K/m0.270.080.440.190.270.10
S20.17 … 1.13 °C1.53 … 3.44 hPa0.24 … 0.16 K/m0.280.230.330.490.180.36
S31.94 … 1.78 °C1.54 … 3.14 hPa0.25 … 0.17 K/m0.270.240.200.590.430.35
S41.88 … 1.61 °C4.01 … 4.78 hPa0.11 … 0.03 K/m0.480.800.310.310.630.47