Article

An Improved Structural Reliability Analysis Method Based on Local Approximation and Parallelization

1
School of Mechanical Engineering & Automation, Northeastern University, Shenyang 110819, China
2
Key Laboratory of Vibration and Control of Aero-Propulsion System Ministry of Education, Northeastern University, Shenyang 110819, China
*
Author to whom correspondence should be addressed.
Mathematics 2020, 8(2), 209; https://doi.org/10.3390/math8020209
Submission received: 13 January 2020 / Revised: 1 February 2020 / Accepted: 3 February 2020 / Published: 7 February 2020
(This article belongs to the Special Issue Surrogate Modeling and Related Methods in Science and Engineering)

Abstract

:
The Kriging-based reliability method with a sequential design of experiments (DoE) has been developed in recent years for implicit limit state functions. Such methods include the efficient global reliability analysis, the active learning reliability method combining Kriging and MCS Simulations. In this research, a novel local approximation method based on the most probable failure point (MPFP) is proposed to improve such methods. In this method, the MPFP calculated in the last iteration is the center of the next sampling region. The size of the local region depends on the reliability index obtained by the First Order Reliability Method (FORM) and the deviation distance of the standard deviation. The proposed algorithm, which approximates the limit state function accurately near MPFP rather than in the whole design space, can avoid selecting samples in regions that have negligible effects on the reliability analysis results. In addition, a multi-point enrichment technique is also introduced to select multiple sample points in each iteration. After the high-quality approximation of limit state function is obtained, the failure probability is calculated by the Monte Carlo method. Four numerical examples are used to validate the accuracy and efficiency of the proposed method. Results show that the proposed method is very effective for an accurate evaluation of the failure probability.

1. Introduction

There are numerous uncertainties [1] in the material properties, applied loads and geometrical characteristics of structures. The reliability analysis aims at considering the effects of these uncertainties and evaluating the failure probability of the structures. In order to carry out reliability analysis, various techniques have been presented in related literature. The Monte Carlo method (MCS) [2] is a well-known algorithm and is considered as the reference approach. However, for the time-consuming models, low failure probabilities or large-scale models, the MCS method needs a very large number of evaluations of limit state function. Due to the large computational cost, the MCS is infeasible. Some approximation methods [2] have also been developed, such as the First Order Reliability Method and the Second Reliability Method, which can deal with the failure surface of linear or second-order Taylor series approximation. Because they are based on the assumption that the limit state function is linear or quadratic, these methods may cause large errors when applied to engineer applications with a nonlinear limit state function.
In order to overcome these shortcomings, more advanced simulation methods have been developed. Examples of these methods are variance reduction strategies (subset simulation [3,4,5,6], line sampling [7] and importance sampling [8,9,10]). However, even if such techniques require much less numerical effort, computational costs are still prohibitively high. Several types of surrogate models have thus been proposed to replace the limit state functions in the reliability field, including quadratic response surfaces [11,12,13], neural networks [14], support vector machines [4,15] and Kriging [16,17,18,19,20].
Unlike other surrogate models, Kriging not only provides the predicted mean value of the structural response, but also a measure of local errors. Based on the feature of the Kriging model, the sequential Kriging reliability analysis (SKRA) method has been proposed. Such methods include the efficient global reliability analysis (EGRA) presented by Bichon et al. [21], the active learning reliability method combining Kriging and MCS (AK–MCS) developed by Echard et al. [22], the metamodel-based importance sampling for structural reliability analysis proposed by Dubourg et al. [10] and the Polynomial-Chaos–Kriging (PC–Kriging) proposed by Schöbi et al. [23]. Whether the limit state function is non-linear or multimodal, they can significantly improve the accuracy of the reliability evaluation and reduce the number of calls to the actual performance function.
More recently, some improved approaches have been developed to improve the existing sequential Kriging reliability analysis methods. Wen et al. [24] proposed an improved sequential Kriging reliability analysis method based on the EGRA. Sun et al. [25] proposed an adaptive reliability analysis method that used the least improvement function. Gaspar et al. [26] developed an adaptive surrogate model technique combining the Kriging and trust region method. Lelièvre et al. [27] presented an improved AK–MCS method named AK–MCSi. Xufang et al. [28] proposed a novel active learning function which is named expected improvement function (REIF).
In this paper, an improved EGRA algorithm is proposed to improve its accuracy and efficiency. It is well known that EGRA is a sequential reliability analysis algorithm. EGRA searches for sample points near the limit state function over the whole design space, and the point at which the expected improvement function (EFF) gets the maximum value is added into the DoE iteratively. In other regions, the high prediction accuracy is not required, because they are not critical. The results in the literature [21] show that EGRA has high precision and efficiency. However, the EGRA algorithm still has the following drawbacks. The first is that EGRA fits the limit state function accurately in the whole design region. In reliability analysis, only the local region near the most probable failure point (MPFP) is required to be more accurate. Therefore, it is not necessary to select samples in the region that has little influence on the failure probability. The second is that EGRA is a serial reliability analysis algorithm. This means that the new candidate sample point cannot be determined until the simulation of the current sampling point is completed in each iteration. That is, it only adds one sample point to update itself at a time. Therefore, EGRA cannot handle simultaneous multiple calculations.
To overcome the drawbacks presented previously in EGRA, a new local approximation strategy based on the most probable failure point (MPFP) is proposed to improve the performance of the sequential Kriging reliability analysis. Unlike EGRA, which selects samples in the whole design space, the proposed method carries out sequential sampling in a local region near the current MPFP and new candidate sample points are selected in this local region. Moreover, the center and size of the next local sampling regions are not fixed, which are determined by the MPFP calculated by the last iteration. By focusing the samples near the MPFP, only a few real function evaluations are needed, and a high-quality Kriging model can be obtained with a small number of true function evaluations. Since the proposed method samples in the local region, which has a great influence on the result of reliability analysis and the size of the sampling region is changing, it is more effective than EGRA.
Besides, a multipoint enrichment technique is also introduced for parallelizing sequential Kriging reliability method. This technique uses a clustering technique to provide multiple points per iteration. Although this method may require more samples, due to the use of parallel technologies, it is much more efficient and less iteration than EGRA.
The remainder of this paper is structured as follows. Section 2 briefly presents the theory of the Kriging surrogate model and the EGRA. Section 3 proposes a local approximation method and introduces a multipoint enrichment strategy. Section 4 presents the academic validation. Finally, Section 5 provides concluding remarks.

2. Reliability Analysis Using a Kriging Model

2.1. The Kriging Model

Kriging assumes that the response of interest F ( x ) consists of two parts: a linear regression model and a random function.
F ( x ) = h ( x ) T β + Z ( x )
where h ( x ) is the basis regression function, β is the coefficient vector of h ( x ) , Z ( x ) [21,22] follows a Gaussian process whose mean is zero and the covariance between Z ( x i ) and Z ( x j ) is defined as
Cov ( Z ( x i ) , Z ( x j ) ) = σ 2 R ( x i , x j , θ )
where σ 2 is the variance, R ( x i , x j , θ ) denotes the correlation function of Z ( x ) with parameter θ .
According to the Kriging theory, the predictions at point x are
G ^ ( x ) = F β ^ + r T R 1 ( G ( x ) F β ^ )
where F is the regression matrix, β ^ = ( F T R 1 F ) 1 F T R 1 G denotes the least square estimate of β , R is a correlation matrix, r is the correlation vector between an unknown point x and all the known points of the training design and G = [ G 1 G n ] T is a vector composed of observations of the initial sample point. The Kriging prediction variance can be calculated as
s 2 ( x ) = σ 2 [ F r T ] [ 0 F T F R ] [ F r ] T

2.2. Efficient Global Reliability Analysis Algorithm

The EGRA algorithm developed by Bichon et al. [21] is based on Gaussian process models. In EGRA, the limit state function is approximated by a small number of samples throughout the whole design space of random variables. Then, the failure probability is accurately estimated by using the inexpensive surrogate model. In the whole design space of random variables, the limit state function is approximated by a small number of samples. Then, the inexpensive surrogate model is used to estimate the failure probability accurately.
EGRA adds new training points to the initial sample data set iteratively by maximizing the expected feasibility function (EFF) to ensure that the model is accurate around the limit state function. The EFF can provide a measure that the true value of the response satisfies the equality constraint G ( x ) = z . By integrating in the region near the threshold, the EFF z = ± ε expectation can be calculated.
E F [ x ] = z ε z + ε [ ε | z G ( x ) ] f G ^ d x
where G is a realization of the distribution G ^ . This integral can be formulated as follows:
E F F [ x ] = ( μ G ^ ( x ) z ) [ 2 Φ ( z μ G ^ ( x ) σ G ^ ( x ) ) Φ ( ( z ε ) μ G ^ ( x ) σ G ^ ( x ) ) Φ ( ( z + ε ) μ G ^ ( x ) σ G ^ ( x ) ) ] σ G ^ ( x ) [ 2 ϕ ( z μ G ^ ( x ) σ G ^ ( x ) ) ϕ ( ( z ε ) μ G ^ ( x ) σ G ^ ( x ) ) ϕ ( ( z + ε ) μ G ^ ( x ) σ G ^ ( x ) ) ] + ε [ Φ ( ( z + ε ) μ G ^ ( x ) σ G ^ ( x ) ) Φ ( ( z ε ) μ G ^ ( x ) σ G ^ ( x ) ) ]
where ϕ ( ) is the standard normal density function, Φ ( ) is the cumulative distribution function, ε = 2 σ G ^ ( x ) and z = 0 . The new sample can be selected by maximizing the EFF.
x * = arg ( max ( E F F ( x ) ) )
By maximizing the EFF, EGRA adds new candidate points to the initial data set iteratively until the stopping criterion is met. The results of the literature [21] show that EGRA only needs a few samples to get accurate results.
However, EGRA updates itself by adding one sample point per iteration in the whole design region and cannot deal with multiple calculations at the same time.

3. The Proposed Local Approximation Method and Multipoint Enrichment Technique

In reliability analysis, the limit state constraint boundaries condition and local region near the most probable failure point (MPFP) are more critical than other regions. However, EGRA adds samples in the vicinity of the limit state function in the whole design space, which contains unnecessary regions. Therefore, it is more reasonable to add new samples in a small region around the MPFP on the limit state boundary.

3.1. The Local Approximation Region

3.1.1. Determine the Center of Locally Adaptive Sampling Region

It is well known that MPFP is very important in reliability analysis. It is located on the boundaries of limit state constraints and has the shortest distance to the current design point. In random variables space, MPFP is also the location point that has the greatest influence on the accuracy of failure probability calculation on the limit state surface. If MPFP is used as the center of the local sampling region, the newly added sampling points will be more distributed near the limit state surface and the MPFP. Moreover, if the sampling points are only selected in the local sampling regions, the number of iterations needed for EGRA can significantly reduce. Therefore, the MPFP obtained from the previous iteration by FORM algorithm is used as the center of the local sampling region of the next iteration in the proposed method.

3.1.2. Define the Size of Locally Adaptive Sampling Region

For reliability analysis problems, Bucher and Bourgund [11] proposed a response surface method based on the Bucher-star design and quadratic polynomials. The Bucher-star design is a star-shaped design scheme as shown in Figure 1. The points around the sampling center point are selected by deviating from a certain distance in the positive and negative directions of the coordinate axis of random variables. The deviation distance is generally f times the standard deviation of the basic random variables.
Δ i = f σ i
where Δ i is the deviation distance of random variables x i , σ i is the standard deviation of x i and f is a factor which is used to define the size of sampling region.
It is well known that β c is a very important index in reliability analysis, which represents the radius of hyper-sphere. Therefore, the local sampling region should not less than β c . According to Zhao et al. [29], the radius of hyper-sphere should be 1.2–1.5 times β c based on the nonlinearity of the limit state function.
Inspired by the Bucher-star design scheme, a new method for determining deviation distance is proposed in this paper. The Δ i a d j u s t is formulated as follows:
Δ i a d j u s t = max ( Δ i , c β c i )
where Δ i is the deviation distance of x i , β c , c denote reliability index and the scaling factor, separately. Then, in the proposed method, the size of the locally adaptive sampling region is defined as [ x i M P F P ± Δ i a d j u s t ] instead of the fixed truncated simulation region [ μ x ± 5 σ x ] as in the EGRA method.

3.2. Multipoint Enrichment Technique

EGRA is a sequential sampling algorithm. In each iteration, only one point is added to update itself, so parallel computing is not possible. However, compared to running a single simulation, it is meaningful to perform multiple simulations at once. Although parallelization requires more samples to achieve specific accuracy, the time can be saved by simulating the response of the samples at the same time.
To select multiple sample points in each iteration, the k-means clustering [30] technique is provided in this paper. The k-means clustering strategy is a partitioning method. It classifies a given data set into k clusters by minimizing the sum of the distances between the centroid and all member objects of the cluster. The objective function is defined by Equation (10):
min j = 1 k i = 1 n x i j c j
where x i j c j is the distance between a point x i j and the cluster center c j .
The algorithm is summarized as following:
  • Randomly initialize the k centroids c j ;
  • Divide each sample x i j into the cluster that has the closest centroid;
  • Calculate the centroid for each cluster c j again;
  • Repeat steps 2 and 3 until the centroids no longer change.
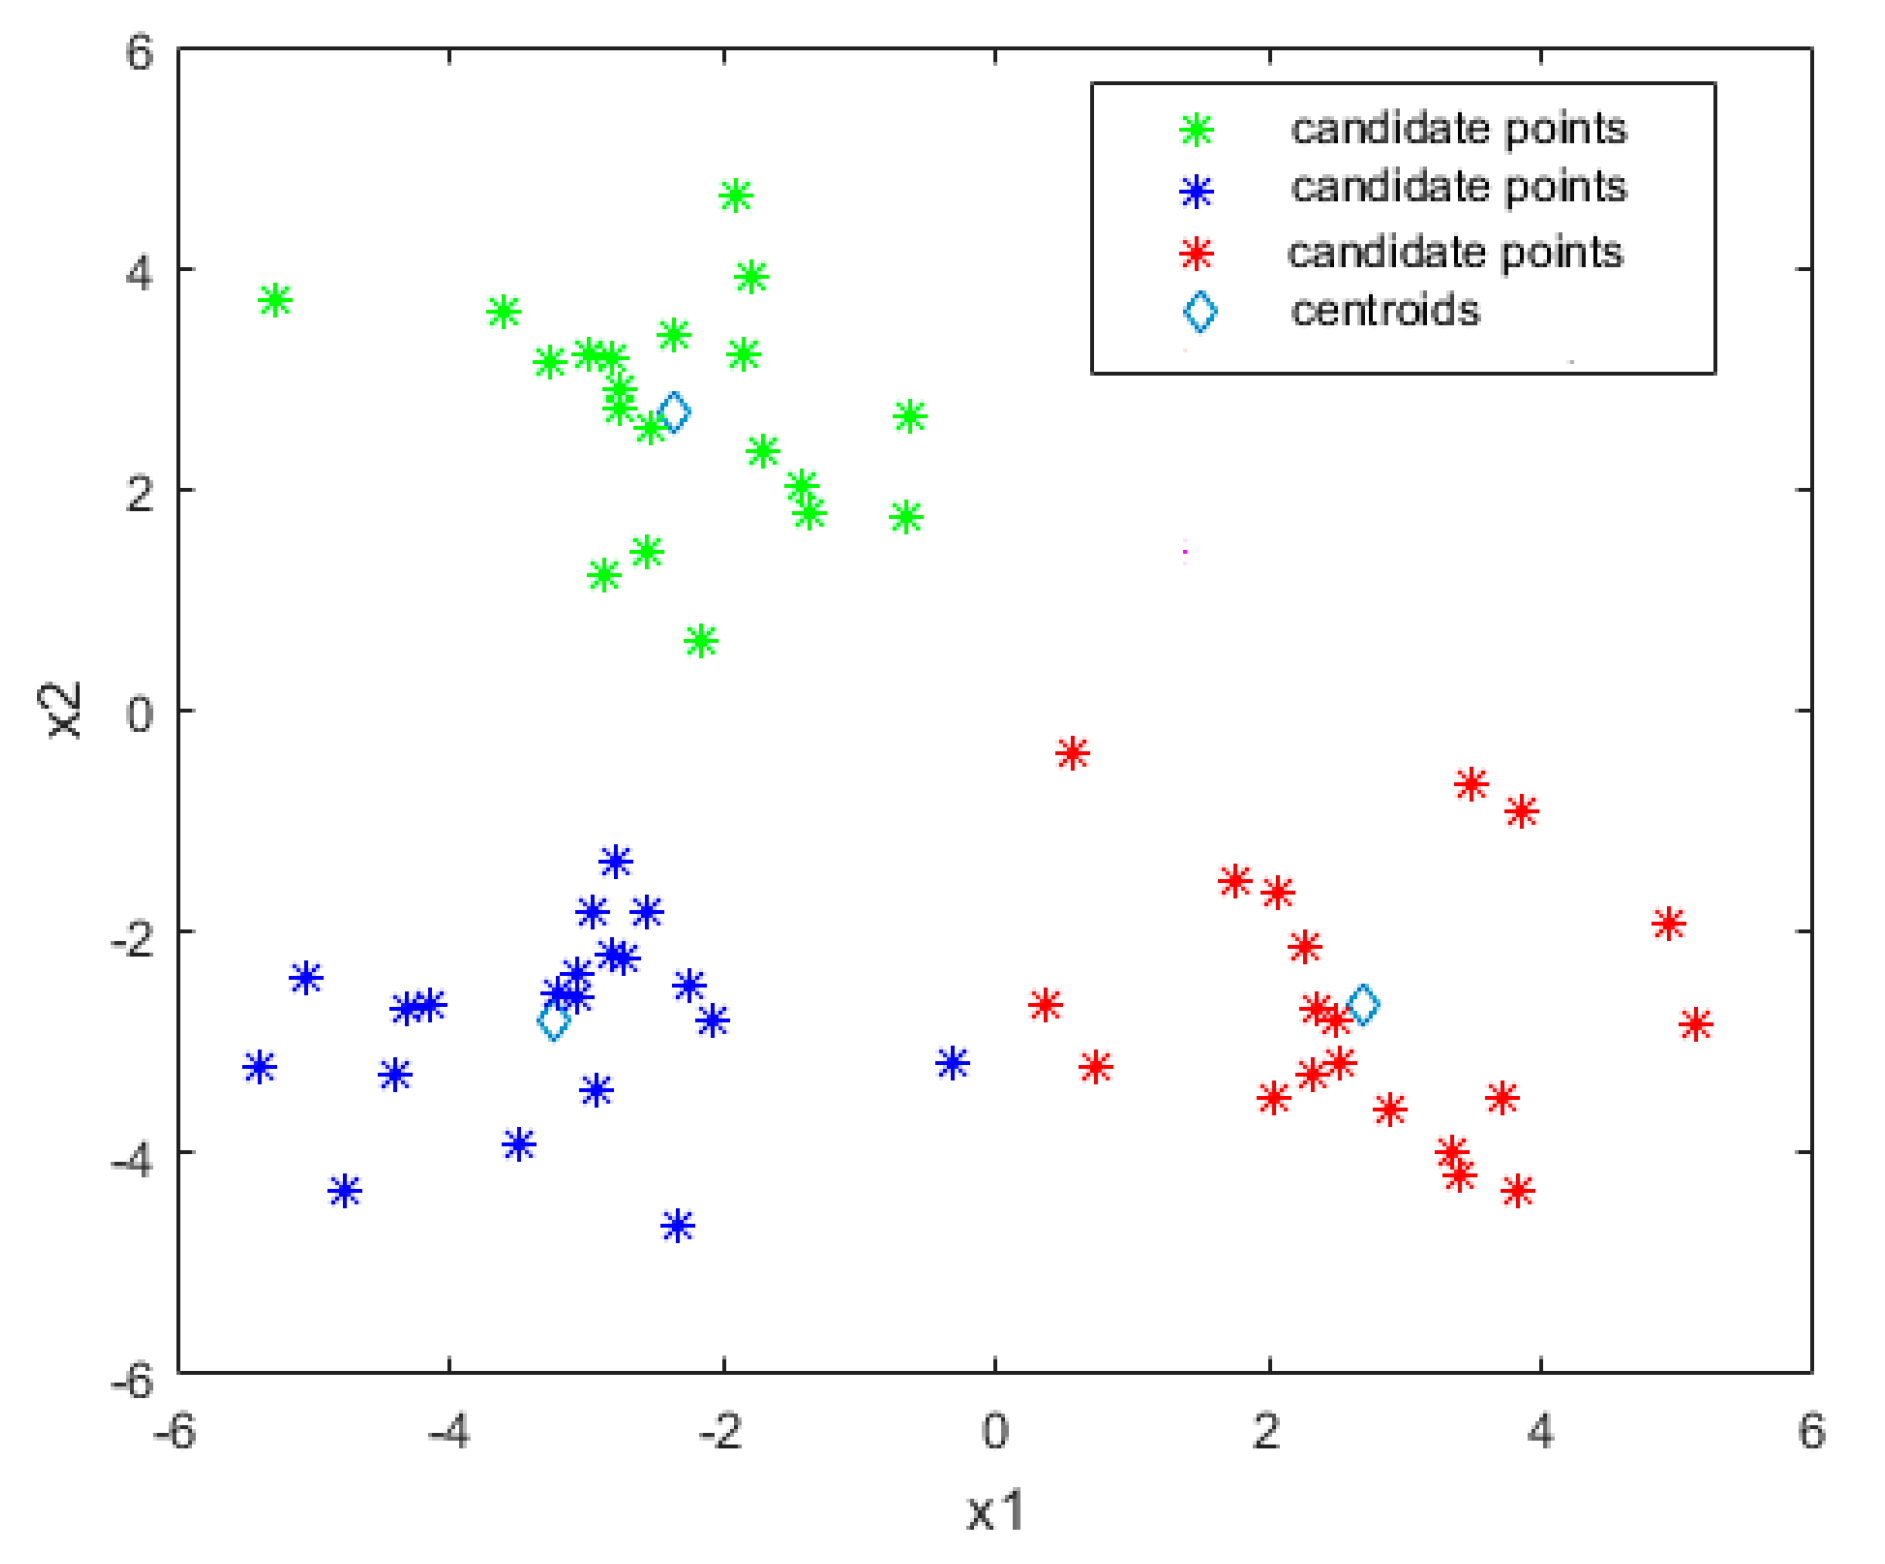
Figure 2 is an illustration of a two-dimensional example using the k-means clustering technique. With this algorithm, sample points are divided into three clusters.
Since the limit state constraint boundaries condition and local region near the most probable failure point (MPFP) are more critical than other regions for reliability analysis, in this paper, the points with the expected feasibility larger than a threshold value in the local sampling region can be considered as members of the points set to be clustered. Then, those points are divided into k groups, and for each group, the points which have the largest expected feasibility value are selected as the candidate sample points for the Kriging model. Therefore, k sample points can be selected simultaneously.

4. Academic Validation

In this section, four examples are used and compared with the results in the literature to prove the accuracy and efficiency of the proposed approach.

4.1. Example 1: Multimodal Function

This two-dimensional analytical example was already adopted in [21], which involves a quite complex limit state function. The limit state function is:
g ( x ) = ( x 1 2 + 4 ) ( x 2 1 ) 20 sin 5 x 1 2 2
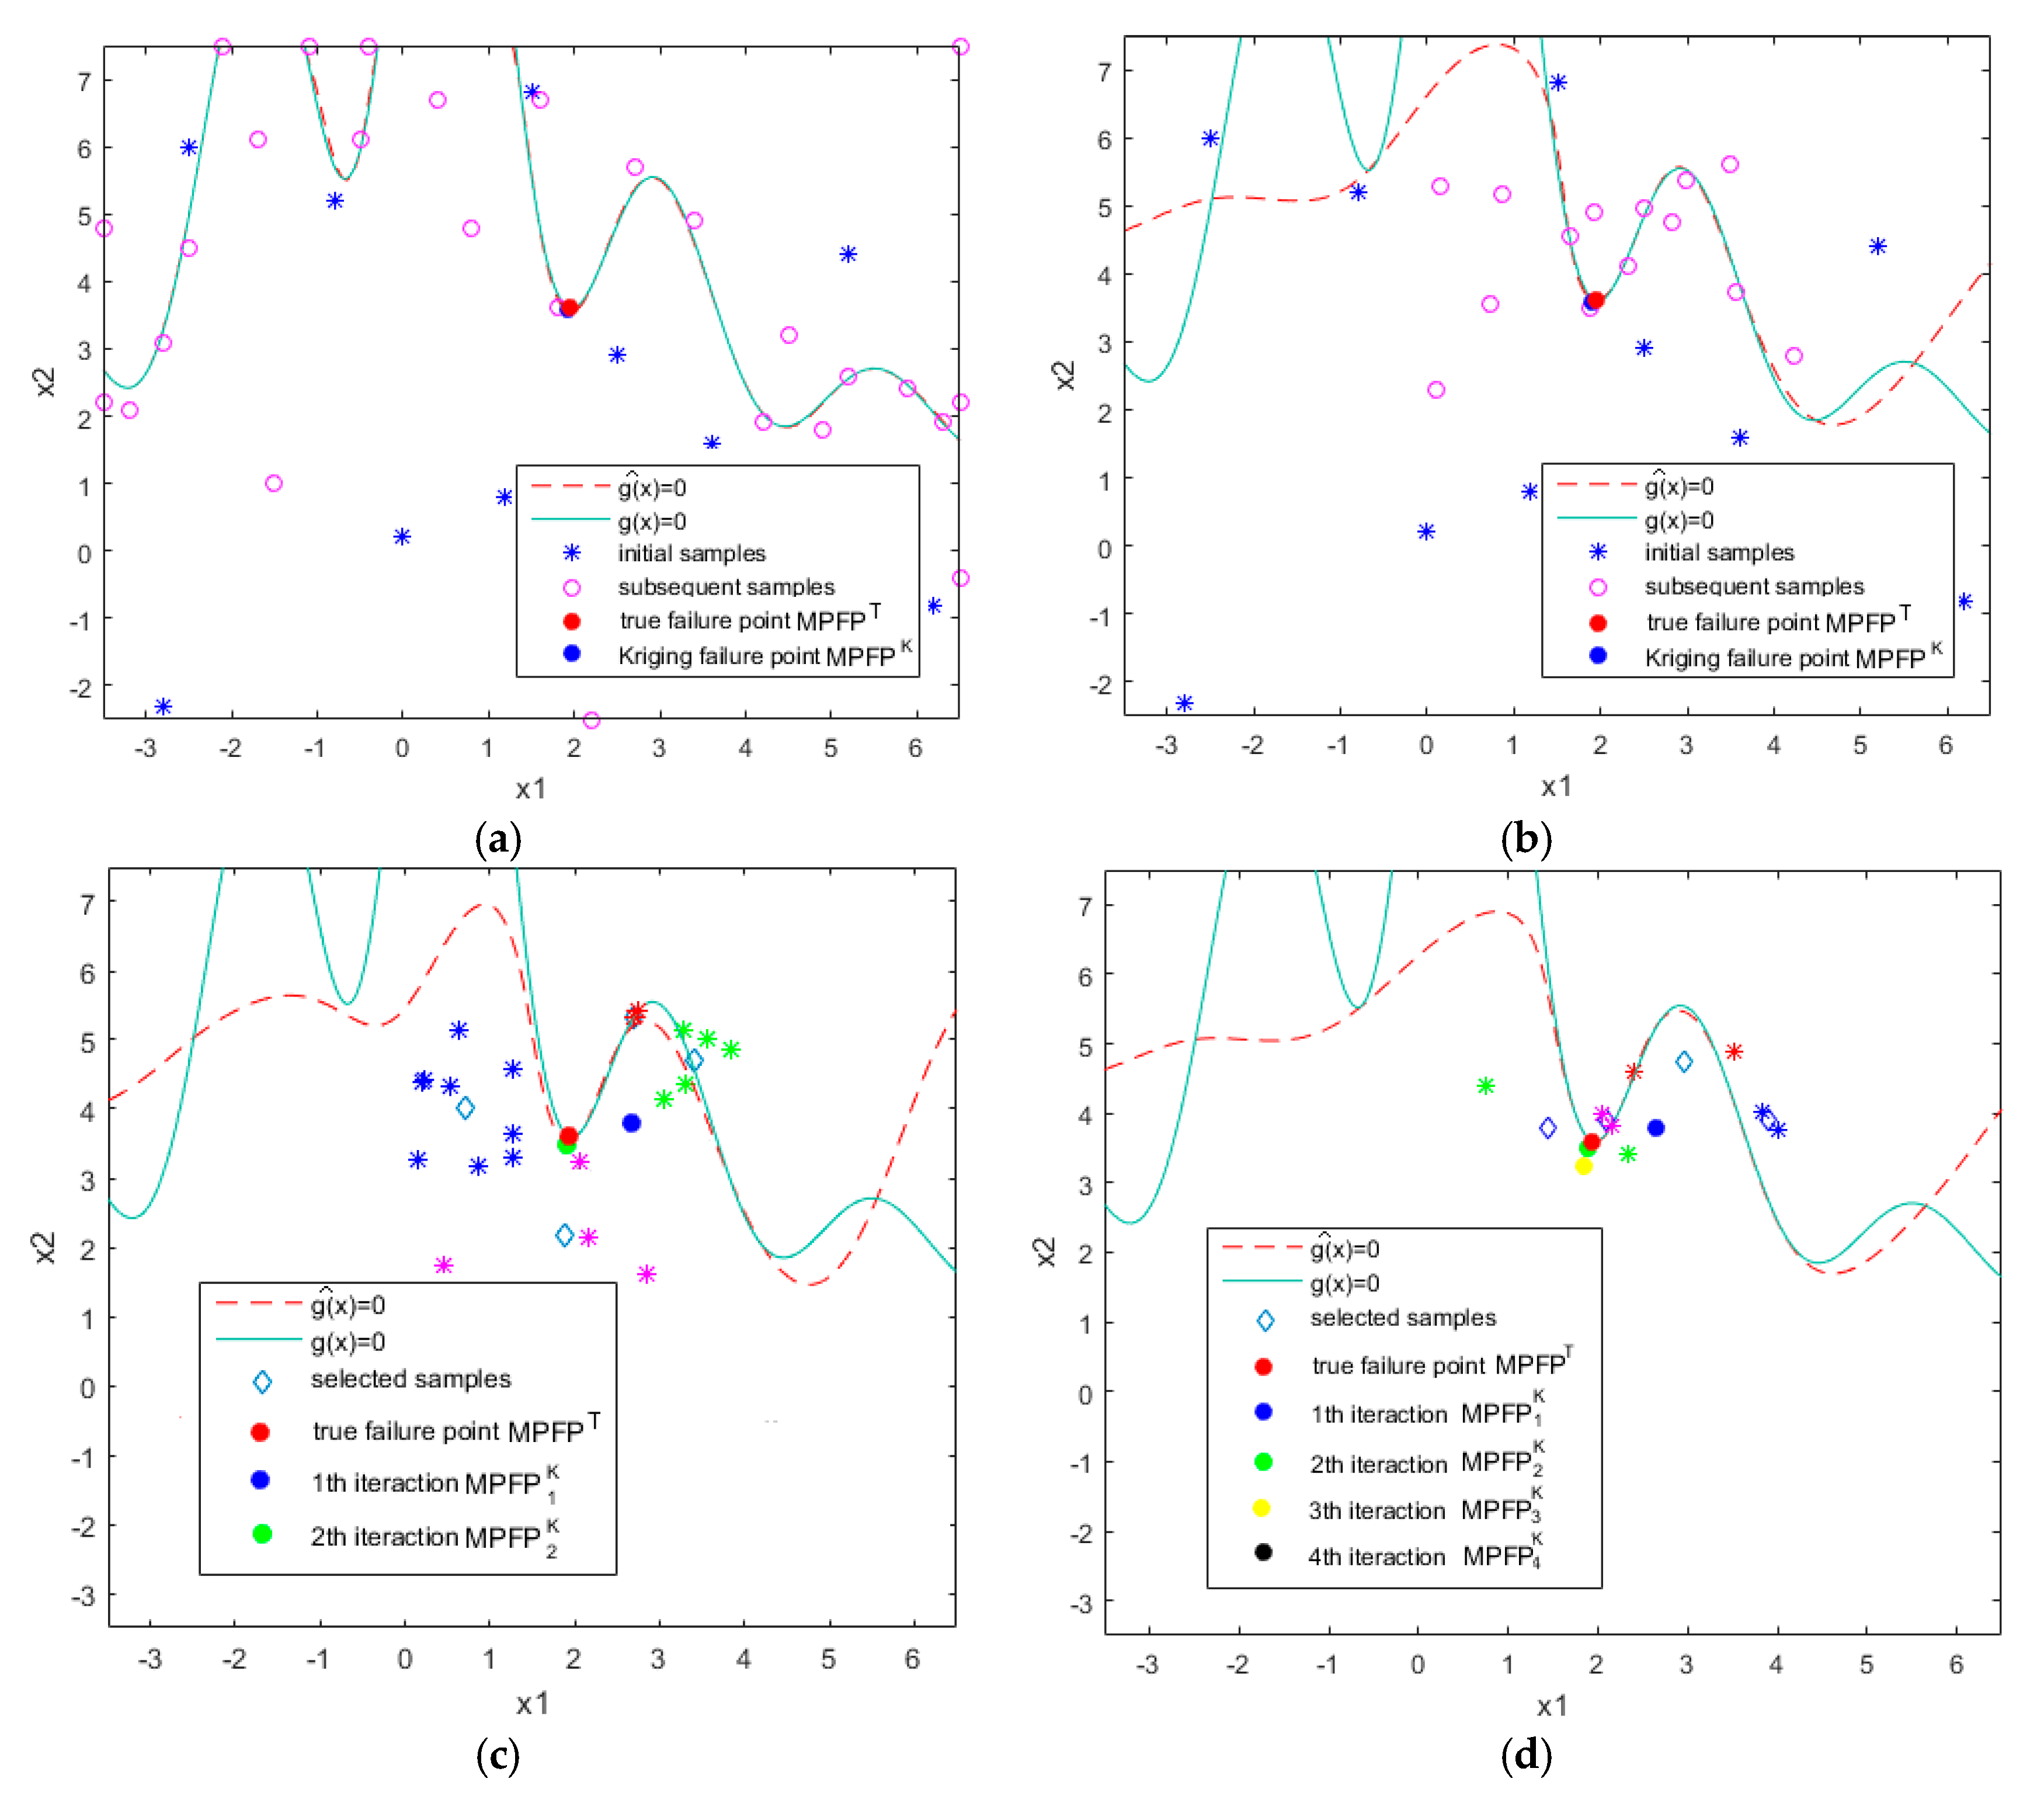
x 1 is subject to normal distribution ( μ = 1.5 ,   σ = 1 ) and x 2 is also subject to normal distribution ( μ = 2.5 , σ = 1 ) . Different methods are compared for this example. These methods use the same initial samples and the number of initial samples was 10. All the results for this example are shown in Table 1 and Figure 3a–d. The solid curves are the true values while the dotted curves are the predicted values by the Kriging model. “*” and “o” denote the locations of initial sample points and the locations of subsequent sample points separately. M P F P T is the true failure point marked in red, and M P F P K is the failure point obtained by Kriging marked with different colors. To compare the accuracy of different methods in reliability analysis, the result by MCS method with 10 6 calls of the performance function is considered as a reference.
From Figure 3a, we can see that the majority of the sample points in EGRA are near the limit state function and the accuracy of the whole design domain is very high. However, numerous samples of EGRA are located in the unnecessary region, which has little effect on the probability of failure. As mentioned above, only the local region near the MPFP is required to be more accurate for reliability analysis. In EGRA, there are only a few sampling points around the MPFP. In addition, it can be seen from Table 1 that EGRA requires at least 27 iterations to estimate the failure probability well. The efficiency of EGRA needs to be further improved.
Figure 3b shows the result of the local approximation method. Compared with EGRA, the sampling points of the proposed method are mainly near the most probable fault points (MPFP). Therefore, the accuracy of Kriging can be improved more quickly. This is also demonstrated by comparative results in Table 1. After only 13 iterations, the proposed method can provide similar accuracy. It is more efficient than EGRA.
In order to improve the efficiency of reliability analysis, the k-means clustering technique is also introduced, which is enabled to select multiple sample points in each iteration. In the proposed method, the locally adaptive sampling region is divided into several sub-regions by the k-means clustering strategy. In each sampling region, the clustered points with expected feasibility greater than 0.001 are selected. In this example, four clusters are used. Therefore, four points are selected simultaneously at a time.
The results of two iterations and four iterations of Example 1 are shown in Figure 3c,d, respectively. It can be noted that the divergence is still very large after two iterations. It is mainly caused by the sparsity of the sample in the initial iterations. However, with the increase of iterations, the Kriging prediction near the MPFP becomes quite accurate. Meanwhile, we also notice that the local sampling region tends to be smaller and the number of points to be clustered also reduced. After only four iterations, the prediction of the Kriging model is the same as the true value. The results show that the proposed approach can estimate the failure probability well with fewer iterations and is more efficient than EGRA.

4.2. Example 2: Cubic Function

This example, which was adopted in [21], is a highly nonlinear problem. The limit state function is:
g ( x ) = x 1 3 + x 2 3 18
where x i ( i = 1 , 2 ) are mutually independent normal basic random variables. They are summed up in Table 2.
The initial samples used by different methods are the same. For this example, four clusters are used and four candidate points are selected at the same time in each iteration. The results of Example 2 are summarized in Table 3 and shown in Figure 4a–d.
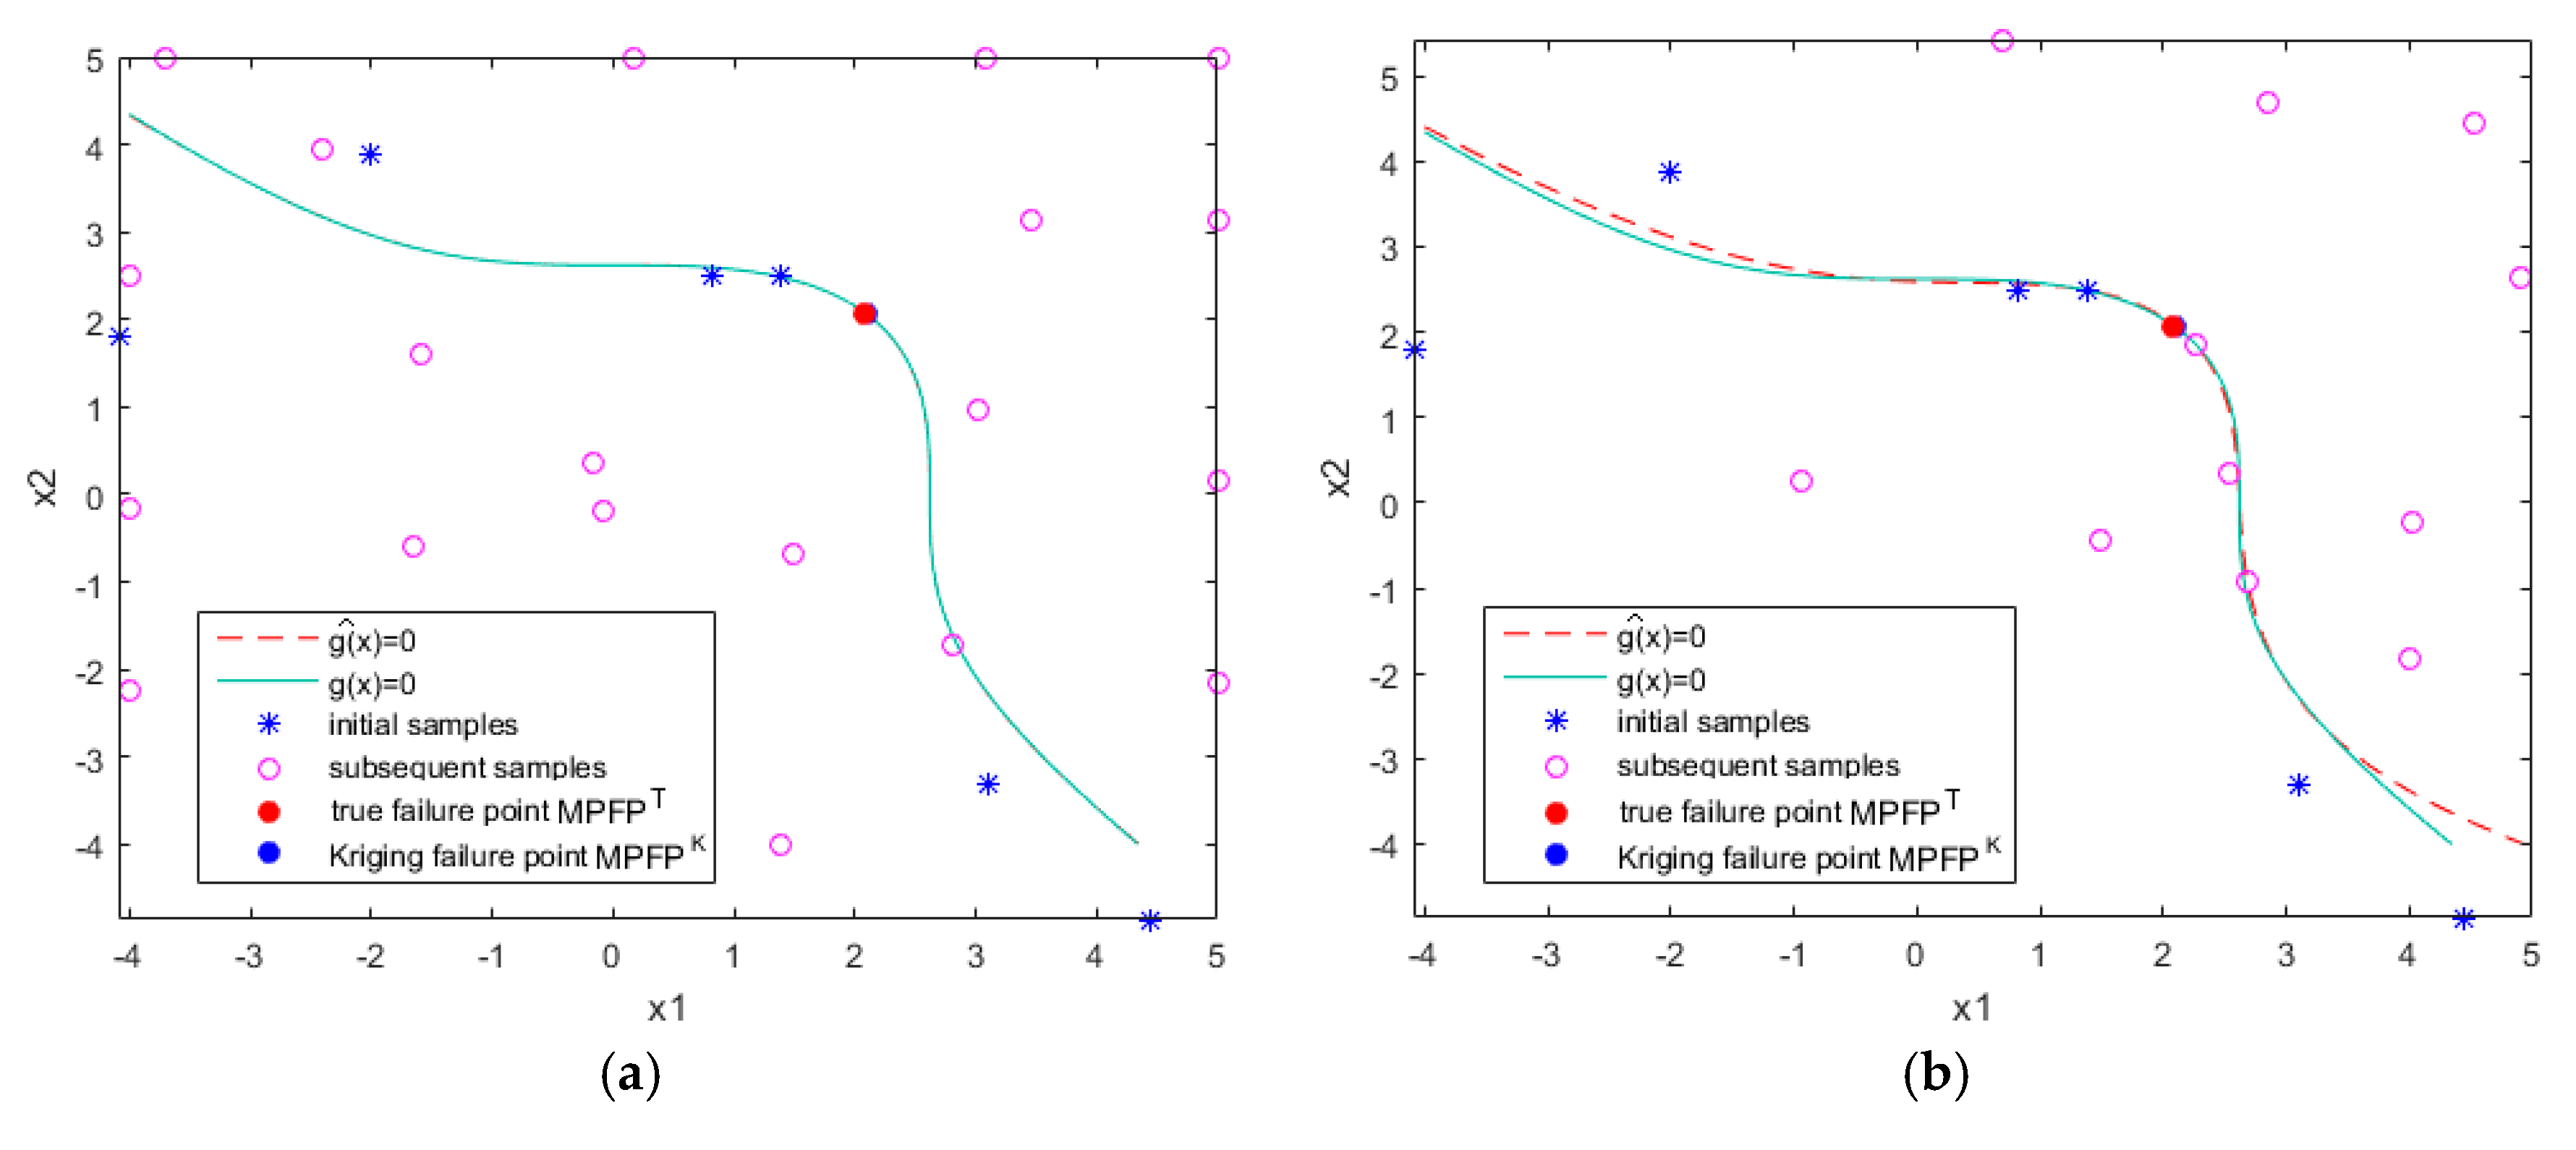
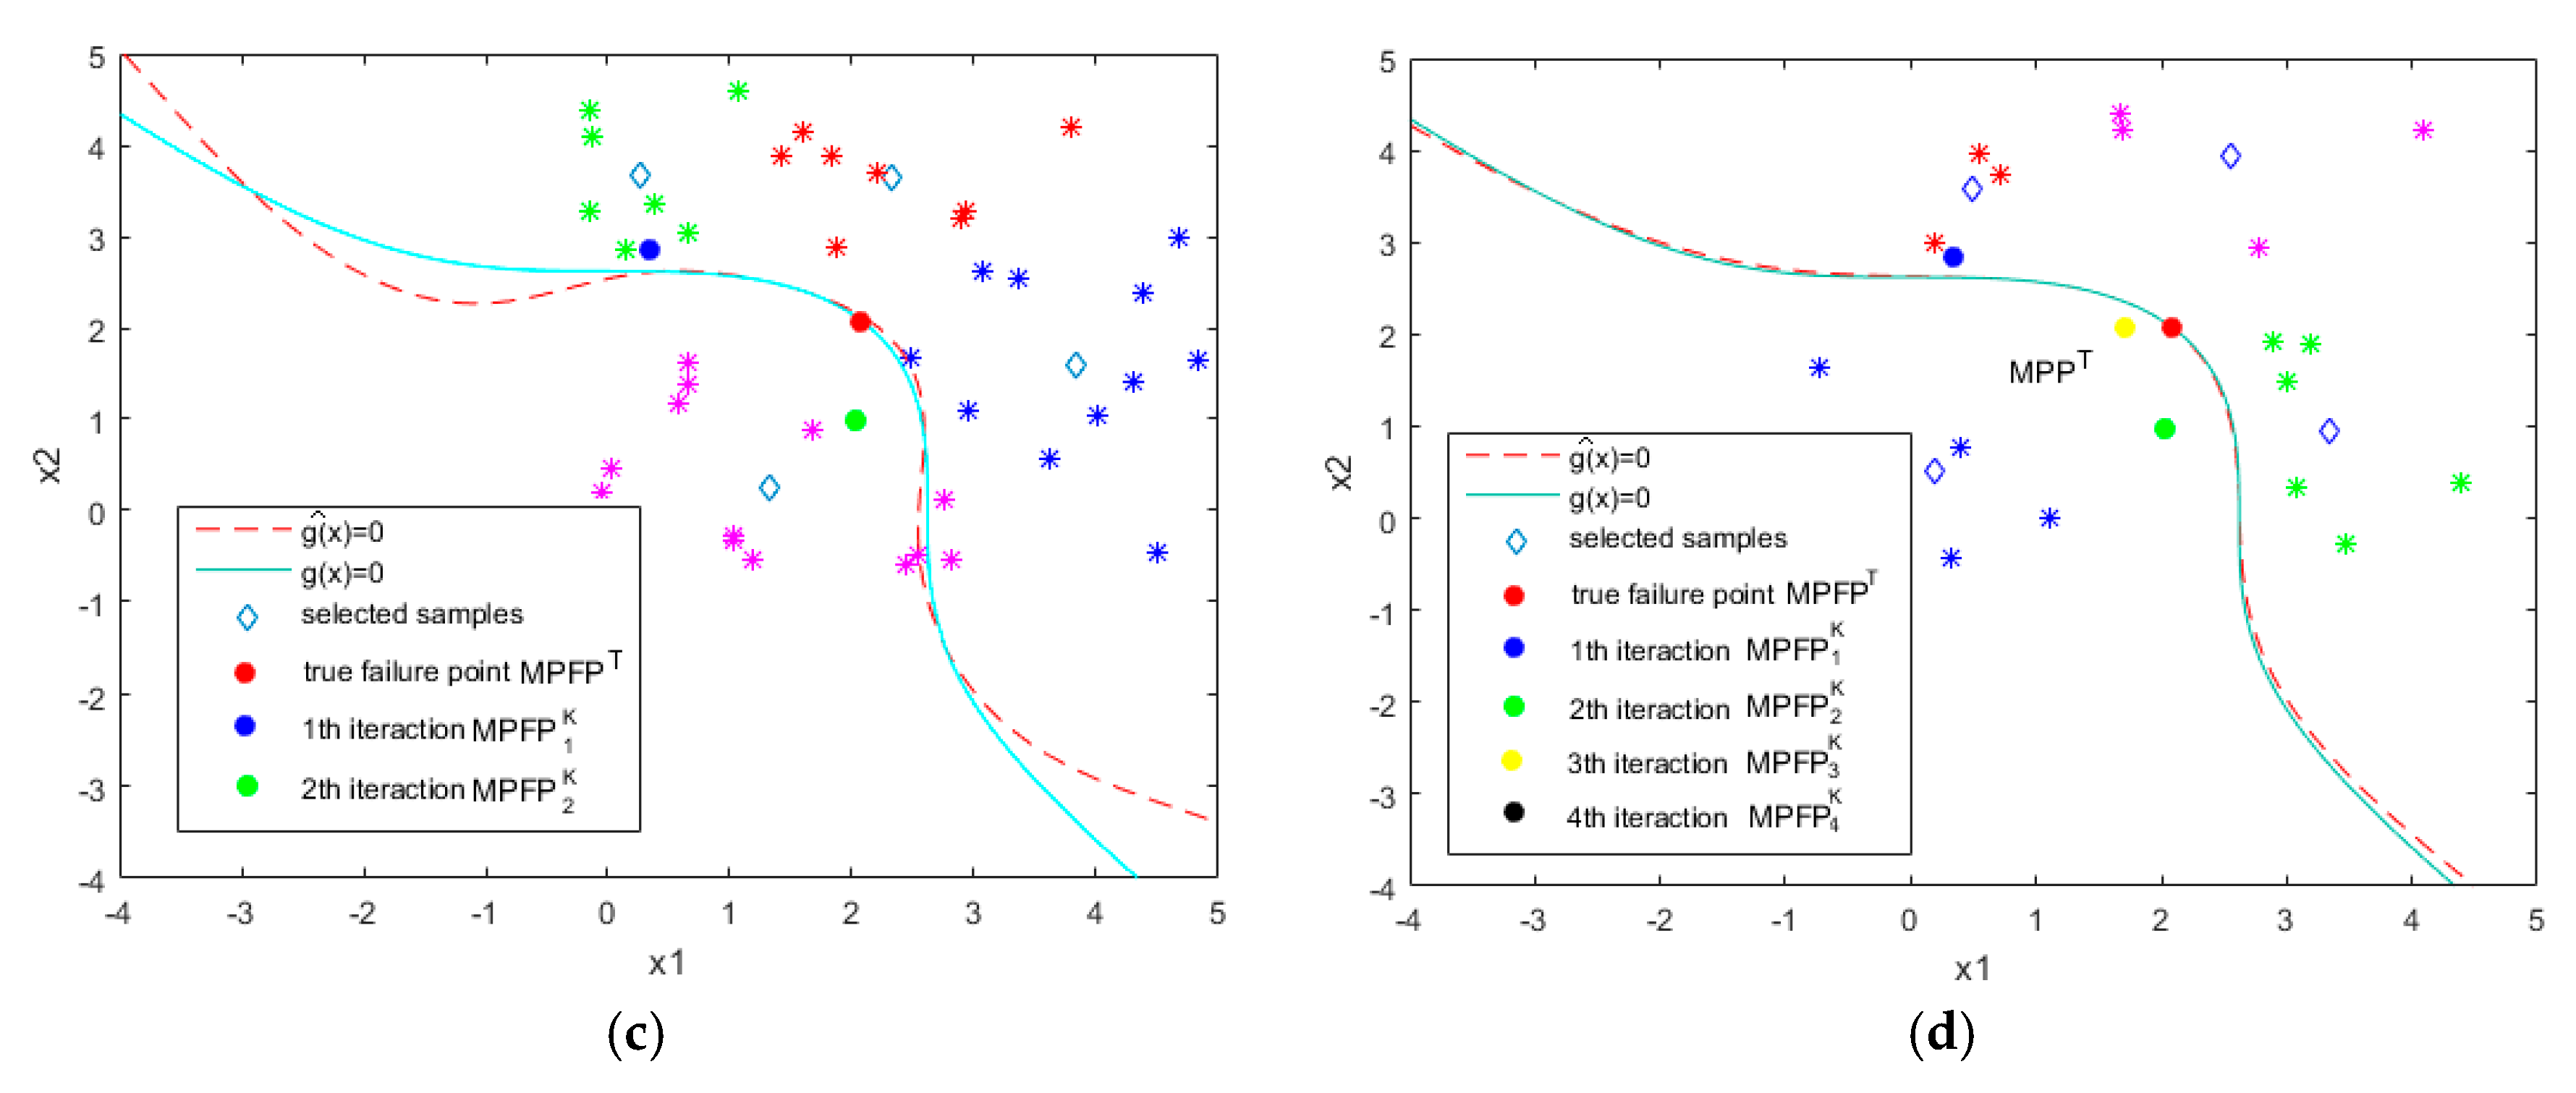
As seen in Figure 4a, the majority of the sample points are near the limit state function in EGRA. The limit state function is approximated accurately in the whole design space. However, it is not necessary to have high precision in the whole design space as the accuracy of local regions around the most probable failure point (MPFP) is more important for reliability analysis. Figure 4b shows the result of the local approximation method. It can be observed that the candidate points are mainly near the most probable failure point (MPFP). In addition, from Table 3, it can be seen that EGRA and the local approximation method provide similar accuracy, but the number of iterations in the local approximation method is much less.
Figure 4c,d are the results of the proposed method after two iterations and four iterations, respectively. From Figure 4c, we can see that the divergence is still very large after two iterations. However, the results of Figure 4d and Table 3 show that with the decrease of the local sampling region, the proposed method can estimate the failure probability well after only four iterations. This example certifies that the proposed method can provide accurate failure probability predictions for such problems with higher efficiency.

4.3. Example 3: Dynamic Response of a Nonlinear Oscillator

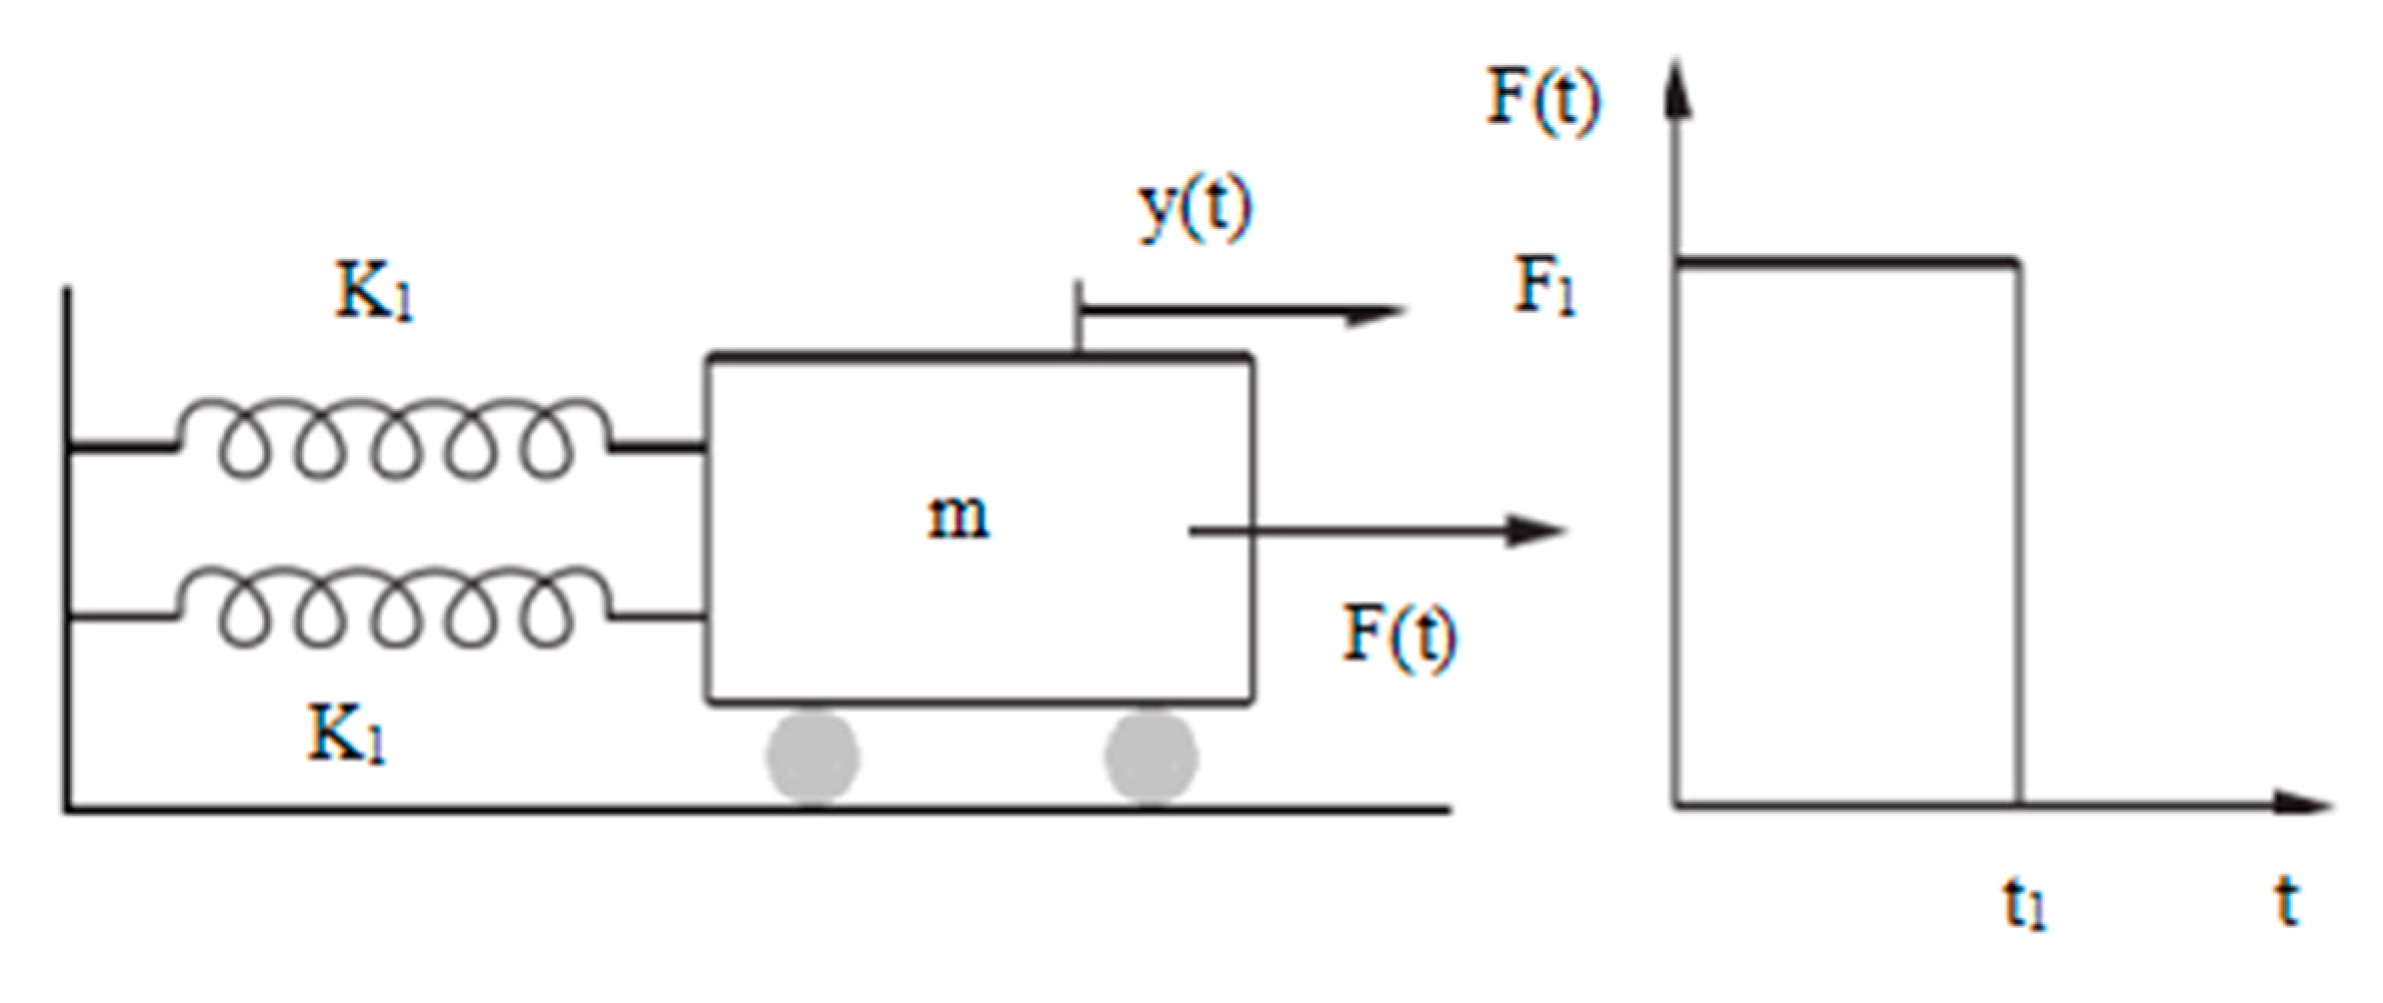
When comparing the efficiency and accuracy of one surrogate, it may be misleading to consider only the analytic function. Therefore, we also consider the following engineering problem presented in [22], which is a nonlinear undamped single-degree-of-freedom oscillation system, as shown in Figure 5. The limit state function is:
g ( x ) = 3 s | y max | = 3 s | 2 F 1 m ω 0 2 sin ( ω 0 2 t 1 2 ) |
where ω 0 = ( k 1 + k 2 ) / m . This example consists of six independent random variables, which are given in Table 4.
To investigate the performance of the proposed approach, all methods use the same initial samples and four clusters are used in each iteration. Table 5 presents the reliability analysis results.
As can be seen from Table 5, the proposed method can greatly reduce the average N i t e r a t i o n for this problem. The reason is that the proposed method does not give the global approximation of the limit state function like the EGRA, but mainly approximate the performance function in the vicinity of the MPFP. Although the EGRA method provides better prediction accuracy, the difference is not significant.
From Table 5, we can also note that the k-means clustering technology requires more calls to performance functions than using only local approximation technology. But with the help of parallel computing technology, the proposed method needs fewer iterations and is more efficient.

4.4. Example 4: A Planar Truss Structure

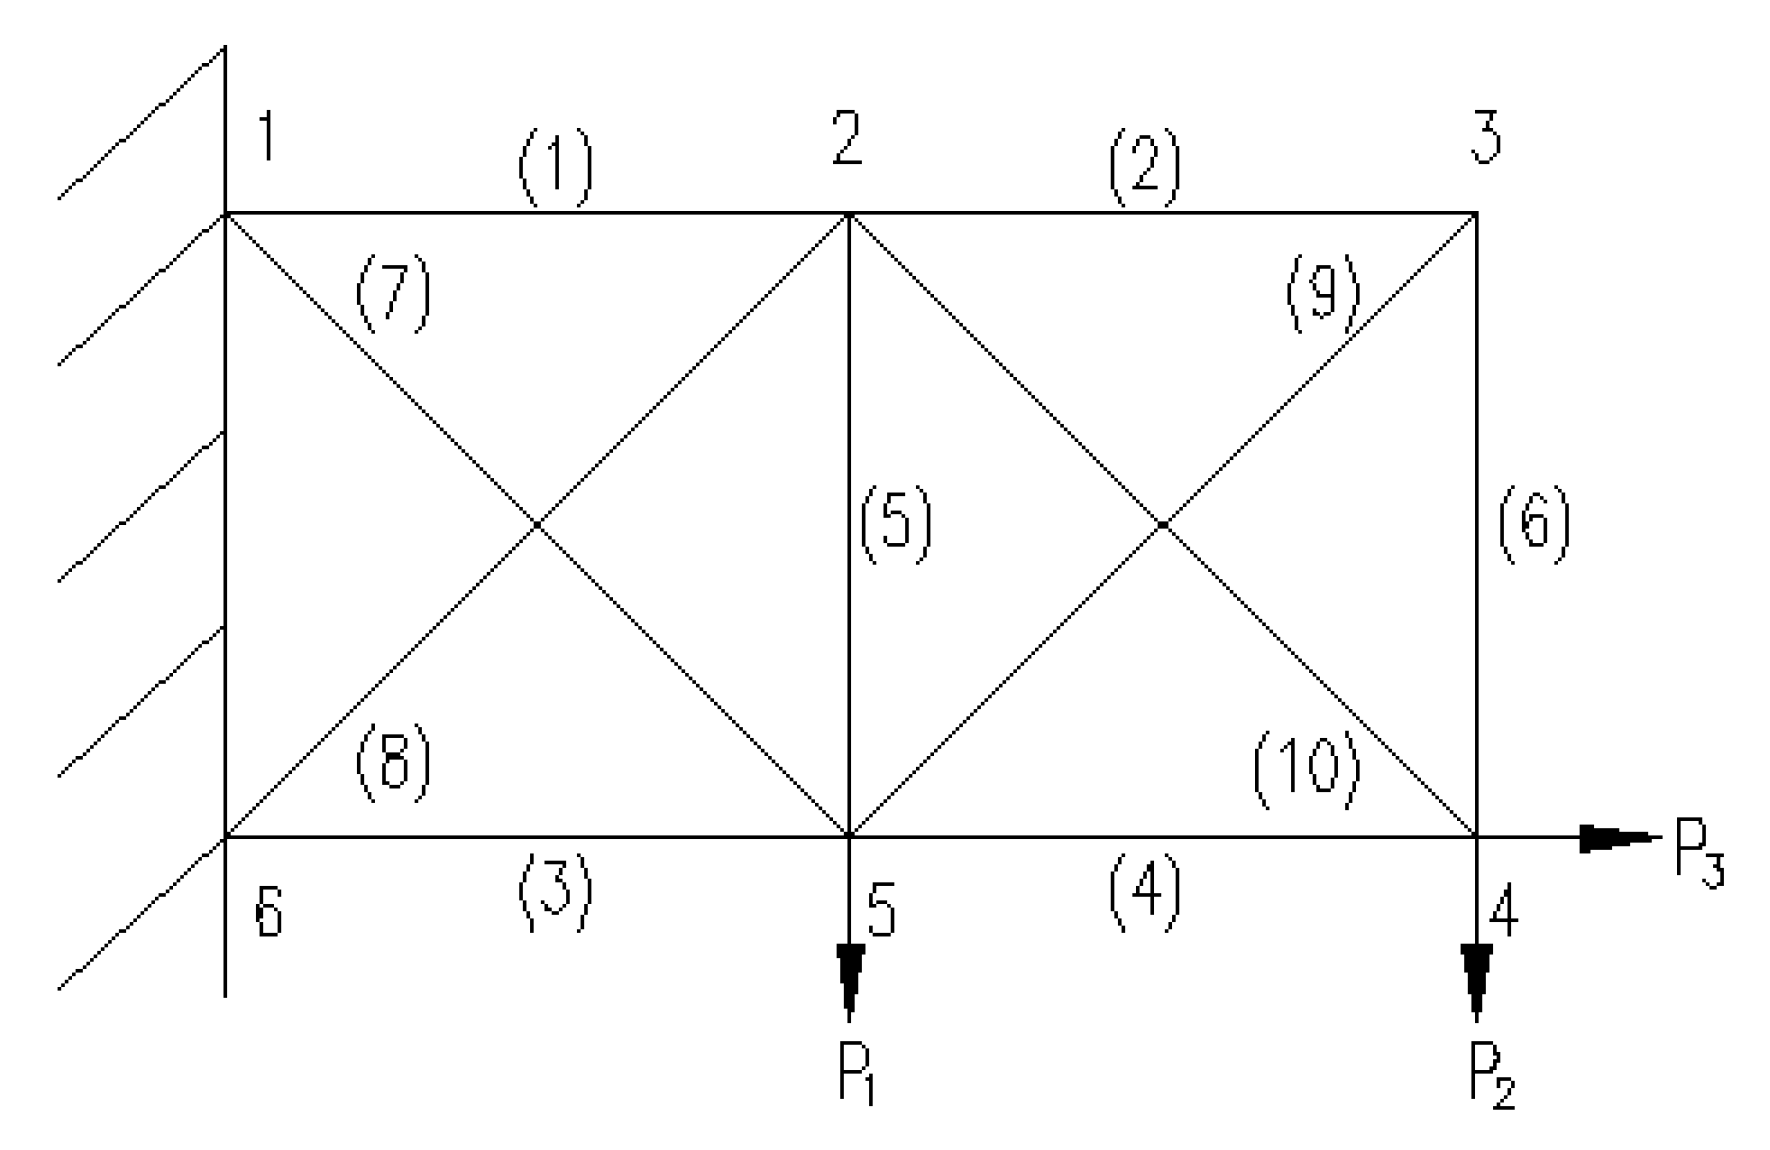
In order to further illustrate the engineering applicability of the proposed method, a plane truss structure [31] is introduced. The structure contains 10 bars as shown in Figure 6. Random variables of the structure include the cross-sectional area of each bar A i ( i = 1 , , 10 ) , the extern loads P i ( i = 1 , 2 , 3 ) , the lengths of all horizontal and vertical bars L and the elastic modulus E. These fifteen random variables are independent and the distribution information is summed up in Table 6.
Taking the displacement of Node 4 in the vertical direction not more than 0.004 m as the constraint condition, the limit state function is defined as
g = 0.004 Δ y
where Δ y is the displacement of Node 4 in the vertical direction and is determined by the finite element method.
To investigate performance of the proposed approach, 10 clusters are used in each iteration. The reliability results are summarized in Table 7.
As can be observed in Table 7, the results of the EGRA and the proposed methods are both efficient in assessing the failure probability well. However, we also note the EGRA method does not converge within 82 iterations. In contrast, the proposed local approximation method requires only 46 iterations to estimate the failure probability well. Moreover, by introducing the k-mean clustering algorithm, the method proposed in this paper needs only 11 iterations to obtain a convergent solution, which confirms its effectiveness.
In addition, this example also indicates that the method presented in this paper is a powerful reliability method for engineering problems involving complex computer simulation.

5. Conclusions

In this paper, a local approximation method and a multipoint enrichment technique are proposed. The aim is to improve the accuracy and efficiency of EGRA. Compared with the existing EGRA method, the proposed method selects samples in a local region rather than in the whole design space. EGRA contains unnecessary sampling regions, which have little influence on the result of reliability calculation. It is well known that the accuracy of limit state function in the vicinity of MPFP is more critical than other regions in reliability analysis. Only the limit state function in such a region is accurately approximated can the analysis efficiency be improved significantly. Therefore, in the proposed method, MPFP is used as a sampling center in the local sampling regions, and the size of the local sampling regions is adapted according to the maximum of the standard deviation of the basic random variables and reliability index calculated by the last iteration. By confining the sampling regions to the local regions, the number of iterations is significantly reduced. In addition, to select multiple samples for enrichment in each iteration, a clustering technique is also introduced. By this way, only a few iterations are needed to get the desired results.
The proposed approach is evaluated by four examples. The numerical results show that the proposed method is able to deal with highly nonlinear limit state functions and has high accuracy and efficiency, even though the total number of calls to performance function is usually greater than EGRA. Since calls to performance function could be parallelized, the number of iterations seems to be a more appropriate measure. Thus, the proposed method is a promising approach for reliability computation.
However, it should be noted that the proposed algorithm, as other methods in the literature, is greatly influenced by the initial samples and relevant parameters. In future work, we will explore a more effective local initial sampling method and reasonably define the parameters of the method according to some prior knowledge.

Author Contributions

B.L. proposed the algorithm and drafted the manuscript. L.X. reviewed the manuscript and gave some suggestions. All authors have read and agreed to the published version of the manuscript.

Funding

This work was funded by the Natural Science Foundation of China “Research on reliability theory and method of total fatigue life for large complex mechanical structures” (Grant No. U1708255).

Conflicts of Interest

The authors declare that they have no conflicts of interest.

References

  1. Der Kiureghian, A.; Ditlevsen, O. Aleatory or epistemic Does it matter. Struct. Saf. 2009, 31, 105–112. [Google Scholar] [CrossRef]
  2. Bjerager, P. Probability integration by directional simulation. J. Eng. Mech. ASCE 1988, 114, 1285–1302. [Google Scholar] [CrossRef]
  3. Au, S.-K.; Beck, J.L. Estimation of small failure probabilities in high dimensions by subset simulation. Probab. Eng. Mech. 2001, 16, 263–277. [Google Scholar] [CrossRef] [Green Version]
  4. Bourinet, J.-M.; Deheeger, F.; Lemaire, M. Assessing small failure probabilities by combined subset simulation and Support Vector Machines. Struct. Saf. 2011, 33, 343–353. [Google Scholar] [CrossRef]
  5. Tong, C.; Sun, Z.; Zhao, Q. A hybrid algorithm for reliability analysis combining Kriging and subset simulation importance sampling. J. Mech. Sci. Technol. 2015, 29, 3183–3193. [Google Scholar] [CrossRef]
  6. Walter, C. Moving particles: A parallel optimal multilevel splitting method with application in quantiles estimation and meta-model based algorithms. Struct. Saf. 2015, 55, 10–25. [Google Scholar] [CrossRef] [Green Version]
  7. Morio, J.; Balesdent, M.; Jacquemart, D. A survey of rare event simulation methods for static inputoutput models. Simul. Model. Pract. Theory 2014, 49, 287–304. [Google Scholar] [CrossRef] [Green Version]
  8. Echard, B.; Gayton, N.; Lemaire, M. A combined importance sampling and Kriging reliability method for small failure probabilities with time-demandingnumerical models. Reliab. Eng. Syst. Saf. 2013, 111, 232–240. [Google Scholar] [CrossRef]
  9. Balesdent, M.; Morio, J.; Marzat, J. Kriging-based adaptive importance sampling algorithms for rare event estimation. Struct. Saf. 2013, 44, 1–10. [Google Scholar] [CrossRef]
  10. Dubourg, V.; Sudret, B.; Deheeger, F. Metamodel-based importance sampling for structural reliability analysis. Probab. Eng. Mech. 2013, 33, 47–57. [Google Scholar] [CrossRef] [Green Version]
  11. Bucher, C.; Bourgund, U. A fast and efficient response surface approach for structural reliability problems. Struct. Saf. 1990, 7, 57–66. [Google Scholar] [CrossRef]
  12. Das, P.K.; Zheng, Y. Cumulative formation of response surface and its use in reliability analysis. Probab. Eng. Mech. 2000, 15, 309–315. [Google Scholar] [CrossRef]
  13. Kim, S.H.; Na, S.W. Response surface method using vector projected sampling points. Struct. Saf. 1997, 19, 3–19. [Google Scholar] [CrossRef]
  14. Papadrakakis, M.; Lagaros, N. Reliability-based structural optimization using neural networks and Monte Carlo simulation. Comput. Methods Appl. Mech. Eng. 2001, 191, 3491–3507. [Google Scholar] [CrossRef]
  15. Zhou, C.C.; Lu, Z.C.; Yuan, X.K. Use of relevance vector machine in structural reliability analysis. J. Aircr. 2013, 50, 1726–1733. [Google Scholar] [CrossRef]
  16. Kaymaz, I. Application of Kriging methods to structural reliability problems. Struct. Saf. 2005, 27, 133–151. [Google Scholar] [CrossRef]
  17. Wang, P.; Lu, Z.Z.; Tang, Z.C. An application of the Kriging method in global sensitivity analysis with parameter uncertainty. Appl. Math. Model. 2013, 37, 6543–6555. [Google Scholar] [CrossRef]
  18. Sakata, S.; Ashida, F.; Zako, M. Structural optimization using Kriging approximation. Comput. Methods Appl. Mech. Eng. 2003, 192, 923–939. [Google Scholar] [CrossRef]
  19. Gaspar, B.; Teixeira, A.P.; Soares, C.G. Assessment of the efficiency of Kriging surrogate models for structural reliability analysis. Probab. Eng. Mech. 2014, 37, 24–34. [Google Scholar] [CrossRef]
  20. Shi, X. Kriging response surface reliability analysis of a ship-stiffened plate with initial imperfections. Struct. Infrastruct. Eng. 2015, 11, 1450–1465. [Google Scholar] [CrossRef]
  21. Bichon, B.J. Efficient Global Reliability Analysis for Nonlinear Implicit Performance Functions. AIAA J. 2008, 46, 2459–2468. [Google Scholar] [CrossRef]
  22. Echard, B.; Gayton, N.; Lemaire, M. AK-MCS: An active learning reliability method combining Kriging and Monte Carlo Simulation. Struct. Saf. 2011, 33, 145–154. [Google Scholar] [CrossRef]
  23. Schöbi, R.; Sudret, B.; Marelli, S. Rare event estimation using polynomial-Chaos Kriging. ASCE-ASME J. Risk Uncertain. Eng. Syst. Part A 2017, 3, 2376–7642. [Google Scholar] [CrossRef] [Green Version]
  24. Wen, Z.; Pei, H.; Liu, H.; Yue, Z. A sequential Kriging reliability analysis method with characteristics of adaptive sampling regions and parallelizability. Reliab. Eng. Syst. Saf. 2016, 153, 170–179. [Google Scholar] [CrossRef]
  25. Sun, Z.; Wang, J.; Li, R.; Tong, C. LIF: A new Kriging based learning function and its application to structural reliability analysis. Reliab. Eng. Syst. Saf. 2017, 157, 152–165. [Google Scholar] [CrossRef]
  26. Gaspar, B.; Teixeira, A.P.; Soares, C.G. Adaptive surrogate model with active refinement combining Kriging and a trust region method. Reliab. Eng. Syst. Saf. 2017, 165, 277–291. [Google Scholar] [CrossRef] [Green Version]
  27. Nicolas, L.; Pierre, B.; Cécile, M.; Nicolas, G. AK-MCSi: AKriging-based method to deal with small failure probabilities and time-consumingmodels. Struct. Saf. 2018, 73, 1–11. [Google Scholar]
  28. Zhang, X.; Wang, L.; Sørensen, J.D. A novel active-learning function toward adaptive Kriging surrogate models for structural reliability analysis. Reliab. Eng. Syst. Saf. 2019, 185, 440–454. [Google Scholar] [CrossRef]
  29. Zhao, L.; Choi, K.; Lee, I.; Du, L. Response surface method using sequential sampling for reliability-based design optimization. Am. Soc. Mech. Eng. Digit. Collect. 2009. [Google Scholar] [CrossRef] [Green Version]
  30. MacQueen, J. Some methods for classifification and analysis of multivariate observations. In Proceedings of the Fifth Berkeley Symposium on Mathematical Statistics and Probability, Volume 1: Statistics; University of California Press: Berkeley, CA, USA, 1967; pp. 281–297. [Google Scholar]
  31. Li, L.Y.; Lu, Z.Z.; Feng, J.; Wang, B.T. Moment-independent importance measure of basic variable and its state dependent parameter solution. Struct. Saf. 2012, 38, 40–47. [Google Scholar] [CrossRef]
Figure 1. Bucher-star Design.
Mathematics 08 00209 g001
Figure 2. A 2D example of the k-means clustering technique.
Mathematics 08 00209 g002
Figure 3. (a) The efficient global reliability analysis (EGRA) sampling method; (b) the local approximation method; (c) result of local approximation and clustering in Iteration 2; (d) result of local approximation and clustering in Iteration 4.
Mathematics 08 00209 g003
Figure 4. (a) The EGRA sampling method; (b) the local approximation method; (c) result of local approximation and clustering in Iteration 2; (d) result of local approximation and clustering in Iteration 4.
Mathematics 08 00209 g004aMathematics 08 00209 g004b
Figure 5. The nonlinear oscillator.
Mathematics 08 00209 g005
Figure 6. Diagram of Example 4.
Mathematics 08 00209 g006
Table 1. Results of the reliability analysis of Example 1.
Method N c a l l N i t e r a t i o n P f Δ P f   ( % )
MCS 10 6 3.133 × 10 2
EGRA [21]3727 3.132 × 10 2 0.32
Local approximation method2313 3.136 × 10 2 0.96
Local approximation method (k-means)264 3.131 × 10 2 0.64
N c a l l denotes the number of calls to the performance function; N i t e r a t i o n denotes the number of iterations; P f denotes the failure probability and Δ P f denotes the relative error compared with MCS method.
Table 2. Distribution information of the random variables of Example 2.
Random VariablesMeanStandard DeviationDistribution
x 1 10.05Normal
x 2 9.95.05Normal
Table 3. Results of the reliability analysis of Example 2.
Method N c a l l N i t e r a t i o n P f Δ P f   ( % )
MCS 10 6 5.728 × 10 3
EGRA [21]2822 5.694 × 10 3 0.59
Local approximation method1913 5.634 × 10 3 1.64
Local approximation method (k-means)224 5.657 × 10 3 1.24
Table 4. Distribution parameters of the random variables of Example 3.
Random VariablesMeanStandard DeviationDistribution
m 10.05Normal
k 1 10.1Normal
k 2 0.10.01Normal
s 0.50.05Normal
F 1 10.2Normal
t 1 10.2Normal
Table 5. Results of the reliability analysis of Example 3.
Method N c a l l N i t e r a t i o n P f Δ P f   ( % )
MCS 7 x 10 4 2.834 × 10 2
EGRA7345 2.861 × 10 2 0.95
local approximation method5628 2.886 × 10 2 1.83
local approximation method (k-means)608 2.873 × 10 2 1.4
Table 6. Distribution information of the random variables of the truss structure.
Random VariablesMeanStandard DeviationDistribution
L 10.05Normal
E 1005Normal
A i 0.0010.0001Normal
P 1 804Normal
P 2 100.5Normal
P 3 100.5Normal
Table 7. Results of the reliability analysis of Example 4.
Method N c a l l N i t e r a t i o n P f Δ P f   ( % )
MCS 10 6 6.77 × 10 2
EGRA11282 6.811 × 10 2 0.61
Local approximation method7646 6.702 × 10 2 1.0
Local approximation method (k-means)14011 6.681 × 10 2 1.3