Article

Wavelet Transform-Statistical Time Features-Based Methodology for Epileptic Seizure Prediction Using Electrocardiogram Signals

by
Andrea V. Perez-Sanchez
1,
Carlos A. Perez-Ramirez
2,
Martin Valtierra-Rodriguez
1,
Aurelio Dominguez-Gonzalez
1 and
Juan P. Amezquita-Sanchez
1,*
1
ENAP-Research Group, CA-Sistemas Dinámicos, Facultad de Ingeniería, Universidad Autónoma de Querétaro (UAQ), Campus San Juan del Río, Río Moctezuma 249, Col. San Cayetano, San Juan del Río 76807, Mexico
2
ENAP-Research Group, Facultad de Ingeniería, Universidad Autónoma de Querétaro (UAQ), Campus Aeropuerto, Carretera a Chichimequillas S/N, Ejido Bolaños, Santiago de Querétaro 76140, Mexico
*
Author to whom correspondence should be addressed.
Mathematics 2020, 8(12), 2125; https://doi.org/10.3390/math8122125
Submission received: 30 October 2020 / Revised: 21 November 2020 / Accepted: 25 November 2020 / Published: 27 November 2020
(This article belongs to the Special Issue Applied Medical Statistics: Theory, Computation, Applicability)

Abstract

:
Epilepsy is a brain disorder that affects about 50 million persons around the world and is characterized by generating recurrent seizures, which can put patients in permanent because of falls, drowning, burns, and prolonged seizures that they can suffer. Hence, it is of vital importance to propose a methodology with the capability of predicting a seizure with several minutes before the onset, allowing that the patients take their precautions against injuries. In this regard, a methodology based on the wavelet packet transform (WPT), statistical time features (STFs), and a decision tree classifier (DTC) for predicting an epileptic seizure using electrocardiogram (ECG) signals is presented. Seventeen STFs were analyzed to measure changes in the properties of ECG signals and find characteristics capable of differentiating between healthy and 15 min prior to seizure signals. The effectiveness of the proposed methodology for predicting an epileptic event is demonstrated using a database of seven patients with 10 epileptic seizures, which was provided by the Massachusetts Institute of Technology–Beth Israel Hospital (MIT–BIH). The results show that the proposed methodology is capable of predicting an epileptic seizure 15 min before with an accuracy of 100%. Our results suggest that the use of STFs at frequency bands related to heart activity to find parameters for the prediction of epileptic seizures is suitable.

1. Introduction

Epilepsy is a brain disorder that affects about 50 million persons around the world and is characterized by generating recurrent seizures [1]. In particular, the brain contains billions of nerve cells or neurons that help people to control their way of (1) thinking, (2) moving, and (3) feeling by means of electrical signals that send messages from one nerve cell to others [2]. In this regard, the brain is characterized by allowing the neurons to send electrical signals at a rate that is under 100 times per second, but during an epileptic seizure or ictal state, the neurons become hyperexcitable, which causes a period of abnormal and asynchronous excitation in a neuronal population, generating muscular contractions that are uncontrollable [3,4]. This reaction can lead to the patients suffering physical problems (i.e., fractures and bruising related to seizures) and psychological conditions (i.e., anxiety and depression), negatively affecting their life quality [5,6]. In addition, they present a permanent risk of death because of falls, drowning, burns, and prolonged seizures [6]. Hence, it is imperative to investigate and propose new methods or methodologies capable of predicting a seizure (pre-ictal state) minutes before onset, allowing the patients to find a safe place or take their precautions against injuries as well as receive timely medical treatment.
In the last decade, several researchers worldwide have presented diverse methods or methodologies based on electroencephalogram (EEG) signals for predicting an epileptic seizure [7,8,9,10,11,12,13,14,15,16]; however, despite obtaining promising results by using EEG signals, diverse studies presented in recent years indicate that the autonomic nervous system can produce alterations also in the electrocardiogram (ECG) signals [17,18,19,20], becoming a promising information source that can be used for predicting an epileptic seizure [21,22,23,24,25]. For example, Popov et al. [21] integrated 112 features (i.e., histogram characteristics, spectral analysis, polynomial approximation coefficients, among others) with a support vector machine (SVM) for predicting an epileptic seizure using the heart rate variability (HRV) of an ECG signal. The obtained results show that the proposal presents the sensitivity and specificity of 72.5% for predicting an epileptic crisis 20 min prior to its occurrence but using time windows or intervals of 10 min for their analysis. The authors conclude that it is important to continue investigating other methods as well as other time windows in order to increase the accuracy in predicting an epileptic seizure. Pavei et al. [22] integrated 47 nonlinear indices (i.e., the mean and deviation standard of RR intervals (R denotes to a peak of the QRS complex of the ECG signal or wave and RR indicates the interval between successive Rs), the power spectral density of low- and high-frequency range of signals, among others) with a SVM for predicting an epileptic seizure using the HRV of ECG signals. The obtained results show an accuracy of 95.6% for predicting an epileptic seizure 5 min before the onset. Varon et al. [23] investigated a nonlinear measurement called phase rectified signal averaging in combination with a kernel spectral clustering for predicting an epileptic seizure using ECG signals. The authors reported that an accuracy of 86.21% was obtained by using their proposal for predicting an epileptic seizure 30 s before the onset. Billeci et al. [24] integrated 19 features (i.e., mean and deviation standard of RR intervals, power spectral density of low- and high-frequency range of signals, fractal dimension analysis, among other) with a SVM for predicting an epileptic seizure using the ECG signal. The obtained results show an accuracy of 74.6% for predicting an epileptic seizure 10 min before the onset. Giannakakis et al. [25] integrated 18 diverse nonlinear methods: time-domain (envelope, the mean and standard deviation of RR intervals, the mean heart rate, among others) and frequency-domain (power in a low and high frequency band, frequency of the high and low frequency band peak, among others) with an SVM for predicting an epileptic seizure by using the HRV of ECG signals. The authors reported an accuracy of 77.1% for predicting an epileptic seizure 21.8 s before the onset.
The aforementioned works have reported promising results for seizure prediction by analyzing ECG signals, however, they exhibit some important limitations, such as: (1) insufficient time for locating a safe place in order to avoid an injury and receive an appropriate medical procedure, (2) high computational cost which restricts a seizure prediction in real time, and (3) low accuracy. Therefore, it is imperative to propose and apply new methodologies based on enhanced signal processing techniques with low complexity in order to increase the accuracy for predicting an epileptic seizure, allowing patients the possibility of locating a safe place or taking their medicaments for preventing injuries that can put their life at risk.
In this paper, a new methodology based on the adroit integration of wavelet packet transform (WPT), statistical time features (STFs), and a decision tree-based classifier (DTC) is presented with the aim of predicting an epileptic seizure 15 min before its onset. The efficiency of the proposed method is evaluated by means of the ECG signals measured experimentally from seven patients with seizures.

2. Materials and Methods

2.1. Data Set Used

With the aim of validating the potential of the proposal for predicting an epileptic seizure, the open access database called “Post-Ictal Heart Rate Oscillations in Partial Epilepsy” (PIHROPE) (https://physionet.org/content/szdb/1.0.0/) provided by the Beth Israel Hospital was used. It comprises the ECG signals of 7 patients (2 men and 5 women) within an age range of 31–48 years, where a total of 10 epileptic seizures were registered during their monitoring. It should be noted that a team of experts in cardiology confirmed that the patients enrolled in the study did not present the clinical evidence of heart disease and they present partial seizures with or without a secondary generalization from frontal or temporal foci. Table 1 presents the seizure onset time registered for each patient, where it is possible to observe that two patients suffered more than one epileptic crisis (i.e., patients No. 2 and No. 6) during their monitoring [26].

2.2. Preparation of the ECG Signals

Electrocardiogram signals examined in this work were monitored during 3 h on average by using a sampling frequency of 200 Hz [26]. However, they are down-sampled or resampled to 128 Hz since this sampling frequency value is useful to diagnose heart diseases as well as allow for reducing the quantity of information or samples to be processed [27,28,29,30]. This process is performed by convolving the measured ECG signals with a low-pass finite impulse response filter. From the 3 h monitored for each patient, only the first 15 min of the ECG signal prior to the seizure onset was extracted and evaluated in this investigation. It should be noted that this time window allows exploring and offering an earlier epileptic seizure prediction than the one provided by other works presented in the literature. The time window (15 min) investigated in this work is divided into 1 min intervals; that is, the first 1 min interval before the epileptic crisis onset, the second 1 min interval before the epileptic crisis onset, etc. On the other hand, a normal or healthy group (HG) was obtained by extracting 1 min intervals from ECG signals 1 h prior to or after the seizure since in this time the patients presented a normal cardiac rhythm [22]. It is important to mention that the time windows or intervals of 1 min were selected because they allowed identifying reliable features in the ECG signals for predicting a sudden cardiac death as well as a seizure [22,28,29,31]. For this reason, the 1 min interval is also explored in this work for predicting a seizure until 15 min before the onset.
Figure 1 illustrates the first 1 min interval of the ECG signal prior to the epileptic seizure and two 1 min intervals of the ECG signal recorded 1 h before the seizure occurred, respectively. From this figure, it is not possible to visually identify significant differences or changes between both ECG signal groups prior to the seizure onset. Therefore, it is of imperative importance to propose a method or methodology with the capability of identifying the hidden differences between both groups in order to predict an epileptic seizure with good accuracy.

2.3. Wavelet Packet Transform

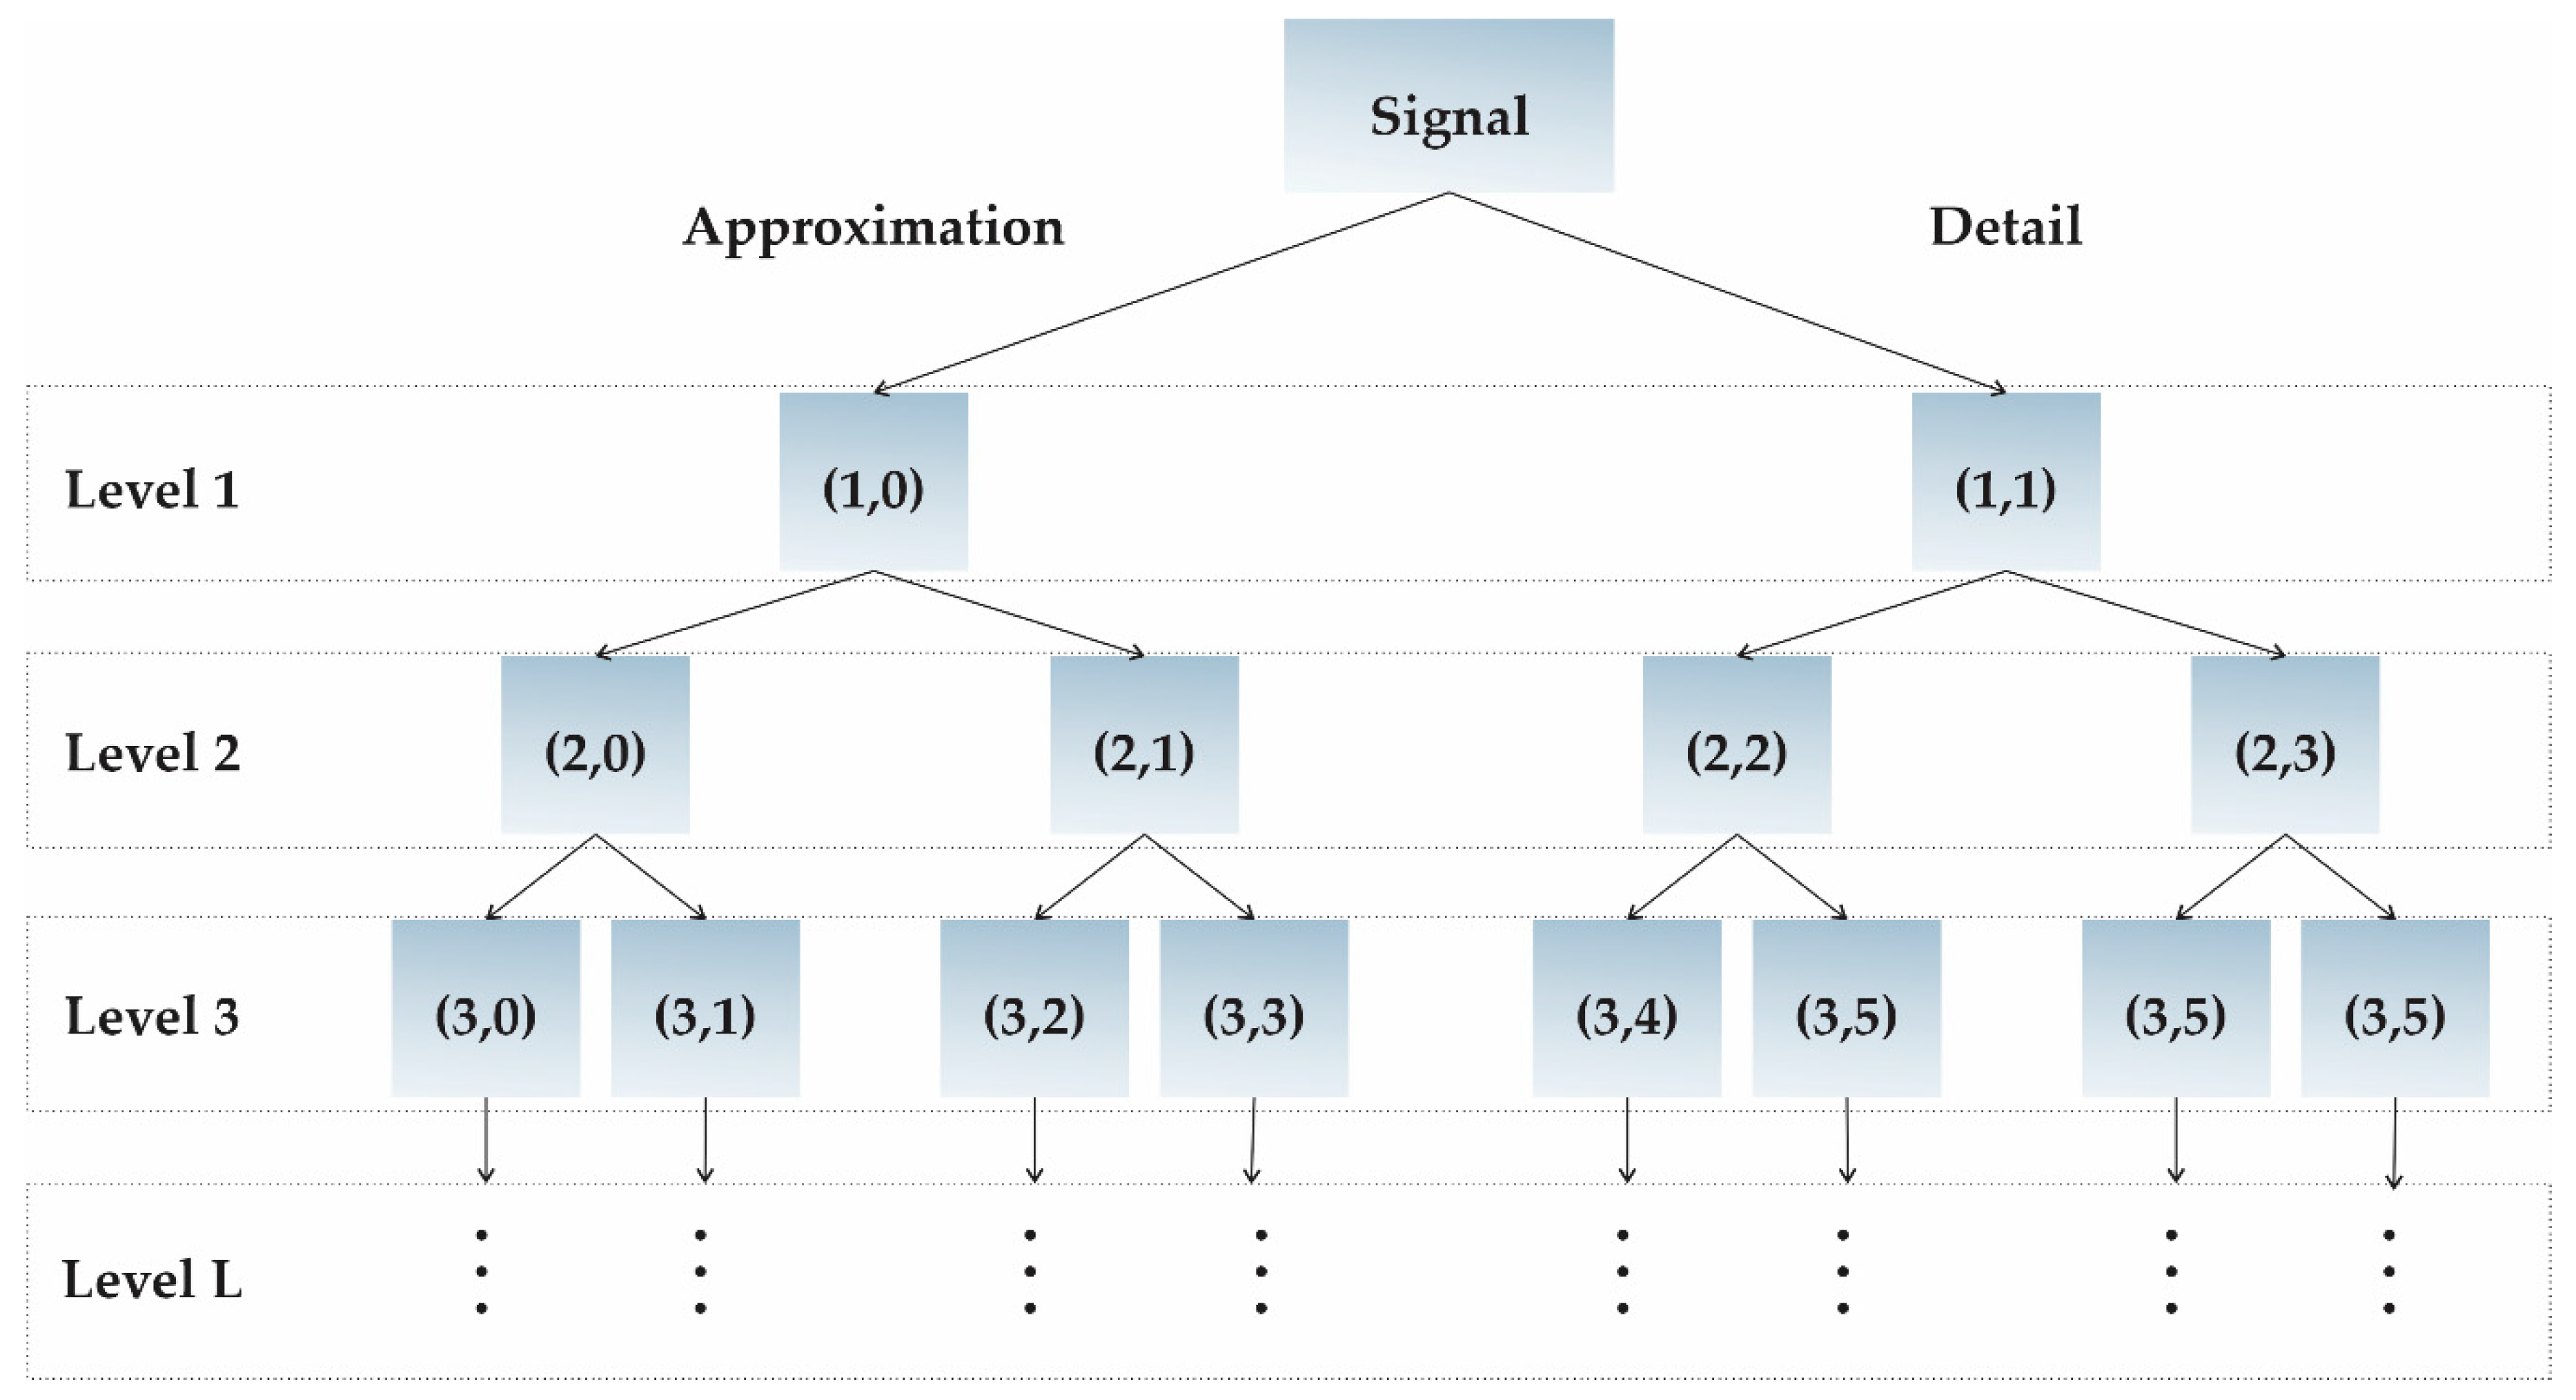
Wavelet packet transform has demonstrated to be a reliable tool to analyze physiological signals such as ECG [29], EEG [32], electromyography (EMG) [33], among others. It is characterized by performing an analysis more detailed than the discrete wavelet transform (DWT), since in WPT both the low and high frequency components (approximation and detail coefficients, respectively) are decomposed to form a new decomposition level (see Figure 2). In this sense, the WPT is a useful method to provide a time-frequency analysis of the signals [34,35]. In order to estimate the decomposition level, the following equation is employed [36]:
W j , k n ( t ) = 2 j / 2 W n ( 2 j t k )
where j and k are the scaling (frequency localization) and the translation (time localization) parameters, respectively, and n is the oscillation parameter. The approximation and detail coefficients are obtained as follows [35]:
W 2 n ( t ) = 2 k = h ( k ) W n ( 2 t k )
W 2 n + 1 ( t ) = 2 k = g ( k ) W n ( 2 t k )
where h(k) and g(k) are the low-pass and high-pass filter coefficients associated, respectively, t is the variable time, and W n   represents the Mother Wavelet used (i.e., Daubechies, biorthogonal, Morlet, among others). In this work, the Mother Wavelet Daubechies 44 (Db-44) is employed as it delivers reliable results for analyzing or processing physiological signals [36].
From the previous work [29], it has been found that a 5-level decomposition scheme (32 nodes) using WPT is reliable to decompose ECG signals because it allows isolating transient events due to the reduced bandwidth (i.e., 2 Hz with a sampling frequency of 128 Hz) associated to each node. In addition, other benefits that can provide this decomposition level are: (1) a reduction in the noise of the signal obtained in the frequency bands or nodes, and (2) the mix down of other frequencies. In this way, the behavior of the ECG signals obtained at each node can be analyzed by STFs to obtain features that can allow the prediction of an epileptic episode. Hence, since an epileptic seizure problem can generate transients [17], this decomposition level value will also be evaluated in this work.

2.4. Statistical Time Features

Statistical time features have proven to be efficient tools for detecting significant changes in the signals associated to neurodegenerative [37] and cardiac [38] diseases, as well as sleep disorders [39], among others. In general, STFs are capable of measuring changes in the properties of non-stationary time signals such as their range of values, dispersion, asymmetry, and convergence, among others [40,41]. It should be noted that a signal transformation is not performed to estimate the features; hence, it is evident that the techniques’ computational cost is low [42]. The equations of the 17 STFs used in this work are described as follows [43,44,45]:
R o o t   M e a n   S q u a r e = R M S = ( 1 n j = 1 n x j 2 ) 1 2
S h a p e   F a c t o r   R o o t   M e a n   S q u a r e = S F r m s = R M S 1 n j = 1 n | x j |
S q u a r e   M e a n   R o o t = S M R = ( 1 n j = 1 n x j 1 2 ) 2
S h a p e   F a c t o r   S q u a r e   M e a n   R o o t = S F s m r = S R M 1 n j = 1 n | x j |
C r e s t   F a c t o r = C F = | x j   m a x R M S |
I m p u l s e   F a c t o r = I F = x j   m a x 1 n j = 1 n | x j |
L a t i t u d e   F a c t o r = L F = | x j   m a x S R M |
R a n g e = R = x j   m a x x j   m i n
M e a n = M = 1 n j = 1 n x j
V a r i a n c e = V a r = 1 n j = 1 n ( x j M ) 2
S t a n d a r   D e v i a t i o n = S T D =   ( Var ) 1 2  
S k e w n e s s = S k = 1 n ( R M S ) 3 j = 1 n ( x j M ) 3
K u s t o s i s = k = 1 n ( R M S ) 4 j = 1 n ( x j M ) 4
5 t h   M o m e n t = 5 M o = 1 n ( R M S ) 5 j = 1 n ( x j M ) 5
6 t h   M o m e n t = 6 Mo = 1 n ( R M S ) 6 j = 1 n ( x j M ) 6
M e d i a n = M e = { x ( n + 1 2 ) ,   if   n   is   odd   number 1 2 ( x ( n 2 ) + x ( n 2 + 1 ) ) ,   if   n   is   even   number
M o d e = M d = L i + c d d + d +
where xj is the j-th time-series sample that goes from j = 1,2,3… n, n is the number of samples, Li is the lower limit of the modal class, c is the width of the modal class, d and d+ are the absolute differences of the modal interval and the classes of the neighboring intervals, respectively. It should be noted that the property that each of the STFs measures is different and might not capture relevant information that can help to perform the early detection of an epileptic seizure. For this reason, it is necessary to employ a statistical method that can measure the relevance of the obtained features for each node estimated by using WPT.

2.5. Kruskal–Wallis Method

Kruskal–Wallis method is a non-parametric method used to evaluate the statistical independence of distribution-free signals [46]. It has been employed as a part of the development of physiological processing strategies; in particular for the respiration estimation using ECG [47], and drowsiness levels using EEG [48], among others. In general, the Kruskal–Wallis method (KWM) evaluates the medians of the feature groups through a null hypothesis that consists in assuming that all medians of the data sets are equal [49]. If the probability value (p-value) is smaller than a range between 0.05 and 0.01 [49], the null hypothesis is rejected, indicating that the features to differentiate between a selected data set and the remaining data sets can be safely used. On the contrary, if the p-value is greater than the aforementioned range [49], the null hypothesis is accepted; this means that the feature groups have similar information and cannot be used to determine the differences between the groups (seizure and healthy). Therefore, the p-value is used to determine the most discriminating STFs to predict a seizure.

2.6. Decision Tree Classifier

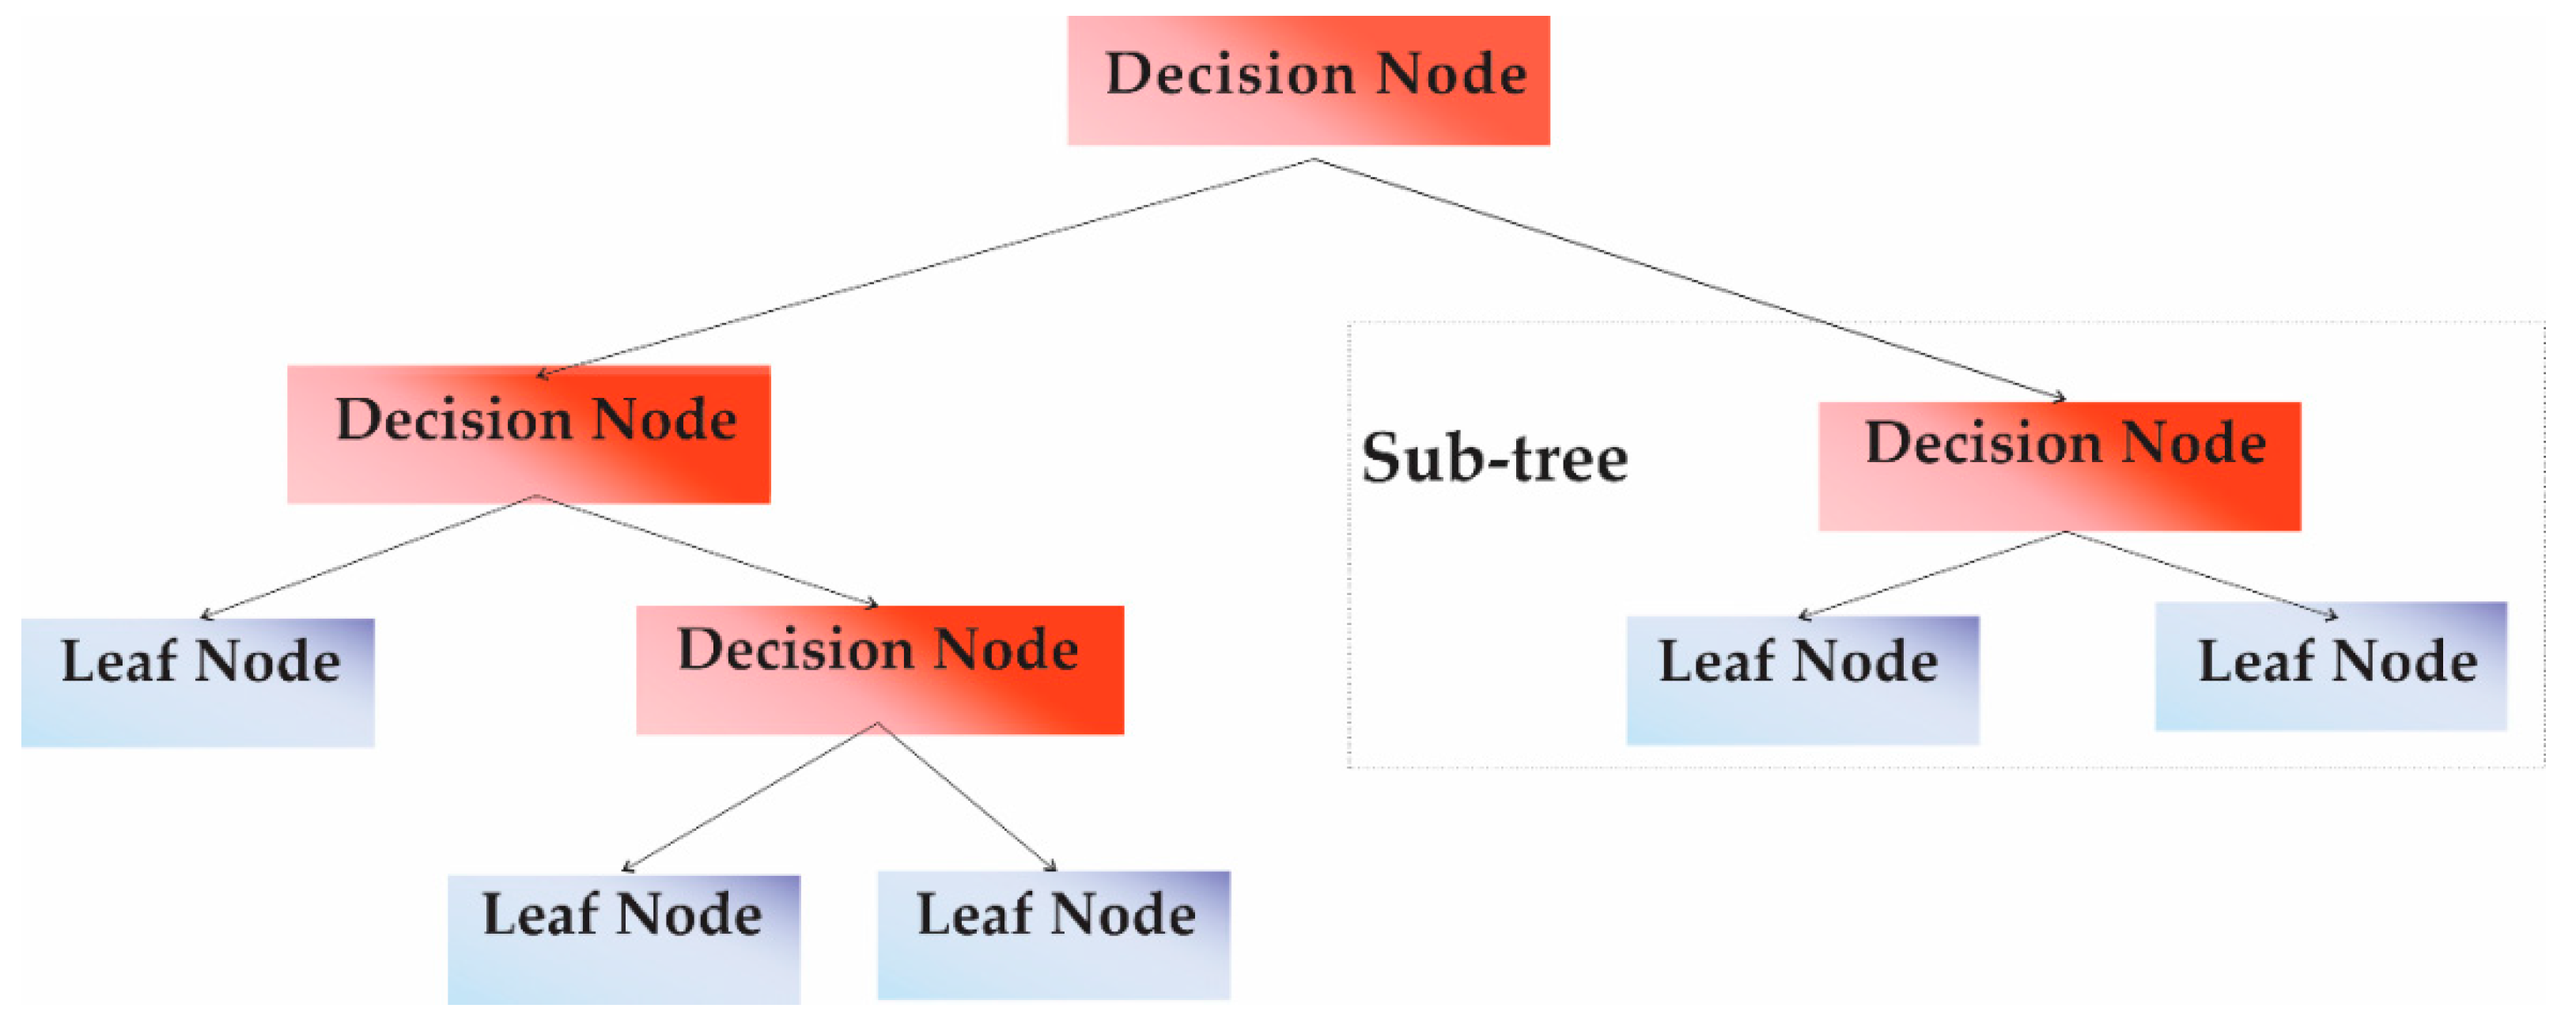
The decision tree classifier is a simple but effective classifier that offers an easy and flexible implementation because it can be implemented by using a set of if–else rules with a low computational time [50,51]. Moreover, it can reach a good accuracy [52], assuming that the feature sets do not heavily overlap [53]. In recent years, DTC has been used for the classification of physiological signals for the detection and diagnosis of medical diseases [54,55,56]. Figure 3 shows a graphical illustration of a DTC. The procedure used to develop a DTC is [57]:
  • Rule splitting node selection;
  • Set of the terminal nodes;
  • Assignment of the corresponding class label to the terminal nodes.
The decision in each stage of the tree depends on the previous branching operations. The tree structure (see Figure 3) starts with the root node, then performs the test that follows the edge, and then repeats the test until it reaches the end (leaf) node [52]. Once it reaches the leaf node, the tree predicts the outcome associate, that is, class label [55]. This procedure can be resumed as [58]:
  • Design a logical test for each feature that will be used as an input to the DTC;
  • For each logical test, use a subset of the training data to verify that the outcome to the corresponding terminal node assigns the expected label;
  • Repeat this procedure for all the terminal nodes.
Considering the aforementioned benefits and the easy implementation, a DTC can be an appropriate option to perform the seizure prediction using the selected STFs, where it should be pointed out that a quick-adjust can be performed [59] if required to ensure the best possible result.

3. Methodology

Figure 4 graphically presents the steps required to execute the proposed methodology for predicting an epileptic seizure. In Step 1, the first 15 min of an ECG signal prior to seizure are extracted and divided into 1 min intervals. In addition, 1 min intervals of ECG signals 1 h prior to or after the seizure are extracted and used as HG. Then, in Step 2, each 1 min interval of the ECG signals is decomposed by means of WPT in diverse frequency bands (FBs) or nodes according to the level selected (e.g., if the ECG signals are decomposed until the eighth level, 256 nodes or frequency bands are obtained because each level, L, generates 2L frequency bands). WPT allows obtaining a more detailed analysis of ECG signals unlike the discrete wavelet transform (DWT) as DWT only decomposes low frequencies. In Step 3, each node or frequency band obtained by WPT is analyzed using the seventeen STFs to find the features of the decomposed ECG signals with the capability of predicting an epileptic seizure. In Step 4, the STF values estimated for each node are evaluated through KWM, a nonparametric analysis of variance, for determining the most suitable STFs for predicting an epileptic seizure. Finally, in Step 5, the selected STF values in the previous step are used as inputs for designing a DTC for predicting an epileptic seizure automatically. In the following sections the mathematical concepts used in this work are detailed.

4. Results

Using the steps of the proposed methodology, the HG and the seizure group signals, divided into 1 min intervals, are decomposed by employing the WPT. It should be noted that the decomposition levels were varied from 1 to 8, revealing as a results that the fifth level is suitable for analyzing the ECG signals because a higher decomposition level did not improve the classifier accuracy in a relevant manner, whereas a lower decomposition level resulted in a wider bandwidth, increasing the possibilities of having a mixture of frequencies that might result in the lower accuracy of the classifier.
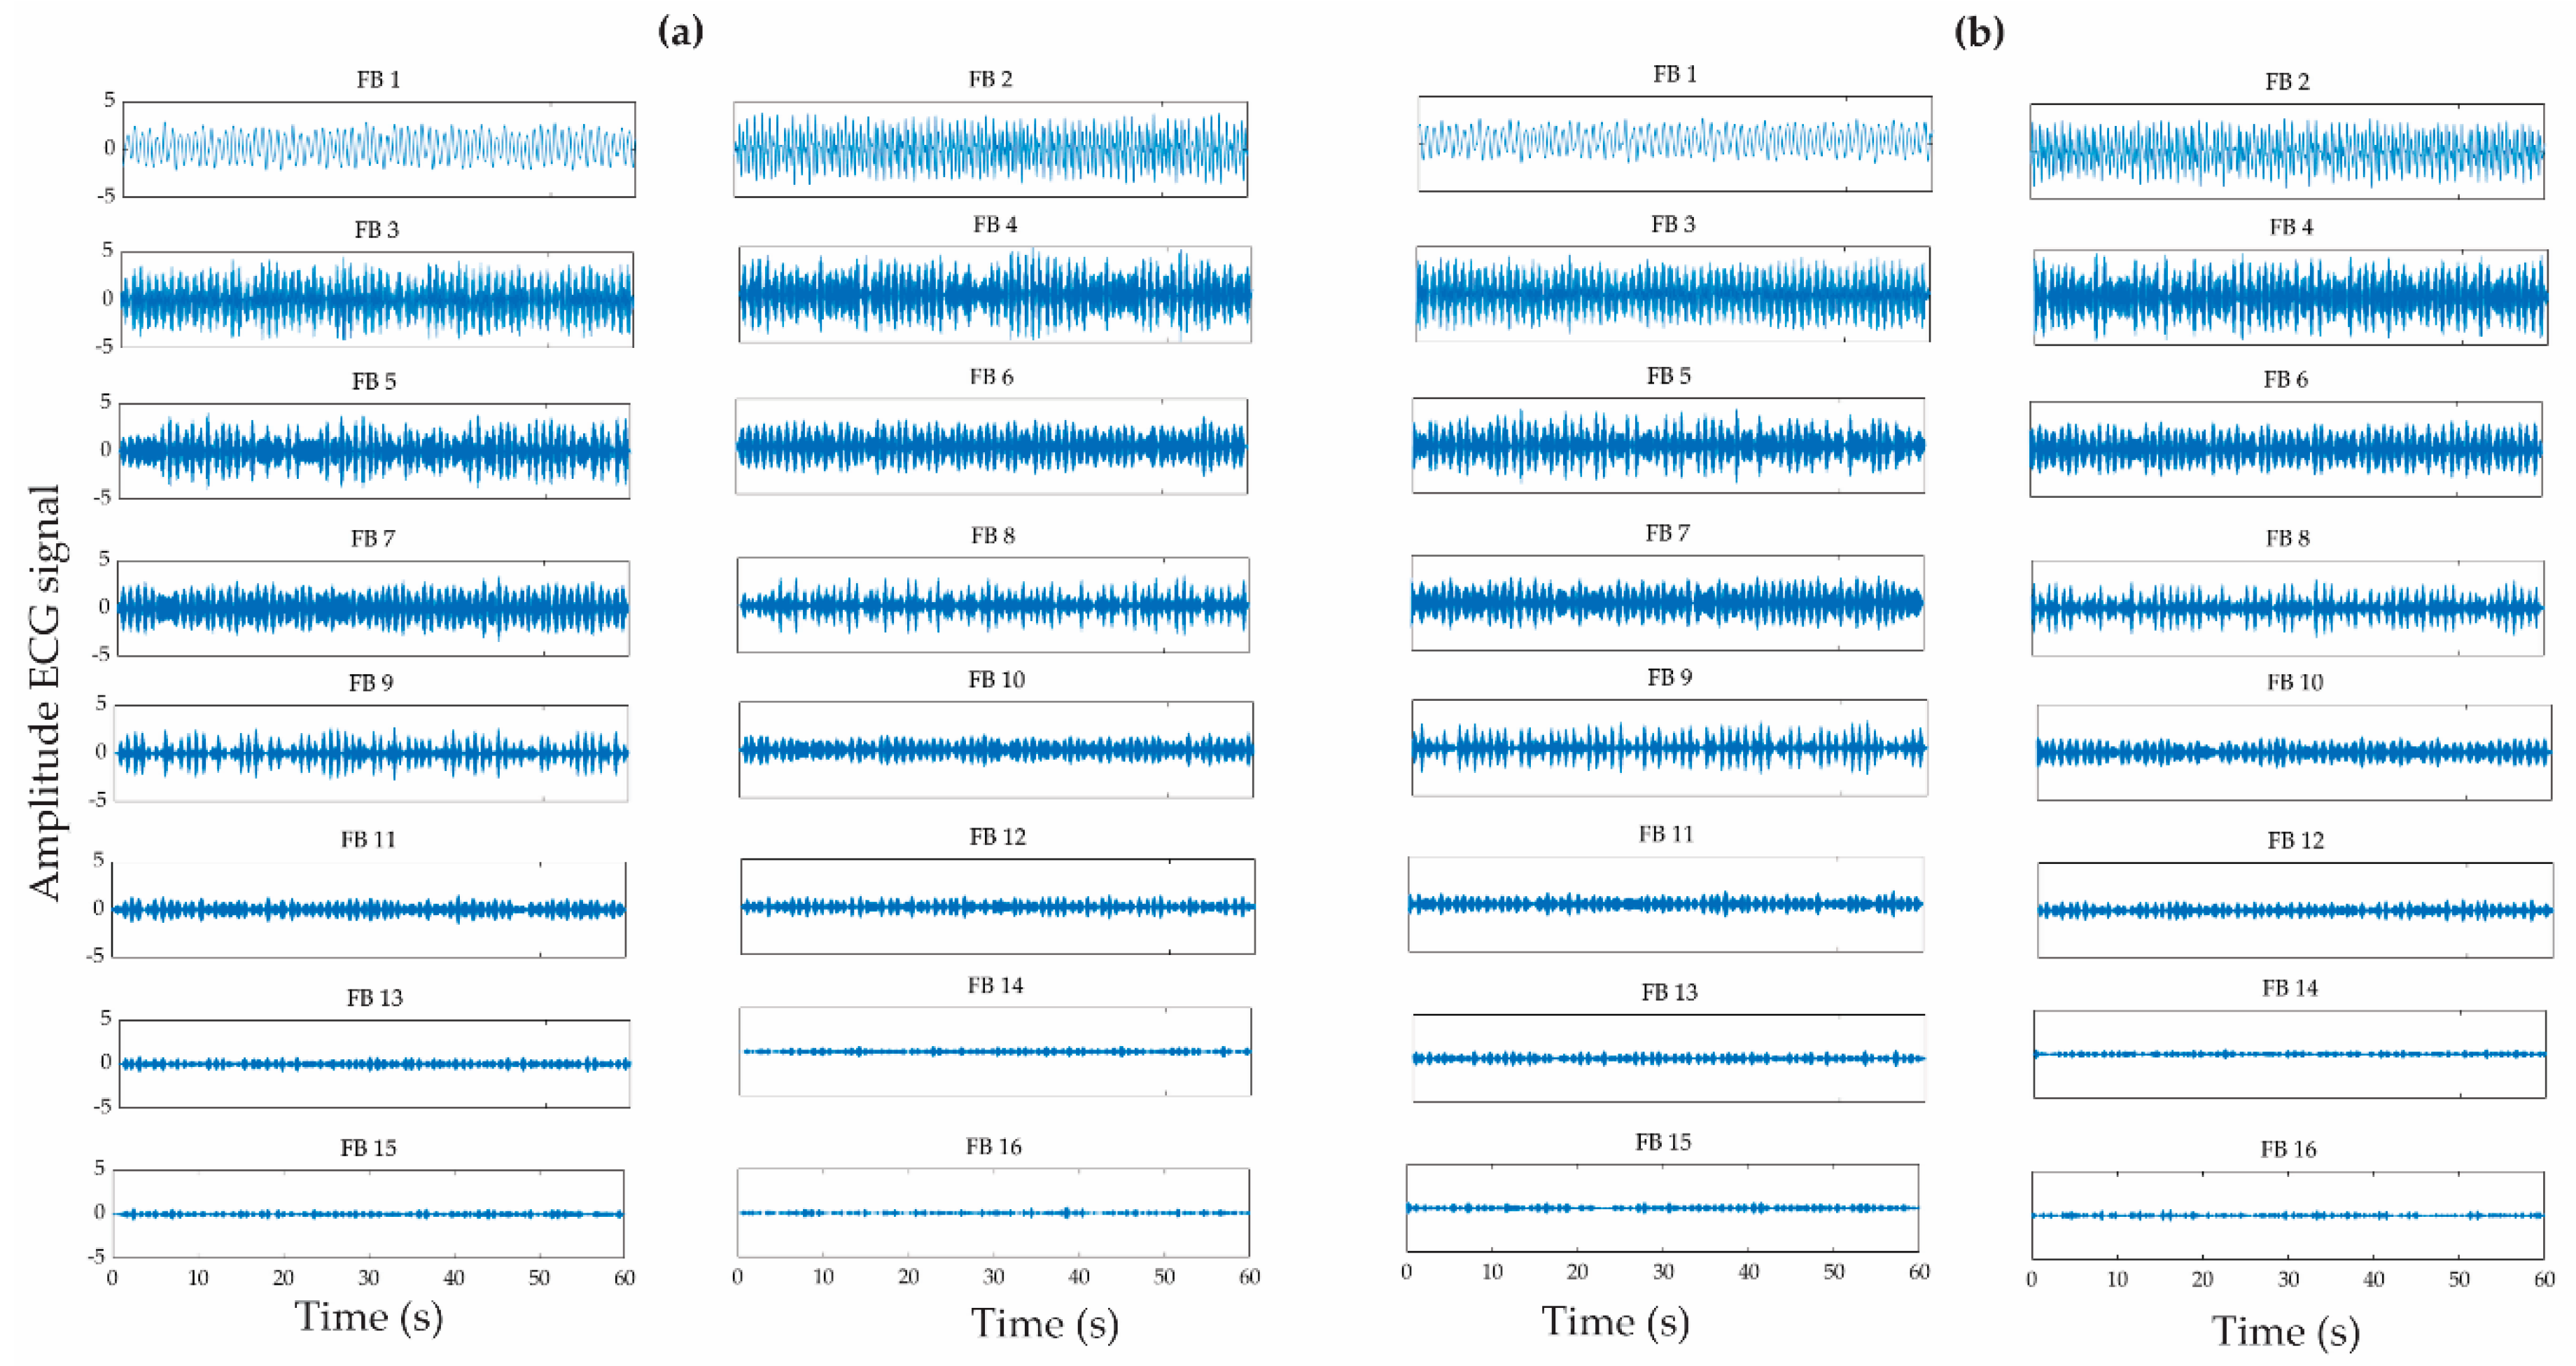
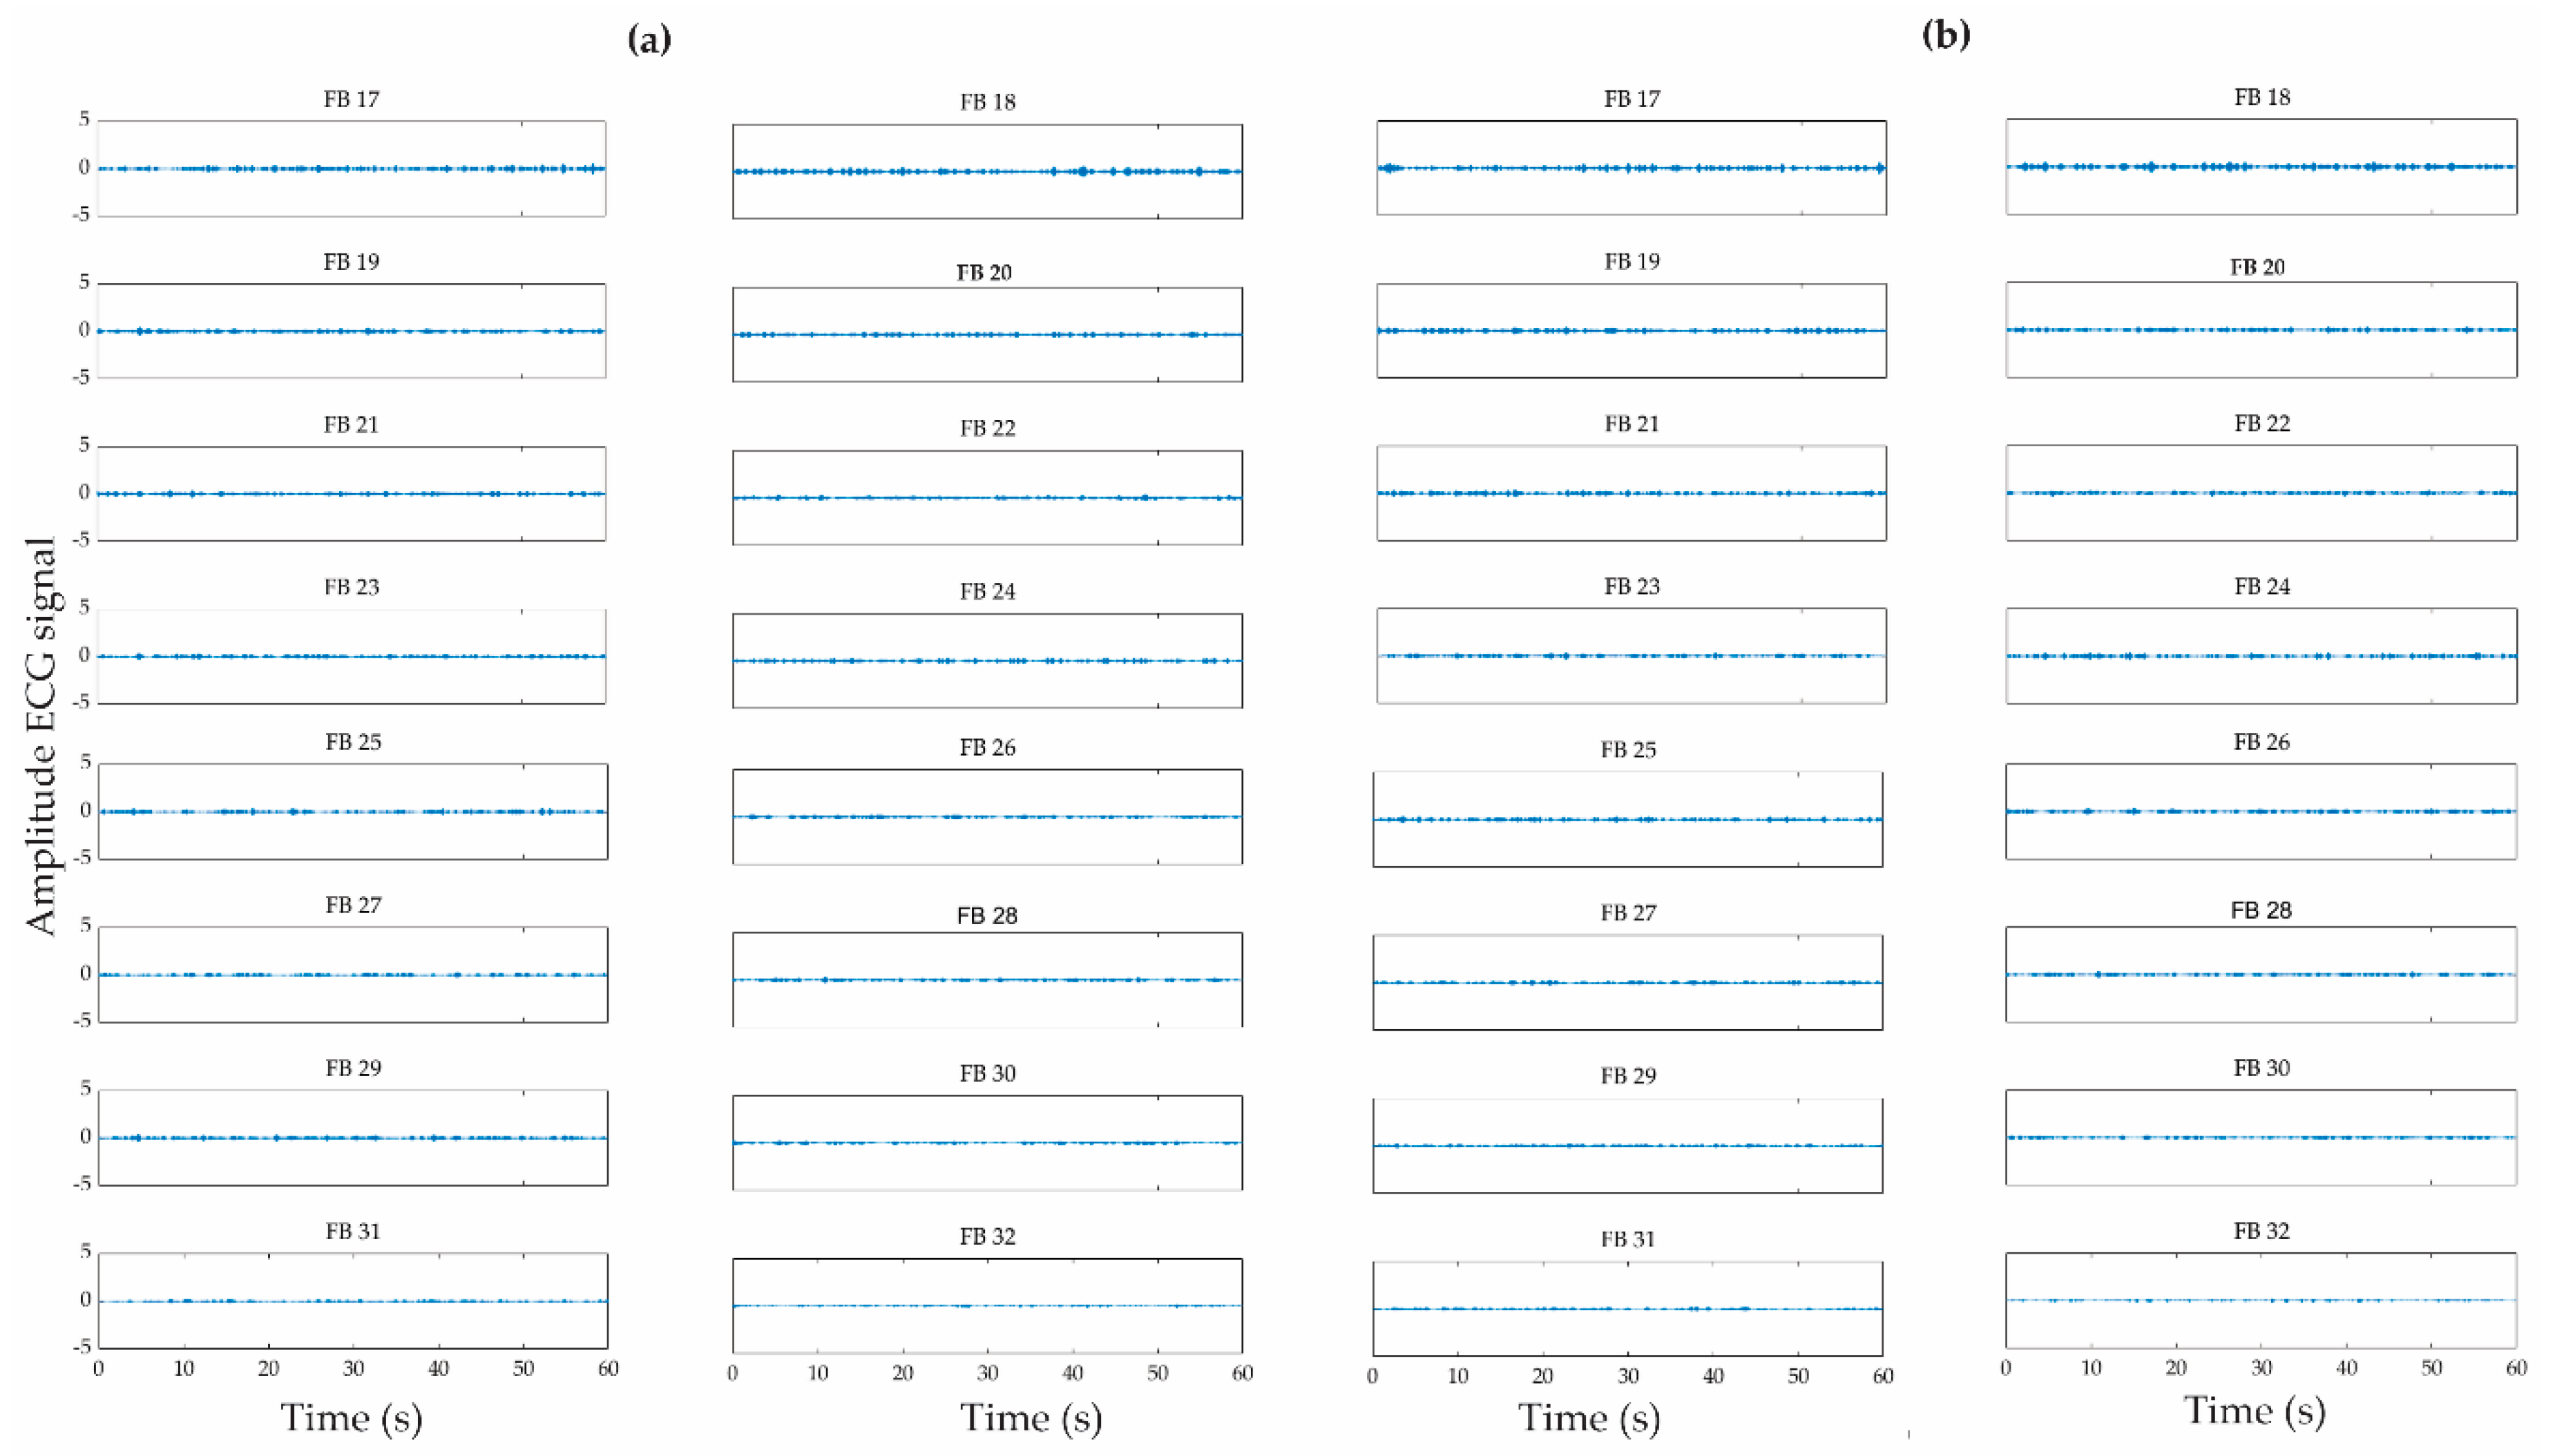
Figure 5 and Figure 6 show the estimated 32 FBs at the fifth level for the HG signal and the first 1 min interval prior to the seizure occurrence, respectively. Since there are no visual differences between the HG and a patient with epilepsy one minute prior to a seizure’s occurrence, each FB is analyzed with the 17 STFs to identify the features in the decomposed signals that allow the early prediction of a seizure.
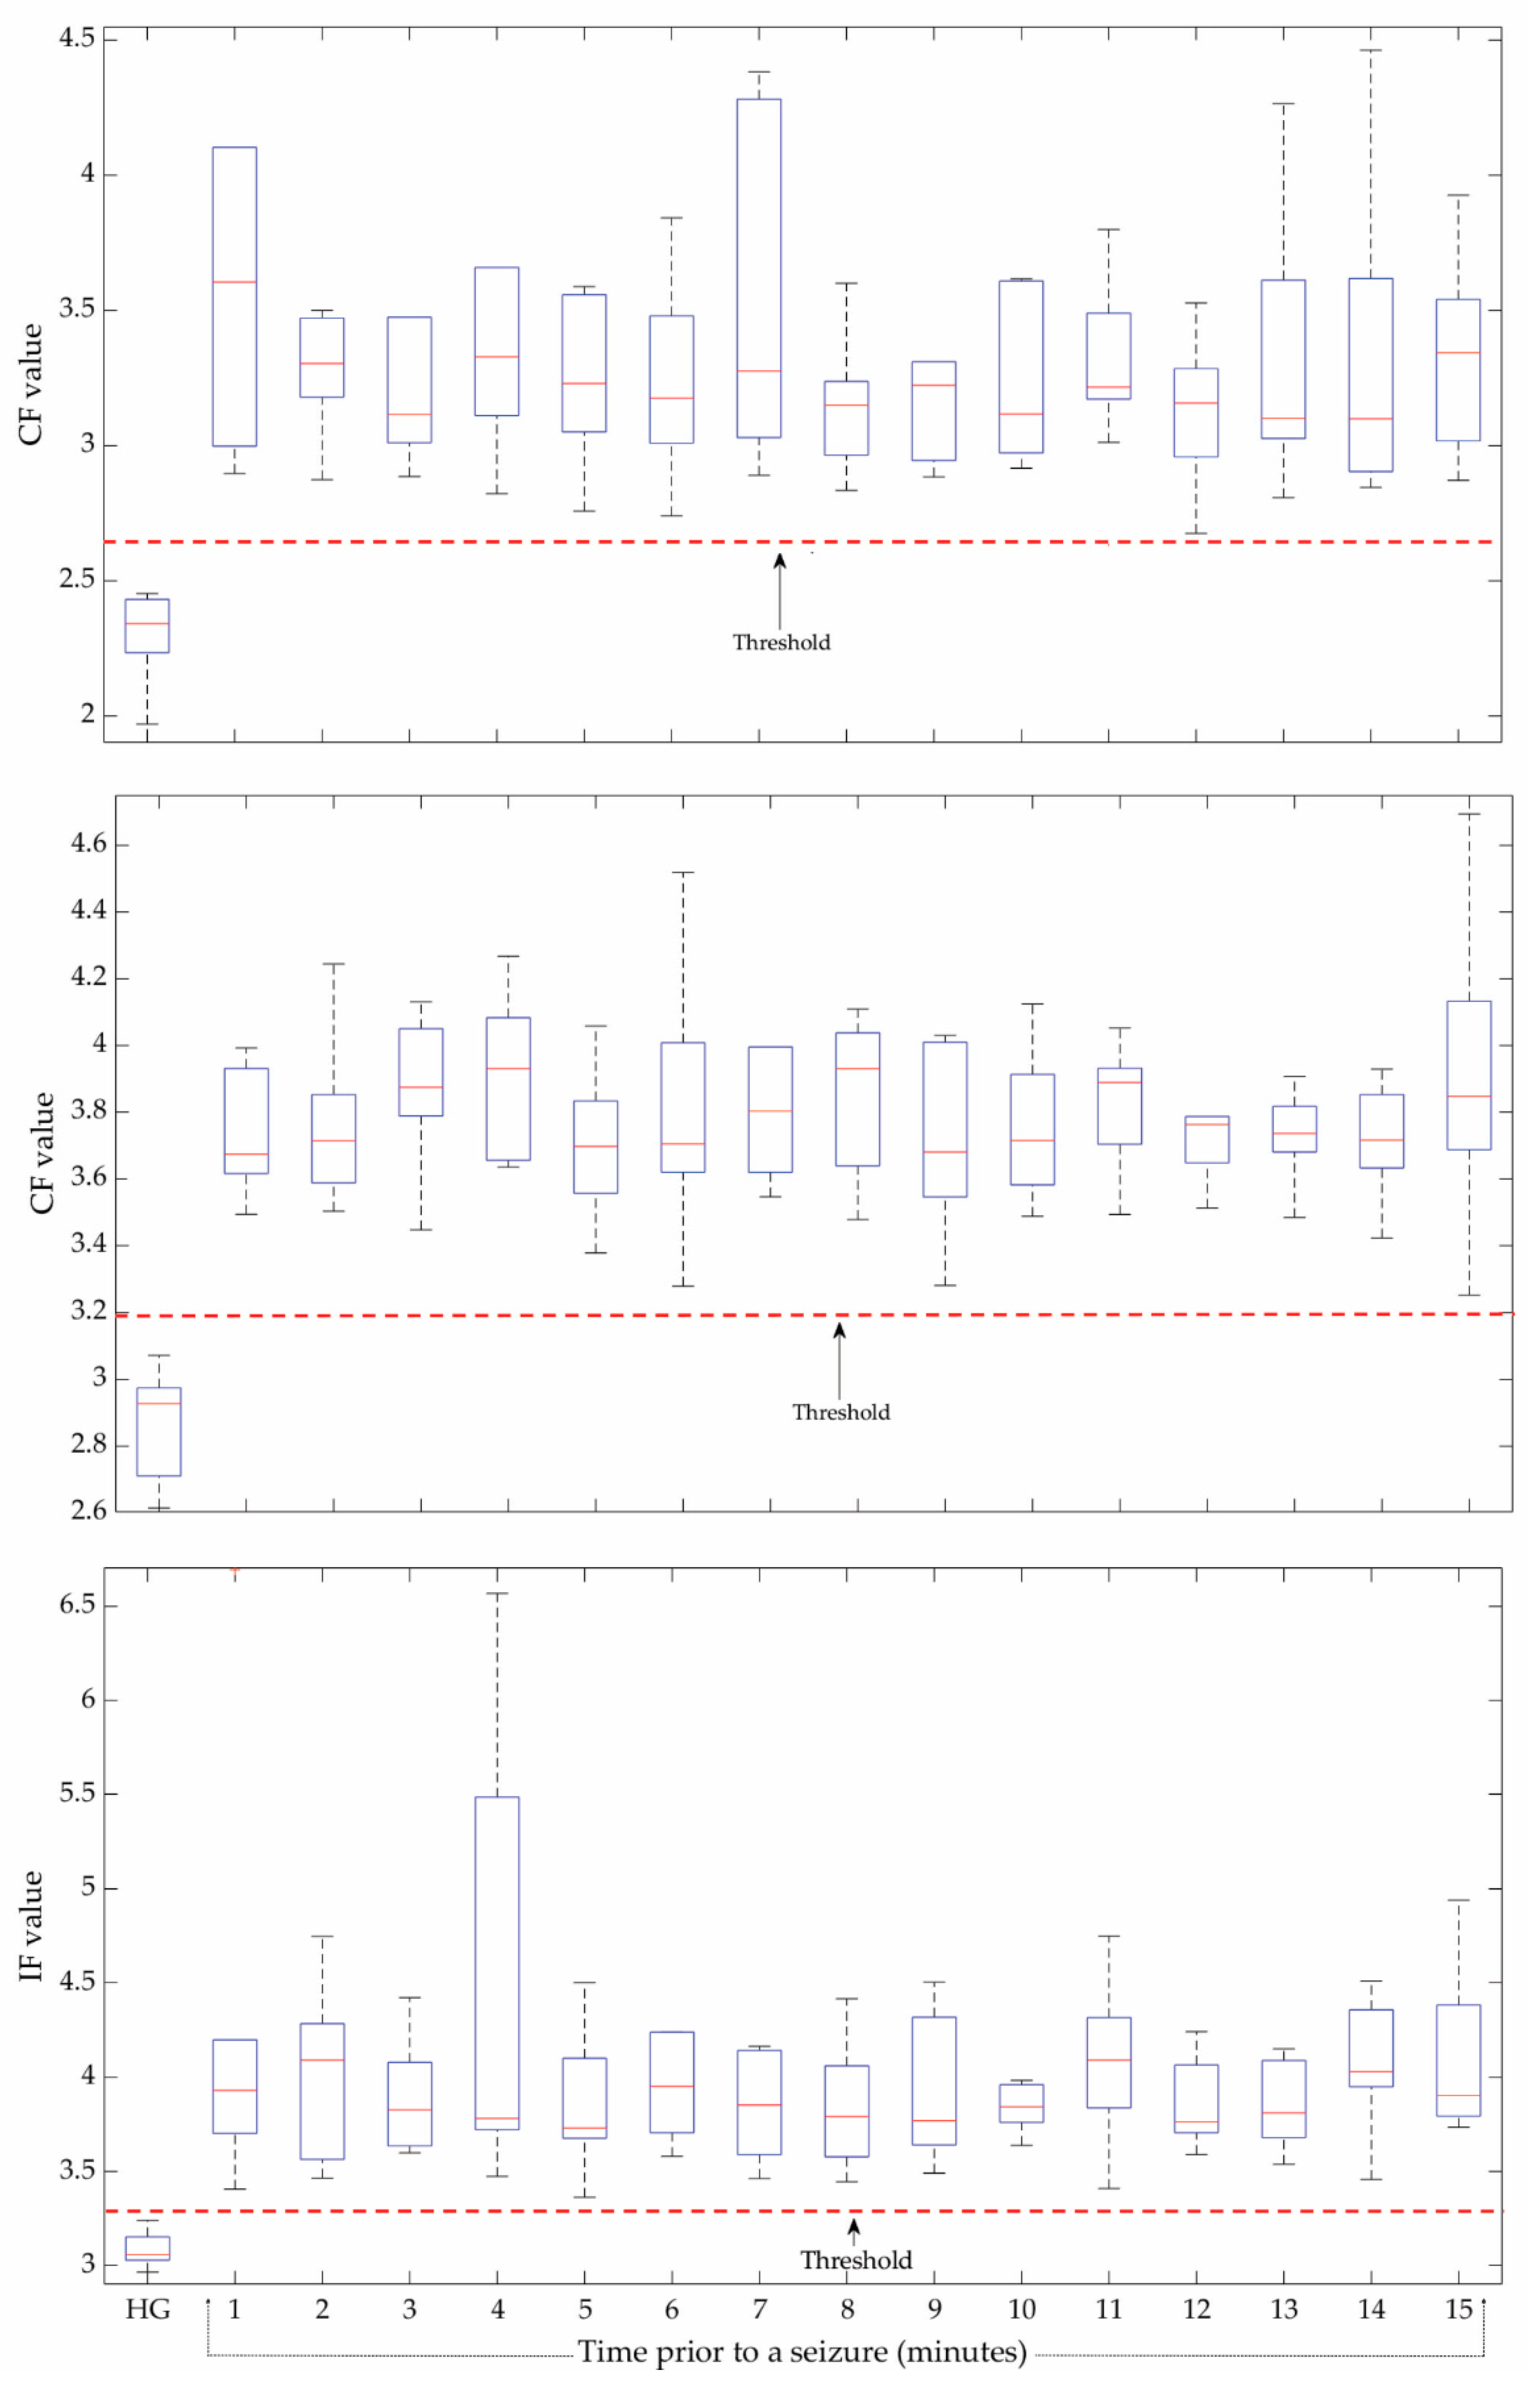
Once the STFs were calculated for all FBs and the fifteen 1 min intervals, they were evaluated by means of KWM in order to determine which FB and STF were the most capable of predicting an epileptic seizure. In this regard, the FB-9 and FB-13 for the CF property, and the FB-12 for the IF index present the lowest p-values, indicating that they can be reliable for predicting a seizure. Figure 7 depicts the boxplot graph for the aforementioned properties, where it is seen that no evident overlaps are observed between the HG group and the ECG signal prior to the seizure from the first 1 min interval to the fifteenth 1 min interval.
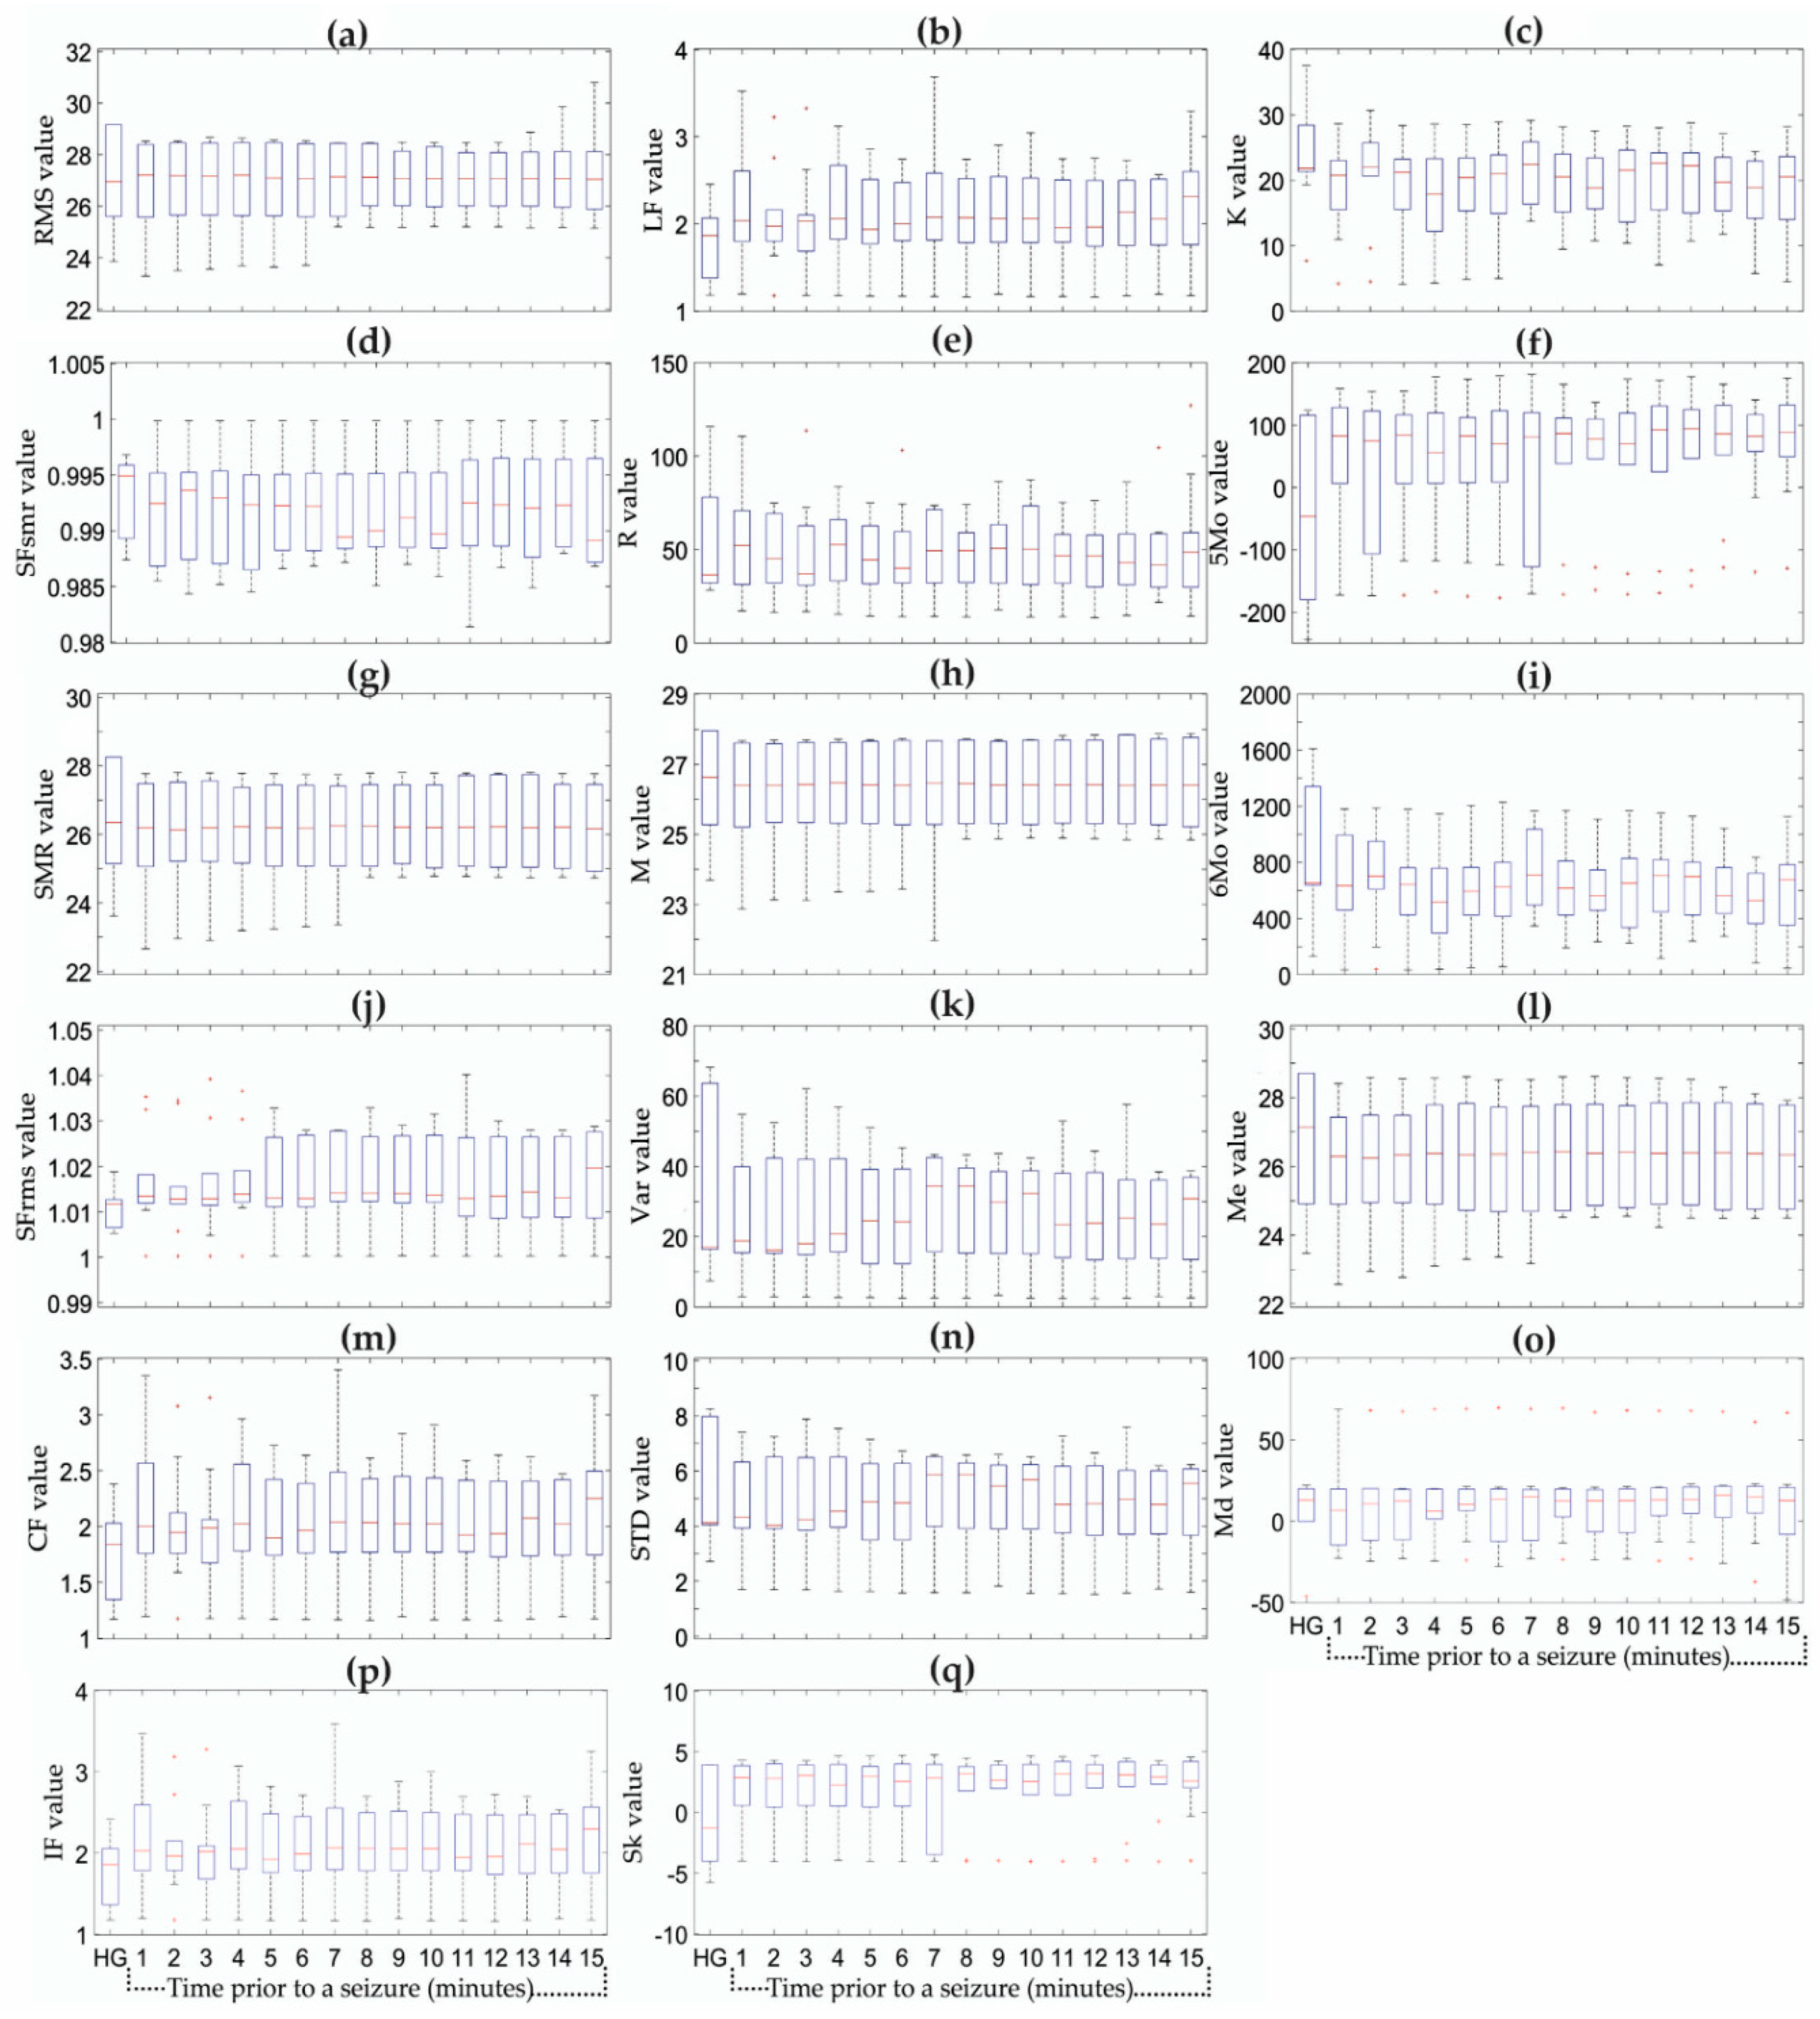
Table 2 presents the p-values obtained for the most discriminative STF indices from the first 1 min interval to fifteenth 1 min interval prior to the epileptic seizure. On the other hand, Figure 8 shows the obtained results analyzing directly, without the WPT, the fifteen 1 min intervals prior to the seizure and the 1 min intervals of HG with the STFs, where it is possible to observe that the STFs are not capable of detecting any difference between both signals, as the values obtained heavily overlap between them, limiting their use for predicting an epileptic seizure. Hence, these results allow affirming that the integration of WPT with STFs are useful for early predicting the disease.
Finally, the most useful STFs selected by means of KWM, i.e., CF(FB-9), CF(FB-13), and IF(FB-12), were employed to design a DTC based on if–else rules in order to predict a seizure automatically. It is important to mention that the proposal could distinguish both groups with high accuracy by integrating anyone of the selected STFs with the DTC since their values were not overlapped; however, in order to give more robustness to the proposed methodology in the case of evaluating new ECG signals or a database, the three selected STFs, the most discriminant ones, were used at the same time with the DTC. In this regard, three threshold values were determined (one per each STF) by performing a visual inspection for designing a DTC based on if–then–else rules for distinguishing between both groups, whose values are denoted in Figure 7 by a red dashed horizontal line. From this figure, for the CF(FB-9) values > 3.199, CF(FB-13) > 2.684, and IF(FB-12) values > 3.267 are considered as seizure zone and CF(FB-9) values ≤ 3.199, CF(FB-13) ≤ 2.684, and IF(FB-12) values ≤ 3.267 are considered as the normal heart rate. It should be noted that the DTC does not require a training stage.
Table 3 presents the proposed methodology accuracy, minute by minute, during the fifteen minutes before the seizure. From this table, it was seen that an accuracy of 100% was reached for discriminating between the normal subjects and the ones that can experience an epileptic seizure, fifteen minutes prior to the event. In addition, a specificity and sensitivity of 100% was reached. Hence, it can be affirmed that this time detection window allows providing an appropriate time to take the remedial actions that can mitigate the consequences of the seizure, either locating a safe place where the person is less likely to suffer physical damage or taking medication that can diminish the seizure effects.

5. Discussion

It should be noticed that 100% accuracy is obtained, which is a reasonable improvement over the presented results of similar works [21,22,23,24,25]; moreover, the proposal achieves a 15 min interval for the seizure prediction, being a good time window for allowing to take remedial actions to avoid severe damage to patient integrity. As noted by Vargas-Lopez et al. [28], it is desirable to achieve a methodology capable of obtaining a 100% accuracy as this will indicate that theoretically, any patient prone to suffer an episode can have a timely alert; in this sense, the proposal achieves this desired scenario. It should be noted that the proposed methodology uses a low-complex classifier, the DTC, which compared with a SVM employed in similar works [21,22,23,24,25], which requires a lower amount of computational resources, the desired feature, without compromising its accuracy. This allows us to affirm that the used indices can capture the subtle changes that the ECG signal suffers prior to an epileptic episode without using high-load computational burden classifiers nor several features for detecting the changes in the signal used for detecting the epileptic episode.
Table 4 presents a qualitative comparison between the proposal and other recent methodologies that have employed ECG signals, as well as a brief description of the methodologies used, the achieved prediction time, accuracy, and the reported specificity and sensitivity, respectively. From this table, it can be observed that most of the previous works reported in the literature requires a high quantity of features to measure the changes between the HG and seizure signals, reaching an accuracy from 74.6 to 95.6%. This fact can be considered as indicative of the employed indices that do not capture the subtle changes that the ECG signal suffers; in consequence, the used methodologies increase their computational burden as well as the classifier algorithm complexity, as it has to handle a considerable amount of information [21,22,24,25,60]. On the other hand, when only one feature is used as input to the classifier [23], both the accuracy and the detection time are greatly diminished. Another interesting fact the recent methodologies share is the processing of the ECG signal to either obtain the heart rate variability (HRV) or the R–R interval time (RRI). This fact further increases the computational cost of their methodologies, limiting the proposals real-time operation. On the contrary, the proposal directly processes the raw ECG signal, comprising the computational cost employed. In addition, from this table, it was also seen that STFs are a suitable and effective tool to detect the ECG changes that the autonomic nervous system can produce in an epileptic event. In addition, this work identified several frequency bands (16–18 Hz, 22–24 Hz, and 24–26 Hz, respectively) that can be used to detect the aforementioned changes. The bandwidths are in concordance with the values indicted in the state-of-the-art, which depicts that most of the ECG’s spectral power is located below 30 Hz [61]. Hence, this indicates that there is a relation between epileptic seizures and the activation of the sympathetic system, which confirms the findings reported by [17].
The proposal can be considered as a suitable alternative to detect patients that can suffer a seizure in a reliable and accurate way. However, it is necessary to continue exploring the proposed method with (1) a larger database in order to corroborate that the activation of the sympathetic system when the patient is prone to suffer a seizure can allow to detect the seizure as noted by [18]; in this sense, the viability of the proposal can be ensured, allowing to modify or calibrate according to new results, and (2) select a larger prediction time window (e.g., 40 min prior to the seizure onset), as this time window can allow the patient to locate a safe place where the seizure-associated movements do not compromise a risk to the patient’s integrity and their surroundings; moreover, it will allow the patient to arrive at a hospital so proper remedial actions can be carried out, ensuring a quicker recovery.

6. Conclusions

Epilepsy is a disease that produces an imbalance in the electrical activity of the brain neurons, which results in abnormal electrical activity (seizures) in the people that suffers this condition. Since the seizure can generate life-threatening scenarios, an early diagnosis of epileptic events will allow locating a safe place for the patients, preventing falls, drowning, and burns, as well as enabling them to receive adequate medical treatment. The results show an accuracy of 100%, sensitivity of 100% and a specificity of 100% in a window of 15 min prior to the seizure using the 150 seizure signal segments, 15 1 min intervals for the 10 epileptic conditions suffered by seven patients and 10 HG signal segments, outperforming the previous works reported in the literature. It should be noted that a large database is required to confirm whether the selected FBs and STFs can be used, so the proposal accuracy, specificity, and sensitivity are not degraded. Particularly, it is necessary to obtain data from young, teenagers, and senior patients to verify if the selected frequency bands still contain the information that, using the STFs, can determine if a patient can present a seizure or not. By confirming this information, the necessary calibration steps can be executed, if necessary, to ensure the best possible results.

Author Contributions

Conceptualization, A.V.P.-S. and J.P.A.-S.; investigation, resources, and visualization, A.D.-G., C.A.P.-R., M.V.-R. and J.P.A.-S.; formal analysis, A.V.P.-S., M.V.-R. and J.P.A.-S.; writing—original draft, review, and editing, all authors. All authors have read and agreed to the published version of the manuscript.

Funding

This work was partially supported by the Mexican Council of Science and Technology (CONACyT) under the scholarship 742275.

Conflicts of Interest

The authors declare no conflict of interest. Authors did not collect data from humans or animals. Data used in this research are from publicly available sources.

References

  1. Alarcón, G. What is epilepsy. In Introduction to Epilepsy; Cambridge University Press: Cambridge, UK, 2012; Volume 1, pp. 6–7. [Google Scholar]
  2. Siuly, S.; Li, Y. Discriminating the brain activities for brain–computer interface applications through the optimal allocation-based approach. Neural Comput. Appl. 2015, 26, 799–811. [Google Scholar] [CrossRef]
  3. Truccolo, W.; Donoghue, J.A.; Hochberg, L.R.; Eskandar, E.N.; Madsen, J.R.; Anderson, W.S.; Brown, E.N.; Halgren, E.; Cash, S.S. Single-neuron dynamics in human focal epilepsy. Nat. Neurosci. 2011, 14, 635–643. [Google Scholar] [CrossRef] [PubMed] [Green Version]
  4. World Health Organization (WHO). Epilepsy: A Public Health Imperative. 2019. Available online: https://www.who.int/mental_health/neurology/epilepsy/report_2019/en/ (accessed on 15 August 2020).
  5. England, M.J.; Liverman, C.T.; Schultz, A.M.; Strawbridge, L.M. Quality of Life and Community Resources. In Epilepsy Across the Spectrum: Promoting Health and Understanding; National Academies Press: Washington, DC, USA, 2012. [Google Scholar]
  6. Vaurio, L.; Karantzoulis, S.; Barr, W.B. The impact of epilepsy on quality of life. In Changes in the Brain; Springer: New York, NY, USA, 2017; pp. 167–187. [Google Scholar]
  7. Taghvayi, N.E.; Aazhang, B. Application of Embedded Dynamic Mode Decomposition on Epileptic Data for Seizure Prediction. In Proceedings of the Signals, Systems and Computers, Pacific Grove, CA, USA, 3–6 November 2019; pp. 1705–1708. [Google Scholar]
  8. Acharya, U.R.; Oh, S.L.; Hagiwara, Y.; Tan, J.H.; Adeli, H. Deep convolutional neural network for the automated detection and diagnosis of seizure using EEG signals. Comput. Biol. Med. 2018, 100, 270–278. [Google Scholar] [CrossRef] [PubMed]
  9. Sharif, B.; Jafari, A.H. Prediction of epileptic seizures from EEG using analysis of ictal rules on Poincaré plane. Comput. Methods Progr. Biomed. 2017, 145, 11–22. [Google Scholar] [CrossRef]
  10. Yuan, S.; Zhou, W.; Chen, L. Epileptic Seizure Prediction Using Diffusion Distance and Bayesian Linear Discriminate Analysis on Intracranial EEG. Int. J. Neural Syst. 2018, 28, 1750043. [Google Scholar] [CrossRef]
  11. Usman, S.M.; Latif, S.; Beg, A. Principle components analysis for seizures prediction using wavelet transform. Int. J. Adv. Appl. Sci. 2019, 6, 50–55. [Google Scholar]
  12. Usman, S.M.; Khalid, S.; Aslam, M.H. Epileptic seizures prediction using deep learning techniques. IEEE Access 2020, 8, 39998–40007. [Google Scholar] [CrossRef]
  13. Ibrahim, F.; El-Gindy, S.A.E.; El-Dolil, S.M.; El-Fishawy, A.S.; El-Rabaie, E.S.M.; Dessouky, M.I.; Abd El-Samie, F.E. A statistical framework for EEG channel selection and seizure prediction on mobile. Int. J. Speech Technol. 2019, 22, 191–203. [Google Scholar] [CrossRef]
  14. Truong, N.D.; Nguyen, A.D.; Kuhlmann, L.; Bonyadi, M.R.; Yang, J.; Ippolito, S.; Kavehei, O. Convolutional neural networks for seizure prediction using intracranial and scalp electroencephalogram. Neural Netw. 2018, 105, 104–111. [Google Scholar] [CrossRef] [Green Version]
  15. Cui, S.; Duan, L.; Qiao, Y.; Xiao, Y. Learning EEG synchronization patterns for epileptic seizure prediction using bag-of-wave features. J. Ambient Intell. Humaniz. Comput. 2018, in press. [Google Scholar] [CrossRef]
  16. Khan, H.; Marcuse, L.; Fields, M.; Swann, K.; Yener, B. Focal onset seizure prediction using convolutional networks. IEEE Trans. Biomed. Eng. 2017, 65, 2109–2118. [Google Scholar] [CrossRef] [PubMed] [Green Version]
  17. Kolsal, E.; Serdaroğlu, A.; Çilsal, E.; Kula, S.; Soysal, A.Ş.; Kurt, A.N.Ç.; Arhan, E. Can heart rate variability in children with epilepsy be used to predict seizures? Seizure 2014, 23, 357–362. [Google Scholar] [CrossRef] [PubMed] [Green Version]
  18. Lotufo, P.A.; Valiengo, L.; Benseñor, I.M.; Brunoni, A.R. A systematic review and meta-analysis of heart rate variability in epilepsy and antiepileptic drugs. Epilepsia 2012, 53, 272–282. [Google Scholar] [CrossRef] [PubMed]
  19. Lamberts, R.J.; Thijs, R.D.; Laffan, A.; Langan, Y.; Sander, J.W. Sudden unexpected death in epilepsy: People with nocturnal seizures may be at highest risk. Epilepsia 2012, 53, 253–257. [Google Scholar] [CrossRef] [PubMed]
  20. Jansen, K.; Lagae, L. Cardiac changes in epilepsy. Seizure 2010, 19, 455–460. [Google Scholar] [CrossRef] [PubMed] [Green Version]
  21. Popov, A.; Panichev, O.; Karplyuk, Y.; Smirnov, Y.; Zaunseder, S.; Kharytonov, V. Heart beat-to-beat intervals classification for epileptic seizure prediction. In Proceedings of the Signal Process: Symposium (SPSympo 2017), Jachranka, Poland, 12–14 September 2017; pp. 2–5. [Google Scholar]
  22. Pavei, J.; Heinzen, R.G.; Novakova, B.; Walz, R.; Serra, A.J.; Reuber, M.; Marques, J.L. Early seizure detection based on cardiac autonomic regulation dynamics. Front. Physiol. 2017, 8, 1–12. [Google Scholar] [CrossRef] [Green Version]
  23. Varon, C.; Caicedo, A.; Jansen, K.; Lagae, L.; Van Huffel, S. Detection of epileptic seizures from single lead ECG by means of phase rectified signal averaging. In Proceedings of the 36th Annual International Conference of the IEEE Engineering in Medicine and Biology Society (EMBC 2014), Chicago, IL, USA, 26–30 August 2014; pp. 3789–3790. [Google Scholar]
  24. Billeci, L.; Marino, D.; Insana, L.; Vatti, G.; Varanini, M. Patient-specific seizure prediction based on heart rate variability and recurrence quantification analysis. PLoS ONE 2018, 13, e0204339. [Google Scholar] [CrossRef]
  25. Giannakakis, G.; Tsiknakis, M.; Vorgia, P. Focal epileptic seizures anticipation based on patterns of heart rate variability parameters. Comput. Methods Progr. Biomed. 2019, 178, 123–133. [Google Scholar] [CrossRef]
  26. MIT/BIH-PIHROPE. Available online: https://physionet.org/content/szdb/1.0.0/ (accessed on 1 February 2020).
  27. Cao, F.; Budhota, A.; Chen, H.; Rajput, K.S. Feature matching-based ECG generative network for arrhythmia event augmentation. In Proceedings of the IEEE Engineering in Medicine & Biology Society (EMBC), Montreal, QC, Canada, 20–24 July 2020; pp. 296–299. [Google Scholar]
  28. Vargas-Lopez, O.; Amezquita-Sanchez, J.P.; De-Santiago-Perez, J.J.; Rivera-Guillen, J.R.; Valtierra-Rodriguez, M.; Toledano-Ayala, M.; Perez-Ramirez, C.A. A new methodology based on EMD and nonlinear measurements for sudden cardiac death detection. Sensors 2020, 20, 9. [Google Scholar] [CrossRef] [Green Version]
  29. Amezquita-Sanchez, J.P.; Valtierra-Rodriguez, M.; Adeli, H.; Perez-Ramirez, C.A. A Novel Wavelet Transform-Homogeneity Model for Sudden Cardiac Death Prediction Using ECG Signals. J. Med. Syst. 2018, 42, 1–15. [Google Scholar] [CrossRef]
  30. Nahak, S.; Saha, G. A fusion based classification of normal, arrhythmia and congestive heart failure in ECG. In Proceedings of the National Conference on Communications (NCC), Kharagpur, India, 21–23 February 2020; pp. 1–6. [Google Scholar]
  31. Fujita, H.; Acharya, U.R.; Sudarshan, V.K.; Ghista, D.N.; Sree, S.V.; Eugene, L.W.J.; Koh, J.E. Sudden cardiac death (SCD) prediction based on nonlinear heart rate variability features and SCD index. Appl. Soft Comput. J. 2016, 43, 510–519. [Google Scholar] [CrossRef]
  32. Chinara, S. Automatic classification methods for detecting drowsiness using wavelet packet transform extracted time-domain features from single-channel EEG signal. J. Neurosci. Methods 2020, 347, 108927. [Google Scholar]
  33. Wali, M.K. FFBPNN-based high drowsiness classification using EMG and WPT. Biomed. Eng. Appl. Basis Commun. 2020, 32, 1–9. [Google Scholar] [CrossRef]
  34. Walczak, B.; Massart, D.L. Noise suppression and spinal compression using the wavelet packet transform. Chemom. Intell. Lab. Syst. 1997, 36, 81–94. [Google Scholar] [CrossRef]
  35. Shestakov, O. Wavelet Thresholding risk estimate for the model with random samples and correlated noise. Mathematics 2020, 8, 377. [Google Scholar] [CrossRef] [Green Version]
  36. Rafiee, J.; Rafiee, M.A.; Prause, N.; Schoen, M.P. Wavelet basis functions in biomedical signal processing. Expert Syst. Appl. 2011, 38, 6190–6201. [Google Scholar] [CrossRef]
  37. Xia, Y.; Gao, Q.; Ye, Q. Classification of gait rhythm signals between patients with neuro-degenerative diseases and normal subjects: Experiments with statistical features and different classification models. Biomed. Signal Process. Control 2015, 18, 254–262. [Google Scholar] [CrossRef]
  38. Ghorbani Afkhami, R.; Azarnia, G.; Tinati, M.A. Cardiac arrhythmia classification using statistical and mixture modeling features of ECG signals. Pattern Recognit. Lett. 2016, 70, 45–51. [Google Scholar] [CrossRef]
  39. Hassan, A.R.; Bhuiyan, M.I. Automatic sleep scoring using statistical features in the EMD domain and ensemble methods. Biocybern. Biomed. Eng. 2016, 36, 248–255. [Google Scholar] [CrossRef]
  40. Wang, X.; Zheng, Y.; Zhao, Z.; Wang, J. Bearing fault diagnosis based on statistical locally linear embedding. Sensors 2015, 15, 16225–16247. [Google Scholar] [CrossRef]
  41. Caesarendra, W.; Tjahjowidodo, T. A Review of feature extraction methods in vibration-based condition monitoring and its application for degradation trend estimation of low-speed slew bearing. Machines 2017, 5, 21. [Google Scholar] [CrossRef]
  42. Yanez-Borjas, J.J.; Valtierra-Rodriguez, M.; Camarena-Martinez, D.; Amezquita-Sanchez, J.P. Statistical time features for global corrosion assessment in a truss bridge from vibration signals. Meas. J. Int. Meas. Confed. 2020, 160, 107858. [Google Scholar] [CrossRef]
  43. Abdullah, S. Wavelet Bump Extraction (WBE) for Editing Variable Amplitude Fatigue Loadings. Ph.D. Thesis, University of Sheffield United Kingdom, Sheffield, UK, 2005. [Google Scholar]
  44. Devore, J.L.; Berk, K.N. Overview and descriptive statistics. In Modern Mathematical Statistics with Applications; Springer: New York, NY, USA, 2013; pp. 1–49. [Google Scholar]
  45. Palaniswamy, U.R.; Palaniswamy, K.M. Teaching and Research in Plant and Crop Science; Food Products and The Haworth Refrence Press: New York, NY, USA, 2005. [Google Scholar]
  46. Kruskal, W.H.; Wallis, W.A. Use of ranks in one-criterion variance analysis. J. Am. Stat. Assoc. 1952, 47, 583–621. [Google Scholar] [CrossRef]
  47. Morales, J.F.; Willems, R.; Van Huffel, S.; Varon, C. Evaluation of the ECG Derived Respiration in the Presence of Irregular Heart Beats. In Proceedings of the 11th Conference of the European Study Group on Cardiovascular Oscillations (ESGCO), Pisa, Italy, 15 July 2020; pp. 20–21. [Google Scholar]
  48. Bajaj, V.; Taran, S.; Khare, S.K.; Sengur, A. Feature extraction method for classification of alertness and drowsiness states EEG signals. Appl. Acoust. 2020, 163, 107224. [Google Scholar] [CrossRef]
  49. Hecke, T.V. Power study of anova versus Kruskal-Wallis test. J. Stat. Manag. Syst. 2012, 15, 241–247. [Google Scholar] [CrossRef]
  50. Nisbet, R.; Miner, G.; Yale, K. What is classification. In Handbook of Statistical Analysis and Data Mining Applications, 2nd ed.; Nisbet, R., Miner, G., Yale, K., Eds.; Academic Press: Boston, MA, USA, 2018; pp. 169–186. [Google Scholar]
  51. Ardhapure, O.; Patil, G.; Udani, D.; Jetha, K. Comparative study of classification algorithm for text based categorization. Int. J. Res. Eng. Technol. 2016, 5, 217–220. [Google Scholar]
  52. Shobha, G.; Rangaswamy, S. Machine Learning. Handbook of Statistics, 1st ed.; Elsevier BV: Amsterdam, The Netherlands, 2018; Volume 38, pp. 197–228. [Google Scholar]
  53. Jukic, S.; Saracevic, M.; Subasi, A.; Kevric, J. Comparison of ensemble machine learning methods for automated classification of focal and non-focal epileptic EEG signals. Mathematics 2020, 8, 1481. [Google Scholar] [CrossRef]
  54. Joloudari, J.H.; Hassannataj Joloudari, E.; Saadatfar, H.; GhasemiGol, M.; Razavi, S.M.; Mosavi, A.; Nadai, L. Coronary artery disease diagnosis; ranking the significant features using a random trees model. Int. J. Environ. Res. Public Health 2020, 17, 731. [Google Scholar] [CrossRef] [Green Version]
  55. Wei, J.K.E.; Jahmunah, V.; Pham, T.H.; Oh, S.L.; Ciaccio, E.J.; Acharya, U.R.; Ramli, N. Automated detection of Alzheimer’s disease using bi-directional empirical model decomposition. Pattern Recognit. Lett. 2020, 135, 106–113. [Google Scholar] [CrossRef]
  56. Borah, P.; Ahmed, H.A.; Bhattacharyya, D.K. A statistical feature selection technique. Netw. Modl. Anal. Health Inform. Bioinform. 2014, 3, 55. [Google Scholar] [CrossRef]
  57. Rasoul Safavian, S.; Landgrebe, D. A Survey of Decision Tree Classifier Methodology. IEEE Trans. Syst. Man Cybern. Syst. 1990, 21, 660–674. [Google Scholar] [CrossRef] [Green Version]
  58. Polat, K.; Günes, S. Classification of epileptiform EEG using a hybrid system based on decision tree classifier and fast Fourier transform. Appl. Math. Compt. 2007, 187, 1017–1026. [Google Scholar] [CrossRef]
  59. Li, T.; Zhou, M. ECG classification using wavelet packet entropy and random forests. Entropy 2016, 18, 285. [Google Scholar] [CrossRef]
  60. Hamzenejad, A.; Jafarzadeh Ghoushchi, S.; Baradaran, V.; Mardani, A. A robust algorithm for classification and diagnosis of brain disease using local linear approximation and generalized autoregressive conditional heteroscedasticity model. Mathematics 2020, 8, 1268. [Google Scholar] [CrossRef]
  61. Willigenburg, N.W.; Daffertshofer, A.; Kingma, I.; Van Dieën, J.H. Removing ECG contamination from EMG recordings: A comparison of ICA-based and other filtering procedures. J. Electromyogr. Kinesiol. 2012, 22, 485–493. [Google Scholar] [CrossRef] [Green Version]
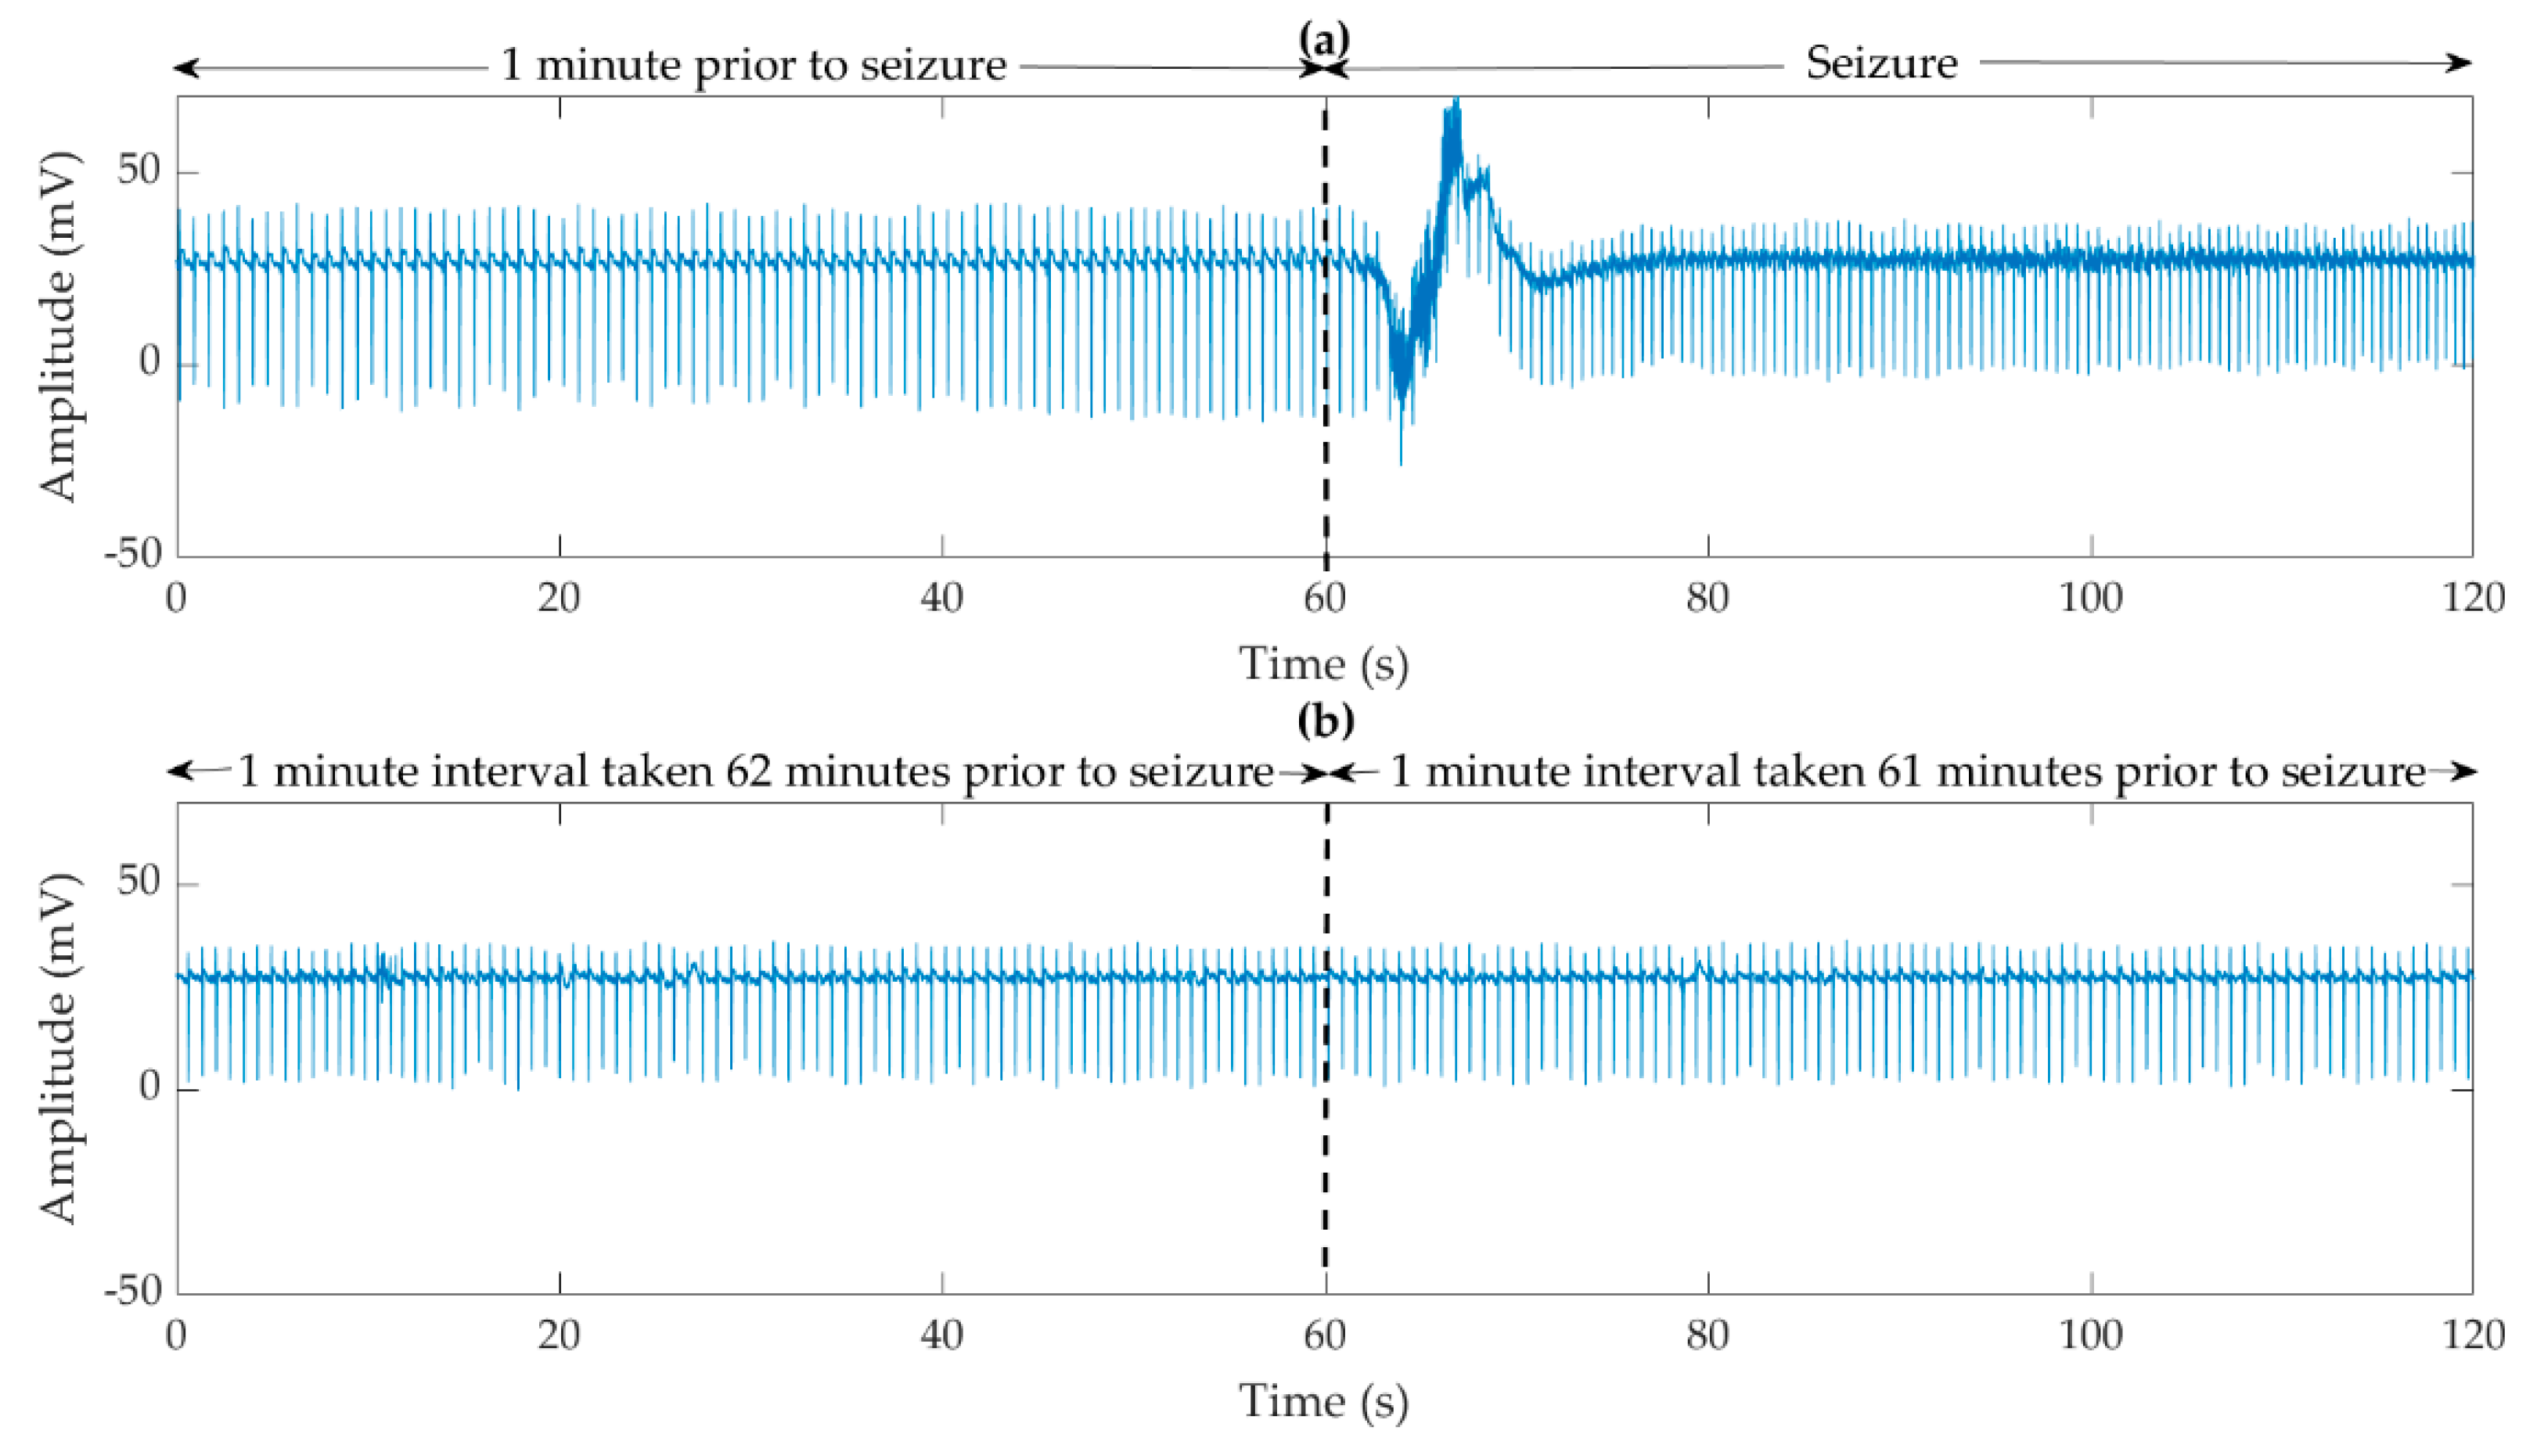
Figure 1. (a) Electrocardiogram (ECG) signal one minute before and after of seizure onset and (b) ECG signal taken from the normal or healthy group (signal obtained 1 h prior to the seizure onset).
Mathematics 08 02125 g001
Figure 2. Wavelet packet transform (WPT) decomposition tree.
Mathematics 08 02125 g002
Figure 3. Decision tree overview.
Mathematics 08 02125 g003
Figure 4. Proposed methodology block diagram.
Mathematics 08 02125 g004
Figure 5. Frequency bands (FBs) 1–16 obtained using WPT from the fifth-level decomposition from an ECG signal of (a) the normal group and (b) one minute prior to a seizure.
Mathematics 08 02125 g005
Figure 6. FBs 17–32 obtained using WPT from the fifth-level decomposition from an ECG signal of (a) the normal group and (b) one minute prior to a seizure.
Mathematics 08 02125 g006
Figure 7. Boxplot diagram of the STF values distribution for CF in FB 9, CF in FB 13, and IF in FB 12, for the ECG signals of the control group, denoted the healthy group (HG) and a focal seizure in 1 min intervals, starting from 1 min to fifteen minutes prior to a seizure. On each box, the vertical lines represent the minimum and maximum value of the data set, respectively, the horizontal red line indicates the data median, and the bottom and top edges of the box indicate the 25th and 75th percentiles, respectively.
Mathematics 08 02125 g007
Figure 8. Data distribution resulting from the Kruskal–Wallis method (KWM) for the healthy group, denoted by letters HG, and focal seizure in 1 min intervals, starting from 1 min to fifteen minutes prior to a seizure. (a) RMS, (b) LF, (c) K, (d) SFsmr, (e) R, (f) 5MO, (g) SMR, (h) M, (i) 6MO, (j) SFrms, (k) Var, (l) Me, (m) CF, (n) STD, (o) Md, (p) IF, and (q) Sk.
Mathematics 08 02125 g008
Table 1. Seizure onset time registered for each patient.
PatientSeizure Onset Time (Hours:Minutes:Seconds)
100:14:36
201:02:43
02:55:51
301:24:34
402:34:27
500:20:10
600:24:07
00:51:25
702:04:45
Table 2. p-values obtained using the KWM method.
1 min Intervalp-Value
CF (FB-9)CF(FB-13)IF (FB-12)
12.08 × 10−43.75 × 10−42.08 × 10⁻⁴
22.80 × 10−42.08 × 10−42.08 × 10⁻⁴
32.08 × 10−46.60 × 10−41.54 × 10⁻⁴
41.54 × 10−43.75 × 10−42.08 × 10⁻⁴
53.75 × 10−43.75 × 10−42.08 × 10⁻⁴
62.08 × 10−46.60 × 10−41.58 × 10⁻⁴
72.08 × 10−44.99 × 10−42.08 × 10⁻⁴
82.08 × 10−46.60 × 10−42.08 × 10⁻⁴
93.75 × 10−44.99 × 10−41.54 × 10⁻⁴
102.08 × 10−46.60 × 10−41.58 × 10⁻⁴
112.80 × 10−42.80 × 10−42.08 × 10⁻⁴
122.80 × 10−46.60 × 10−41.54 × 10⁻⁴
132.80 × 10−48.68 × 10−41.58 × 10⁻⁴
142.80 × 10−46.60 × 10−42.08 × 10⁻⁴
152.80 × 10−44.99 × 10−41.54 × 10⁻⁴
Table 3. Proposed methodology accuracy.
MinuteAccuracy (%)Minute Accuracy (%)MinuteAccuracy (%)
1100610011100
2100710012100
3100810013100
4100910014100
51001010015100
Table 4. Qualitative comparison between the proposal and recent methodologies.
WorkSignalMethodologyPrediction Time (Accuracy %)
Popov et al. [21]HRV
  • The authors removed the samples that have a variation of more than 25% from the interpolated mean of immediately preceding and following RR.
  • 112 features are used (i.e., histogram characteristics, spectral analysis, polynomial approximation coefficients, among others).
  • SVM is employed as classifier.
20 min (76.2%)
Pavei et al. [22]HRV
  • HRV is filtered in order to eliminate artifacts and ectopic heartbeats.
  • A cubic spline interpolation correction method was used to fill the removed data.
  • Forty-seven nonlinear indices are used (i.e., cardiovagal index, cardio sympathetic index and deviation standard of RR, power spectral density of low- and high-frequency, among others).
  • SVM is employed as classifier.
5 min (95.6%)
Varon et al. [23]RRI
  • Pan–Tompkins algorithm is used for obtaining the RR-interval time series (RRI) of ECG signals.
  • The phase rectified signal algorithm is extracted as a feature.
  • Kernel spectral clustering is employed as classifier.
30 s (86.1%)
Billeci et al. [24]RRI
  • A finite-state algorithm and an adaptive optimal filter in a predictive form is used to determine the RRI of the ECG signal.
  • Nineteen features are used (i.e., mean and deviation standard of RR intervals, power spectral density of low- and high-frequency range of signals, fractal dimension analysis, among other).
  • SVM is employed as classifier.
10 min (74.6%)
Giannakakis et al. [25]HRV
  • The authors calculated the RR intervals and then excluded ectopic heartbeats (a heartbeat is determined as ectopic if there is a percentage change of 40% over the averaged previous).
  • Eighteen diverse nonlinear methods used time-domain (i.e., heart rate, standard deviation of heart rate, among others) and frequency-domain (power in low and high frequency band, frequency of the high and low frequency band peak, among others).
  • SVM is employed as classifier.
21.8 s (77.1%)
This workECG
  • WPT in fifth level
  • CF and IF are used as features
  • DT is employed as classifier
15 min (100%)
Publisher’s Note: MDPI stays neutral with regard to jurisdictional claims in published maps and institutional affiliations.