Article

Transportation Optimization Models for Intermodal Networks with Fuzzy Node Capacity, Detour Factor, and Vehicle Utilization Constraints

1
Department of Industrial Engineering and Management, National Kaohsiung University of Science and Technology, Kaohsiung 80778, Taiwan
2
Department of Logistics and Supply Chain Management, Hong Bang International University, Ho Chi Minh 723000, Vietnam
3
School of Manufacturing Systems and Mechanical Engineering, Sirindhorn International Institute of Technology, Thammasat University, Pathum Thani 12121, Thailand
*
Authors to whom correspondence should be addressed.
Mathematics 2020, 8(12), 2109; https://doi.org/10.3390/math8122109
Submission received: 1 October 2020 / Revised: 23 October 2020 / Accepted: 11 November 2020 / Published: 26 November 2020
(This article belongs to the Special Issue Operations Research Using Fuzzy Sets Theory)

Abstract

:
This paper develops a mathematical model for intermodal freight transportation. It focuses on determining the flow of goods, the number of vehicles, and the transferred volume of goods transported from origin points to destination points. The model of this article is to minimize the total cost, which consists of fixed costs, transportation costs, intermodal transfer costs, and CO2 emission costs. It presents a mixed integer linear programming (MILP) model that minimizes total costs, and a fuzzy mixed integer linear programming (FMILP) model that minimizes imprecise total costs under conditions of uncertain data. In the models, node capacity, detour, and vehicle utilization are incorporated to estimate the performance impact. Additionally, a computational experiment is carried out to evaluate the impact of each constraint and to analyze the characteristics of the models under different scenarios. Developed models are tested using real data from a case study in Southern Vietnam in order to demonstrate their effectiveness. The results indicate that, although the objective function (total cost) increased by 20%, the problem became more realistic to address when the model was utilized to solve the constraints of node capacity, detour, and vehicle utilization. In addition, on the basis of the FMILP model, fuzziness is considered in order to investigate the impact of uncertainty in important model parameters. The optimal robust solution shows that the total cost of the FMILP model is enhanced by 4% compared with the total cost of the deterministic model. Another key measurement related to the achievement of global sustainable development goals is considered, reducing the additional intermodal transfer cost and the cost of CO2 emissions in the objective function.

1. Introduction

As a result of rapid global economic growth, many countries are being faced with overloaded transport networks. In developed countries, logistics costs account for around 10% of total transport costs, while in developing countries, this figure is 18%. Transport costs typically account for over 50% of overall logistics costs across the entire supply chain. The intermodal transportation system design considers the shipment of goods from their origins to their destinations using several modes of transport. The main characteristic of intermodal transport, and its substantial difference with respect to multimodal transport, is that every part of the process is contracted with a different provider. The transportation industry is rapidly changing as a result of globalization, the development of technology, and population growth. In order to reduce expenses, it is necessary to find faster and cheaper ways to transport freight between locations. However, it is difficult to attain optimal solutions, since multiple objective functions, such as minimization of transportation costs, CO2 emission costs, intermodal transfer costs, fixed costs, and congestion characteristics, need to be considered [1].
The main differences among the various modes of transportation include speed, loading and unloading capacity, and cargo safety. These factors contribute significantly to transportation performance, logistics systems, and the supply chain [2]. Intermodal transportation utilizes various modes of transportation to reduce the disadvantages and maximize the benefit of each model. The many advantages of intermodal transportation include more effective performance, decreased traffic jams, and reductions in the emission of CO2 to the atmosphere [3]. Most traditional logistics approaches have focused on reducing total transportation costs by determining the optimal shipment routing in the context of the constraints in the models. This research incorporates the development of intermodal transportation by combining several modes of transport, whereby the transferal of operation between these modes significantly affects overall logistics performance, resulting in additional intermodal transfer costs and CO2 emission costs with respect to the objective function of global sustainable development [4].
Terminal congestion usually occurs at terminals, inland container depots, and ports, where the goods are transferred between modes. Terminal congestion is characterized by slow speed and lengthy queuing, which result from the overutilization of infrastructure. Limiting the capability of the equipment can also generate congestion within facilities. Thus, congestion at terminals has a significant impact on transportation decisions, especially terminal allocation and route selection. Congestion resulting from excessive loading at the node, directly and indirectly, leads to inferior performance and additional costs. This study incorporates the capacity constraints at the node in order to limit traffic flows and thus improve operations, in order to provide a higher quality of service to customers [5,6].
The transportation routes for moving goods depend on the characteristics of the goods themselves, and the delivery time requirements of the customer, such that frozen and fresh foods are transported rapidly to consumer markets, while other products can be transported more slowly in order to save costs. The detour factor accounts for the additional distance that forms a part of intermodal transportation system performance. Intermodal transportations systems have many terminals at which goods can be transferred from one transportation mode to another. When there is some capacity left in a vehicle, drivers can travel to another terminal to pick up more goods, which may increase the travel distance and transportation time [7,8].
Capacity utilization of vehicles is defined in terms of the ratio between the amount that the vehicle is carrying and the maximum amount that the vehicle could carry. The efficient utilization of vehicles is one major factor that helps reduce the number of vehicles required, avoiding terminal congestion, which benefits the carriers. Therefore, the carrier must ensure the effective utilization of the vehicles and maintain a high degree of vehicle utilization [9].
This paper develops a mathematical model for intermodal freight transportation. The objective function of the model is the minimization of the total cost, which incorporates fixed costs, transportation costs, intermodal transfer costs, and CO2 emission costs. The requirements of stakeholders in the transportation network (port agents, customers, or carriers) are satisfied by different constraints. It is worth noting that this study is the first to simultaneously address node capacity, detour, and vehicle utilization constraints in a mathematical model of intermodal transportation. With respect to node capacity constraints, each node has a capability that limits many of the activities of vehicles, including transfer, sorting/resorting, loading/unloading goods. Node capacity constraints are added to reduce congestion at the considered nodes. Additionally, the delivery time is constrained by detour factors. This allows transfers to take place between modes of transport during their journey, e.g., from roads to inland waterways while ensuring that the weight average network distance of goods does not exceed the additional distance for each type of good, which is within the percentage of the distance (with the shortest path) over the network. Finally, the vehicle utilization constraints define the minimal desired utilization of used vehicles. These constraints require the capacity usage of vehicles to be at least 50%, thereby helping reduce the number of vehicles, avoiding terminal congestion, and ensuring the effective operation of carriers in the utilization of their vehicles.
The managerial implications of this paper can be clarified as follows. Carriers, customers, and cargo owners are expected to be beneficiaries of the node capacity constraint as a result of reducing terminal congestion during peak hours at the terminal and improving the delivery time of the goods. Facility operators, third-party logistics, and carriers are expected to be beneficiaries of the detour and vehicle utilization constraints due to the improvements in fuel costs, cargo safety, and logistics costs, to name a few. The Southern Vietnamese transportation system is used as a case study to illustrate how to apply the model in practice. There are two types of vehicles—trucks (road transport) and ships (inland waterways)—considered in this model. The main objective of this paper was to build a mathematical model and determine the transportation routes for all goods from their origins to their destinations across the network in such a way that good logistical performance is indicated. Furthermore, in terms of global sustainable development goals related to environmental problems, intermodal transfer costs and CO2 emission costs are crucial indicators to be measured and handled, accordingly.
The contributions of this paper are three-fold. First, the paper presents a mixed integer linear programming (MILP) model formulation that captures the common characteristics of the intermodal freight transportation, while other important aspects, including node capacity, detour, and vehicle utilization, are incorporated in order to estimate the performance impacts. Second, fuzziness in important node capacity is considered in a fuzzy mixed integer linear programming (FMILP) model in order to investigate the impacts of node capacity uncertainty. Finally, an analysis is conducted to compare different vehicle capacities and detour factors under various scenarios for both deterministic and fuzzy cases. These results can act as a useful reference for the Vietnamese government, logistics stakeholders, and international investors for the purpose of investing, designing, and improving logistics systems and appropriate strategies for achieving government goals toward global sustainability. Additionally, this could be utilized as a reference for other purposes.
This paper is divided into five sections. The first section gives an overview of the research background, a logical guide, the key points, and the overall objective of the research. The second section describes previous papers that are relevant with respect to intermodal transportation. The mathematical models, MILP and FMILP, are built and described in the third section. The fourth section presents a computational experiment to analyze the results of these two models under a variety of scenarios, and the last section presents a summary of all of the findings of this paper, along with ideas for some potential future research.

2. Literature Review

There have been many relevant studies about the multimodal transportation model in the past few decades. With intermodal systems, the contractors can save up to 18% of the truckload that amounts to a considerable monetary value. Intermodal transport, the incorporation, and combination of several modes for single or multi-goods, toward the sustainability, environmentally friendly, and ecological aspect of the green logistics systems, compared to the unimodal of transportation, meaning that the transport model only uses one mode such as rails or roads [10]. Logistics costs in Vietnam are still higher than the association of southeast Asian Nations (ASEAN) average, which has decreased its eligibility to participate in the global value chain. These costs reflected the inefficient logistics system of the country, which consist of logistics costs, logistics services, and logistics infrastructures [11]. This paper studies the problem in the intermodal transportation systems in Southern Vietnam, where road transport and inland waterways are the popular transportation modes. The purpose of solving the case study is to provide a general view of the transportation network in Southern Vietnam and offer insights into the status of the logistics systems of the country.
In this section, the benefits of intermodal transportation through previous studies are reviewed. Tahvanainen et al. [12] suggested the scenarios for shipping energy wood. The results showed that using truck mode was the optimal choice for a distance of less than 60 km. From 60 to 135 km, roadside chipping was the most efficient cost. From 135 to 165 km, the train was a more suitable selection with minimizing transport costs, depending on the fuel sources. As well, the optimal solution was the combination of roadside chipping, truck mode to the node, and train mode to the factory (intermodal freight transportation). Wiegmans et al. [13] built a model to compare the efficiency between road-only-mode and the intermodal inland waterways and roads. The results considerably improved the competitiveness of the transportation mode using inland waterways. Frémont et al. [14] showed results of combining road transport with other modes of transport (rails, waterways) could reduce transportation costs by around 10–20%. Concerning environmental effects, Craig et al. [15] evaluated the impacts of CO2 emissions to the atmosphere using intermodal freight transportation. The results showed that intermodal freight transportation reduced about 50% of the amount of CO2 emissions compared to truckload mode.
There have been many investigations on the design of the intermodal transportation system approaches, which consist of determining the transport routing and node locations for saving the transportation costs and lowering CO2 emissions of the environment. Limbourg et al. [16] used the p-hub median method to find the optimal coordinate for the European transport agency. Arnold et al. [17] proposed a mathematical model for the rail/road transportation system aiming to find the best allocation for a case study in the Iberian Peninsula. In addition, Van Duin et al. [18] studied the problem of hub location determination. The results are simulated to demonstrate the effectiveness of the model. Chang [19] proposed a mathematical model with an algorithm to solve the intermodal transportation under three problem characteristics, which are multi-objective multi-goods and multi-modal, schedule delivery time and terminal, and the economics of scale. Some mathematical programming approaches for the intermodal transport network were also presented through other previous studies. The framework of models for transport network design considered: (1) the transport systems design, (2) passageway, (3) hub logistics, (4) connected hubs, (5) direct transport routing, (6) indirect transport routing, and (7) dynamic transport routing [20,21,22,23,24].
Stochastic factors were considered in intermodal transportation, which are demand, node capacity, or transportation costs. Zadeh [25] presented the fuzzy set approach, and then it was applied to many research areas. For transportation network design, Bit et al. [26] proposed modeling of fuzzy linear programming in order to solve the intermodal transportation with multi-objective. Furthermore, Verma et al. [27] presented a model of non-linear membership functions to solve multi-objective transportation. Findings were compared to those obtained from the linear membership function. Ebrahimnejad [28] displayed the stochastics transportation network by the ranking concept of the fuzzy numbers. The main contribution of this research was to reduce the computational complexity of the previous approaches.
The node capacity has a high correlation to the terminal congestion at the transport node. At the node of intermodal, there are some activities of vehicles such as transferring, sorting/resorting, loading/unloading goods. Hence, node capacity and congestion significantly affect intermodal transportation performance. Capacity constraints were considered in previous studies. Rodríguez et al. [29] proposed an annealing algorithm to solve the hub location, which was considered capacity constraints. This paper also proposed a balanced module to reduce terminal congestion. Moreover, Elhedhli et al. [30] applied a Lagrangian heuristic to solve the problem of hub location with the constraint of traffic jams.
Detour factor was defined by the ratio between the length of additional distance and shortest paths from origins to destinations. The intermodal transportation system design considers changing transportation mode at a terminal. Hence, the detour factor is for shifting to a suitable transport for shipping goods [31]. There have been some related studies as follows. Ballou et al. [7] showed that the detour factor varies due to road network density, travel obstacles, and natural obstacles. Üster et al. [32] proposed a tabu search framework to consider tour length constraints for multi-zone truckload shipments. Moreover, Üster et al. [33] developed an efficient Bender’s decomposition-based approach to handle the large-size instances problems. This study considered driver tour lengths, load imbalance at relay points, the percentage circuity constraints, and provided a strategic design in truckload transportation.
Vehicle capacity utilization also is a factor that affects the performance of intermodal transportation. Sarkar et al. [34] proposed the mathematical formulation for determining the subset of suppliers in order to maximize the vehicle capacity utilization, as well as reduce the costs and delivery time. However, vehicle capacity utilization is based on customer demand, product characteristics, and schedule plans [35]. The vehicle utilization has been considered in several previous pieces of research as follows. McKinnon et al. [9] described the causes that affect trucks’ capacity utilization in transportation systems, which are the segment market, government regulation, logistics infrastructure, and packaging and handling equipment. For maritime transportation, Styhre [36] suggested that the vehicle capacity utilization is affected by routing characteristics (trade inequalities, demand fluctuation, competing locations, markets, customers, and cargo types). Maraš et al. [37] studied the utilization of the barge container. The results showed that 88% is the level to maximize the value of a freighting corporation. In addition, Gelareh et al. [38] demonstrated that the profit for the company was affected by 50–90% of the vessel capacity. Concerning vehicle routing problems, Goetschalckx et al. [39] proposed a two-phased solution methodology for reducing the number of trucks ordered and improving their capacity utilization. Kim et al. [40] studied the vehicle capacity in reverse logistics. The authors introduced vehicle routing methods to minimize transportation distance with a case study in South Korea.
This paper aims at filling some significant research gaps in the scope of intermodal transportation under study. To the best of our knowledge, this research is the first to solve node capacity, detour, and vehicle utilization constraints simultaneously in the mathematical model of intermodal transportation problems. The MILP model is formulated with the objective to minimize the total cost that includes fixed costs, transportation costs, intermodal transfer costs, and CO2 emission costs. The constraints representing the node capacity, detour, and vehicle utilization are incorporated to estimate the performance impacts under computational experiments. Moreover, the FMILP model is formulated for the problem to analyze the effects of node capacity fluctuation on the results. The case study is presented to demonstrate the operational performance of the intermodal system that combines roads and inland waterways in Southern Vietnam. The results can provide to the Vietnam government, logistics stakeholders, and international investors, a useful guideline to design and improve the logistics systems and some proper strategies for reaching the goals of the economy and many related fields. In addition, node capacity constraints help provide information about congested terminals for stakeholders, e.g., cargo owners, to push their goods to be shipped through more efficient routes and to address traffic congestion problems.

3. Mathematical Modeling

3.1. Problem Statement

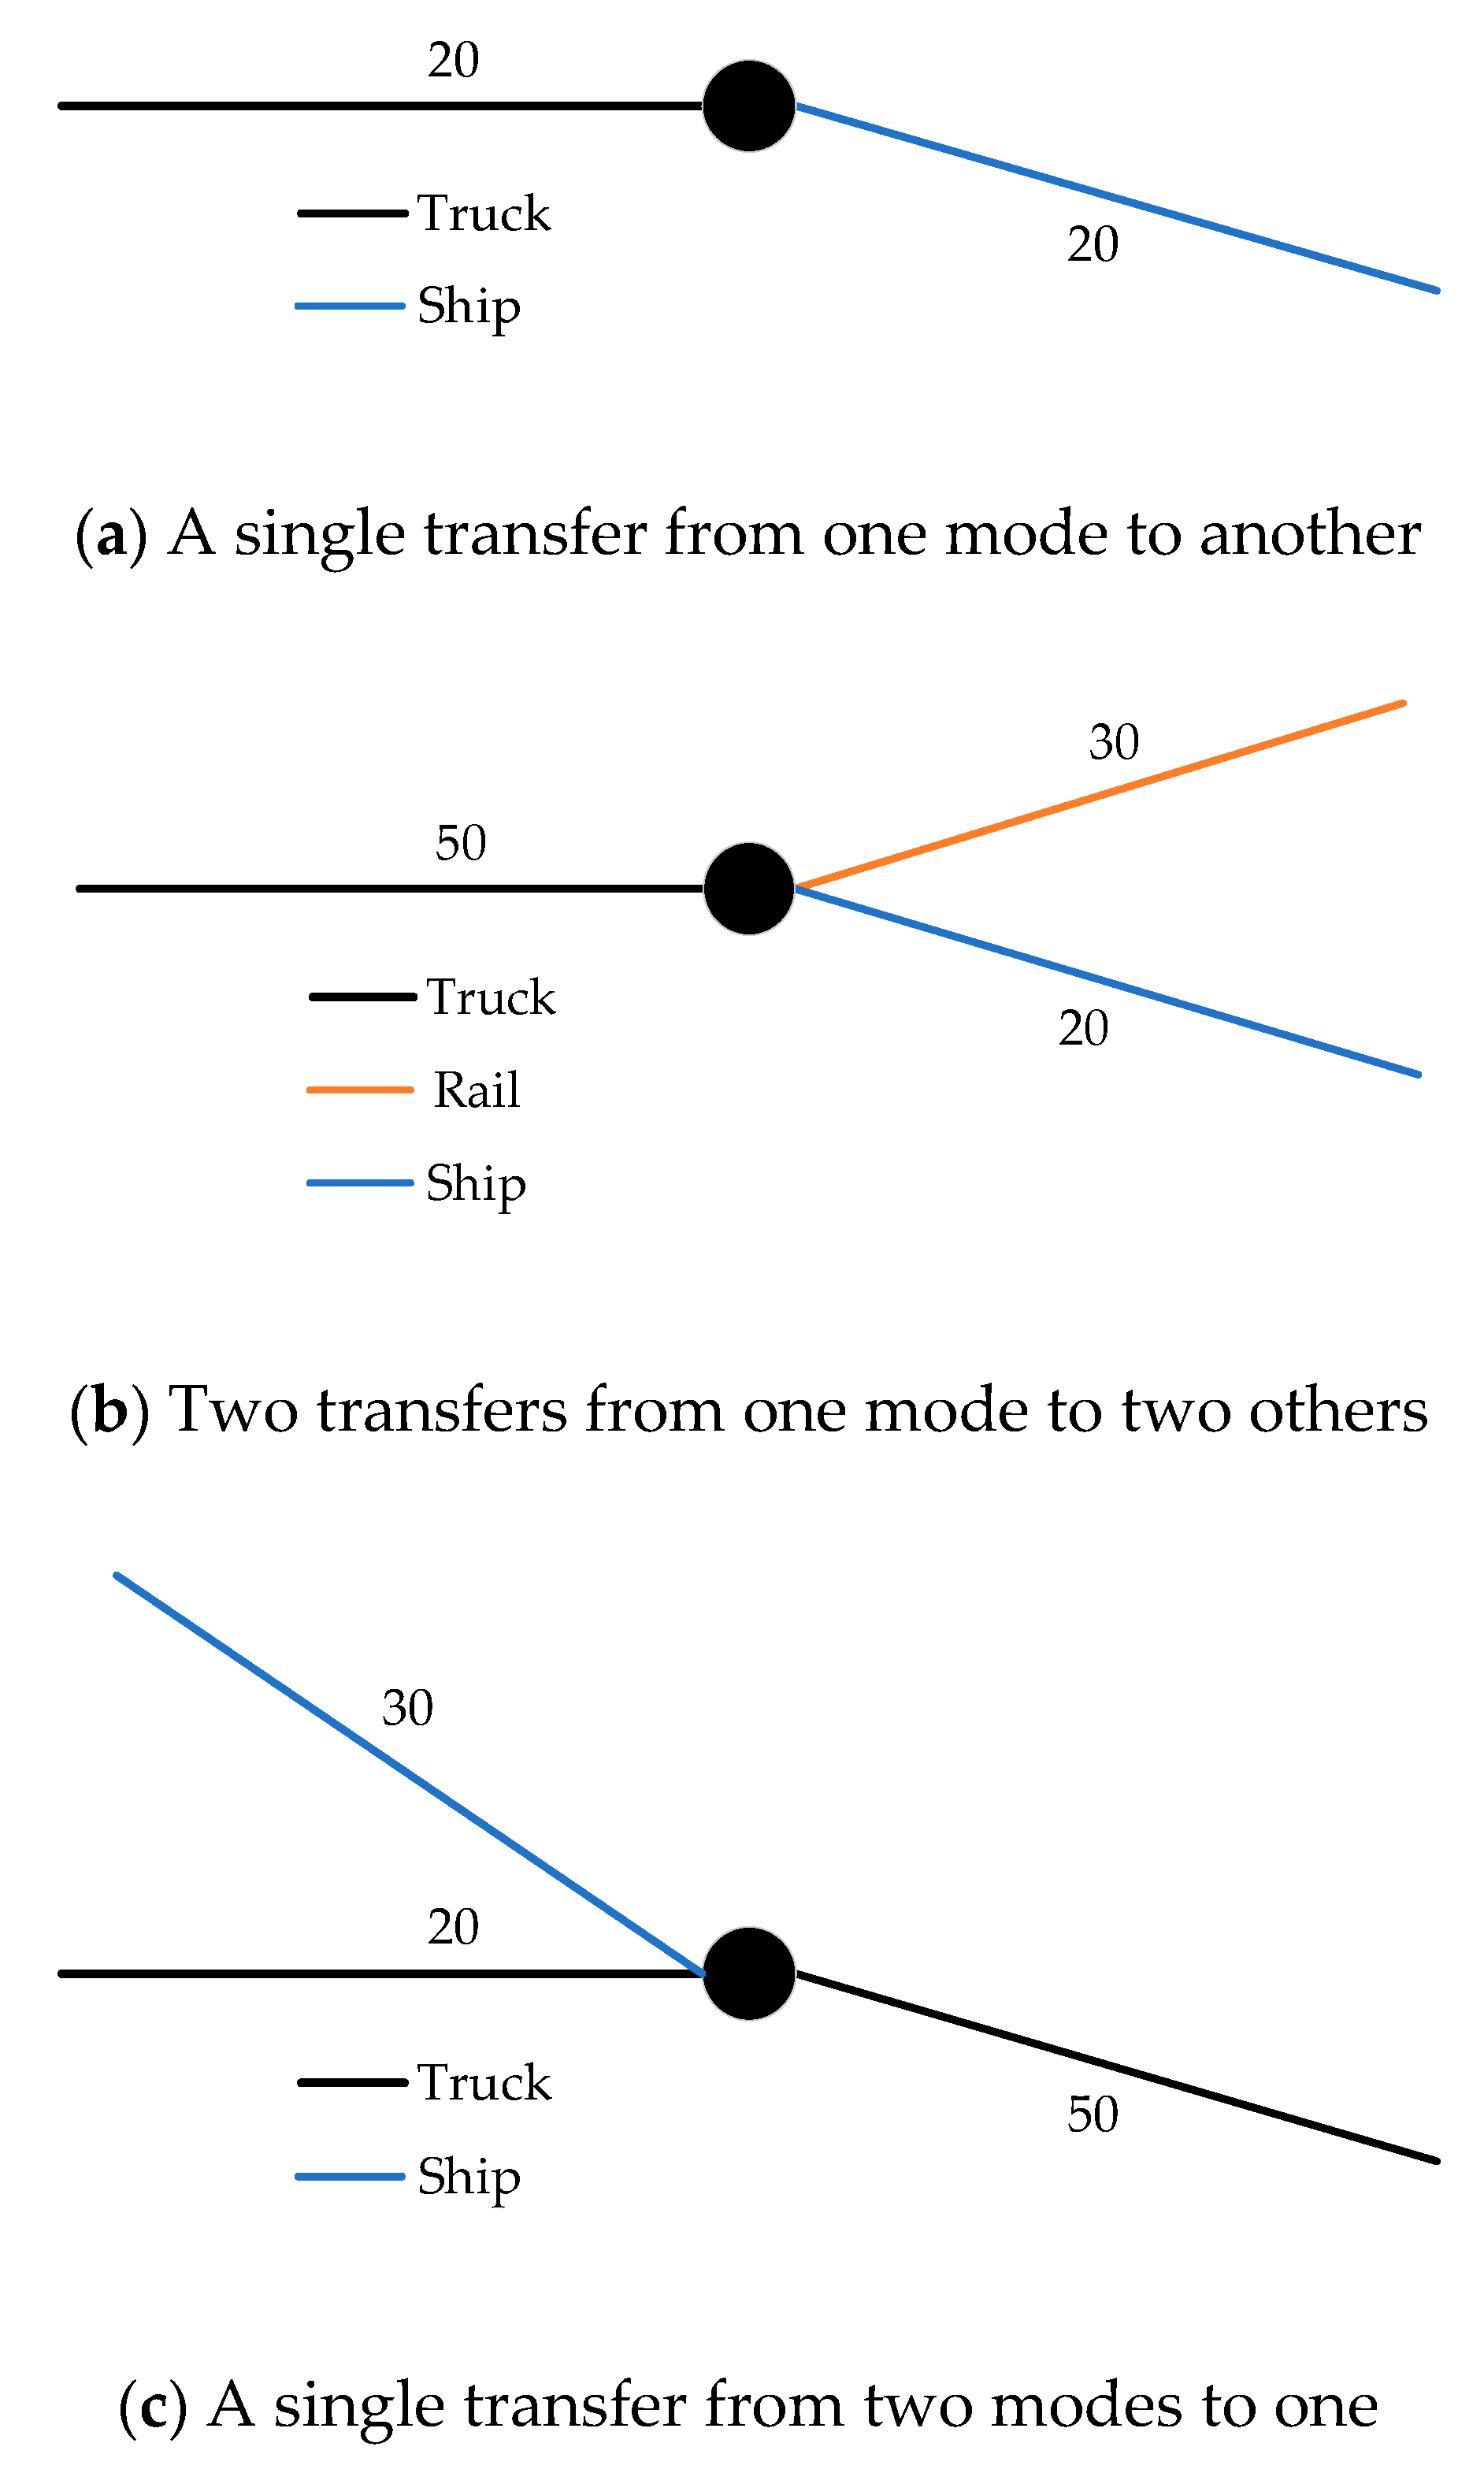
The problem characteristics assumed by examples in Figure 1 show how transfer occurs at an intermodal node. Figure 1a shows a single transfer from one mode of transport to other ones: 20 units of goods are carried by trucks; then, goods are converted to ship at the intermodal node, thus there is one transfer proceeding. Figure 1b shows two transfers from one mode to two others: 50 units of goods are carried to the intermodal terminal by trucks; at this terminal, goods are separated into two components—30 units of goods are carried by rails, and the rest of the goods are carried by ships; hence, two transfers are conducted in this case. Figure 1c shows a single transfer from two modes to one, there is one transfer conducted at the terminal: 50 units of goods (i.e., 30 units are carried by ships, 20 units are carried by trucks) are delivered into the intermodal terminal; one transfer is conducted; then, 30 units of goods in ships are converted to trucks, and the total amounts of goods are delivered to the next stage. This paper considered the case study in Southern Vietnam with two types of vehicles, trucks (roads) and ships (inland waterways), which are the conventional transportation modes in Southern Vietnam. The model development will produce how many transfers are allowed and what types of transportation modes, e.g., roads or inland waterways, are used to minimize total cost and satisfy all constraints. Daily demand for goods loaded/unloaded and transferred at nodes are considered.
In the model, node capacity, detour, and vehicle utilization are incorporated to estimate the performance impact. Fifteen nodes that express 15 provinces in Southern Vietnam are considered in the model. Each node has a capacity that limits many activities of vehicles such as transferring, sorting/resorting, and loading/unloading goods. Node capacity constraints are added to reduce congestion at a node. Detour factor is used to allow goods to be transported by more than one type of mode. This factor is used due to the nature of having many rivers in Southern Vietnam so that instead of using only roads to transport as done nowadays, this paper proposed to combine them with inland waterways. Moreover, the delivery time is controlled by detour constraints. That means, when using one transportation mode, it is considered as a direct route. Detour constraints allow vehicles to transfer from one mode of transport to other ones (e.g., from roads to inland waterways), yet forcing the weight average network distance of goods not to exceed the additional distance for each type of goods within the percentage of the distance (the shortest path) over the network. The vehicle utilization constraints force the capacity usage of vehicles to be at least 50%; hence, this helps to reduce amounts of vehicles to avoid terminal congestion and ensure the performance of using vehicles of carriers.
The following section presents a mathematical model of the MILP and FMILP models. In addition, these models are described by indices, sets, input parameters, decision variables, objective function, and constraints.

3.2. Mixed Integer Linear Programming (MILP)

3.2.1. Indices, Sets, and Input Parameters

To express the MILP and FMILP models, the notation of indices, sets, and input parameters are defined as given in Table 1.

3.2.2. Decision Variables

Table 2 shows the mathematical notation and explanation of decision variables. There are three decision variables, which are the flow of goods, the volume of vehicles, and transferred amounts of goods, transported from the original to destination points, as follows.

3.2.3. Mathematical Model

The MILP model includes the objective function and 11 constraints, which are described as follows.
M i n   Z = ( i , j ) A R m M O f i j m y i j m + g G O ( i , j ) A R m M O c i j m x i j g m d i j m + 1 2 α i N O g G O ( m M O z i g m h i g ) + g G O ( i , j ) A R m M O d i j m p m x i j g m
such that
j N O m M O x i j g m j N O m M O x j i g m = b i g , i N O , g G O  
b i g = { r g i = O g r g i = D g 0   o t h e r w i s e           a n d           h i g = { r g i = O g   o r   i = D g 0 o t h e r w i s e
g G O x i j g m u i j m y i j m , ( i , j ) A R , m M O  
j N O x i j g m j N O x j i g m z i g m , i N O , g G O , m M O    
j N O x j i g m j N O x i j g m z i g m , i N O , g G O , m M O    
j N O m M O g G O x i j g m + j N O m M O g G O x j i g m E i , i N O
1 r g ( i , j ) A R m M O d i j m x i j g m g S D O g D g , g G O
g G O x i j g m φ u i j m y i j m , ( i , j ) A R , m M O  
x i j g m 0 , ( i , j ) A R , m M O , g G O  
y i j m { 0 ,   1 ,   2 , } , ( i , j ) A R , m M O
z i g m 0 , i N O , g G O , m M O    
In the MILP model, Equation (1) presents the objective function for minimizing the considered total cost. Equation (2) represents the flow conservation balance for each node and goods. Equation (3) expresses demand requirements that determine if a terminal is an origin or destination of goods. Equation (4) forces that the total flow of goods must not exceed vehicle capacity. Equations (5) and (6) represent the transfer of the loading and unloading amount for all modes, goods, and nodes. Equation (7) expresses the node capacity constraints that ensure that the total flow of goods must not exceed the node capacity. Equation (8) is the constraints of detour factors, which implies that the weight average network distance of goods must not exceed the additional distance for each good, which is within a percentage ( %) of the distance (with the shortest path) over the network. Equation (9) states the minimum desired utilization of used vehicles. Equations (10) and (12) force that the flows of goods and transferred amounts are all positive variables. Equation (11) is the integer requirement for the number of vehicles.

3.3. Fuzzy Mixed Integer Linear Programming (FMILP)

3.3.1. Modeling Imprecise Node Capacity

In many cases, input data applied in the MILP model are subjected to uncertainties. In particular, demand and node capacity, which are predicted by experts or are fuzzy. For the FMILP model, the notation for fuzzy data is similar to the ones in the MILP model. A tilde symbol ( ~ ) is placed above the parameter symbols to represent imprecise data.
In this study, the node capacity is considered a fuzzy parameter because it depends on the efficient operation of resources that change with time. The fuzzy node capacity is represented by E i ˜ and the FMILP model as follows.
M i n   Ξ   = ( i , j ) A R m M O f i j m y i j m + g G O ( i , j ) A R m M O c i j m x i j g m d i j m + 1 2 α i N O g G O ( m M O z i g m h i g ) + g G O ( i , j ) A R m M O d i j m p m x i j g m
such that
j N O m M O x i j g m j N O m M O x j i g m = b i g , i N O , g G O  
b i g = { r g i = O g r g i = D g 0   o t h e r w i s e           a n d           h i g = { r g i = O g   o r   i = D g 0 o t h e r w i s e
g G O x i j g m u i j m y i j m , ( i , j ) A R , m M O  
j N O x i j g m j N O x j i g m z i g m , i N O , g G O , m M O    
j N O x j i g m j N O x i j g m z i g m , i N O , g G O , m M O    
j N O m M O g G O x i j g m + j N O m M O g G O x j i g m E i ˜ , i N O
1 r g ( i , j ) A R m M O d i j m x i j g m g S D O g D g , g G O
g G O x i j g m φ u i j m y i j m , ( i , j ) A R , m M O  
x i j g m 0 , ( i , j ) A R , m M O , g G O  
y i j m { 0 ,   1 ,   2 , } , ( i , j ) A R , m M O
z i g m 0 , i N O , g G O , m M O    

3.3.2. Defuzzified Procedures

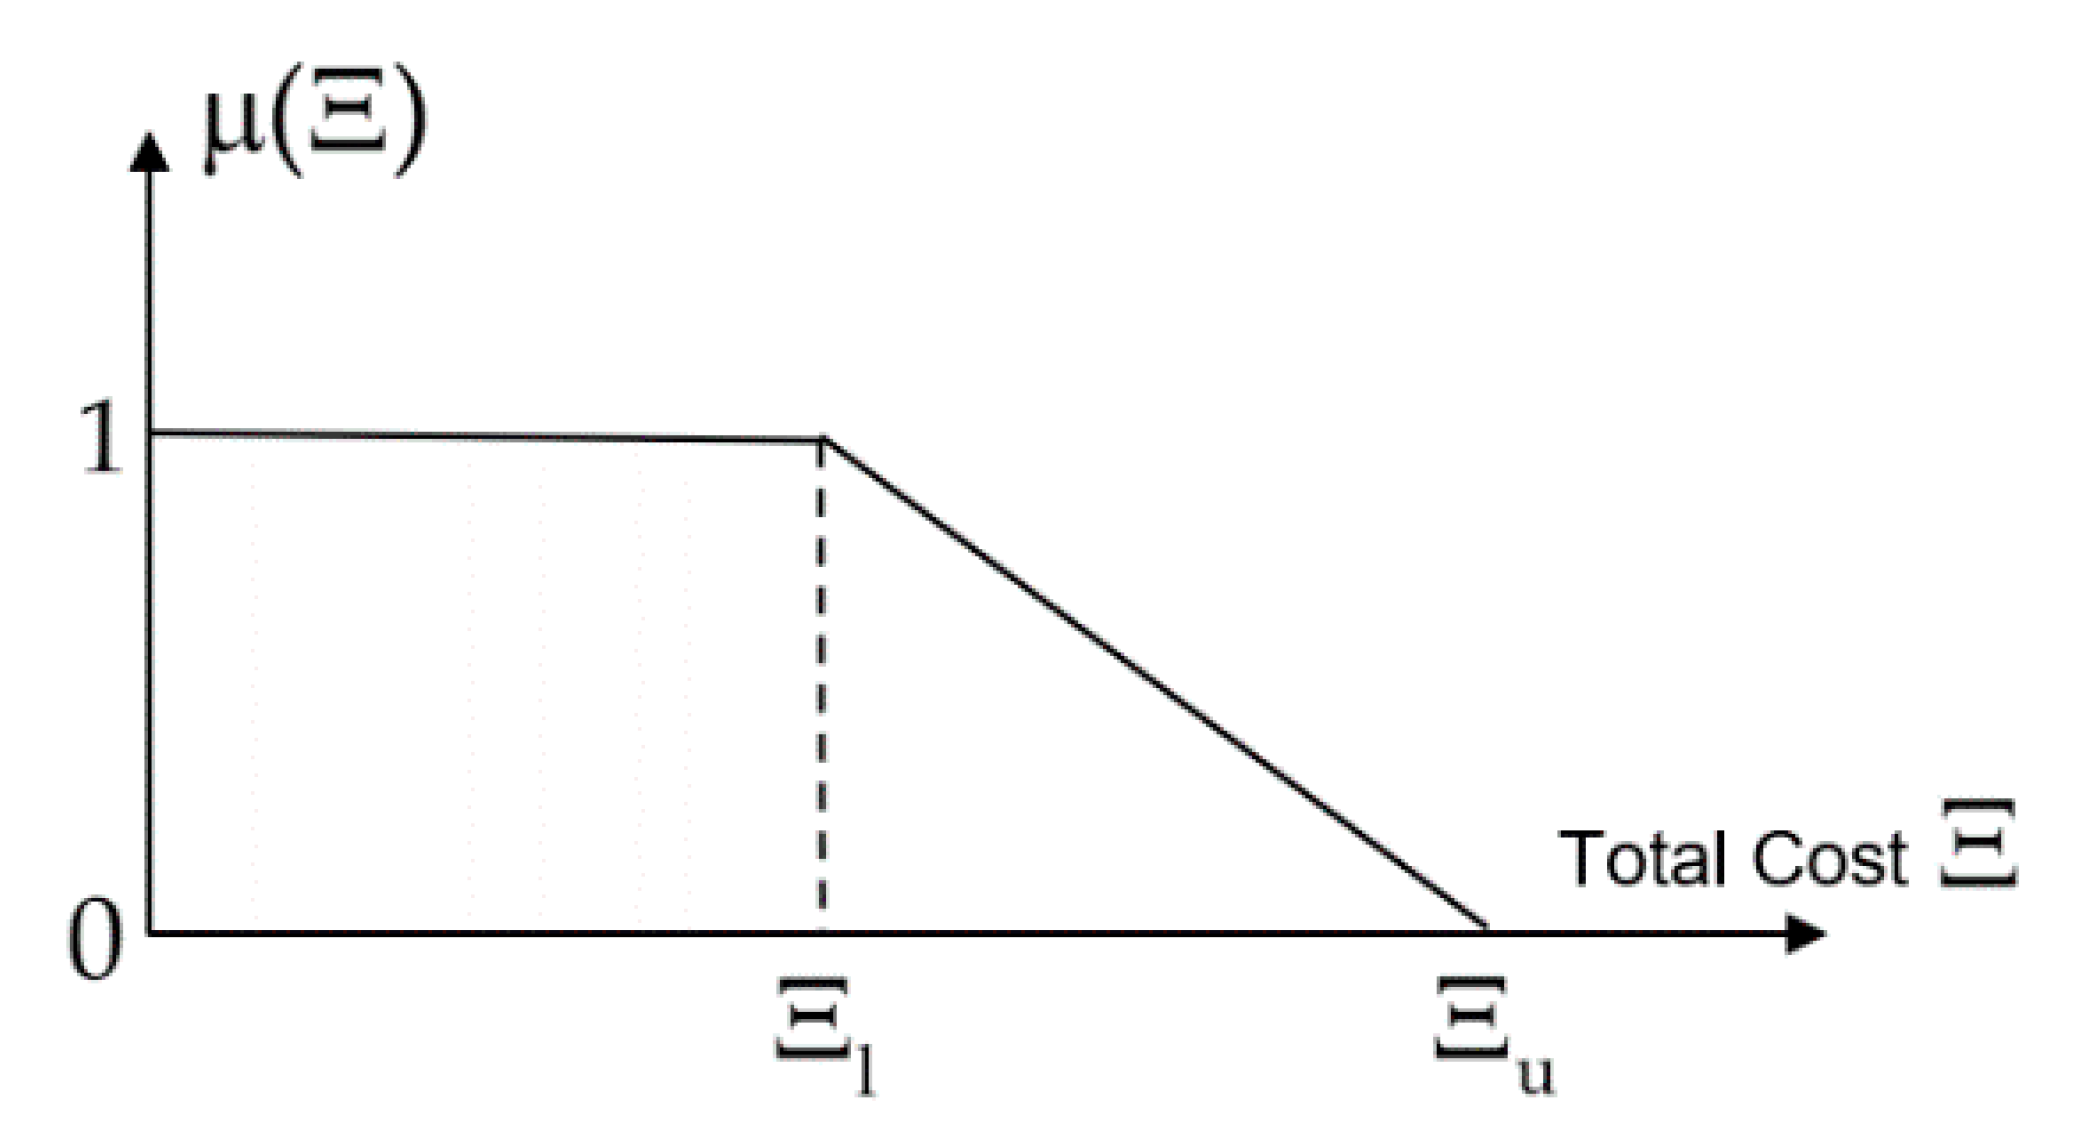
The fuzzy model can be linearized using fuzzy subset procedures, decision-making in a fuzzy environment, and fuzzy linear programming with a multi-objective function [41,42,43]. Assume that the fuzzy capacity in a node fluctuates as 100 ( 1 e ) % of the node capacity, where the values of e = 0.2, 0.3, 0.4, 0.5. The membership function of fuzzy node capacity constraints such that the most possible value of the fuzzy node capacity when it is within 100 ( 1 e ) % of the node capacity definitely belongs to the set of available values (possibility degree = 1 if normalized). In contrast, the possibility degree decreases to 0 when the fuzzy node capacity reaches the value of node capacity. In other words, the most optimistic value of the fuzzy node capacity when it is equal to E i ˜ has a very low likelihood of belonging to the set of available values (possibility degree = 0 if normalized) [44,45]. Hence, this paper uses an asymmetric trapezoidal membership function of fuzzy node capacity constraint, as can be seen in Figure 2.
The constraint involving the node capacity in the FMILP model is presented in Equation (25).
t i j N O m M O g G O x i j g m + j N O m M O g G O x j i g m E i , ˜ i N O
The corresponding linear membership function of fuzzy node capacity constraint is described in Equation (26).
µ E i ( t i ) = { 1 t i < ( 1 e ) E i E i t i e E i ( 1 e ) E i t i E i 0   t i > E i , i N O
To get the lower bound, the below sub-mathematical model is solved.
M i n   Ξ   1 = ( i , j ) A R m M O f i j m y i j m + g G O ( i , j ) A R m M O c i j m x i j g m d i j m + 1 2 α i N O g G O ( m M O z i g m h i g ) + g G O ( i , j ) A R m M O d i j m p m x i j g m
such that
j N O m M O g G O x i j g m + j N O m M O g G O x j i g m E i , i N O
and Equations (14)–(18), (20)–(24).
To get the upper bound, the below sub-mathematical model is solved.
M i n   Ξ   2 = ( i , j ) A R m M O f i j m y i j m + g G O ( i , j ) A R m M O c i j m x i j g m d i j m + 1 2 α i N O g G O ( m M O z i g m h i g ) + g G O ( i , j ) A R m M O d i j m p m x i j g m
such that
j N O m M O g G O x i j g m + j N O m M O g G O x j i g m ( 1 e ) E i , i N O
and Equations (14)–(18), (20)–(24).
The objective of the model gets values between Ξ 1 and Ξ 2 while node capacities fluctuate between E i and ( 1 e ) E i . Let Ξ l = m i n ( Ξ 1 , Ξ 1 ) and Ξ u = m a x ( Ξ 1 , Ξ 1 ) , then Ξ l and Ξ u are the lower bounds and upper bounds of the optimal values, respectively.
The fuzzy set of optimal values is a subset of the trapezoidal function, as seen in Figure 3.
µ ( Ξ ) = { 1 Ξ < Ξ l Ξ u Ξ Ξ u Ξ l Ξ l Ξ Ξ u 0 Ξ u < Ξ

3.3.3. Converted FMILP Model

Therefore, the FMILP model can be converted into the following linear programming model.
M a x   λ
such that
λ ( Ξ u Ξ l ) + Ξ Ξ u 0 , Ξ   = ( i , j ) A R m M O f i j m y i j m + g G O ( i , j ) A R m M O c i j m x i j g m d i j m + 1 2 α i N O g G O ( m M O z i g m h i g ) + g G O ( i , j ) A R m M O d i j m p m x i j g m
λ e E i E i + j N O m M O g G O x i j g m + j N O m M O g G O x j i g m 0 , i N O
0 λ 1
and Equations (14)–(18), (20)–(24).

4. Computational Experiments

In this paper, the models in the deterministic and fuzzy problem, i.e., MILP and FMILP, are solved using CPLEX with C++ and Concert Technology (ILOG, Inc.). All computational experiments were run on the computer with Intel Core i7-2.6 GHz and 8GB RAM.

4.1. Description of Case Study

4.1.1. Demand

Demand for transport and economic development are closely related. In Vietnam, the gross domestic product (GDP) maintained high growth rates with an average of 7.2% per year over the past 20 years and encouraged by the increasingly deeper integration of the nation into the global economy. It has contributed to an ever-increasing demand for freight transportation. The southern key economic zone (SKEZ) has the most active economic zone across the country. It is known as an industrial center, attracting the highest foreign direct investment (FDI) due to the favorable investment climate [46]. In the southern region, there are a variety of high-value goods such as rice, sugar, fertilizer, fishery products, meats, cement, steel, wood, to name a few. [47].
The model has experimented with data in Southern Vietnam, which consists of the majority of inland waterways and roads. The network includes 15 nodes that indicate important provinces in Southern Vietnam. They are randomly allocated as the origin or destination points of 30 different main types of goods to be shipped back and forth among their sources and destinations. The considered nodes of 15 provinces in Southern Vietnam are presented in Table 3, and demand was estimated in Table 4 (unit: ton per day). In addition, road and inland waterway distance among nodes are taken from the study of the World Bank and other sources [47,48,49], and the shortest path distance between two nodes (road-inland waterway distance) is calculated using Dijkstra’s algorithm [50,51,52,53].

4.1.2. Vehicle Capacity

Road infrastructure in Southern Vietnam regulates the maximum allowed truckload, which is 20 tons per truck [47]. Table 5 shows the deadweight tonnage (DWT) that indicates the carrying capacity of a ship. Concerning ship amount, ship class “5–15” and “15–50” have the highest amounts; 53,239 and 23,902 in 2010, respectively. The growth rates from 2005–2010 of ship class “700–1000” and “ > 1000” are 5.49 and 20.47, respectively. Following this analysis, in this paper, the ship capacity is considered 1000 tons. In terms of economy of scale, a ship must carry at least 50–60% or more of the full capability to achieve the optimal profit. If the volume is less than 50% of the ship’s capacity, the model refers to choose road transport [47]. Hence, constraint (9) in the model represents the vehicle capacity utilization, forcing the utilization of vehicles to be at least φ percent of the full vehicle capacity (φ = 50%).

4.1.3. Cost Element

The unit intermodal transfer cost is estimated to be $2 (per ton) as reported by the cost unit of loading and unloading amount on the fleet operational data [47,54]. The unit fixed cost is calculated by the loading/unloading cost per ton and the operating wages cost. Based on “Circular No. 261/2016/TT-BTC” from the Ministry of Finance, the unit operating wage cost was estimated, which also includes maritime charges [55]. Table 6 shows the unit fixed cost of combination for trucks and ships. In the computational experiment, 24 instances were tested to see the impacts of fixed costs on the results, including six instances of road fixed costs and four instances of inland waterways.
For the transportation costs, the data are used as $0.1 per ton-km (for trucks) and $0.028 per ton-km (for ships) [56]. In addition, the unit CO2 emission cost was calculated from the “Vietnam ratifies Paris Agreement on climate change” [57]. This agreement acted as a move towards the goals of carbon reduction to help mitigate climate change. As stated in the Economic and Social Commission for Asia and the Pacific, the carbon tax is $10 per ton of released CO2 emissions. The amount of CO2 emissions per ton-km are defined as $0.0005654 per ton-km for trucks and $0.000444 per ton-km for ships [47].

4.1.4. Node Capacity

The node capacity was defined according to the capacity of loading and unloading at the port, which can directly affect the transferred quantity of goods through inland waterways. The port capacity in Southern Vietnam [58] is presented in Table 7.

4.1.5. Detour Factor Assumption

The detour factor is used to measure the delivery time of goods. Detour factors allow vehicles to transfer from one mode of transport to other ones, e.g., from roads to inland waterways. In this paper, the assumption of the detour factor for goods is described as follows. The first five goods are fresh food that must be delivered quickly to the customer (no detour factor) as the value of the detour factor is 1. Hence, roads were the only mode of transport to be selected to ship goods. For the rest of the goods, the authors allow a detour constraint to limit the additional transportation distance to ensure on-time delivery (detour factor values are 1.3, 1.4, 1.6, 1.8, 2, respectively). It is noted that small detour factors ensure that vehicles choose shorter routes to transport goods. Moreover, shipments are allowed to take a longer time, so that long detour distance may be a better selection to minimize the total cost while negligibly affecting the allowed delivery time. Detour factors for goods are shown in Table 8.

4.2. Results of Mixed Integer Linear Programming (MILP) Model

This section presents the set-up of a computational experiment. The study was phased by adding the constraints one by one to observe their effects. The base case is the basic model that includes the restrictions on the flow conservation and arcs capacity, Equations (1)–(6), and Equations (10)–(12). Case 1 is the base case model with the node capacity constraints, Equation (7). Case 2 is case 1 with the detour factor as in Equation (8), and case 3 is case 2 with the vehicle utilization shown in Equation (9). Table 9 summarized the step-by-step development of these models.
In the computational experiment, 24 instances were tested to see the impacts of fixed costs on the results of the models, which include six instances of road fixed costs and four instances of inland waterways. The unit fixed cost is calculated by the loading/unloading cost per ton and the operating wages cost. The unit operating wage cost was estimated, which also includes maritime charges. The objective of the computational experiment was to consider the impact of each additional constraint (node capacity, detour factor, vehicle utilization) and 24 instances of fixed costs on the performance of the intermodal system that combines roads and inland waterways.

4.2.1. Unimodal and Intermodal Model

In this section, the results of the unimodal and intermodal transportation model with roads and inland waterways (IWW) were evaluated and compared to measure the effectiveness of the intermodal transportation system design (ITSD).
From the results in Table 10 (instance 1, 5, 9, 13, 17, 21), when the unit fixed cost of trucks and ships are $150 and $3000 (instance 1), the transport cost for roads, inland waterways, and intermodal transportation are $302,733, $104,084, and $105,965. In this instance, intermodal transportation is 65% less costly than roads, and 2% more costly than inland waterways. The transport cost of all instances for road transport is the same when the unit fixed cost increases. For inland waterways, when the unit fixed cost increase, the transport cost also increases. For intermodal transportation, transport cost increases when the unit fixed cost of trucks and ships increases.
In instance 1, for intermodal transportation, the fixed cost is $97,200. That is smaller than 40% and 7% compared to the fixed costs of roads and inland waterways, respectively. The fixed costs of roads and inland waterways increase when the unit fixed costs for trucks and ships increase. For the intermodal transportation, when the unit fixed costs of trucks and ships increase from $150 and $3000 (instance 1) to $200 and $4000 (instance 2), the total cost changes from $97,200 to $127,800, a 31% increase. Hence, the fixed cost has a considerable impact on the total cost.
For roads, the CO2 emission cost remains unchanged when the unit fixed cost increases. For inland waterways, the CO2 emission cost increases when the unit fixed cost increases. For intermodal transportation, when the unit fixed cost changes from instance 1 to another, the CO2 emission cost fluctuates only slightly. CO2 emission costs of roads and inland waterways are higher than the intermodal model because of the higher unit CO2 emission cost for trucks (higher than for ships). Intermodal transport, therefore, can be seen as a more environmentally friendly option.
Intermodal transfer costs only appear when the goods are transferred from one transportation mode to another. It comprises only a small portion of the total cost. Intermodal transfer costs increase slightly when the unit fixed cost increases.
As in Table 11, the total cost of the unimodal was higher than the intermodal. In instance 1, when the unit fixed costs for trucks and ships are $150 and $3000, the total cost of intermodal is $205,218, which is 56% less than the total cost for roads and 3% less than the total cost for the inland waterways. When the unit fixed cost for trucks and ships are $160 and $8000 (instance 8), the total cost for intermodal is 31% less than the total cost for roads and 14% less than by inland waterways. Hence, when the unit fixed cost increases, both the total cost for intermodal and unimodal increases. In summary, an intermodal model that combines roads and inland waterways is environmentally and economically better than using only one mode of transport.

4.2.2. Node Capacity

Table 12 shows the total flow, consisting of incoming and outgoing goods at the terminal, of the base case, and case 1 under the effect of the node capacity constraint.
From the results, the majority of the total flow is reduced when the node capacity constraint is included. In detail, node 7 (TraVinh), node 10 (AnGiang/KienGiang), and node 11 (CanTho) are analyzed, where the total flow almost exceeds the node capacity. At node 10, the total flow with node capacity exceeds the base case, indicating regular congestion during peak hours. At node 7, the node capacity is higher than 89% of the total flow of the base case, but there is no flow in case 1, indicating that congestion is highly likely to occur only during peak hours with traffic fluctuation. The result, therefore, implies that a facility should be upgraded to node 7 to improve the node capacity. Alternatively, it is possible to reduce the capacity parameter such that the model can direct those products using node 7 to other nodes and leave extra storing buffer at node 7.

4.2.3. Detour Factor

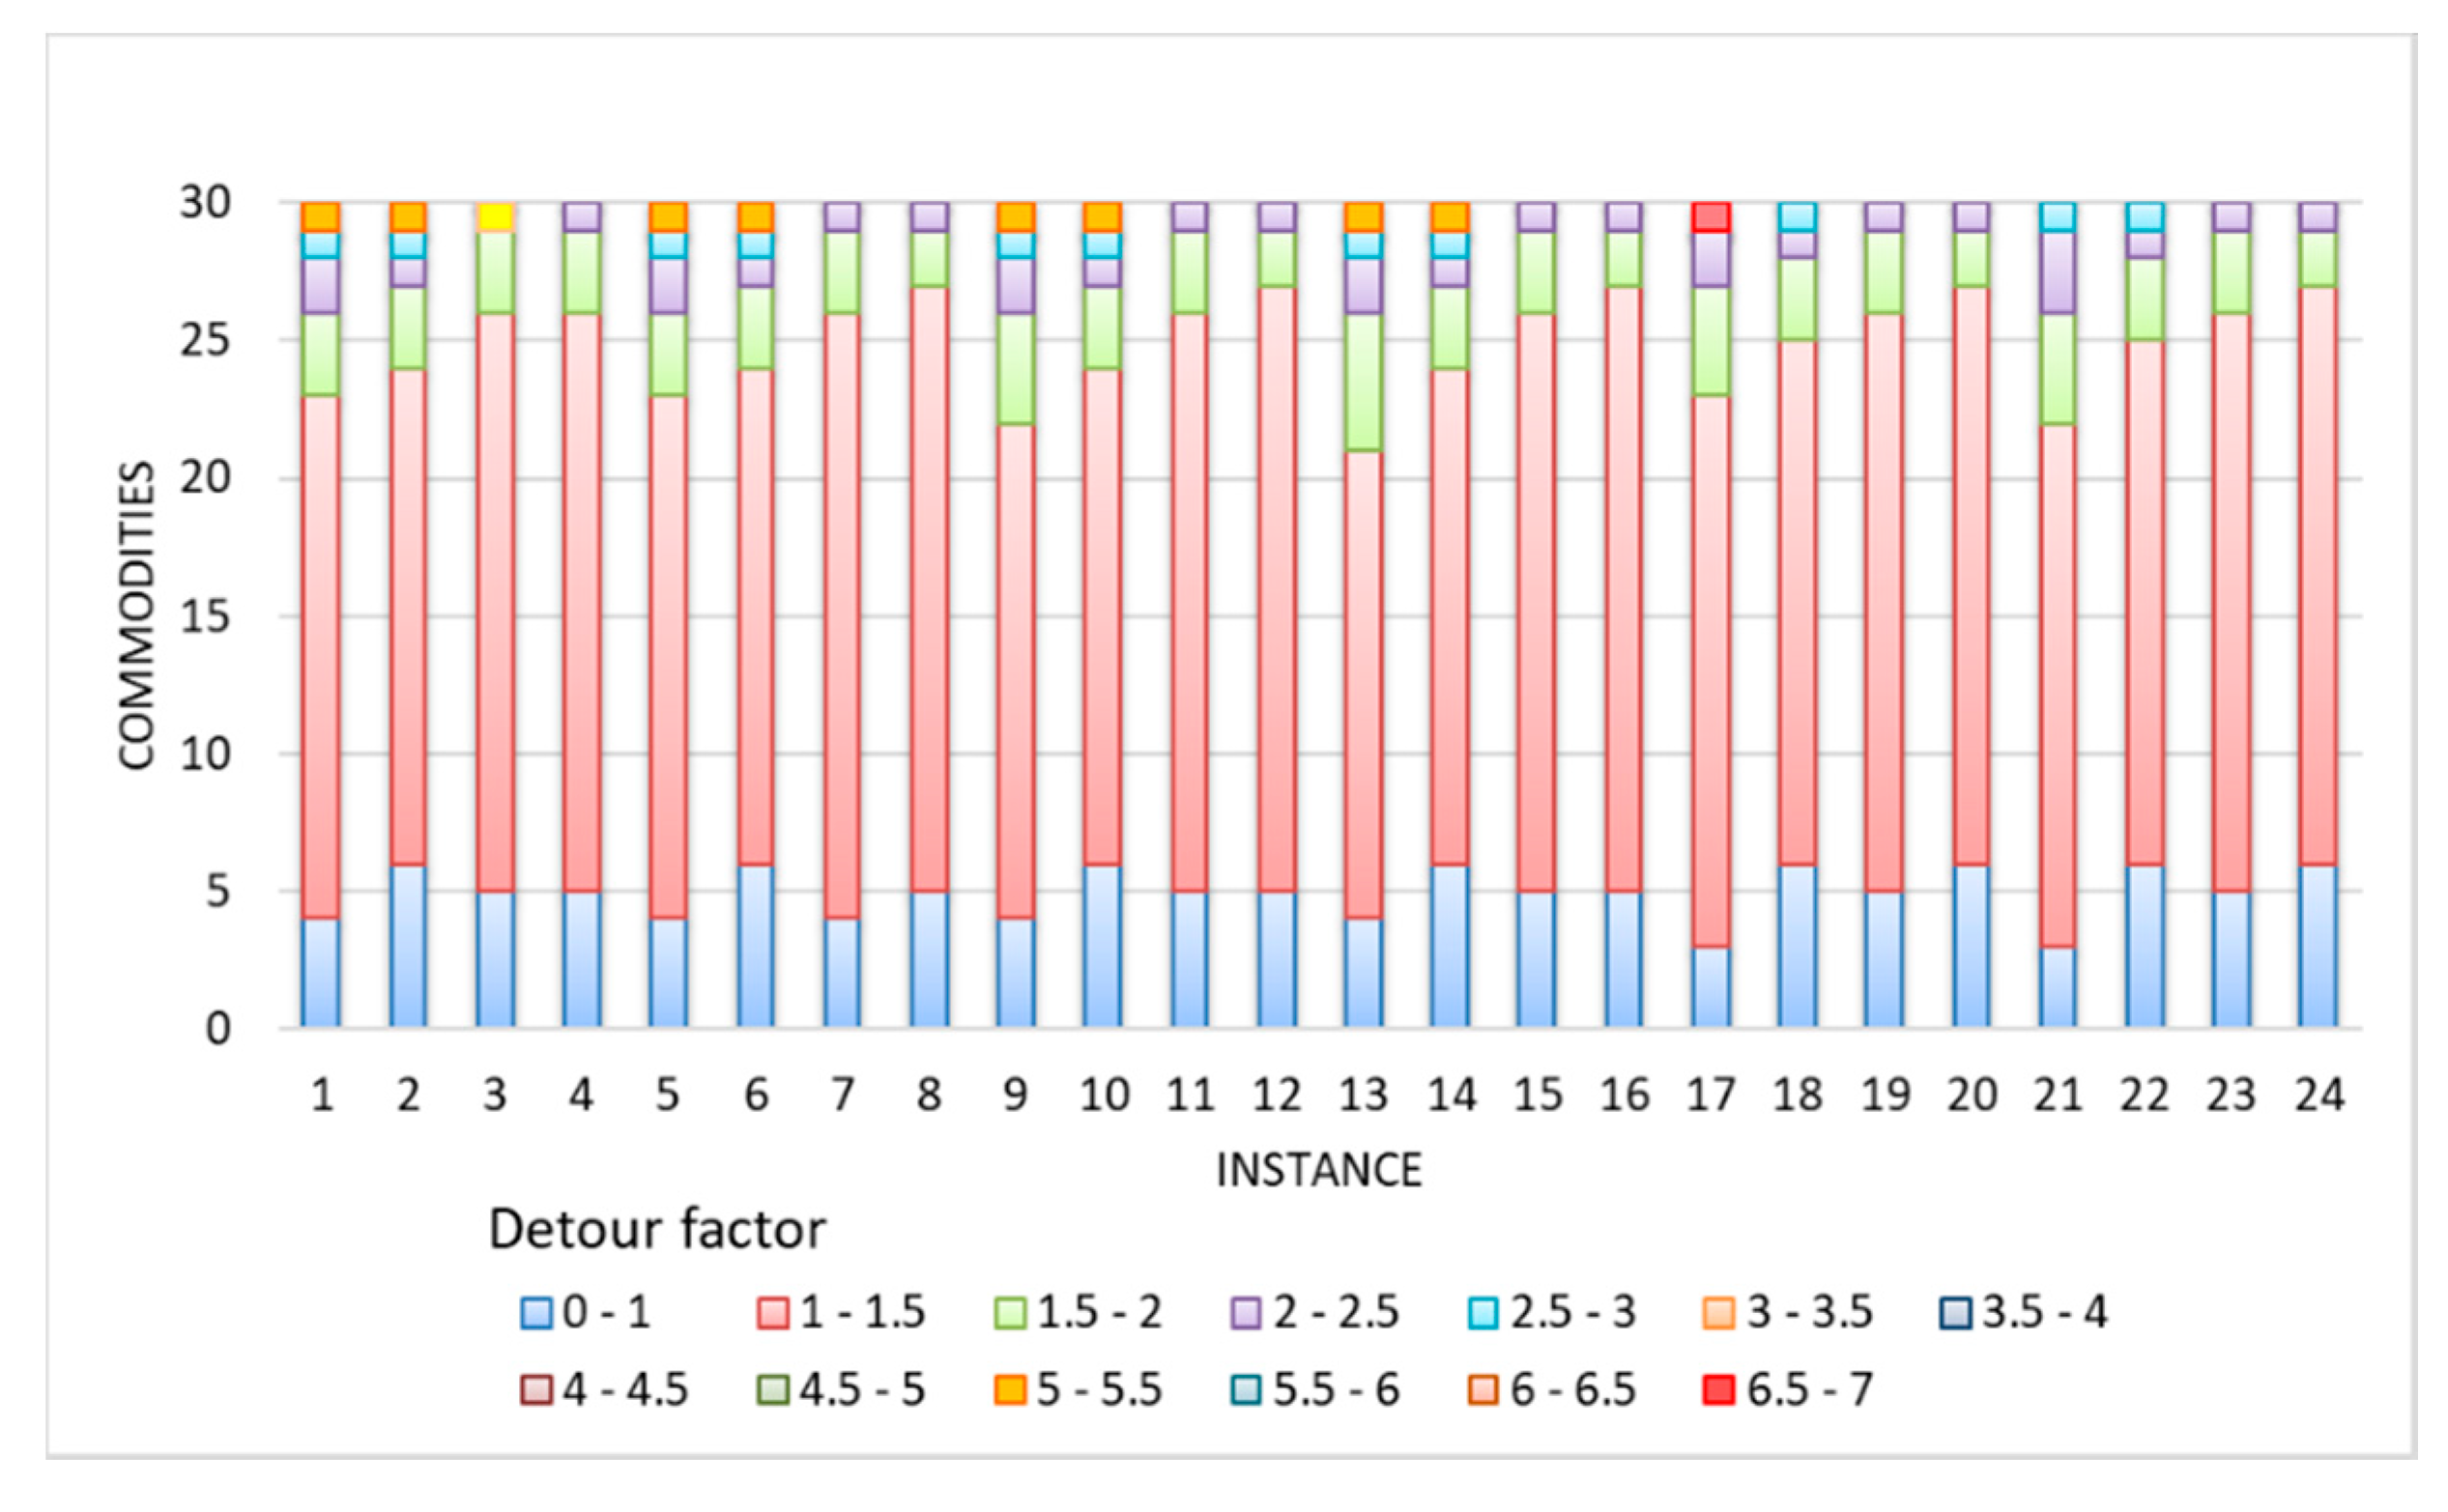
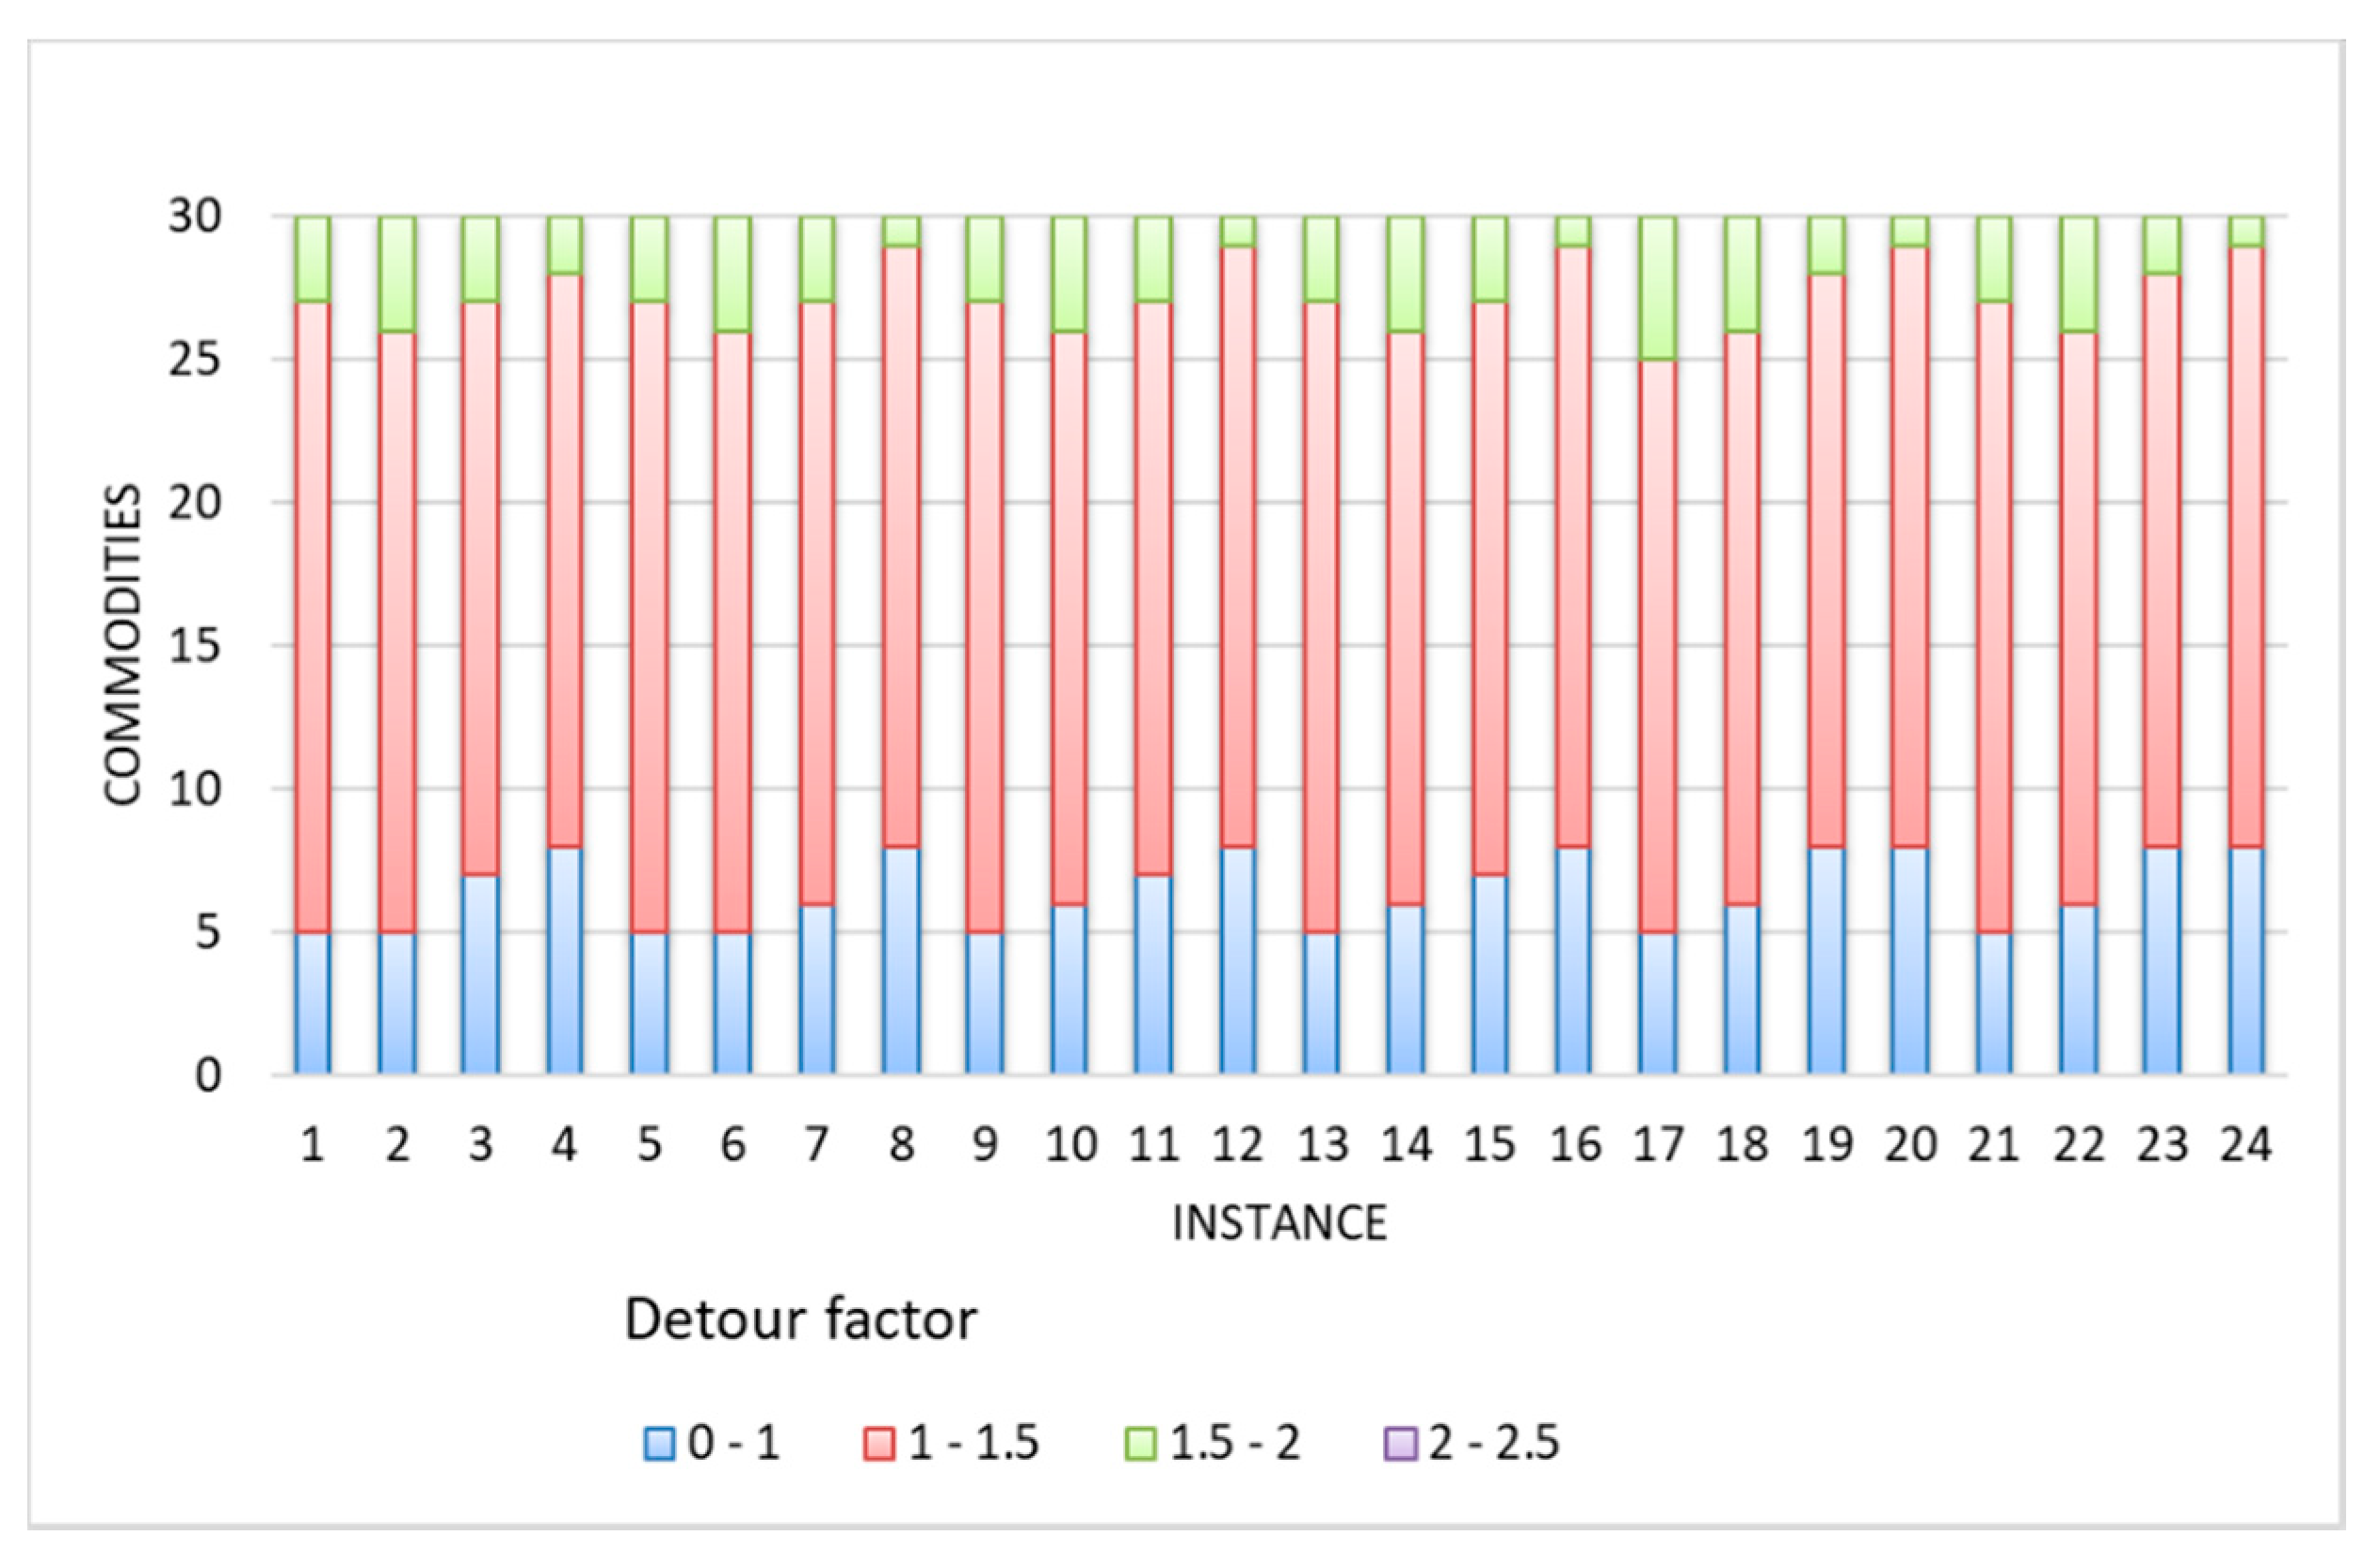
Case 1 and case 2 are experimented with the 24 test instances to see the impact of the detour on the model’s performance. Figure 4 shows the results obtained from case 1 (without the detour constraint). Only 10–20% of the goods utilize the shortest path to transport the goods, then the value of the detour factor ranged from 0 to 1. The majority of 50–60% of the goods have the value of detour factor ranging from 1 to 1.5. The rest of the goods have a detour factor above 1.5 and up to 5.5. The high value of the detour factor of goods indicates that the actual route distances of goods are much longer than the shortest possible distance. Hence, the delivery time can be late. In Figure 5, after including the detour constraint in case 1, the values of detour factors never exceed 2 (the majority pf values range from 0 to 1.5) indicating that the delivery time of goods could be controlled.
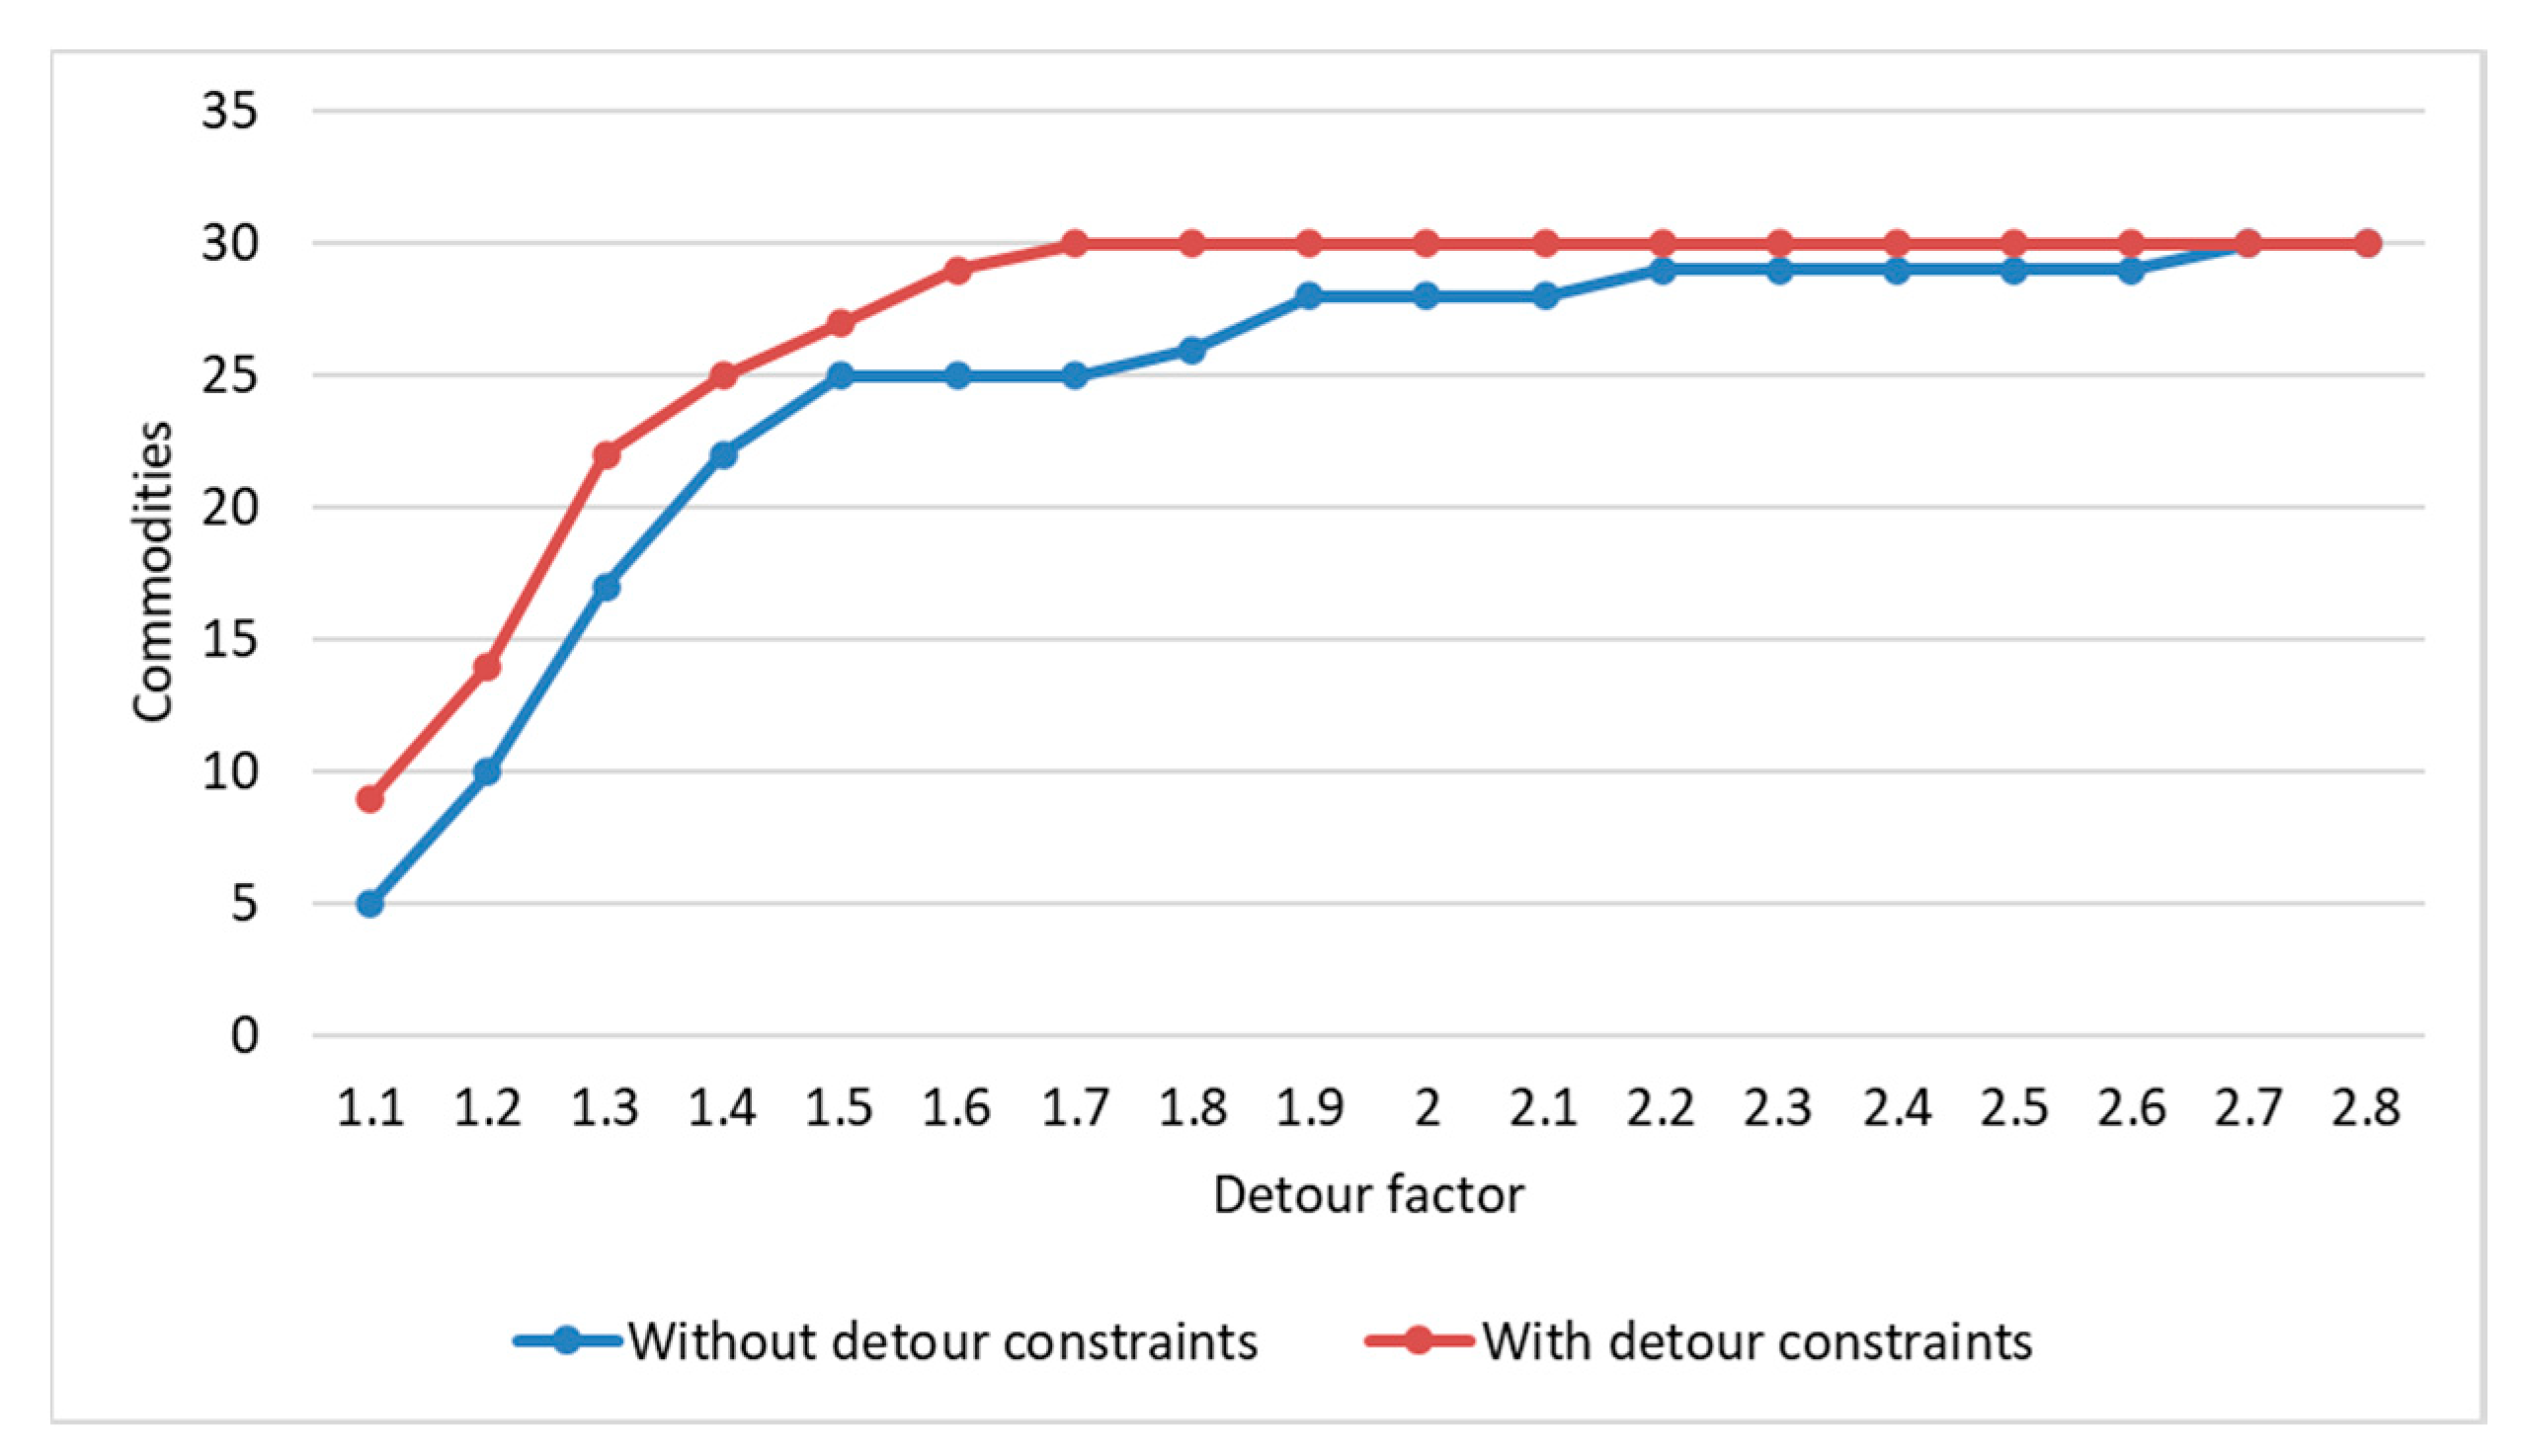
Table 13 shows a summary of the detour factor for goods in case 1 and case 2. Without the detour constraints as in case 1, the average detour is between 1.24 and 1.55. In most instances, the maximum detour value is either 2.12 or 5.19. Such values mean that, in the worst case, the detour may be as high as 5.19, and most of the goods experience about 40% of the additional distance. In case 2 with the detour constraint, there is a substantial drop in the average and maximum detour. The average detour varies from 1.17 to 1.31, indicating that the detour is below 28% on average and slightly lower than case 1. The average values of detour factor for goods from case 1 and case 2 are shown in Figure 6.

4.2.4. Vehicle Utilization

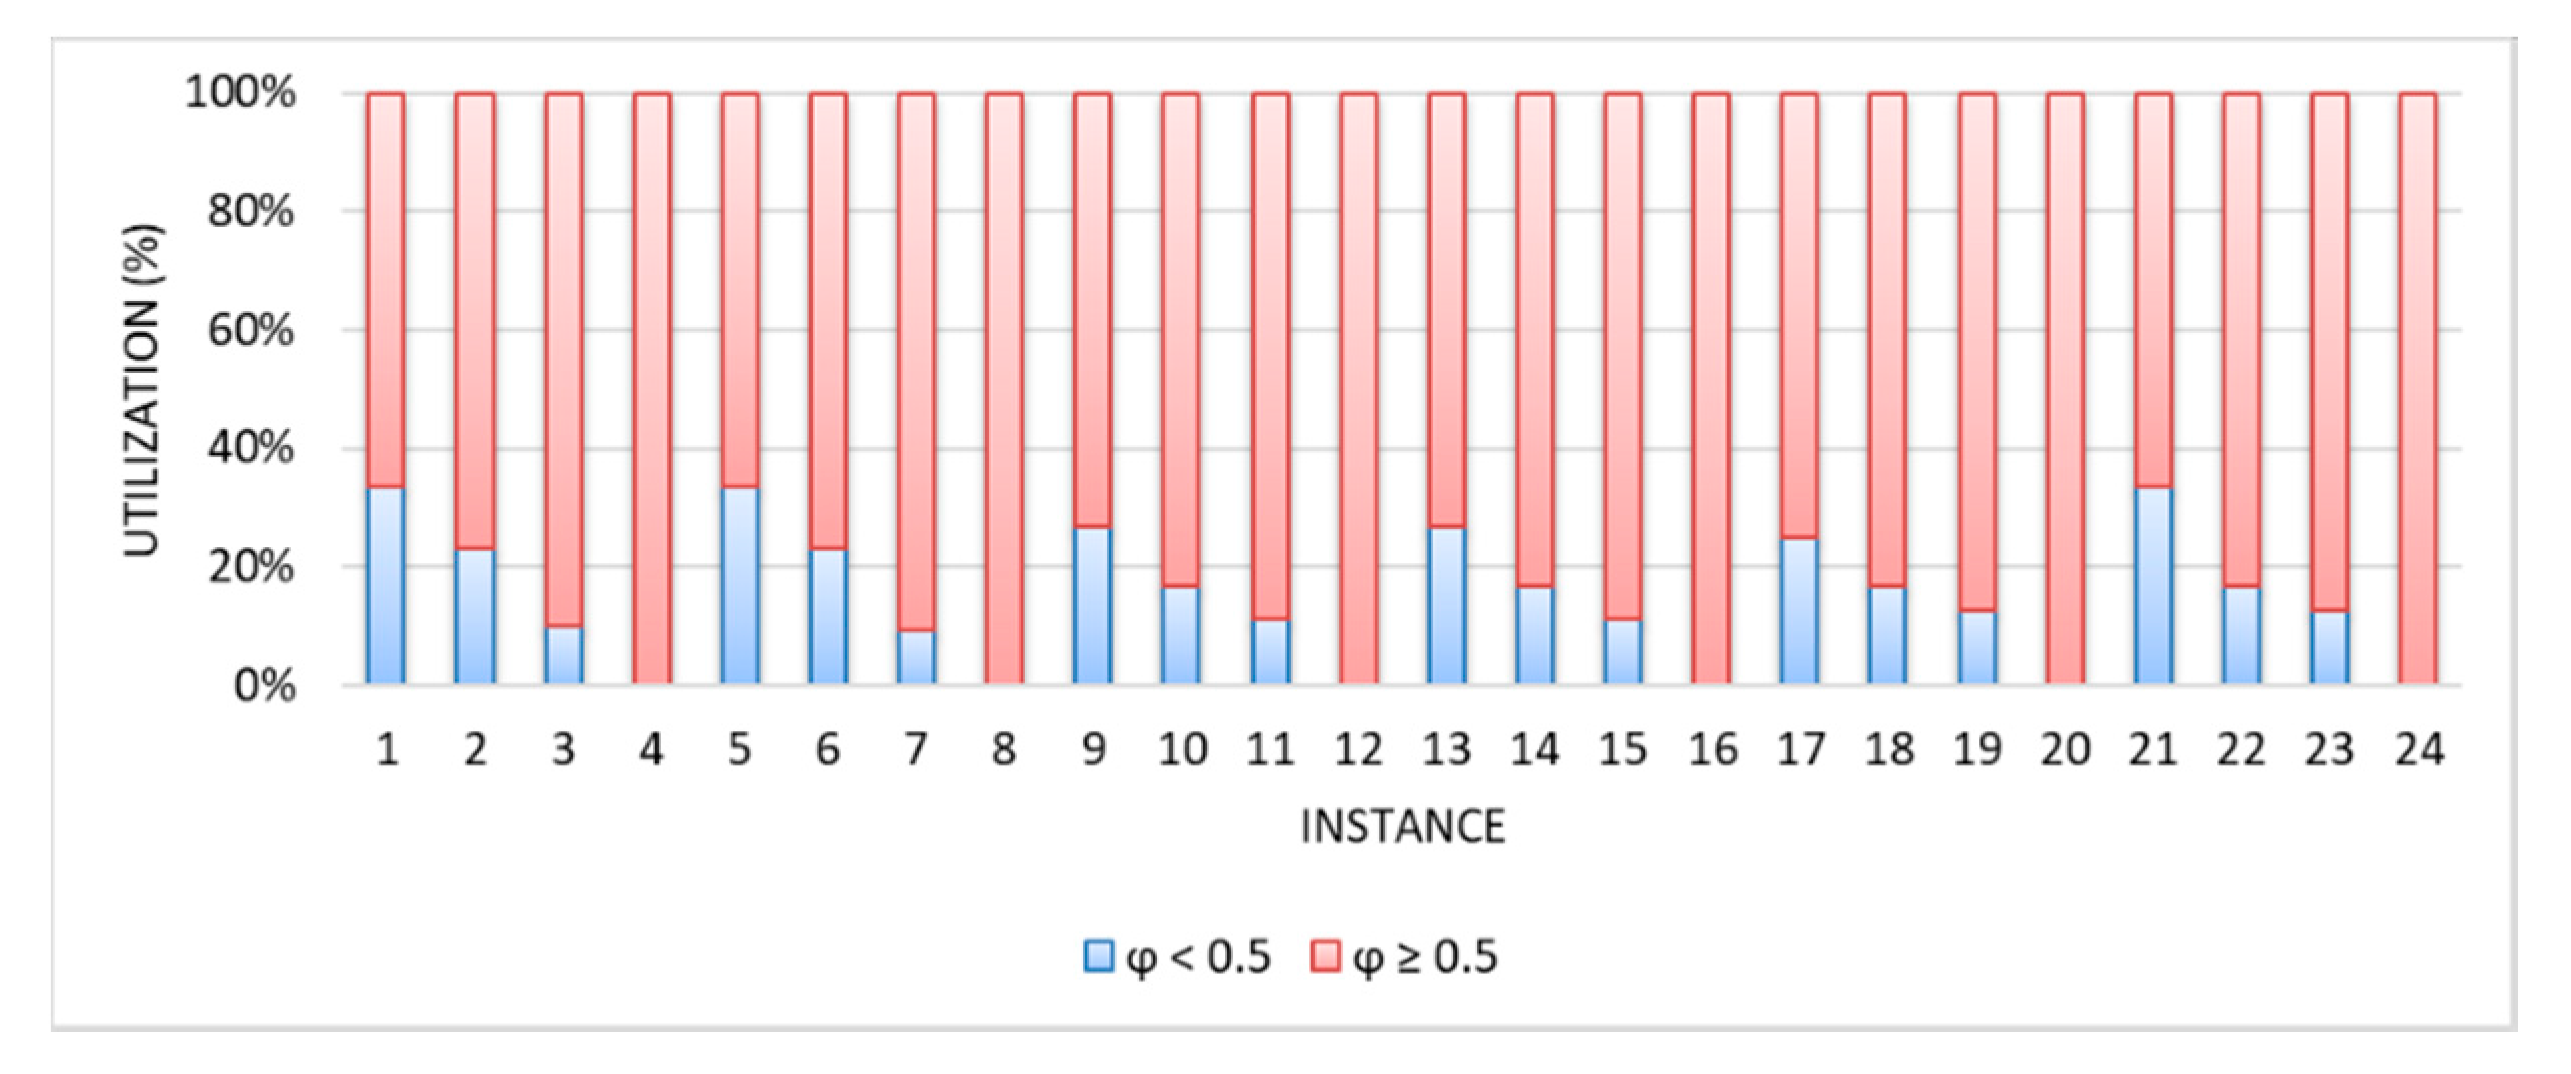
The experiments with the 24 test instances are conducted to see the impact of vehicle utilization on the model approaches. Figure 7 shows truck capacity utilization with 24 test instances. The majority of 90–95% have a full truckload when applying the minimum vehicle capacity utilization constraint. Meanwhile, Figure 8 shows ship capacity utilization with 24 test instances. Only 10–20% could not utilize the capacity of a ship.
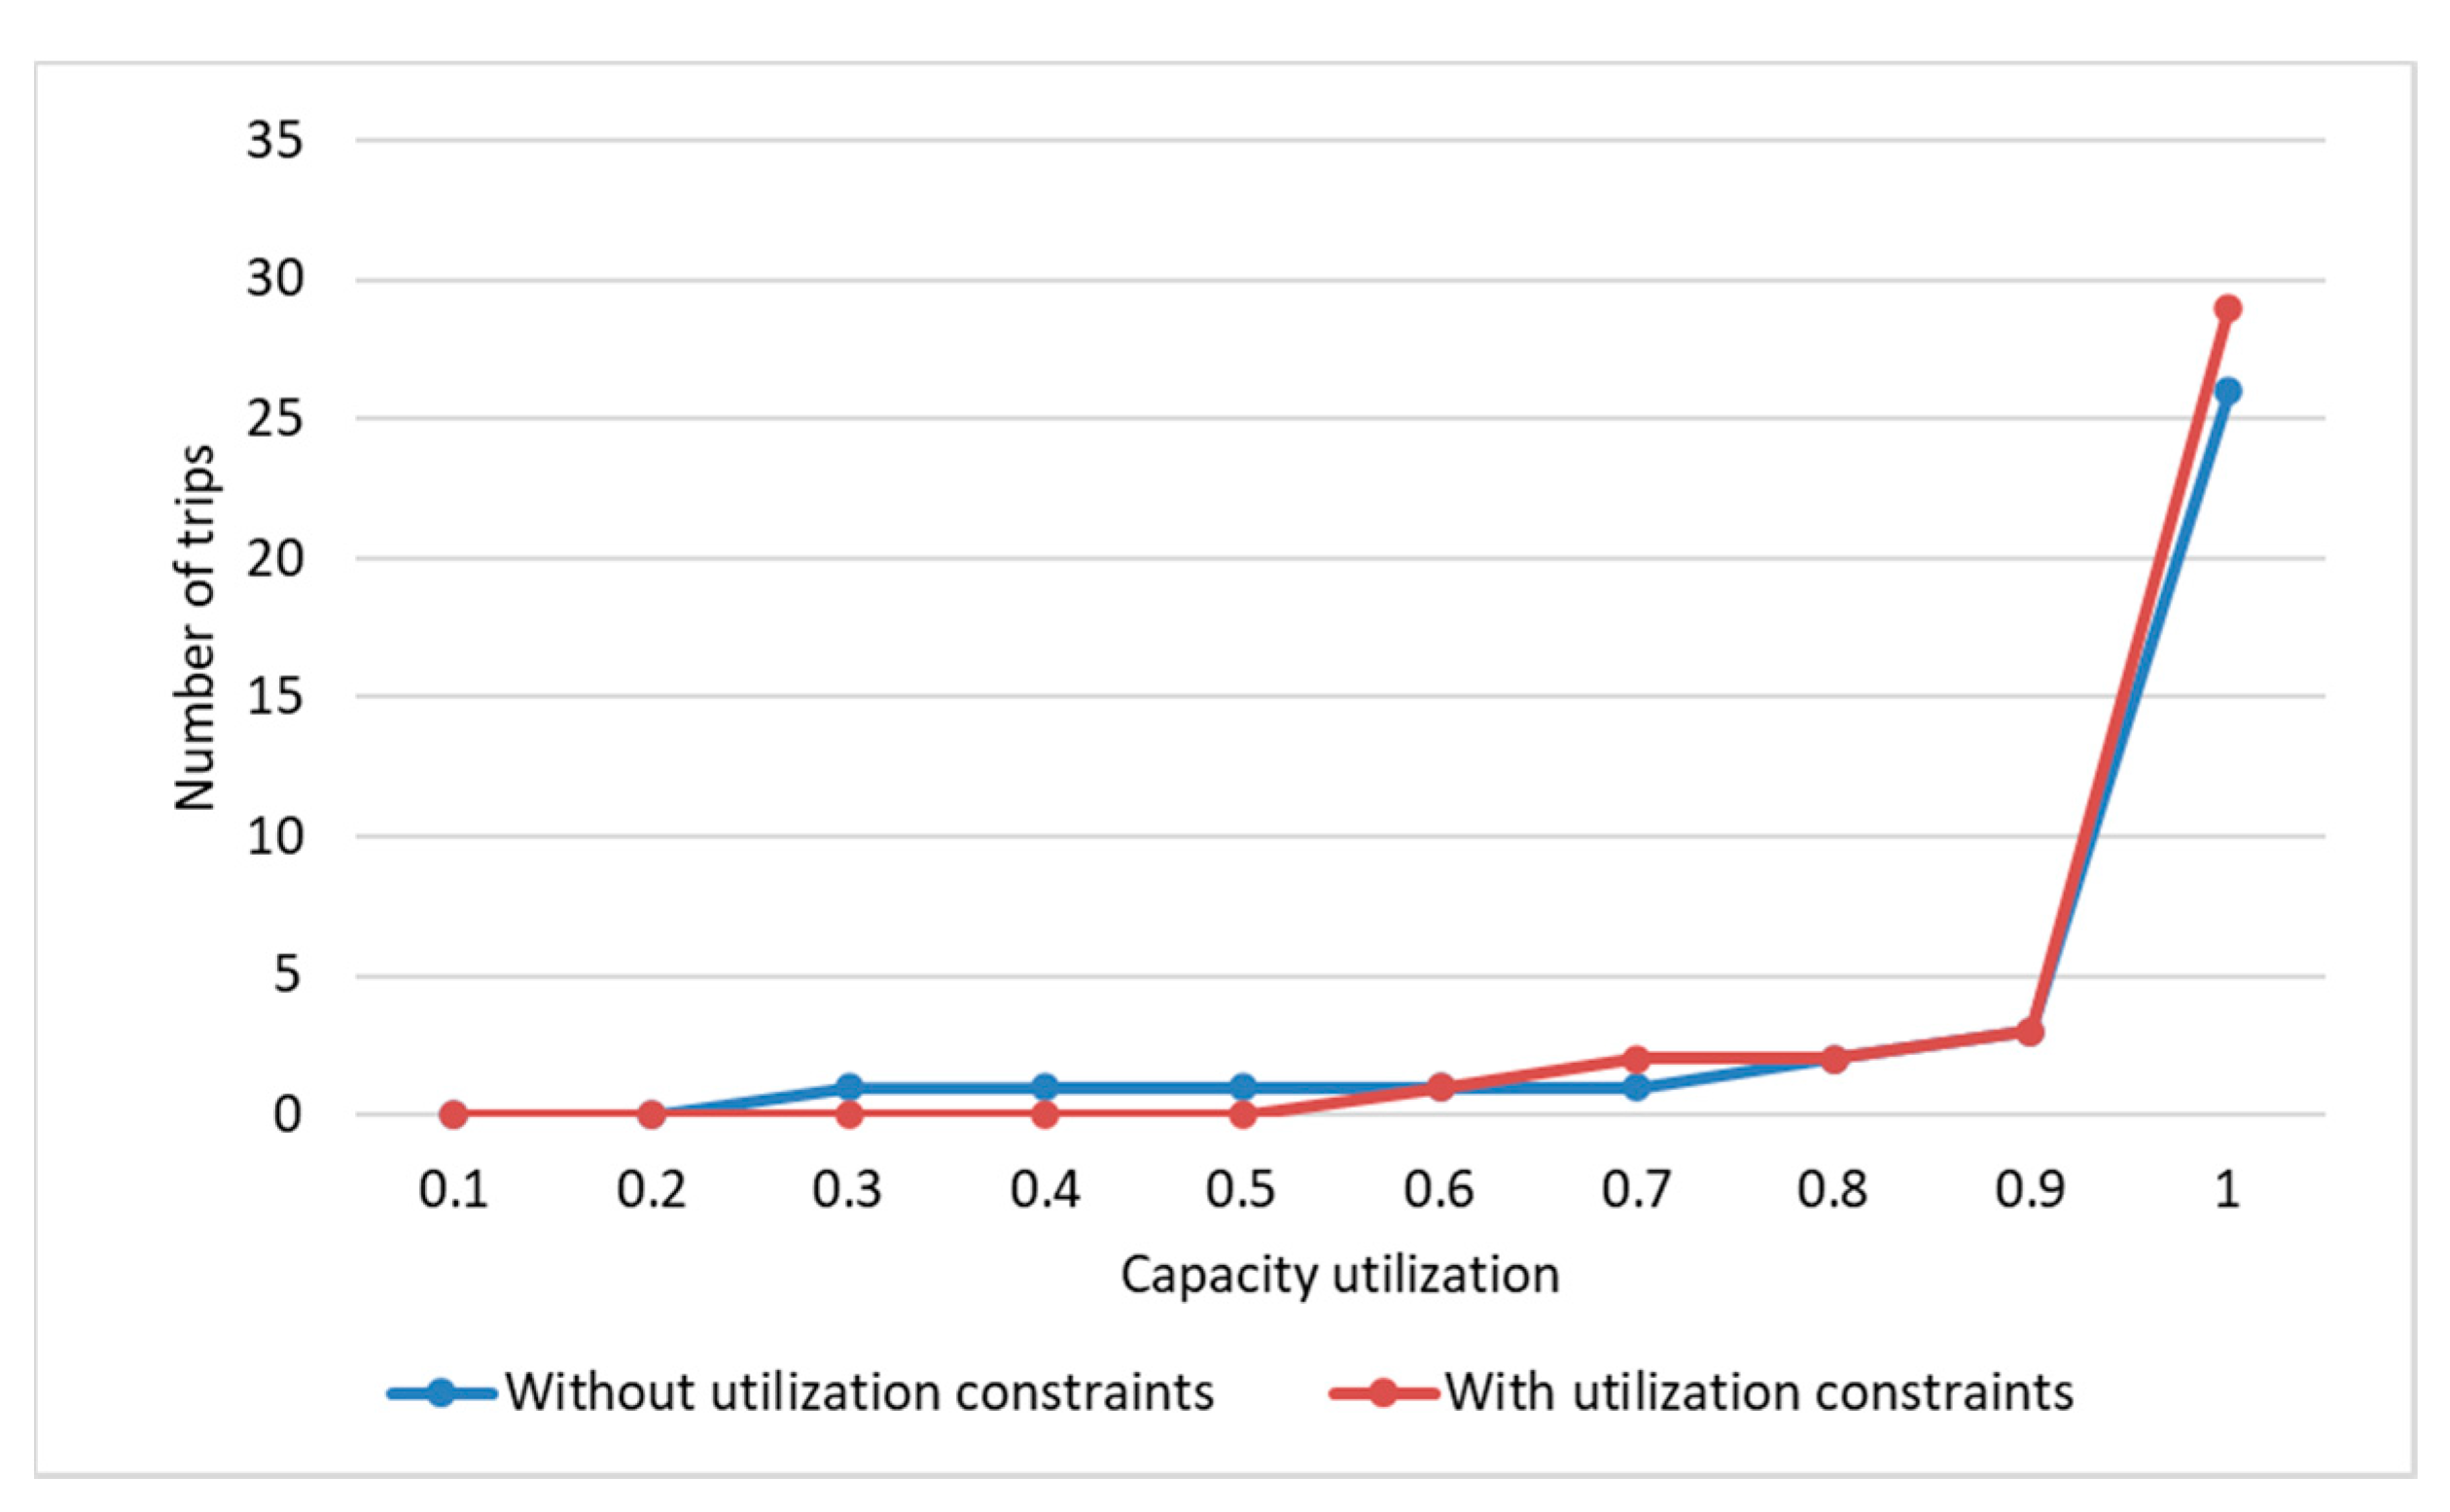
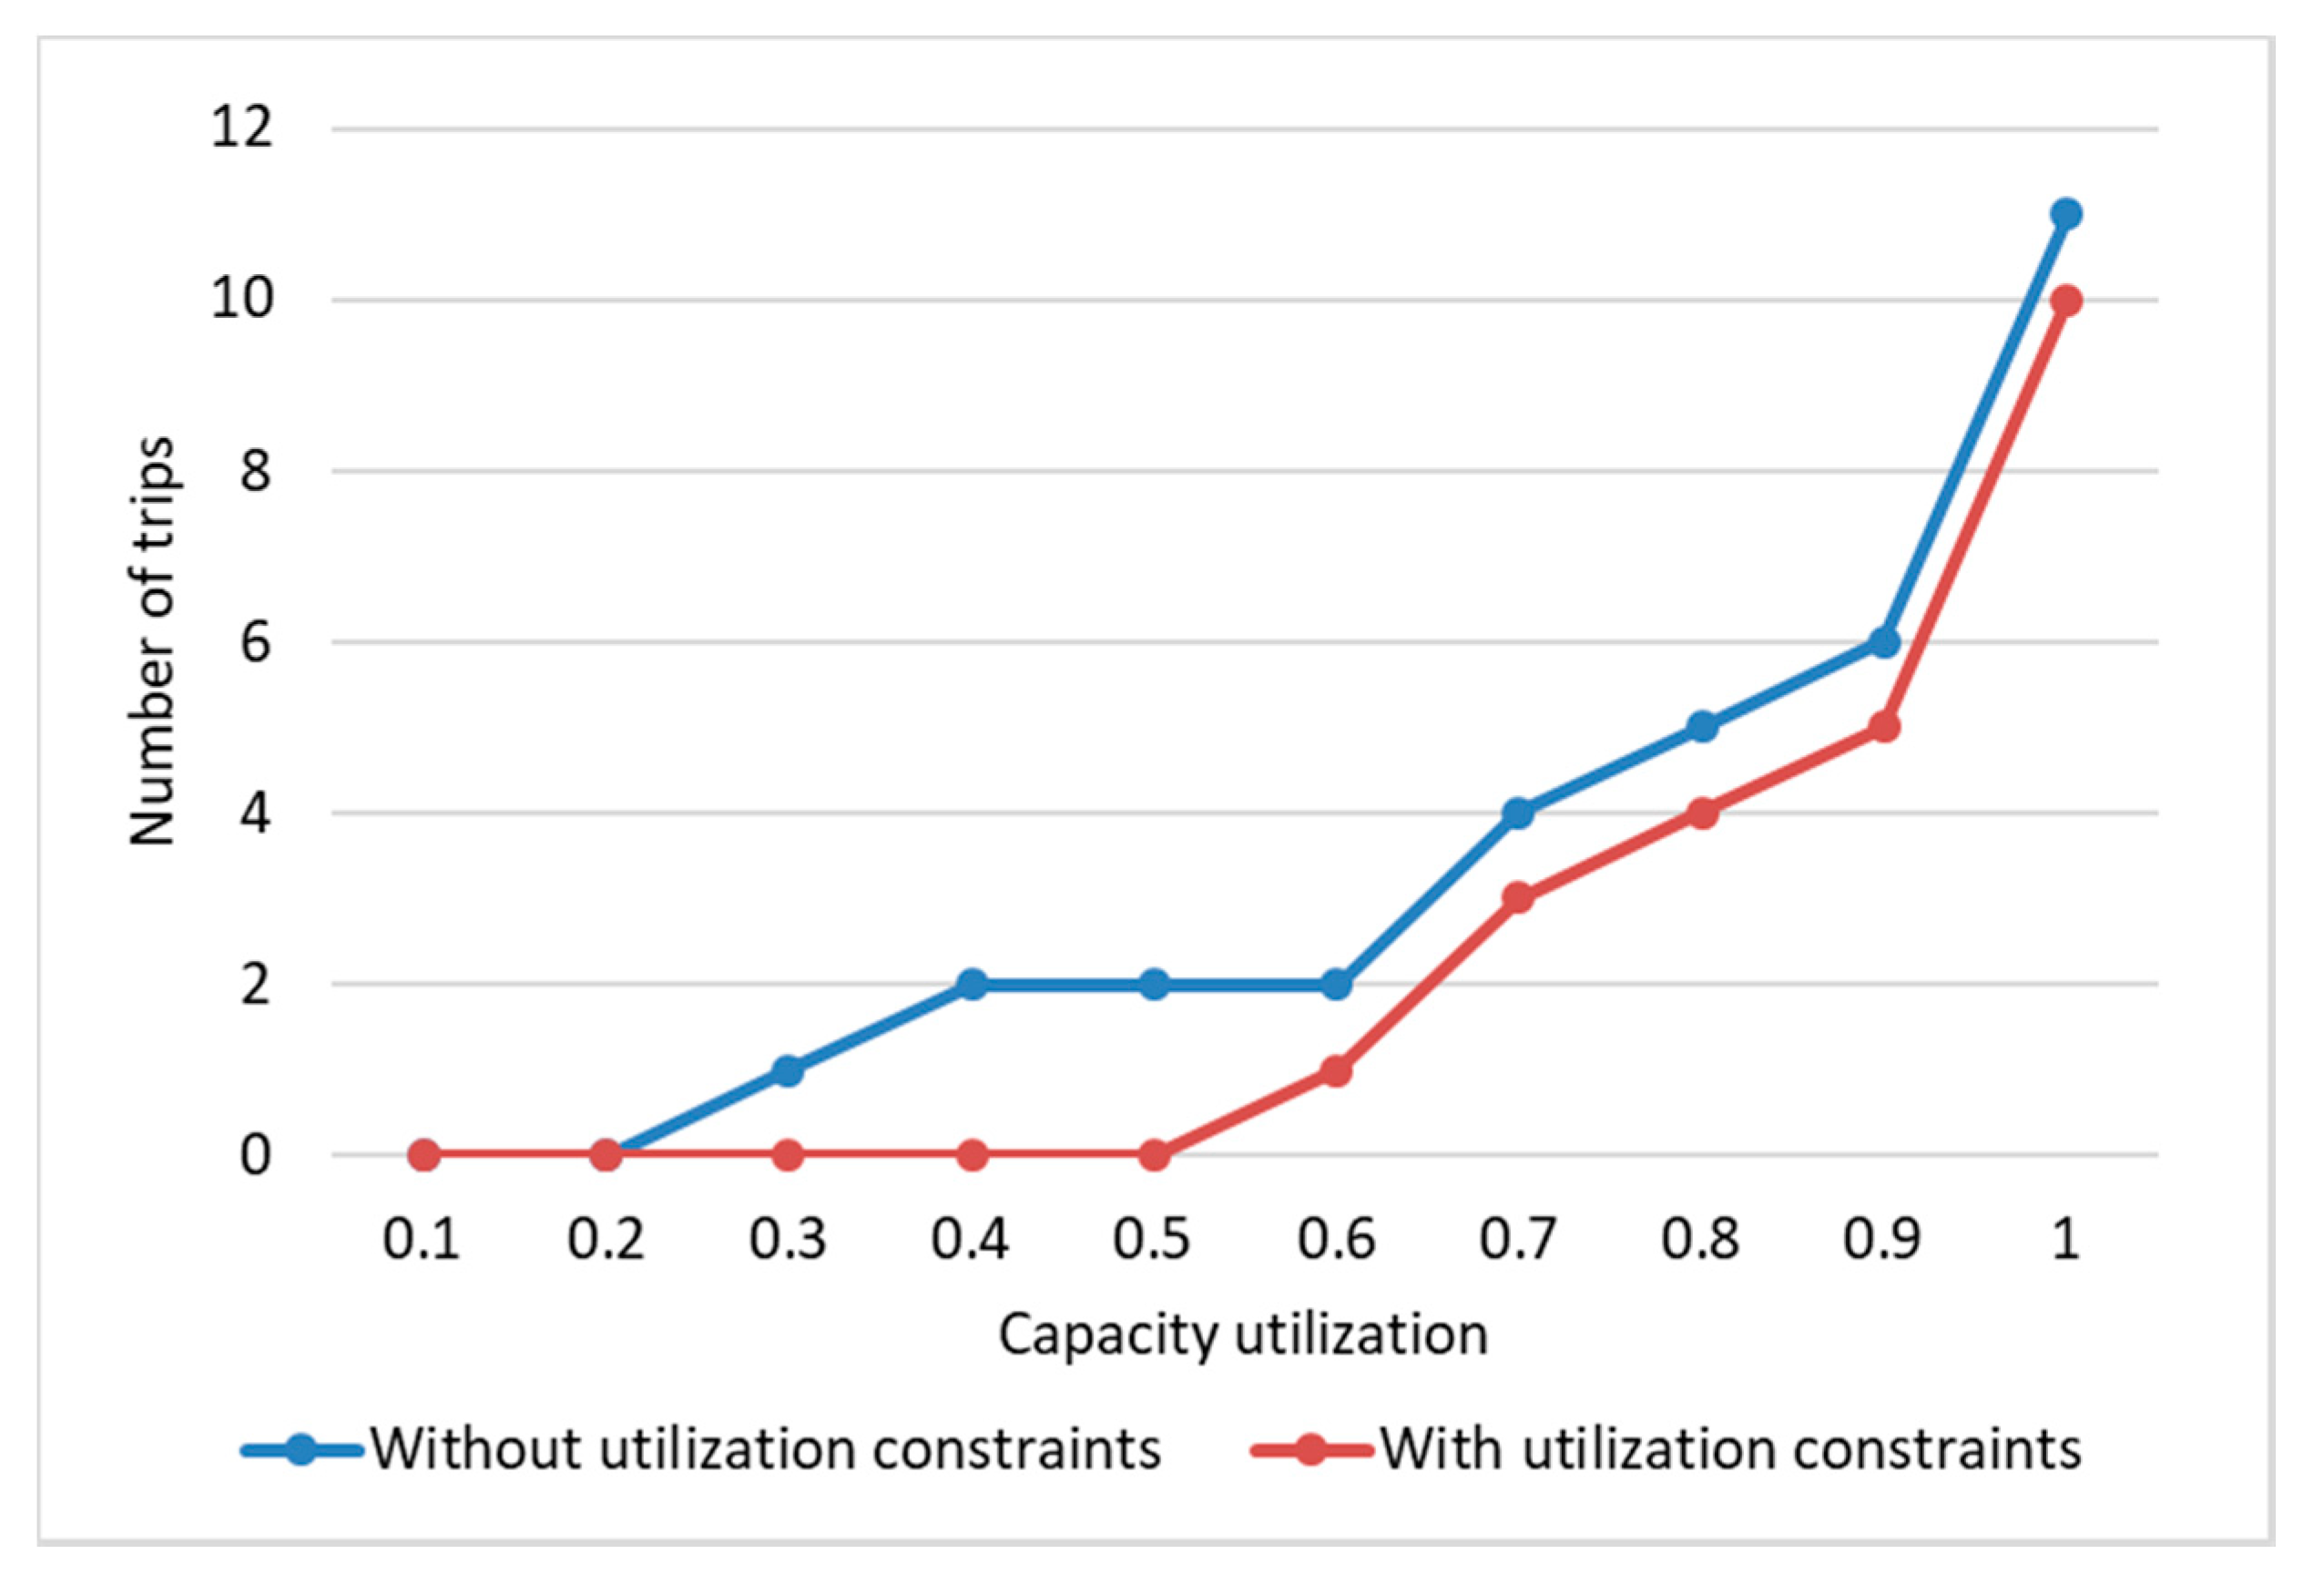
The capacity of vehicle utilization significantly affects the operation cost of the intermodal transportation system. Table 14, Figure 9, and Figure 10 present the influence of the utilization of vehicles. From the results, the constraint pushed the utilization level of both trucks and ships to be higher, also more reasonable in practice. In case 2 (without the vehicle utilization constraint), the number of trucks with capacity utilization that does not exceed 50% accounts for 4%. In contrast, the number of ships with a capacity utilization of less than 50% accounts for 20%. The utilization may be as low as 20–30% (for trucks and ships), which is not beneficial for the carriers. This problem can affect the efficacy of operation carriers. When the utilization of vehicles decreases, the enormous investments in large vehicles are less profitable and have higher risks. In case 3 (with the vehicle utilization constraint), the utilization is pushed to be at least 50% so that the vehicles are scheduled for more efficient performance.

4.2.5. Result Comparison

This section presents the characteristic of each experimental model, with the detailed results displayed in Table 15. From the results, the base case is calculated with the lowest total cost, while case 3 with the vehicle utilization constraint is calculated with the highest total cost. It is worth noting that the total cost is likely to be higher when the mathematical model has more restrictions. Moreover, case 3 (with the highest total cost) is about 20% more expensive than the base case (the lowest total cost). It implies that case 3 can be better for controlling the transportation network without spending too much on the total cost.
The effects on transportation costs are defined as follows: (1) the constraints of node capacity force the vehicle to move on a less-driven route to reduce the usage capacity; (2) the detour constraint forces the carriage to be driven more, but it is a more expensive vehicle; (3) the use of vehicles forces the load to be condensed to a lower number.
In terms of fixed costs, the base case is calculated with the lowest fixed cost, while case 2 (with the detour constraint) is calculated with the highest fixed cost. It can be explained that the majority of goods could be controlled in the base case. Therefore, carriers can easily select the route to deliver goods in terms of minimizing the total cost. In case 2, the restriction of the detour has the opposite effect causing goods to be delivered in a more directed route.
The CO2 emission costs are calculated with the lowest cost in case 1 (with node capacity constraints) because the node capacity constraints discourage the goods to be transferred to avoid overload at the terminal. The goods are then shipped in a shorter route, and the CO2 emissions are minimized directly. In case 3 (with vehicle utilization constraint), the CO2 emission costs are the highest because goods are forced to take a longer trip to varieties of nodes to increase the quantity of load and the utilization.
In the base case, it was at the lowest in terms of intermodal transfer costs. The case reduces the possibility of consolidating several products on the same vehicles, without restrictions. The highest intermodal transfer cost is in case 3 with the utilization restriction of the vehicle that causes the model to increase the number of goods on ships, thus increasing transportation.
The comparison of detour constraints of all models is also presented. The minimum detour is 1 for all models and the same as the shortest path. When the detour constraints are considered in case 2 and case 3, the maximum and the average detour of these models are lower than the rest.
The average use of trucks/ships and the number of vehicles has an inverse association with the vehicle usage cap results. The more vehicles being used, the lower the average goods per car. However, in case 3, the average ship utilization is highest as certain goods that are usually carried by trucks are now moving to ship to increase utilization.

4.3. Results of Fuzzy Mixed Integer Linear Programming (FMILP) Model

In the FMILP model, the authors analyzed instance 1, i.e., unit fixed costs for trucks and ships are $150 and $3000, respectively. Assumed that the actual node capacity fluctuates 100 ( 1 e ) % , where the values of e = 0.2, 0.3, 0.4, 0.5. The lower and upper bound of the objective value is determined in Table 16.
The objective values in the fluctuation of node capacity are presented in Table 17. From the results, when e = 0.2, the total costs of the FMILP model are $289,500. That is higher than the total cost of the deterministic model cost of $286,261; each cost term also changes slightly. When e = 0.5, the total cost of the FMILP model is $297,629, a 4% increment from the deterministic model. When e increases from 0.2 to 0.5, each cost terms costs more, and the total cost increase slightly.
The average value of vehicle capacity and detour factor of the FMILP model is presented in Table 18. When e increases, the average values of trucks decrease slightly and is higher than 0.9. The average values of ships increase when e increase, while the average value of the detour factor decreases when e increase.
The values of the membership function of fuzzy node capacity constraint of 15 considered nodes (i.e., 15 provinces in Southern Vietnam) and fuzzy goals are shown in Table 19, i.e., Equation (26), Equation (31). The membership function of fuzzy node capacity constraints such that the possibility degree will be 1 if the fuzzy node capacity is within 100(1 − e)% of node capacity. If the fuzzy node capacity reaches node capacity, the possibility degree becomes 0. In Table 19 and Figure 11, when e = 0.2, each membership degree is equal to 1 except for the membership degree of nodes 7, 10, 12, and 13. In Table 19 and Figure 12, when e = 0.5, the fuzzy capacity of all of the nodes is smaller than node capacity. It is important to note that node capacity was defined according to the capacity of loading and unloading at the port (i.e., the input data in Table 7). Moreover, fuzzy node capacity is used for node capacity’s uncertainty. This varies according to values of e (e = 0.2, 0.3, 0.4, 0.5). Using the FMILP model, we can develop a transportation plan to satisfy customer’s demand when node capacity is not stable.

5. Discussions and Conclusions

In this paper, a mixed integer linear programming (MILP) model and a fuzzy mixed integer linear programming (FMILP) model for intermodal transportation systems have been developed for shipping goods from origins to destinations. The MILP model minimizes the total costs of fixed costs, transportation costs, intermodal transfer costs, and CO2 emission costs. Other requirements of network stakeholders such as port agents, consumers, and carriers are considered with the constraints of node capacity, detour factor, and vehicle utilization. A Southern Vietnam transportation system that considers 15 nodes and 30 different main types of goods, is used as a case study to illustrate how to apply the model in practice. There are two types of vehicles, trucks (roads) and ships (inland waterways), which are considered in this case study. From the results, if the restrictions were not considered in the model, the network may have some overused terminal that encounters heavy load. Goods must be delivered much longer than usual, causing delays in deliveries (large detour level) and vehicles cannot be used effectively. By adding the constraints, the problem can now be better handled while increasing the total cost by 20%. The FMILP model considers uncertainty in the node capacity to investigate the impacts of uncertainty. The robust solution shows that the total cost of the FMILP model is increased by 4% in comparison to the total cost of the MILP model.
In summary, our contributions include (1) theoretical contributions, the paper proposed the MILP model that captures the common characteristics of the intermodal freight transportation as well as other important aspects, including node capacity, detour, and vehicle utilization, incorporated to estimate the performance impacts and the FMILP model to investigate impacts of node capacity uncertainty; (2) managerial implications, the case study in Southern Vietnam is presented to demonstrate the operational performance of the intermodal system that combines roads and inland waterways. The findings will provide a helpful reference for the government of Vietnam, logistics stakeholders, and foreign investors to design and enhance logistics systems and some suitable strategies to achieve the objectives of the economy and many related fields. Additionally, node capacity constraints help to provide stakeholders, such as cargo owners, with knowledge about congested terminals to force their goods to be transported along more productive routes. This can also be a useful guideline for the Ministry of Transport of Vietnam to address traffic congestion problems, which are taking place constantly and seriously in Vietnam for decades. It is also worth noting that the solution was found to solve not only economic problems but also addressing environmental issues that cannot be ignored in the current global situation by considering additional intermodal transfer costs and CO2 emission costs in the objective function.
Nevertheless, there are some limitations to this study. First, only two modes of transport, roads and inland waterways, were considered. Second, the number of nodes was insignificant. Finally, fluctuation in the related costs was not considered in the model. Further research should aim to address large-scale problems with more transportation modes, more nodes, and include uncertain (fuzzy) cost coefficients, and/or demand. In addition, the effect of terminal congestion can be incorporated into the objective of the model. In addition, the model can be applied to another region of Vietnam with adjusted data.
Author Contributions

Conceptualization, C.-N.W., T.-T.D., T.Q.L., and P.K.; data curation, T.-T.D. and T.Q.L.; formal analysis, T.-T.D. and T.Q.L.; funding acquisition, C.-N.W.; investigation, T.Q.L. and P.K.; methodology, C.-N.W., T.-T.D., and P.K.; project administration, C.-N.W.; software, T.-T.D. and T.Q.L.; validation, T.Q.L. and P.K.; writing—original draft, T.-T.D. and T.Q.L.; writing—review and editing, C.-N.W. and T.-T.D. All authors have read and agreed to the published version of the manuscript.

Funding

This research was partly supported by the National Kaohsiung University of Science and Technology, and MOST 09-2622-E-992-026 from the Ministry of Sciences and Technology in Taiwan.

Acknowledgments

The authors appreciate the support from the National Kaohsiung University of Science and Technology, Ministry of Sciences and Technology in Taiwan.

Conflicts of Interest

The authors declare no conflict of interest.

References

  1. Bektas, T.; Crainic, T. A Brief Overview of Intermodal Transportation. 2007. Available online: https://www.cirrelt.ca/documentstravail/cirrelt-2007-03.pdf (accessed on 11 November 2020). [CrossRef]
  2. Punakivi, M.; Hinkka, V. Selection criteria of transportation mode: A case study in four Finnish industry sectors. Transp. Rev. 2006, 26, 207–219. [Google Scholar] [CrossRef]
  3. Chopra, S.; Meindl, P. Supply Chain Management: Strategy, Planning, and Operation; Springer: Berlin/Heidelberg, Germany, 2007; Available online: https://link.springer.com/chapter/10.1007%2F978-3-8349-9320-5_22#citeas (accessed on 24 October 2020).
  4. Crainic, T.G.; Kim, K.H. Intermodal Transportation. Handb. Oper. Res. Manag. Sci. 2007, 14, 467–537. [Google Scholar]
  5. Liu, S.T.; Kao, C. Solving fuzzy transportation problems based on extension principle. Eur. J. Oper. Res. 2004, 153, 661–674. [Google Scholar] [CrossRef]
  6. Liu, S.T. Fuzzy total transportation cost measures for fuzzy solid transportation problem. Appl. Math. Comput. 2006, 174, 927–941. [Google Scholar] [CrossRef]
  7. Ballou, R.H.; Rahardja, H.; Sakai, N. Selected country circuity factors for road travel distance estimation. Transp. Res. Part. A: Policy Pract. 2002, 36, 843–848. [Google Scholar] [CrossRef]
  8. Jung, J.; Jayakrishnan, R.; Park, J.Y. Design and modeling of real-time shared-taxi dispatch algorithms. In Proceedings of the Transportation Research Board 92nd Annual Meeting, Washington, DC, USA, 13–17 January 2013. [Google Scholar]
  9. McKinnon, A.; Edwards, J. Opportunities for improving vehicle utilization. Green Logist. Improv. Environ. Sustain. Logist. 2010, 195–213. Available online: https://www.econbiz.de/Record/opportunities-for-improving-vehicle-utilization-mckinnon-alan/10003949349 (accessed on 24 October 2020).
  10. Macharis, C.; Bontekoning, Y.M. Opportunities for OR in intermodal freight transport research: A review. Eur. J. Oper. Res. 2004, 153, 400–416. [Google Scholar] [CrossRef]
  11. Dang, V.L.; Yeo, G.T. Weighing the key factors to improve Vietnam’s logistics system. Asian J. Shipp. Logist. 2018, 34, 308–316. [Google Scholar] [CrossRef]
  12. Tahvanainen, T.; Anttila, P. Supply chain cost analysis of long-distance transportation of energy wood in Finland. Biomass and Bioenergy 2011, 35, 3360–3375. [Google Scholar] [CrossRef]
  13. Wiegmans, B.; Konings, R. Intermodal inland waterway transport: Modelling conditions influencing its cost competitiveness. Asian J. Shipp. Logist. 2015, 31, 273–294. [Google Scholar] [CrossRef] [Green Version]
  14. Fremont, A.; Franc, P. Hinterland transportation in Europe: Combined transport versus road transport. J. Trans. Geo. 2010, 18, 548–556. [Google Scholar] [CrossRef] [Green Version]
  15. Craig, A.J.; Blanco, E.E.; Sheffi, Y. Estimating the CO2 intensity of intermodal freight transportation. Transp. Environ. 2013, 2, 49–53. [Google Scholar] [CrossRef]
  16. Limbourg, S.; Jourquin, B. Optimal rail-road container terminal locations on the European network. Logist. Transp. Rev. 2009, 45, 551–563. [Google Scholar] [CrossRef] [Green Version]
  17. Arnold, P.; Peeters, D.; Thomas, I. Modelling a rail/road intermodal transportation system. Logist. Transp. Rev. 2004, 40, 255–270. [Google Scholar] [CrossRef]
  18. Van Duin, R.; van Ham, H. A three-stage modeling approach for the design and organization of intermodal transportation services. In Proceedings of the Systems, Man, and Cybernetics, 1998 IEEE International Conference, San Diego, CA, USA, 14 October 1998. [Google Scholar]
  19. Chang, T.S. Best routes selection in international intermodal networks. Comput. Oper. Res. 2008, 35, 2877–2891. [Google Scholar] [CrossRef]
  20. Crainic, T.G. Service network design in freight transportation. Eur. J. Oper. Res. 2000, 122, 272–288. [Google Scholar] [CrossRef]
  21. Resat, H.G.; Turkay, M. Design and operation of intermodal transportation network in the Marmara region of Turkey. Logist. Transp. Rev. 2015, 83, 16–33. [Google Scholar] [CrossRef]
  22. Demir, E.; Burgholzer, W.; Hrušovský, M.; Arıkan, E.; Jammernegg, W.; Van Woensel, T. A green intermodal service network design problem with travel time uncertainty. Methodological 2016, 93, 789–807. [Google Scholar] [CrossRef]
  23. Ghane-Ezabadi, M.; Vergara, H.A. Decomposition approach for integrated intermodal logistics network design. Logist. Transp. Rev. 2016, 89, 53–69. [Google Scholar] [CrossRef]
  24. Qu, Y.; Bektaş, T.; Bennell, J. Sustainability SI: Multimode multicommodity network design model for intermodal freight transportation with transfer and emission costs. Netw. Spat. Econ. 2016, 16, 303–329. [Google Scholar] [CrossRef] [Green Version]
  25. Zadeh, L.A. Fuzzy sets. Inf. Control. 1965, 8, 338–353. [Google Scholar] [CrossRef] [Green Version]
  26. Bit, A.K.; Biswal, M.P.; Alam, S.S. Fuzzy programming approach to multicriteria decision making transportation problem. Fuzzy Sets Syst. 1992, 50, 135–141. [Google Scholar] [CrossRef]
  27. Verma, R.; Biswal, M.P.; Biswas, A. Fuzzy programming technique to solve multi-objective transportation problems with some non-linear membership functions. Fuzzy Sets Syst. 1997, 91, 37–43. [Google Scholar] [CrossRef]
  28. Ebrahimnejad, A. A simplified new approach for solving fuzzy transportation problems with generalized trapezoidal fuzzy numbers. Appl. Soft Comput. 2014, 19, 171–176. [Google Scholar] [CrossRef]
  29. Rodriguez, V.; Alvarez, M.J.; Barcos, L. Hub location under capacity constraints. Logistics and Transp. Rev. 2007, 43, 495–505. [Google Scholar] [CrossRef]
  30. Elhedhli, S.; Hu, F.X. Hub-and-spoke network design with congestion. Comput. Oper. Res. 2005, 32, 1615–1632. [Google Scholar] [CrossRef]
  31. Geisberger, R.; Luxen, D.; Neubauer, S.; Sanders, P.; Volker, L. Fast detour computation for ride sharing. arXiv 2009, arXiv:0907.5269. [Google Scholar]
  32. Üster, H.; Maheshwari, N. Strategic network design for multi-zone truckload shipments. Iie Trans. 2007, 39, 177–189. [Google Scholar]
  33. Üster, H.; Kewcharoenwong, P. Strategic design and analysis of a relay network in truckload transportation. Transp. Sci. 2011, 45, 505–523. [Google Scholar] [CrossRef]
  34. Sarkar, A.; Mohapatra, P.K. Maximum utilization of vehicle capacity: A case of MRO items. Comput. Ind. Eng. 2008, 54, 185–201. [Google Scholar] [CrossRef]
  35. Abate, M.A.; Kveiborg, O. Capacity Utilisation of Vehicles for Road Freight Transport. Available online: https://www.emerald.com/insight/content/doi/10.1108/9781781902868-014/full/html (accessed on 24 October 2020).
  36. Styhre, L. Strategies for capacity utilisation in short sea shipping. Marit. Econ. Logist. 2009, 11, 418–437. [Google Scholar] [CrossRef]
  37. Maraš, V.; Lazić, J.; Davidović, T.; Mladenović, N. Routing of barge container ships by mixed-integer programming heuristics. Appl. Soft Comput. 2013, 13, 3515–3528. [Google Scholar] [CrossRef]
  38. Gelareh, S.; Maculan, N.; Mahey, P.; Monemi, R.N. Hub-and-spoke network design and fleet deployment for string planning of liner shipping. Appl. Math. Model. 2013, 37, 3307–3321. [Google Scholar] [CrossRef]
  39. Goetschalckx, M.; Jacobs-Blecha, C. The vehicle routing problem with backhauls. Eur. J. Oper. Res. 1989, 42, 39–51. [Google Scholar] [CrossRef]
  40. Kim, H.; Yang, J.; Lee, K.D. Vehicle routing in reverse logistics for recycling end-of-life consumer electronic goods in South Korea. Transp. Environ. 2009, 14, 291–299. [Google Scholar] [CrossRef]
  41. Bellman, R.E.; Zadeh, L.A. Decision-making in a fuzzy environment. Manag. Sci. 1970, 17, B141. [Google Scholar] [CrossRef]
  42. Zimmermann, H.J. Fuzzy programming and linear programming with several objective functions. Fuzzy Sets Syst. 1978, 1, 45–55. [Google Scholar] [CrossRef]
  43. Antoni, L.; Krajči, S.; Krídlo, O. Representation of fuzzy subsets by Galois connections. Fuzzy Sets Syst. 2017, 326, 52–68. [Google Scholar] [CrossRef]
  44. Wang, R.C.; Liang, T.F. Applying possibilistic linear programming to aggregate production planning. Int. J. Prod. Econ. 2005, 98, 328–341. [Google Scholar] [CrossRef]
  45. Lai, Y.J.; Hwang, C.L. A new approach to some possibilistic linear programming problems. Fuzzy Sets Syst. 1992, 49, 121–133. [Google Scholar] [CrossRef]
  46. Vietnam’s Industrial Zones - How to Pick a Location for Your Business. Available online: https://www.vietnam-briefing.com/news/vietnam-industrial-zones-how-to-pick-location-for-your-business.html/ (accessed on 27 July 2020).
  47. Blancas, L.C.; El-Hifnawi, M.B. Facilitating Trade through Competitive, Low-carbon Transport: The Case for Vietnam’s Inland and Coastal Waterways; The World Bank: Washington, DC, USA, 2013. [Google Scholar]
  48. Inland Waterways. Available online: http://viwa.gov.vn (accessed on 14 July 2020).
  49. Inland Waterways Routes Information. Available online: http://cangvudtndhcm.gov.vn (accessed on 14 July 2020).
  50. Bharte, V.; Patil, K.; Jadhav, L.; Joshi, D. Bus Monitoring System Using Polyline Algorithm. Int. J. Sci. Res. Publ. 2014, 4, 200–203. [Google Scholar]
  51. Jasika, N.; Alispahic, N.; Elma, A.; Ilvana, K.; Elma, L.; Nosovic, N. Dijkstra’s shortest path algorithm serial and parallel execution performance analysis. In Proceedings of the 35th international convention MIPRO, Opatija, Croatia, 21–25 May 2012; pp. 1811–1815. [Google Scholar]
  52. Broumi, S.; Bakal, A.; Talea, M.; Smarandache, F.; Vladareanu, L. Applying Dijkstra algorithm for solving neutrosophic shortest path problem. In Proceedings of the International conference on advanced mechatronic systems (ICAMechS), Melbourne, Australia, 30 November–3 December 2016; pp. 412–416. [Google Scholar]
  53. Singal, P.; Chhillar, R.S. Dijkstra Shortest Path Algorithm using Global Positioning System. Int. J. Comput. Appl. 2014, 101, 12–18. [Google Scholar]
  54. JICA (Japan International Cooperation Agency). The Comprehensive Study on the Sustainable Development of Transport System in Vietnam. Ministry of Transport, VITRANSS-2. May 2010. Available online: https://openjicareport.jica.go.jp/pdf/11999935_01.pdf (accessed on 27 July 2020).
  55. Circular No. 261/2016/TT-BTC. Available online: https://vanbanphapluat.co/circular-261-2016-tt-btc-schedule-of-collection-rates-of-maritime-fees-charges (accessed on 27 July 2020).
  56. Binh, N.T.; Tuan, V.A. Analyzing the cost of freight transport in Viet Nam. J. Transp. Vietnam 2014, 1, 52–54. [Google Scholar]
  57. Vietnam ratifies Paris Agreement on climate change. Available online: http://www.vnembassy-jp.org/en/vietnam-ratifies-paris-climate-change-agreement (accessed on 27 July 2020).
  58. BGTVT. Providing the detailed master plan on the inland waterway port group in southeast Vietnam through 2020, with orientations toward 2030. Ministry of Transport, 1108/QĐ-BGTVT. 26 April 2013. Available online: http://mt.gov.vn/Images/FileVanBan/1108qd.PDF (accessed on 27 July 2020).
Figure 1. A single transfer from one point to another point.
Mathematics 08 02109 g001
Figure 2. A membership function of fuzzy node capacity constraint.
Mathematics 08 02109 g002
Figure 3. A membership function of objective fuzzy for the total cost.
Mathematics 08 02109 g003
Figure 4. The value of the detour factor from case 1 with 24 test instances.
Mathematics 08 02109 g004
Figure 5. The value of the detour factor from case 2 with 24 test instances.
Mathematics 08 02109 g005
Figure 6. Average value of detour factor for goods from case 1 and case 2.
Mathematics 08 02109 g006
Figure 7. Truck capacity utilization with 24 test instances.
Mathematics 08 02109 g007
Figure 8. Ship capacity utilization with 24 test instances.
Mathematics 08 02109 g008
Figure 9. Capacity utilization of trucks from case 2 and case 3.
Mathematics 08 02109 g009
Figure 10. Capacity utilization of ships of case 2 and case 3.
Mathematics 08 02109 g010
Figure 11. Node capacity and fuzzy node capacity (e = 0.2).
Mathematics 08 02109 g011
Figure 12. Node capacity and fuzzy node capacity (e = 0.5).
Mathematics 08 02109 g012
Table 1. Indices, sets, and input parameters in the model.
NotationsExplanations
Indices
i Origin points
j Destination points
n Node, n ∈ NO, which is defined by the region of origin or destination nodes
g Goods, g ∈ GO, which transported from the origin to the destination points
m Transportation mode, m ∈ MO
Sets
NOSet of all nodes
GOSet of goods
MOSet of transportation modes
ARSet of arcs AR (i, j), where i, j ∈ NO
Input Parameters
c i j m Transportation costs per unit on arc (i, j) ∈ AR via mode m ∈ MO, unit: $/ton-km
f i j m Fixed costs per unit on arc (i, j) ∈ AR via mode m ∈ MO, unit: $/ton
α Intermodal transfer costs per unit for goods, unit: $/ton
p m CO2 emission costs per unit via mode m ∈ MO, unit: $/ton-km
d i j m Distance of arc (i, j) ∈ AR via mode m ∈ MO, unit: km
S D O g D g Distance (shortest path), from O g to D g of goods g ∈ GO, unit: km
b i g Difference amount of goods g ∈ GO, enter and out node i ∈ NO, unit: ton
h i g Absolute value of b i g , unit: ton
u i j m Maximum capacity of vehicle on arc (i, j) ∈ AR via mode m ∈ MO, unit: ton
O g Goods g ∈ GO from the origin point
D g Goods g ∈ GO from the destination point
r g Goods quantity g ∈ GO which is sent from O g to D g , unit: ton
φ Minimum capacity utilization of vehicle, unit: %
g Detour factor for goods g ∈ GO
E i Maximum capacity of node i ∈ NO, unit: ton
Table 2. Notation and explanation of decision variables.
NotationsExplanations
x j i g m Flow of goods (ton) g ∈ GO on arc (i, j) ∈ AR via mode m ∈ MO
y i j m Number of vehicles moved on arc (i, j) ∈ AR via mode m ∈ MO
z i g m Amount of goods g ∈ GO is transferred via mode m ∈ MO at node i ∈ NO
Table 3. The nodes in Southern Vietnam.
NodeProvinceSymbolNodeProvinceSymbol
NO-001BinhDuongBDNO-009VinhLongVL
NO-002DongNaiDNNO-010DongThapDT
NO-003VungTauVTNO-011AnGiang/KienGiangAG/KG
NO-004HoChiMinhHCMNO-012CanThoCT
NO-005LongAnLANO-013HauGiangHG
NO-006TienGiangTGNO-014SocTrangST
NO-007BenTreBTNO-015BacLieu/CaMauBL/CM
NO-008TraVinhTV
Table 4. Demand for types of goods (unit: ton/day).
TypesOriginDestinationDemandTypesOriginDestinationDemand
1114143816522017
22913401721118
356140181012164
46115591965354
51412123520122272
67327321971292
71750722104734
84112769231214489
95141352415840
101042041259298
1113151162653114
12155354274121628
13413138128312742
1491326529110212
1538983062457
Table 5. Capacity of ships in Vietnam (unit: ton).
Ship ClassCapacityCapacityCapacityNo. ShipCapacityNo. ShipGrowth
Tonper Shipin Truckload20052005201020102005–2010
5–157.50.4205,13327,351399,29353,2391.95
15–5032.51.6440,66813,559776,81523,9021.76
50–2001256.3710,37556831,158,25092661.63
200–30025012.5200,500802312,00012481.56
300–50040020423,60010591,195,60029892.82
500–70060030346,800578967,80016132.79
700–100085042.5254,1502991,394,85016415.49
>100013006578,000601,596,400122820.47
Table 6. The 24 instances of unit fixed costs (unit: $/ton).
Inland Waterways
Roads1234
11503000450060007500
21603200480064008000
31703400510068008500
41803600540072009000
51903800570076009500
620040006000800010,000
Table 7. Node capacity (unit: ton).
NodeProvinceCapacity NodeProvinceCapacity
NO-001BD10,000NO-009VL3500
NO-002DN15,000NO-010DT2000
NO-003VT20,000NO-011AG/KG5000
NO-004HCM24,000NO-012CT6000
NO-005LA19,000NO-013HG2000
NO-006TG3000NO-014ST4000
NO-007BT2000NO-015BL/CM1000
NO-008TV1500
Table 8. Detour factor assumption for goods.
GoodsDetour FactorGoodsDetour Factor
11161.6
21171.6
31181.6
41191.6
51201.6
61.3211.8
71.3221.8
81.3231.8
91.3241.8
101.3251.8
111.4262
121.4272
131.4282
141.4292
151.4302
Table 9. Scenario development.
ScenarioModel Characteristics
Base caseFlow conservation
Arcs capacity
Case 1Base case
Node capacity
Case 2Case 1
Detour factor
Case 3Case 2
Vehicle utilization
Table 10. Comparison of the unimodal and intermodal transportation (unit: $).
InstanceModelTransport CostFixed CostEmission CostTransfer Cost
1Roads302,733161,55017110
IWW104,084105,00016500
ITSD105,96597,2001602450
5Roads302,733172,32017110
IWW105,219112,00016680
ITSD105,965103,6801602450
9Roads302,733183,09017110
IWW104,305119,00016530
ITSD105,965110,1601602450
13Roads302,733193,86017110
IWW105,219126,00016680
ITSD105,965116,6401602450
17Roads302,733204,63017110
IWW105,219133,00016680
ITSD107,161121,4101605874
21Roads302,733215,40017110
IWW105,219140,00016680
ITSD107,161127,8001605874
Source: Calculated by authors.
Table 11. The total cost of roads, inland waterways (IWW), and intermodal transportation system design (ITSD) (unit: $).
InstanceTotal CostInstanceTotal Cost
RoadsIWWITSDRoadsIWWITSD
1465,994210,735205,21813498,304232,887224,658
2465,994262,087245,79114498,304295,887272,131
3465,994315,658282,35215498,304354,847313,989
4465,994368,051313,93016498,304413,546349,932
5476,764218,887211,69817509,074239,887231,050
6476,764274,887254,57118509,074306,387280,911
7476,764314,628284,40419509,074367,346324,429
8476,764380,546326,03220509,074430,486361,672
9487,534224,959218,17821519,844246,887237,440
10487,534283,252263,35122519,844315,658289,691
11487,534342,540303,54923519,844380,546334,869
12487,534402,051337,98224519,844446,986373,382
Source: Calculated by authors.
Table 12. The total flows of the base case and case 1.
NodeNameCapacity (Ton)Base CaseCase 1
NO-001BD10,000665659
NO-002DN15,00036923854
NO-003VT20,00012931142
NO-004HCM24,00099569638
NO-005LA19,00031362980
NO-006TG300013391235
NO-007BT200017551718
NO-008TV15001670
NO-009VL350023252557
NO-010DT200030642000
NO-011AG/KG500045594775
NO-012CT600045664278
NO-013HG200015311335
NO-014ST400015001382
NO-015BL/CM1000329266
Source: Calculated by authors.
Table 13. The calculated detour of case 1 and case 2.
InstanceCase 1Case 2InstanceCase 1Case 2
Avg.MaxAvg.MaxAvg.MaxAvg.Max
11.545.191.281.96131.555.191.281.96
21.485.191.271.96141.485.191.261.96
31.272.121.231.8151.292.121.241.8
41.292.121.211.56161.252.121.181.56
51.545.191.281.96171.4731.311.95
61.485.191.281.96181.342.751.261.96
71.32.121.241.8191.292.121.211.56
81.262.121.181.56201.242.121.171.56
91.555.191.281.96211.4731.281.96
101.485.191.261.96221.332.751.261.96
111.292.121.241.8231.292.121.211.56
121.252.121.171.56241.242.121.181.56
Avg.1.383.431.241.8
Source: Calculated by authors.
Table 14. The number of trips with respective utilization levels.
Utilization
Level
Case 2Case 3
TruckShipTruckShip
0–10%0000
10–20%0000
20–30%1100
30–40%1200
40–50%1200
50–60%1210
60–70%1410
70–80%2511
80–90%3622
90–100%2611287
Source: Calculated by authors.
Table 15. The comparison of all models.
Base CaseCase 1Case 2Case 3
Total cost ($)285,050293,316344,613347,415
Transport cost ($)117,666122,984169,299173,936
Fixed cost ($)164,343166,838171,784169,904
Emission cost ($)1604159216071618
Transfer cost ($)1437190219231957
Minimum detour1111
Maximum detour5.933.431.81.78
Average detour1.481.371.231.26
Truck utilization (Min)0.570.60.470.55
Truck utilization (Max)1111
Truck utilization (Avg.)0.960.960.960.96
Number of truck (Unit)161204471486
Flows of truck (Ton)3148402593299623
Ship utilization (Min)0.380.390.440.64
Ship utilization (Max)1111
Ship utilization (Avg.)0.810.820.820.86
Number of ship (Unit)24231615
Flows of ship (Ton)19,63319,00913,30113,172
Source: Calculated by authors.
Table 16. The range of the objective function.
eLower BoundUpper Bound
0.2286,261294,364
0.3286,261297,006
0.4286,261303,159
0.5286,261313,726
Source: Calculated by authors.
Table 17. Objective values in the fluctuation of node capacity.
e = 0.2e = 0.3e = 0.4e = 0.5
Objective function (λ)0.60030.52750.55130.5861
Total cost ($)289,500291,338293,844297,629
Transport cost ($)159,152160,645162,626163,320
Fixed cost ($)124,950124,200125,100129,000
Emission cost ($)1645162716301641
Transfer cost ($)3753486544883668
Source: Calculated by authors.
Table 18. Average values of vehicle capacity and detour factor of the fuzzy mixed integer linear programming (FMILP) model.
Deterministic
Model
Fuzzy Model
e = 0.2e = 0.3e = 0.4e = 0.5
Avg. of truck capacity0.9620.950.9390.9380.925
Avg. of ship capacity0.7590.7620.7790.7710.738
Avg. of detour factor1.4111.4111.3051.3141.344
Source: Calculated by authors.
Table 19. Values of membership functions.
e = 0.2e = 0.3e = 0.4e = 0.5
µ Ξ 0.60.5270.5510.586
µ E 1 1111
µ E 2 1111
µ E 3 1111
µ E 4 1111
µ E 5 1111
µ E 6 1111
µ E 7 0.6110.783
µ E 8 1111
µ E 9 1111
µ E 10 0.60.5270.5510.586
µ E 11 1110.892
µ E 12 0.61310.8360.597
µ E 13 0.8750.590.5670.619
µ E 14 1111
µ E 15 1111
Source: Calculated by authors.
Publisher’s Note: MDPI stays neutral with regard to jurisdictional claims in published maps and institutional affiliations.