Study of the Vibrational Predissociation of the NeBr2 Complex by Computational Simulation Using the Trajectory Surface Hopping Method

 , ,
, ,
Abstract
1. Introduction
2. Theory and Methods
2.1. TSH Method in the Diabatic Representation
- If , then there is not a real solution for this equation and the hop cannot occur. In this case, it is called a frustrated hop.
- If , the hop can occur, and the rescaling factor () is computed as:
- ∀
2.2. Treatment of Frustrated Hop
- the momentum keeps its sign;
- the momentum changes its sign.
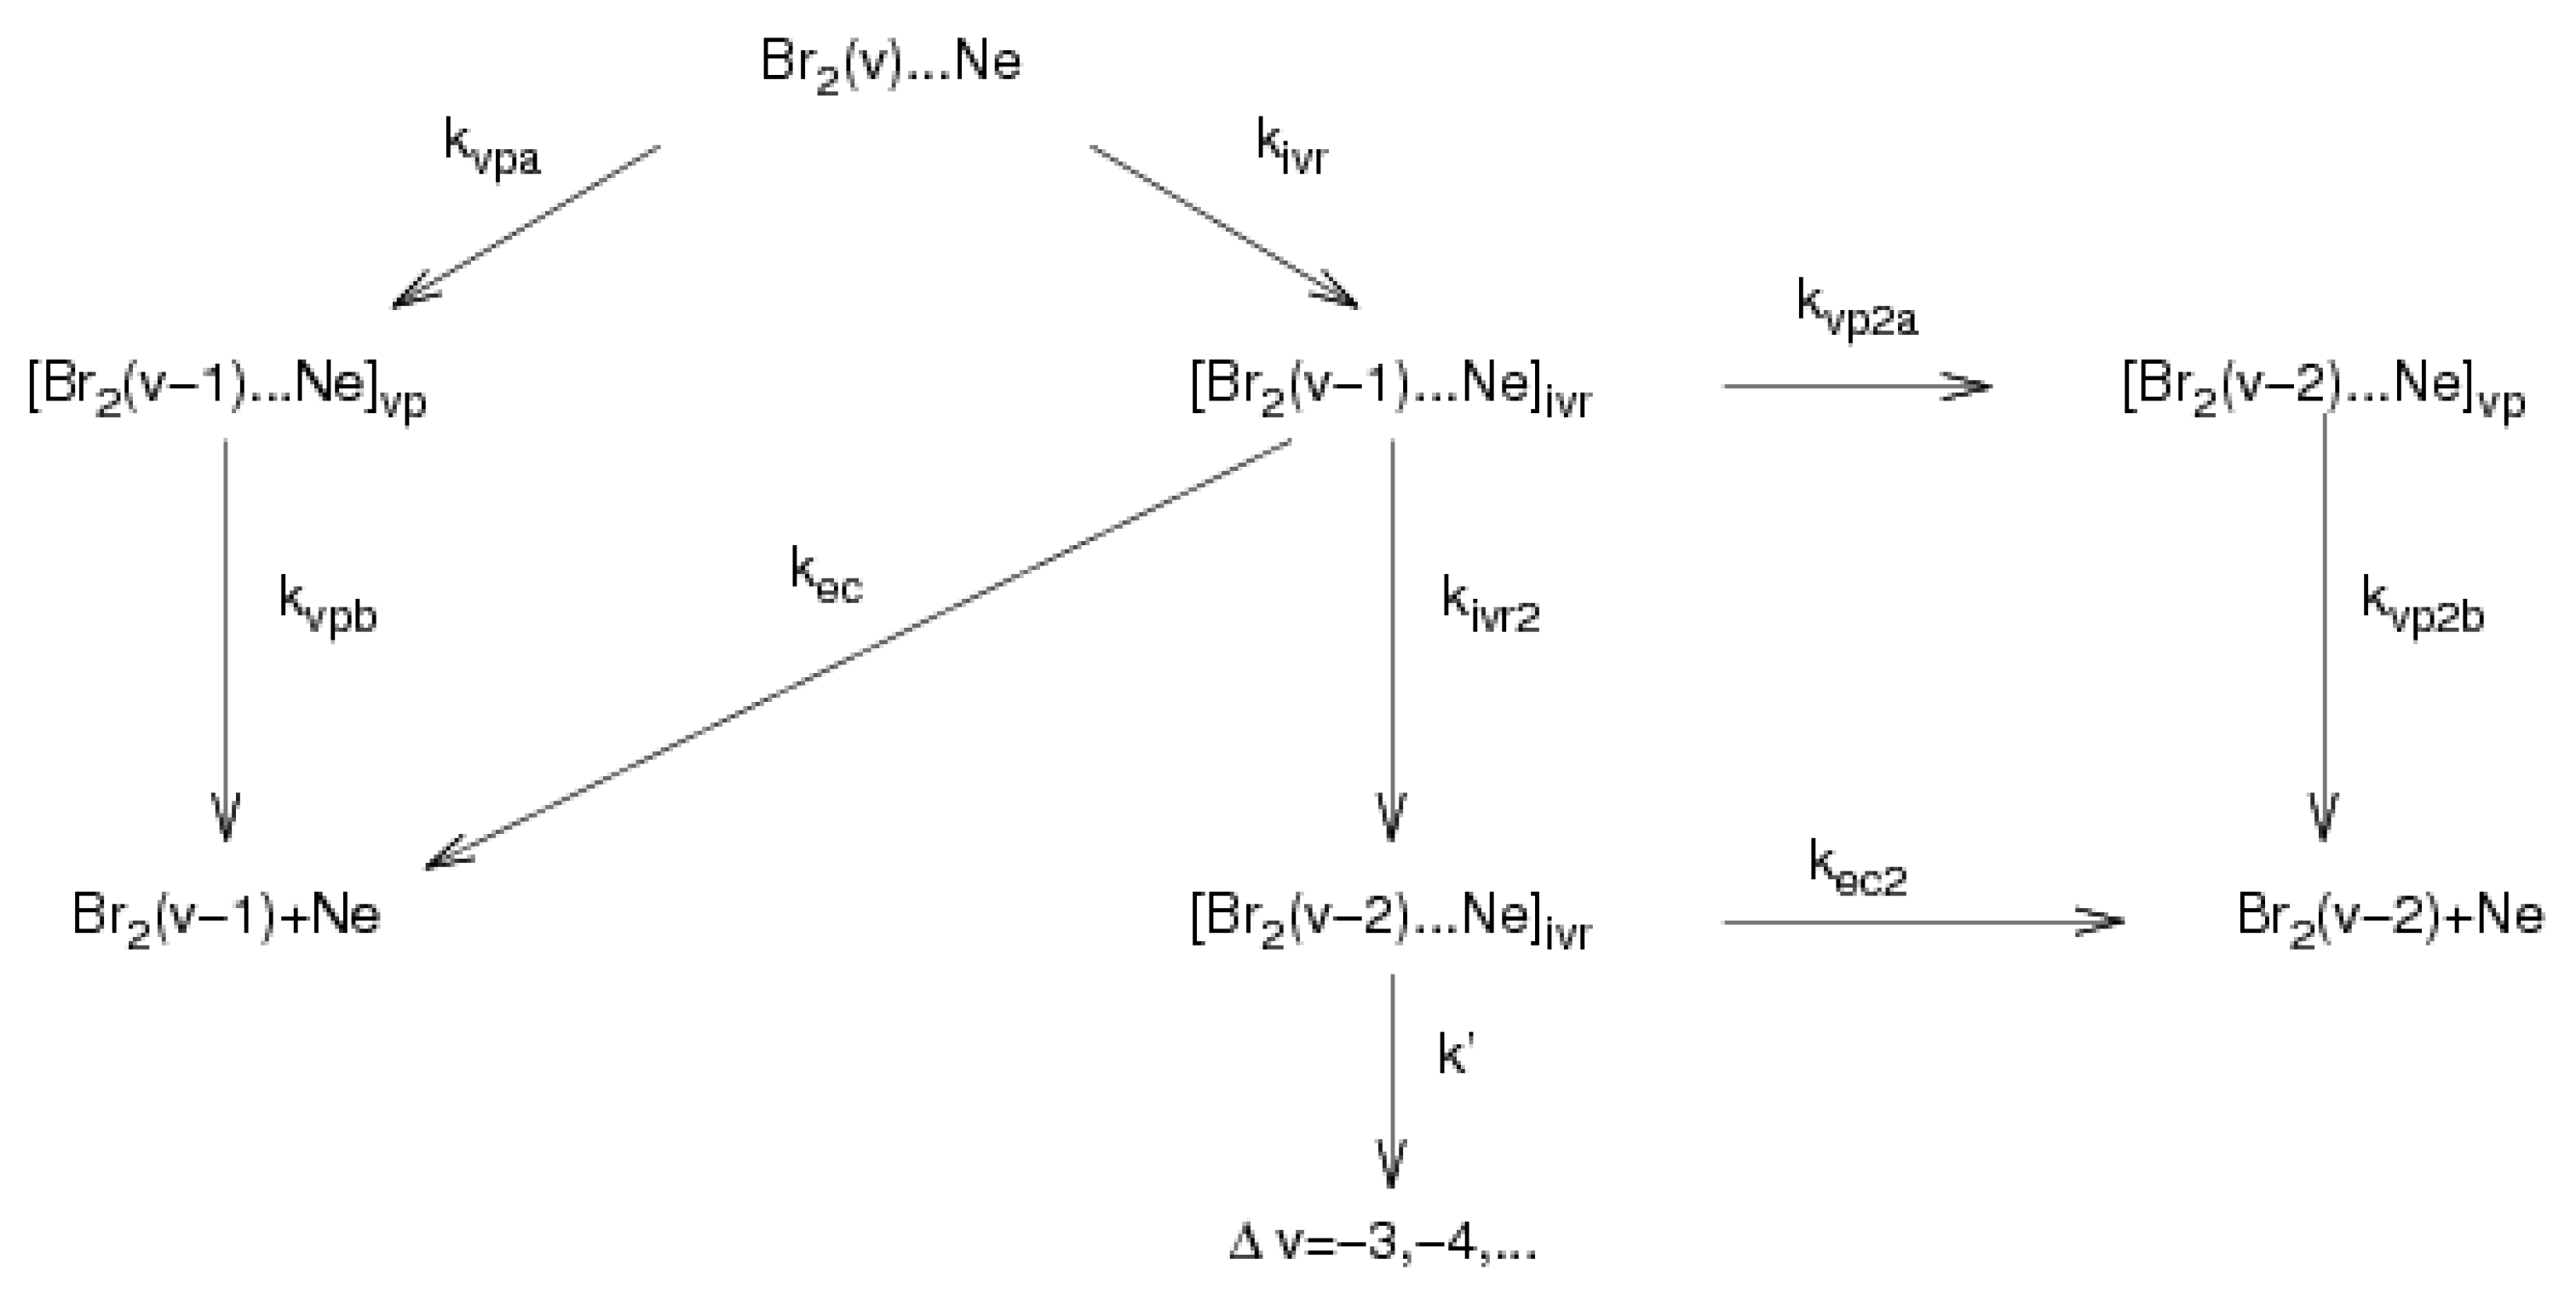
2.3. Kinetic Mechanism
2.4. Computational Details
- First stage
- Second stage
3. Results and Discussion
4. Conclusions
Perspectives
Author Contributions
Funding
Acknowledgments
Conflicts of Interest
Appendix A
- if , then .
- if , the system hops to surface . We considered ordered states .
- if , the system hops to surface .
- if , then system remains in state v.
References
- Wilberg, D.M.; Gutmann, M.; Breen, J.J.; Zewail, A.H. Real-time dynamics of clusters. I. I2 Xn (n = 1). J. Chem. Phys. 1992, 96, 198. [Google Scholar] [CrossRef]
- Gutmann, M.; Wilberg, D.M.; Zewail, A.H. Real-time dynamics of clusters. II. I2Xn, (n = 1; X = He, Ne, and H2), picosecond fragmentation. J. Chem. Phys. 1992, 97, 8037. [Google Scholar] [CrossRef]
- Borrell-Grueiro, O.; Márquez-Mijares, M.; Pajón-Suárez, P.; Hernández-Lamoneda, R.; Rubayo-Soneira, J. Fragmentation dynamics of NO–NO dimer: A quasiclassical dynamics study. Chem. Phys. Lett. 2013, 563, 20. [Google Scholar] [CrossRef]
- Rubayo-Soneira, J.; Garcıía-Vela, A.; Delgado-Barrio, G.; Villarreal, P. Vibrational predissociation of I2-Ne. A quasiclassical dynamical study. Chem. Phys. Lett. 1995, 243, 236. [Google Scholar]
- García-Vela, A.; Rubayo-Soneira, J.; Delgado-Barrio, G.; Villarreal, P. Quasiclassical dynamics of the I2–Ne2 vibrational predissociation: A comparison with experiment. J. Chem. Phys. 1996, 104, 8405. [Google Scholar] [CrossRef]
- Roncero, O.; Campos-Martıínez, J.; Hernández, M.I.; Delgado-Barrio, G.; Villarreal, P.; Rubayo-Soneira, J. Photodissociation of NeBr2(B) below and above the dissociation limit of Br2(B). J. Chem. Phys. 2001, 115, 2566. [Google Scholar] [CrossRef]
- Cabrera, J.A.; Bieler, C.R.; Olbricht, B.C.; Veer, W.E.v.; Janda, K.C. Time-dependent pump-probe spectra of NeBr2. J. Chem. Phys. 2005, 123, 054311. [Google Scholar] [CrossRef]
- González-Martínez, M.L.; Rubayo-Soneira, J.; Janda, K. Quasi-classical trajectories study of Ne79Br2(B) vibrational predissociation. Phys. Chem. Chem. Phys. 2006, 8, 4550. [Google Scholar] [CrossRef]
- García-Vela, A.; Janda, K.C. Quantum dynamics of Ne-Br2 vibrational predissociation: The role of continuum resonances and doorway states. J. Chem. Phys. 2006, 124, 034305. [Google Scholar] [CrossRef]
- Cline, J.I.; Evard, D.D.; Reid, B.P.; Sivakumar, N.; Thommen, F.; Janda, K.C. Structure and Dynamics of Weakly Bound Molecular Complexes; Weber, A., Ed.; Reidel: Dordrecht, The Netherlands, 1987; pp. 533–551. [Google Scholar]
- González-Martínez, M.L.; Arbelo-González, W.; Rubayo-Soneira, J.; Bonnet, L.; Rayez, J.-C. Vibrational predissociation of van der Waals complexes: Quasi-classical results with Gaussian-weighted trajectories. Chem. Phys. Lett. 2008, 463, 65. [Google Scholar] [CrossRef]
- Reed, S.K.; González-Martínez, M.L.; Rubayo-Soneira, J.; Shalashilin, D.V. Cartesian coupled coherence states simulations: NenBr2 dissociation as a test case. J. Chem. Phys. 2011, 134, 054110. [Google Scholar] [CrossRef]
- Borrell-Grueiro, O.; Baños-Rodrıíguez, U.; Márquez-Mijares, M.; Rubayo-Soneira, J. Vibrational predissociation dynamics of the nitric oxide dimer. Eur. Phys. J. D 2018, 72, 121. [Google Scholar] [CrossRef]
- Prosmiti, R.; Cunha, C.; Buchachenko, A.A.; Delgado-Barrio, G.; Villarreal, P. Vibrational predissociation of NeBr2(X, v=1) using an ab initio potential energy surface. J. Chem. Phys. 2002, 117, 22. [Google Scholar] [CrossRef]
- Miguel, B.; Bastida, A.; Zúñiga, J.; Requena, A.; Halberstadt, N. Time evolution of reactants, intermediates, and products in the vibrational predissociation of Br2⋯Ne: A theoretical study. J. Chem. Phys. 2000, 113, 22. [Google Scholar] [CrossRef]
- Stephenson, T.A.; Halberstadt, N. Quantum calculations on the vibrational predissociation of NeBr2: Evidence for continuum resonances. J. Chem. Phys. 2000, 112, 5. [Google Scholar] [CrossRef][Green Version]
- Tully, J.C. Molecular dynamics with electronic transitions. J. Chem. Phys. 1990, 93, 1061. [Google Scholar] [CrossRef]
- Rodríguez–Fernández, A.; Márquez-Mijares, M.; Rubayo-Soneira, J.; Zanchet, A.; García-Vela, A.; Bañares, L. Trajectory surface hopping study of the photodissociation dynamics of methyl radical from the 3s and 3pz Rydberg states. Chem. Phys. Lett. 2018, 712, 171–176. [Google Scholar] [CrossRef]
- Rodríguez–Fernández, A.; Márquez–Mijares, M.; Rubayo–Soneira, J.; Zanchet, A.; Bañares, L. Quasi-classical study of the photodissociation dynamics of the methyl radical. Rev. Cuba. Fis. 2017, 34, 41. [Google Scholar]
- Martens, C.C. Communication: Fully coherent quantum state hopping. J. Chem. Phys. 2015, 143, 141101. [Google Scholar] [CrossRef]
- Bastida, A.; Zúñiga, J.; Requena, A.; Halberstadt, N.; Beswick, J.A. Competition between electronic and vibrational predissociation in Ar–I2 (B): A molecular dynamics with quantum transitions study. Chem. Phys. 1999, 240, 229–239. [Google Scholar] [CrossRef]
- Nangia, S.; Jasper, A.W.; Miller, T.F., III; Truhlar, D.G. Army ants algorithm for rare event sampling of delocalized nonadiabatic transitions by trajectory surface hopping and the estimation of sampling errors by the bootstrap method. J. Chem. Phys. 2004, 120, 3586. [Google Scholar] [CrossRef]
- Subotnik, J.E.; Ouyang, W.; Landry, B.R. Can we derive Tully’s surface-hopping algorithm from the semiclassical quantum Liouville equation? Almost, but only with decoherence. J. Chem. Phys. 2013, 139, 214107. [Google Scholar] [CrossRef]
- Buchachenko, A.A.; Baisogolov, A.Y.; Stepanov, N.F. Interaction Potentials and Fragmentation Dynamics of the Ne-Br2 Complex in the Ground and Electronically Excited States. J. Chem. Soc. Faraday Trans. 1994, 90, 3229–3236. [Google Scholar] [CrossRef]
- Burden, R.L.; Faires, J.D. Numerical Analysis, 9th ed.; Julet, M., Ed.; Brooks/Cole Cengage Learning: Boston, MA, USA, 2010; pp. 173–259. [Google Scholar]
- Crespo-Otero, R.; Barbatti, M. Recent advances and perspectives on nonadiabatic mixed quantum-classical dynamics. Chem. Rev. Am. Chem. Soc. 2018, 118, 15. [Google Scholar] [CrossRef]
- Requena, A.; Halberstadt, N.; Beswick, J.A.; Sola, I.; Bastida, A.; Zúñiga, J. Application of trajectory surface hopping to vibrational predissociation. Chem. Phys. Lett. 1997, 280, 185–187. [Google Scholar]
- Jasper, A.W.; Truhlar, D.G. Improved treatment of momentum at classically forbidden electronic transitions in trajectory surface hopping calculations. Chem. Phys. Lett. 2003, 369, 60–67. [Google Scholar] [CrossRef]
- Spitzer, P.; Zierhofer, C.; Hochmair, E. Algorithm for multicurve-fitting with shared parameters and a possible application in evoked compound action potential measurements. Biomed. Eng. Online 2006, 5, 13. [Google Scholar] [CrossRef]
- Nejad-Sattari, M.; Stephenson, T.A. Fragment rotational distributions from the dissociation of NeBr2: Experimental and classical trajectory studies. J. Chem. Phys. 1997, 1016, 5454. [Google Scholar] [CrossRef]


| 16 | 0.024 | 4.456 | 4.600 | 81,019 | 8,050,000 | 1,704,730 | 51,948 | 2,523,430 | 604.148 | 361.258 | 24,245 |
| 17 | 0.110 | 5.716 | 5.887 | 60,896 | 882.070 | 733.634 | 15,961 | 846.233 | 150.962 | 1948 | 153,785 |
| 18 | 0.055 | 5.410 | 5.620 | 20,124 | 2935.5 | 7713 | 28,970 | 818.535 | 12.646 | 3335 | 23,207 |
| 19 | 1.484 | 12.805 | 13.991 | 63,190 | 223.312 | 1907 | 15,356 | 217.080 | 499.413 | 496.263 | 11,185 |
| 20 | 2.742 | 14.914 | 16.970 | 55,278 | 185 | 734.147 | 7684 | 171.379 | 18.734 | 769.698 | 1929 |
| 21 | 11.999 | 35.608 | 41.82 | 2475 | 162.684 | 14.016 | 211.989 | 123.330 | 169.610 | 197.089 | 791.290 |
| 22 | 3.934 | 14.956 | 18.821 | 5723 | 228.020 | 26.9789 | 367.425 | 39.847 | 932.066 | 145.867 | 3575 |
| 23 | 4.685 | 16.540 | 20.996 | 5263 | 168.904 | 29.035 | 1023 | 118.771 | 268.294 | 102.744 | 3339 |
| 24 | 3.966 | 13.345 | 17.937 | 138.804 | 237.482 | 1.030 | 157.180 | 1911 | 4412 | 551.141 | 86.110 |
| 25 | 10.397 | 19.055 | 29.327 | 149.336 | 142.794 | 12.052 | 132.472 | 1821 | 1507 | 261.619 | 86.482 |
| 26 | 11.937 | 16.686 | 29.887 | 100.351 | 126.820 | 0.157 | 118.667 | 3502 | 6501 | 1001.190 | 48.893 |
| 27 | 115.150 | 0.153 | 105.520 | 76.882 | 0.110 | 25.249 | 50.949 | 1826 | 692,718 | 34.391 | 32.183 |
| 28 | 69.295 | 2.478 | 71.940 | 85.525 | 1250 | 2.920 | 1604 | 12,152 | 16,751 | 444.040 | 5.350 |
| 29 | 133.750 | 3.642 | 127.640 | 81.460 | 7.287 | 2.087 | 1536 | 12,276 | 11,827 | 431.941 | 5.684 |
Publisher’s Note: MDPI stays neutral with regard to jurisdictional claims in published maps and institutional affiliations. |
© 2020 by the authors. Licensee MDPI, Basel, Switzerland. This article is an open access article distributed under the terms and conditions of the Creative Commons Attribution (CC BY) license (http://creativecommons.org/licenses/by/4.0/).
Share and Cite
García-Alfonso, E.; Márquez-Mijares, M.; Rubayo-Soneira, J.; Halberstadt, N.; Janda, K.C.; Martens, C.C. Study of the Vibrational Predissociation of the NeBr2 Complex by Computational Simulation Using the Trajectory Surface Hopping Method. Mathematics 2020, 8, 2029. https://doi.org/10.3390/math8112029
García-Alfonso E, Márquez-Mijares M, Rubayo-Soneira J, Halberstadt N, Janda KC, Martens CC. Study of the Vibrational Predissociation of the NeBr2 Complex by Computational Simulation Using the Trajectory Surface Hopping Method. Mathematics. 2020; 8(11):2029. https://doi.org/10.3390/math8112029
Chicago/Turabian StyleGarcía-Alfonso, Ernesto, Maykel Márquez-Mijares, Jesús Rubayo-Soneira, Nadine Halberstadt, Kenneth C. Janda, and Craig C. Martens. 2020. "Study of the Vibrational Predissociation of the NeBr2 Complex by Computational Simulation Using the Trajectory Surface Hopping Method" Mathematics 8, no. 11: 2029. https://doi.org/10.3390/math8112029
APA StyleGarcía-Alfonso, E., Márquez-Mijares, M., Rubayo-Soneira, J., Halberstadt, N., Janda, K. C., & Martens, C. C. (2020). Study of the Vibrational Predissociation of the NeBr2 Complex by Computational Simulation Using the Trajectory Surface Hopping Method. Mathematics, 8(11), 2029. https://doi.org/10.3390/math8112029