Article

Machinery Failure Approach and Spectral Analysis to Study the Reaction Time Dynamics over Consecutive Visual Stimuli: An Entropy-Based Model

1
Departamento de Telecomunicaciones, Universidad de Pinar del Río, Pinar del Río E-20100, Cuba
2
Instituto Universitario de Matemática Pura y Aplicada, Grupo de Modelización Interdisciplinar, InterTech, Universitat Politècnica de València, E-46022 Valencia, Spain
3
Departamento de Psicología Evolutiva y de la Educación, Grupo de Modelización Interdisciplinar, InterTech, Universitat de València, E-46010 Valencia, Spain
*
Author to whom correspondence should be addressed.
Current affiliation: Department of Electrical Engineering, Electronics, Automation and Applied Physics, Technical University of Madrid, E-28012 Madrid, Spain
Mathematics 2020, 8(11), 1979; https://doi.org/10.3390/math8111979
Submission received: 26 September 2020 / Revised: 26 October 2020 / Accepted: 3 November 2020 / Published: 6 November 2020

Abstract

:
The reaction times of individuals over consecutive visual stimuli have been studied using an entropy-based model and a failure machinery approach. The used tools include the fast Fourier transform and a spectral entropy analysis. The results indicate that the reaction times produced by the independently responding individuals to visual stimuli appear to be correlated. The spectral analysis and the entropy of the spectrum yield that there are features of similarity in the response times of each participant and among them. Furthermore, the analysis of the mistakes made by the participants during the reaction time experiments concluded that they follow a behavior which is consistent with the MTBF (Mean Time Between Failures) model, widely used in industry for the predictive diagnosis of electrical machines and equipment.

1. Introduction

The literature relates an important number of works on human reaction times to visual stimuli [1,2,3,4,5,6,7,8]. Fast responding is a very common scenario in daily life and in a broad variety of situations in industry [9], behavioral economics, finances [10], sports [11], and health [12], just to mention just a few examples.
The response time (RT) data have been proven to be correlated to cognitive disorders [8,13,14]. The most commonly diagnosed cognitive disorder in childhood affecting the RT is the Attention Deficit and Hyperactivity Disorder (ADHD). For instance, ADHD and autism spectrum disorder in children aged 7–10 years have been studied in reference [15] in order to gain insights into the attentional fluctuations, related to increased response time variability.
The fast Fourier transform (FFT) has been used to study the intra-individual variability (IIV) in children with ADHD. For instance, an FFT analysis of response time data in reference [16] revealed that there is a characteristic periodicity (frequency of 0.05 Hz) in children with ADHD. Similar studies yielded a periodicity at low frequency (0.03–0.07 Hz) observed in several tasks, namely, Sustained Attention to Response Task (SART) [17], the Ericksen Flanker Task [18], and the Go/NoGo Task [19].
On the other hand, error rates during response time experiments have been intensively studied in the literature as they retain important information about the neurological disorder under study. For children with ADHD, a relationship between error rates and the ex-Gaussian parameters of the response times has been found [20]. Similarly, increased error rates and long response times have been also found in developing readers and adults during yes/no and go/no-go tasks [21].
In this work, we will apply spectral analysis techniques such as the fast Fourier transform and entropy of the spectrum in order to get insights into the correlations and patterns in the response times of a group of individuals over consecutive visual stimuli. We will also perform a failure analysis of the mistakes made by the individuals while responding to the visual stimuli.
This article is organized as follows. In Section 2, the description of the sample (Section 2.1) along with the response time experiments (Section 2.2) are included. In Section 3, the methods used for the data analysis are described. The Results and Discussion are presented in Section 4, and the Conclusions in Section 5.

2. Description of the Sample and Visual Stimuli Experiments

2.1. Participants

A sample of 190 school-aged children from Valencia (Spain) took part in the computer-based experiments. The ages ranged from 8 to 10 years. Prior to the experiments, we made sure that all participants were healthy and had no brain injury, seizures, or any other neurological issue. The experiments were performed under the authorizations of the school management and the Regional Authority for Education. We also followed the recommendations of the Secretariat of Education of the Valencian Community and a protocol approved by the Government of Valencia. We also obtained the consent of the children’s parents or legal guardians as stated by the Declaration of Helsinki [22].

2.2. Reaction Time Experiments

For the reaction time experiments, a child version of the Attentional Network Test (ANT Child) was chosen [23]. Every computerized experiment lasted for about 6–7 min in which 166 stimuli were presented randomly to the participants for 2500 s. The visual stimuli were very simple and uncorrelated to any cultural background or educational training. The reaction times were recorded by DMDX [24], a Windows program widely used in the literature [8,25,26,27]. During each trial, 5 black fish in a white background and aligned horizontally were presented. The participants were asked to identify the right direction of the central fish by pressing the “M” key (the fish looking to the right) or “Z” otherwise. In general, Attention Network Tasks like the one in this work, pursue to assess three attentional networks: alerting, orienting, and executive control [28], which are closely related among themselves [29,30]. Alerting network is assessed by changes in reaction time depending on a warning signal. Orienting is related to changes in the RT depending on where the target appears on the screen. Finally, the efficiency of the executive control is tested by asking the children to answer about the direction of an image placed at the center in between neutral, congruent, or incongruent flankers. The neutral case was when there was only the central fish. The congruent case was where the surrounding fish were placed in the same direction as the central fish. The third case was where the surrounding fish were placed in the opposite direction in respect to the central one. In total, our experiments involved 166 × 190 = 31540 reaction times.

3. Methodology

For finite duration discrete-time signals { x ( n ) } n = 0 N 1 (which represents the signal to be processed) with N points of length, the classic method for estimation of the spectrum using the fast Fourier transform is defined as
X ( f ) = | n = 0 N 1 x ( n ) e j 2 π f n N |
where f is the instantaneous frequency of the signal to be processed, j is the imaginary unit, and X ( f ) is the amplitude spectrum of the vector response times. The spectrum-based analysis is used as a supplement to the calculation of spectral entropy [31].
The entropy of a discrete-valued random variable attains a maximum value for a uniformly distributed variable. Considering a discrete random variable Z with M states z 1 ,   z 2 ,   z M and state probabilities p 1 ,   p 2 ,   p M , that is P ( Z = z i ) = p i , the entropy of Z is defined as
H ( Z ) = i = 1 M p i log 2 ( p i )
According to Equation (2), the spectral entropy of the { x ( n ) } n = 0 N 1 signal is a measure of its spectral power distribution. The concept is based on Shannon’s entropy, which quantifies the amount of information as well as its coherence. The spectral entropy treats the normalized energy distribution of the signal in the frequency domain as a probability distribution and calculates its Shannon entropy. Then, for a signal { x ( n ) } n = 0 N 1 , the power spectrum S ( f ) is defined as the square value of Equation (1):
S ( f ) = ( X ( f ) ) 2
The probability distribution P ( f ) is then
P ( f ) = S ( f ) i S ( i )
where S ( i ) is the individual energy contribution for each data sample. Then, the spectral entropy, E , is defined as [31]:
E = f = 0 F P ( f ) · log 2 P ( f )
Normalizing:
E n = f = 0 F P ( f ) · log 2 P ( f ) log 2 F
where F is the total number of frequency points. The denominator, log 2 F represents the maximal spectral entropy of white noise, uniformly distributed in the frequency domain with flat power spectrum.
Once Equation (6) has been obtained, if the Pearson correlation coefficient based on the data covariance matrix is applied to the result, in order to search for linearity in the uniformity patterns, the following is obtained:
R ( i , j ) = C 2 ( E n ( x ) , E n ( y ) , ) C 2 ( E n ( x ) ,   E n ( x ) ) · C 2 ( E n ( y ) ,   E n ( y ) )
where R ( i , j ) is the matrix of pairwise covariance calculations between each variable, used to quantify the spectral content in terms of energy, that is, to quantify the group coherence, as a linearity relationship in a vector by means of its spectral energy.

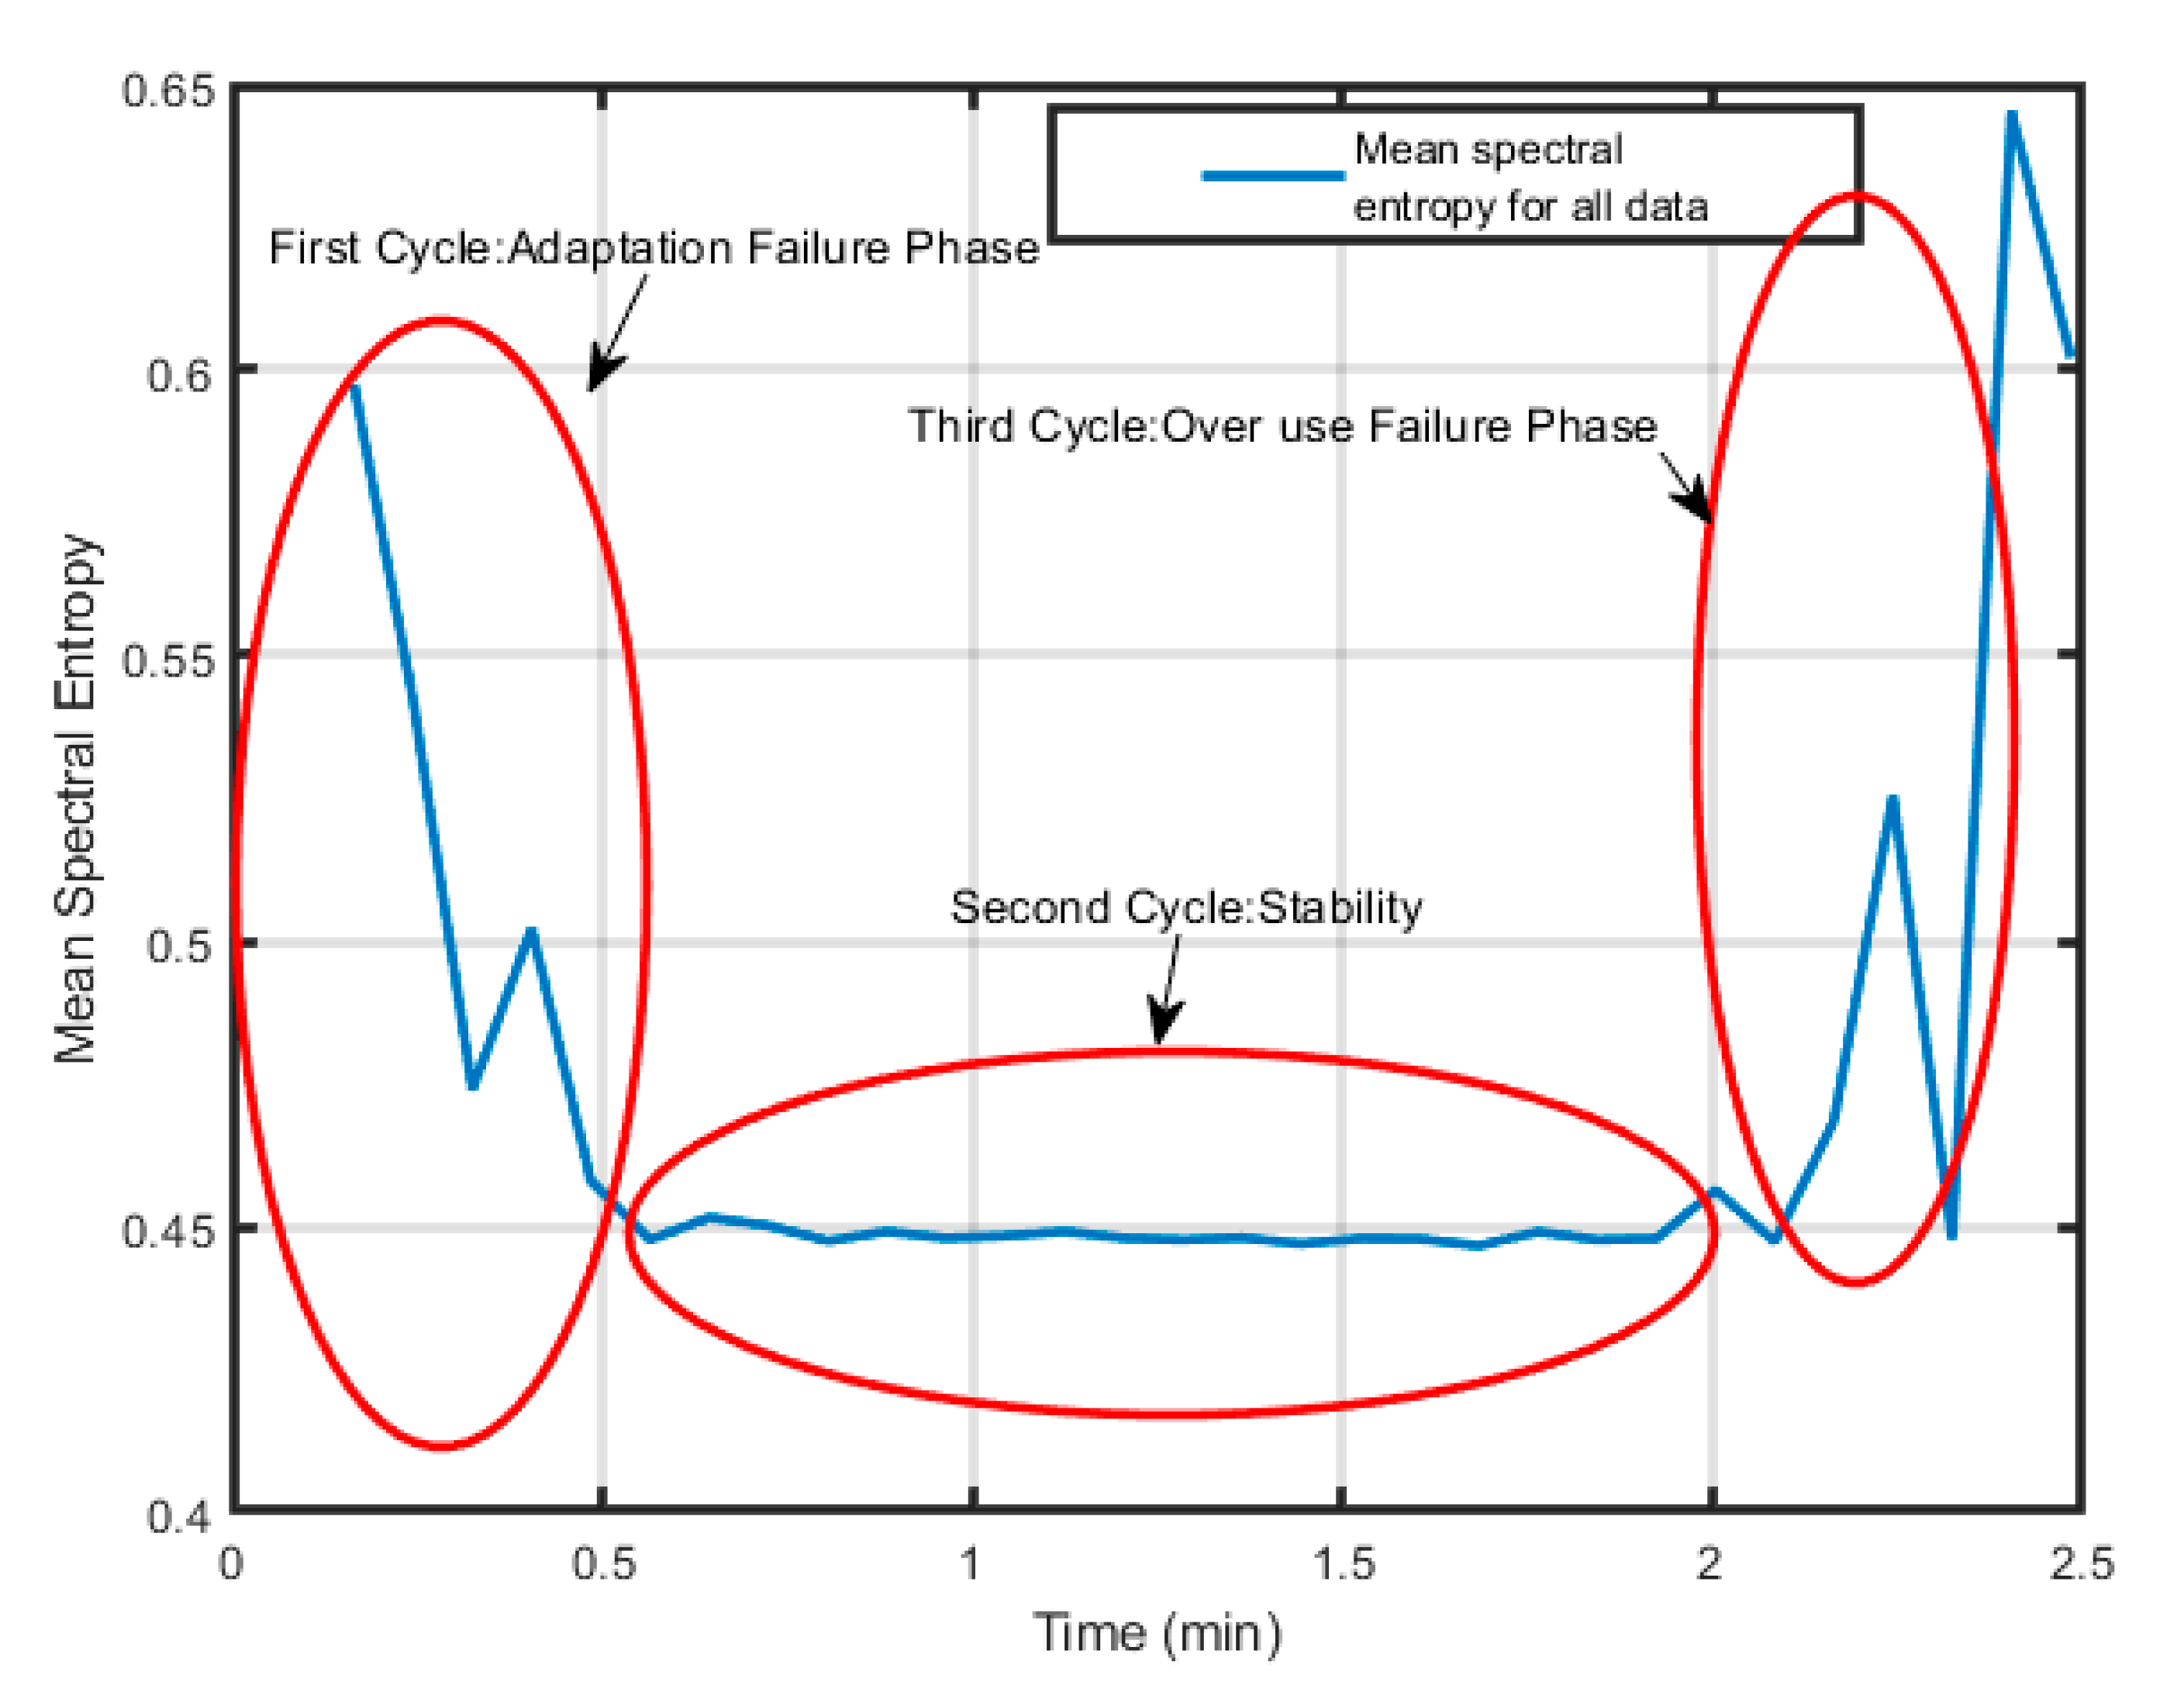
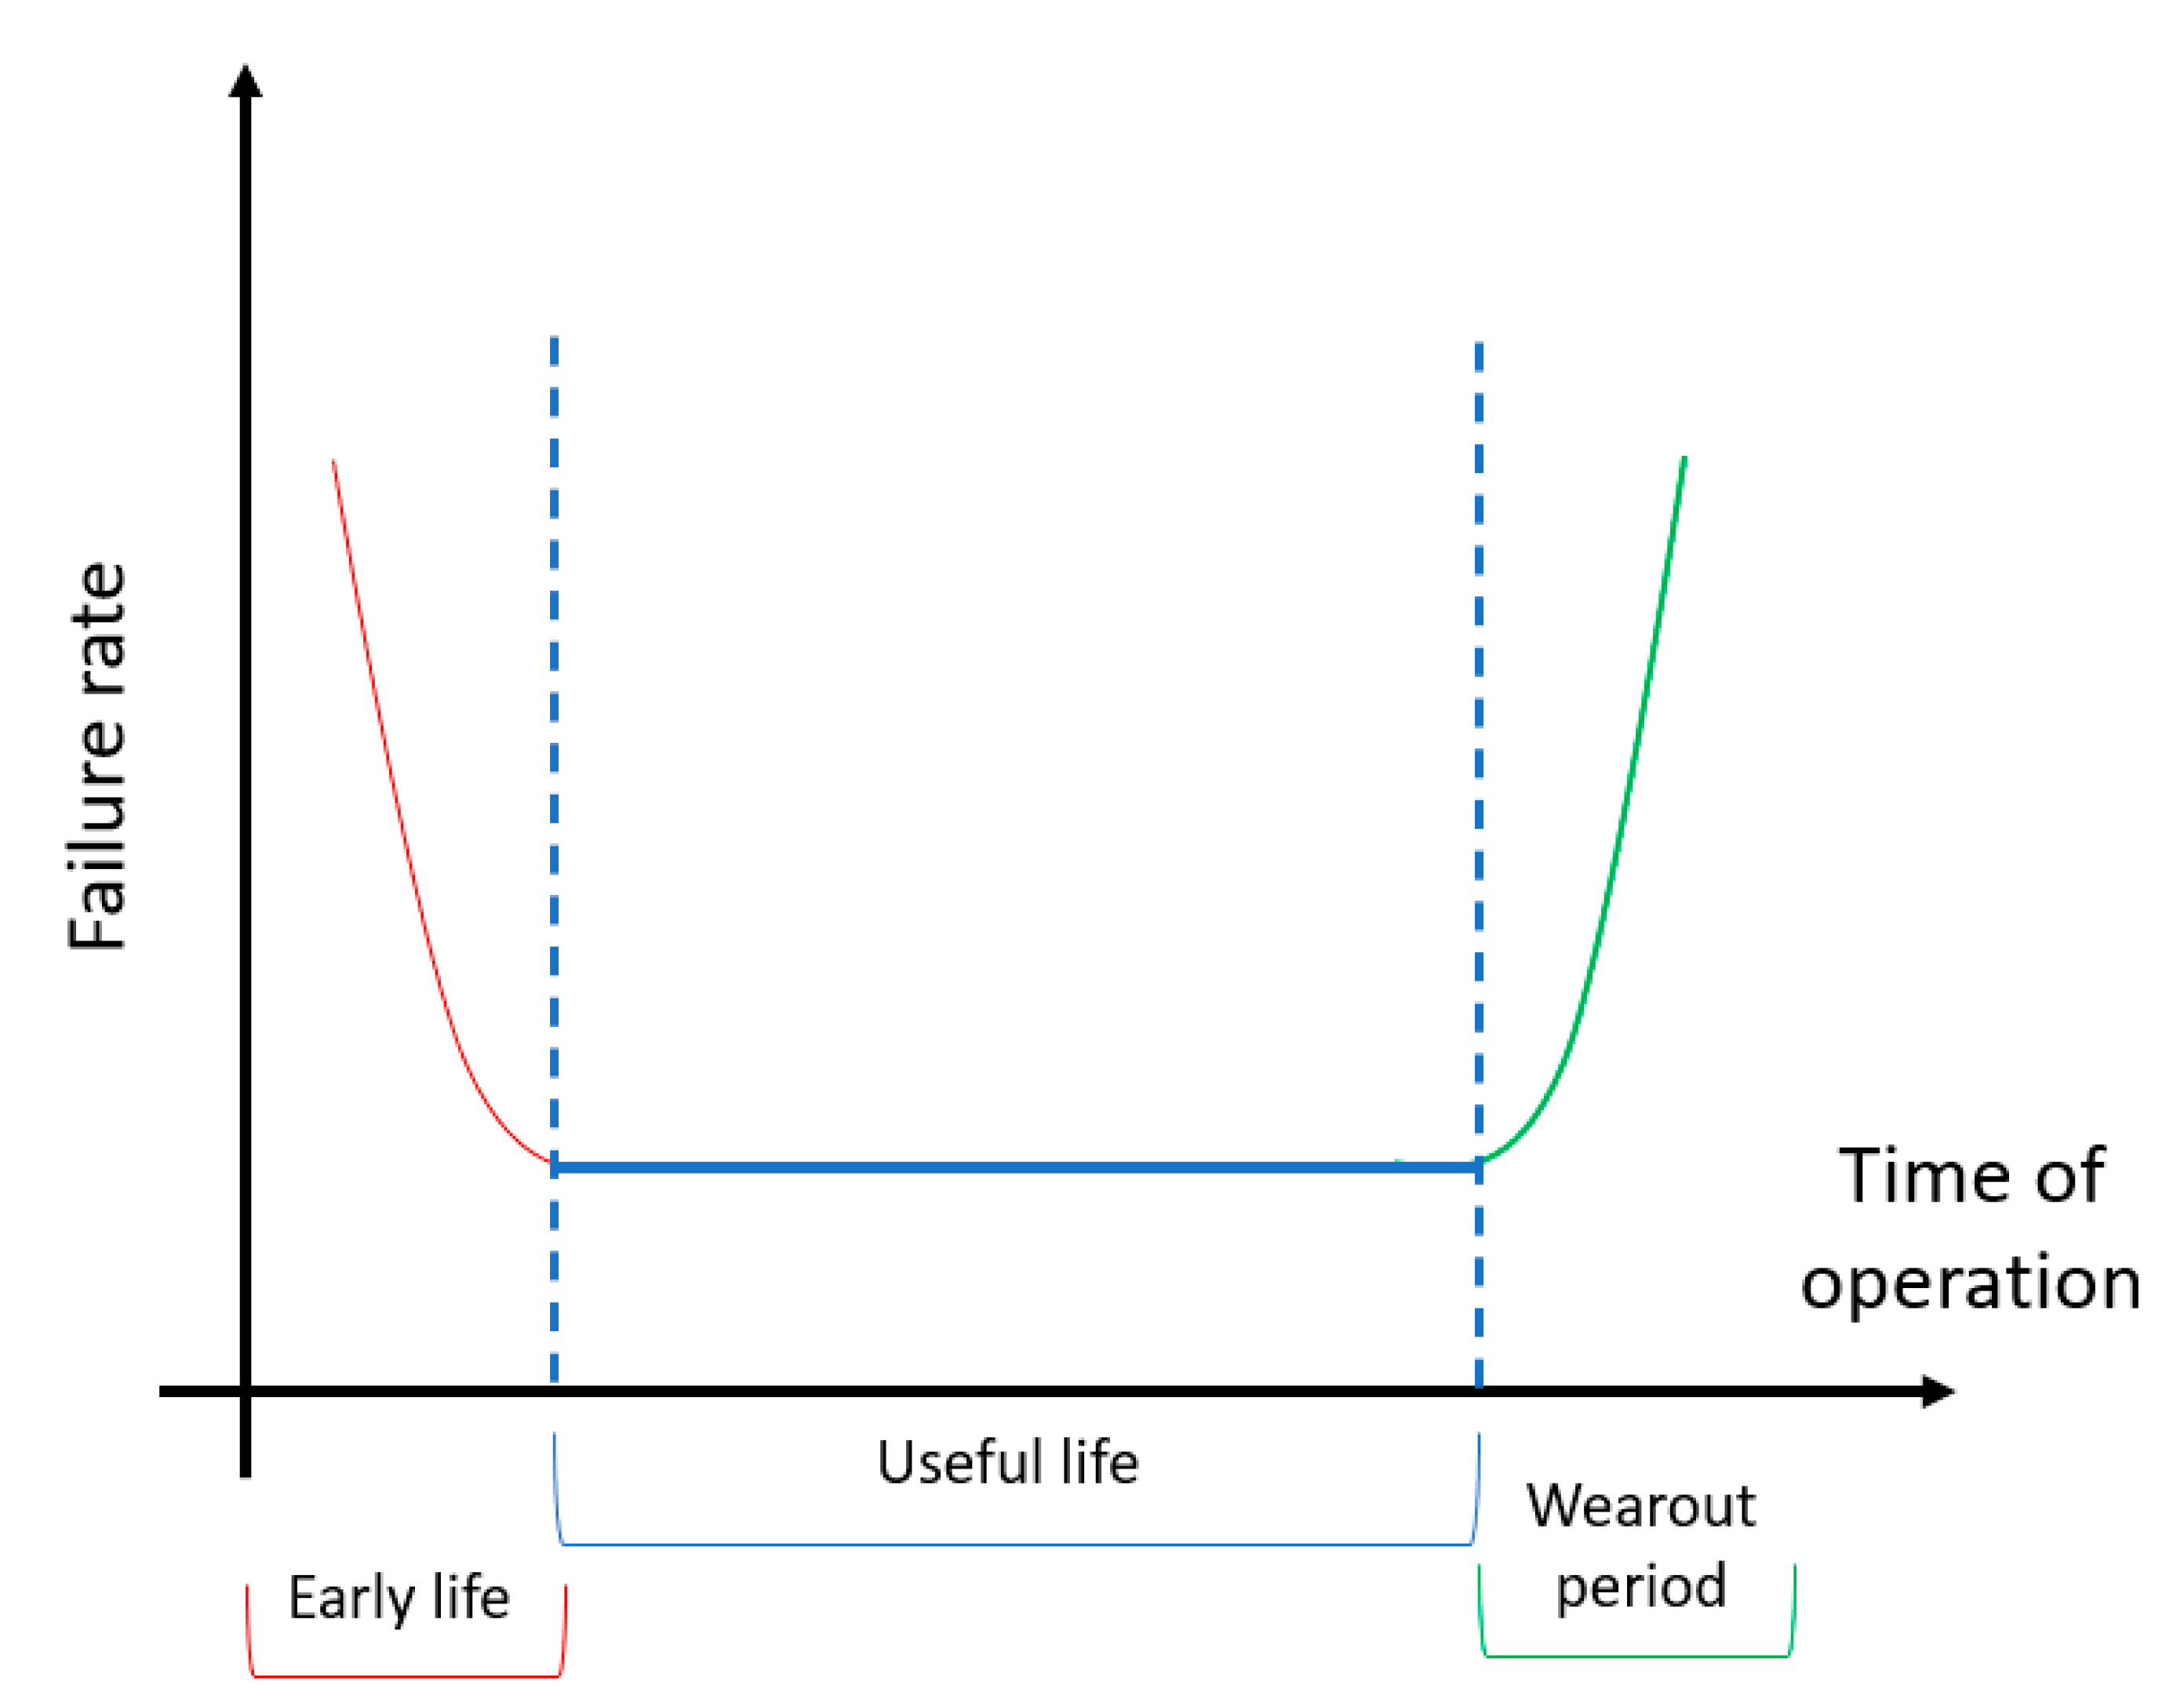
Failures Entropy Based Model

To model the failures of each one of the participants, the use of the mean spectral entropy over the total sample of 190 participants is proposed, and following the analogy that may exist with the MTBF (Mean Time Between Failures) model that can be defined in terms of the expected value of the failure density function, namely f ( t ) :
M T B F : 0 t   f ( t )   d t
Let be X i j a discrete matrix where ( i = 1 , M , j = 1 , N ) correspond to a row, column index and M and N are the number of rows and columns respectively in the matrix. Then, the mean value for each row of the discrete matrix is given by
X m e a n ( i ) = 1 N j = 0 N X ( i , j )
where N and i are the total number of points and the row index, respectively. Substituting Equation (9) in Equation (1) and applying the power spectrum, we have
P m e a n ( f ) = | t = 0 N 1 X m e a n ( t ) e j 2 π f t N | 2
Performing the probability distribution (according to Equation (4)) of Equation (10) and applying the spectral entropy, we have
E = f = 0 F P m e a n ( f ) i P m e a n ( i ) · log 2 ( P m e a n ( f ) i P m e a n ( i ) )
The Equation (11) describes the proposed algorithm for the failures process in the experiment described in Section 2 and whose result is associated with the discrete MTBF machinery failures model:
M T B F = i = 1 K E i P ( E i )
where K is the number of points in the vector E 1 , E 2 , E 3 , E K , a discrete random variable with probability function P ( E i ) .

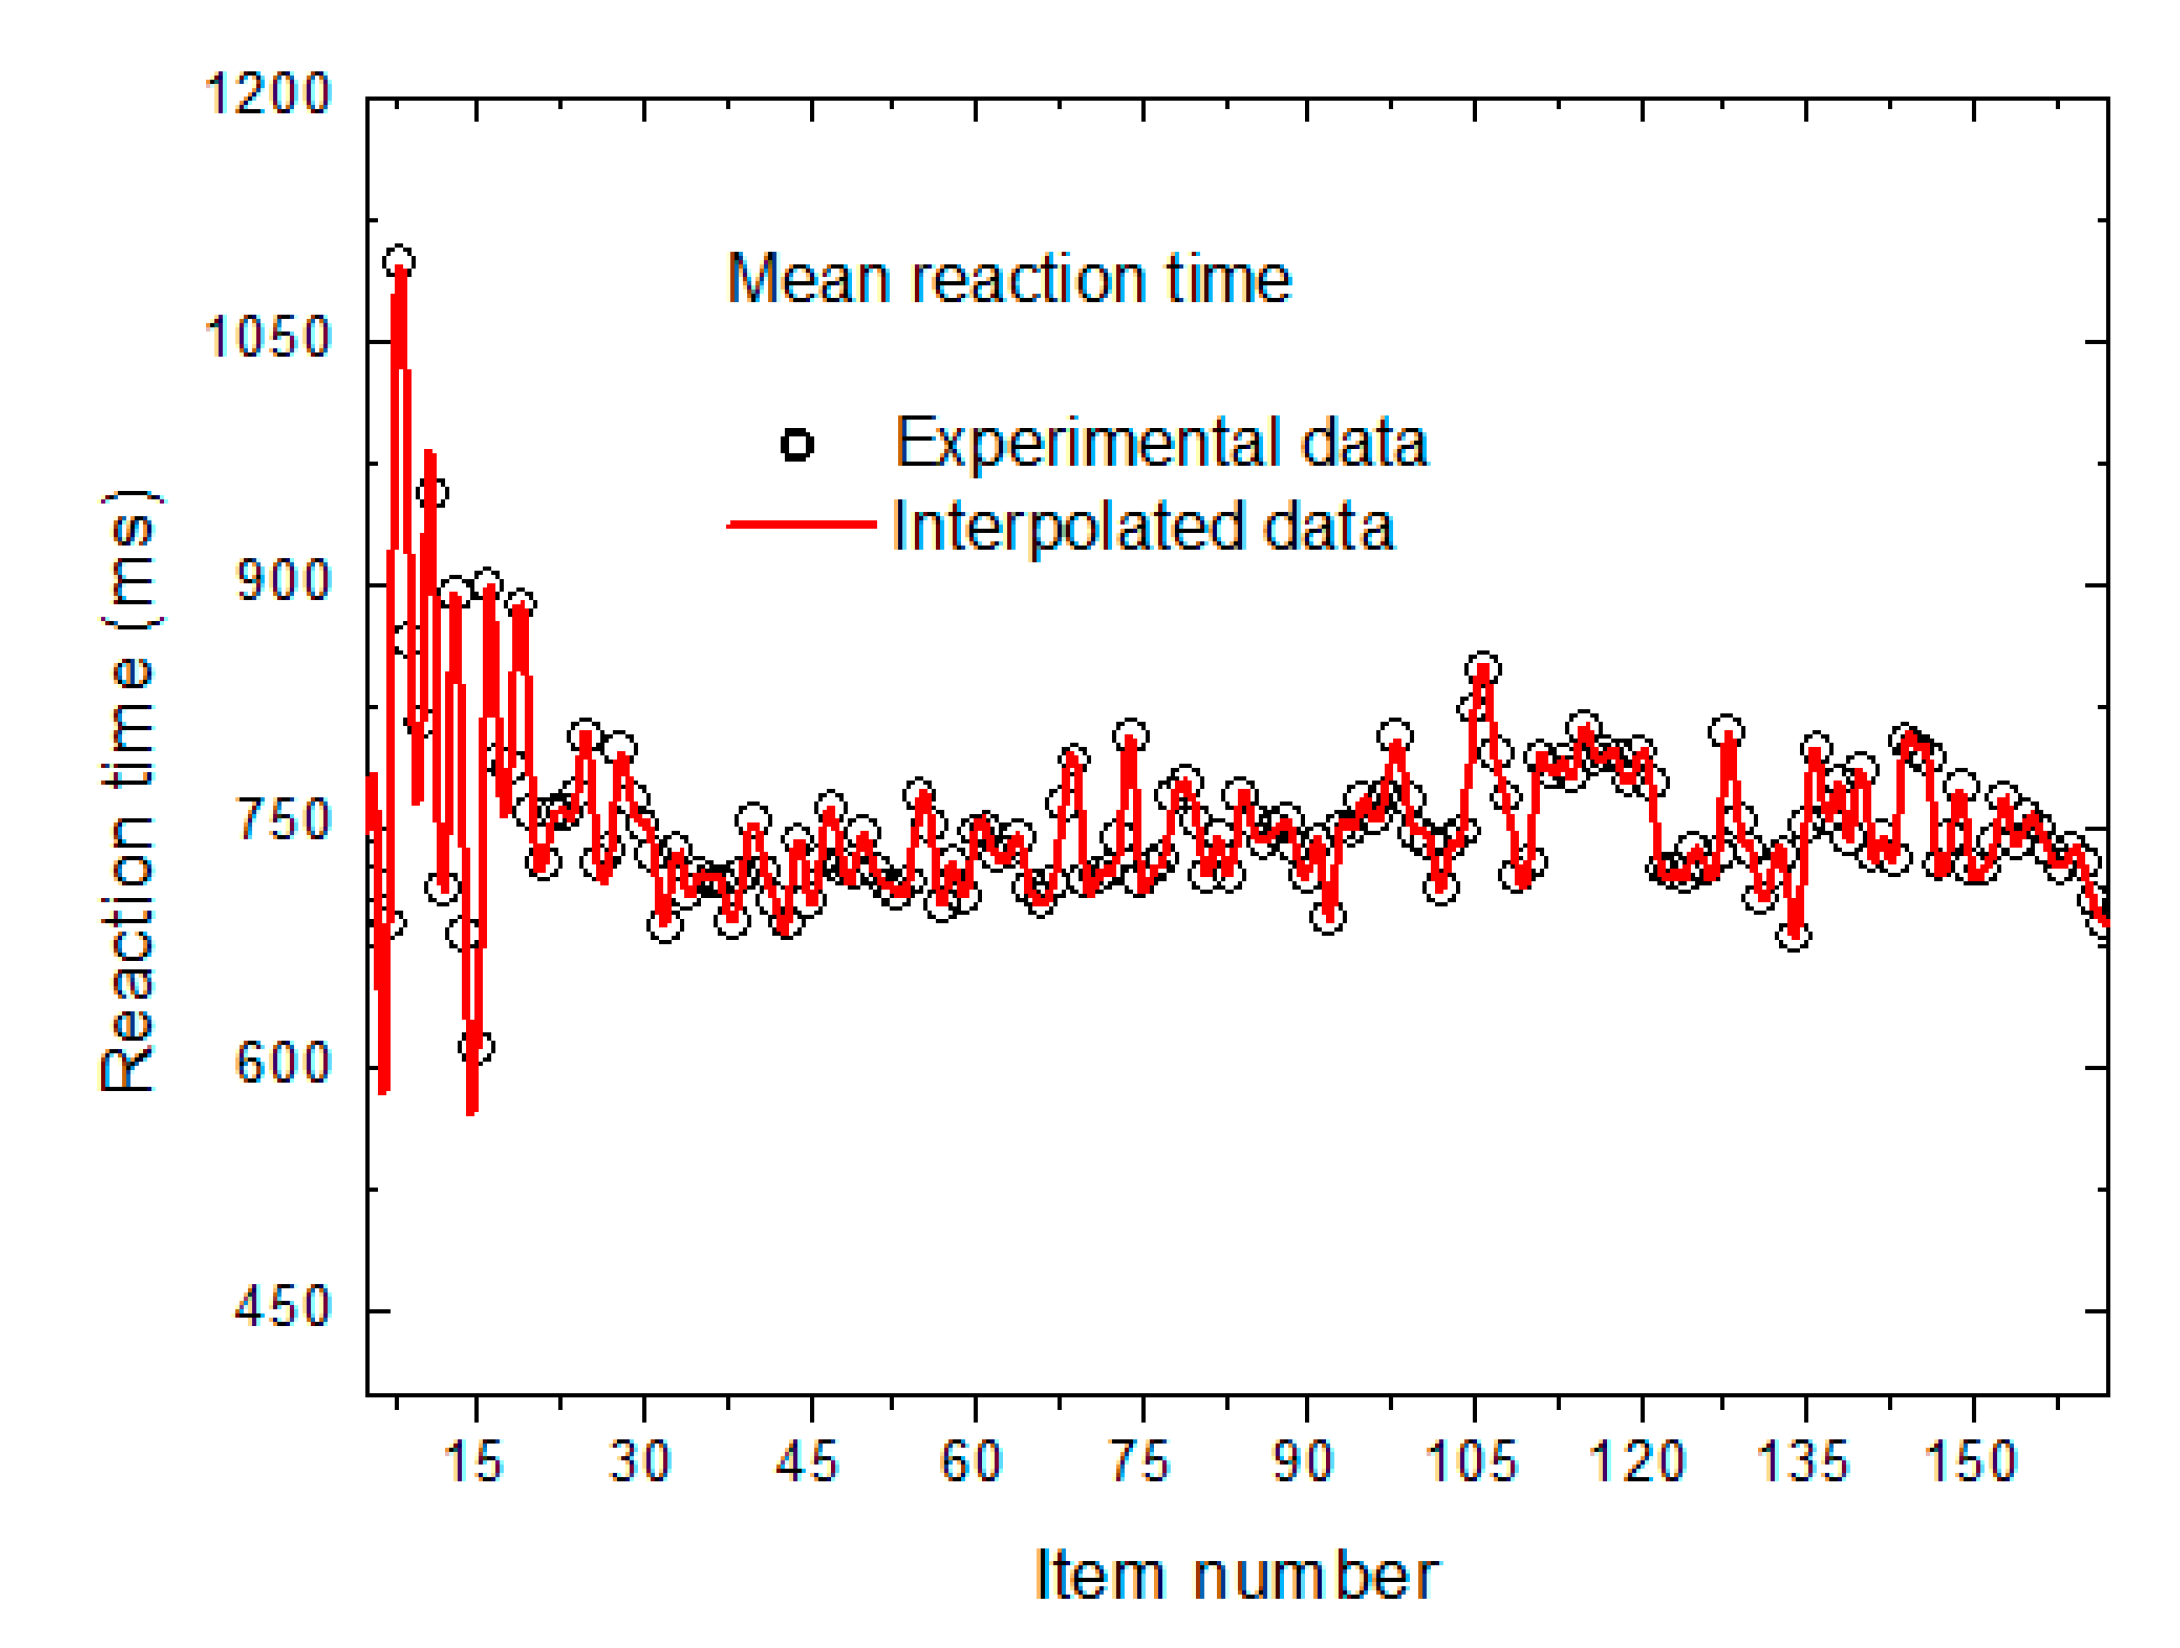
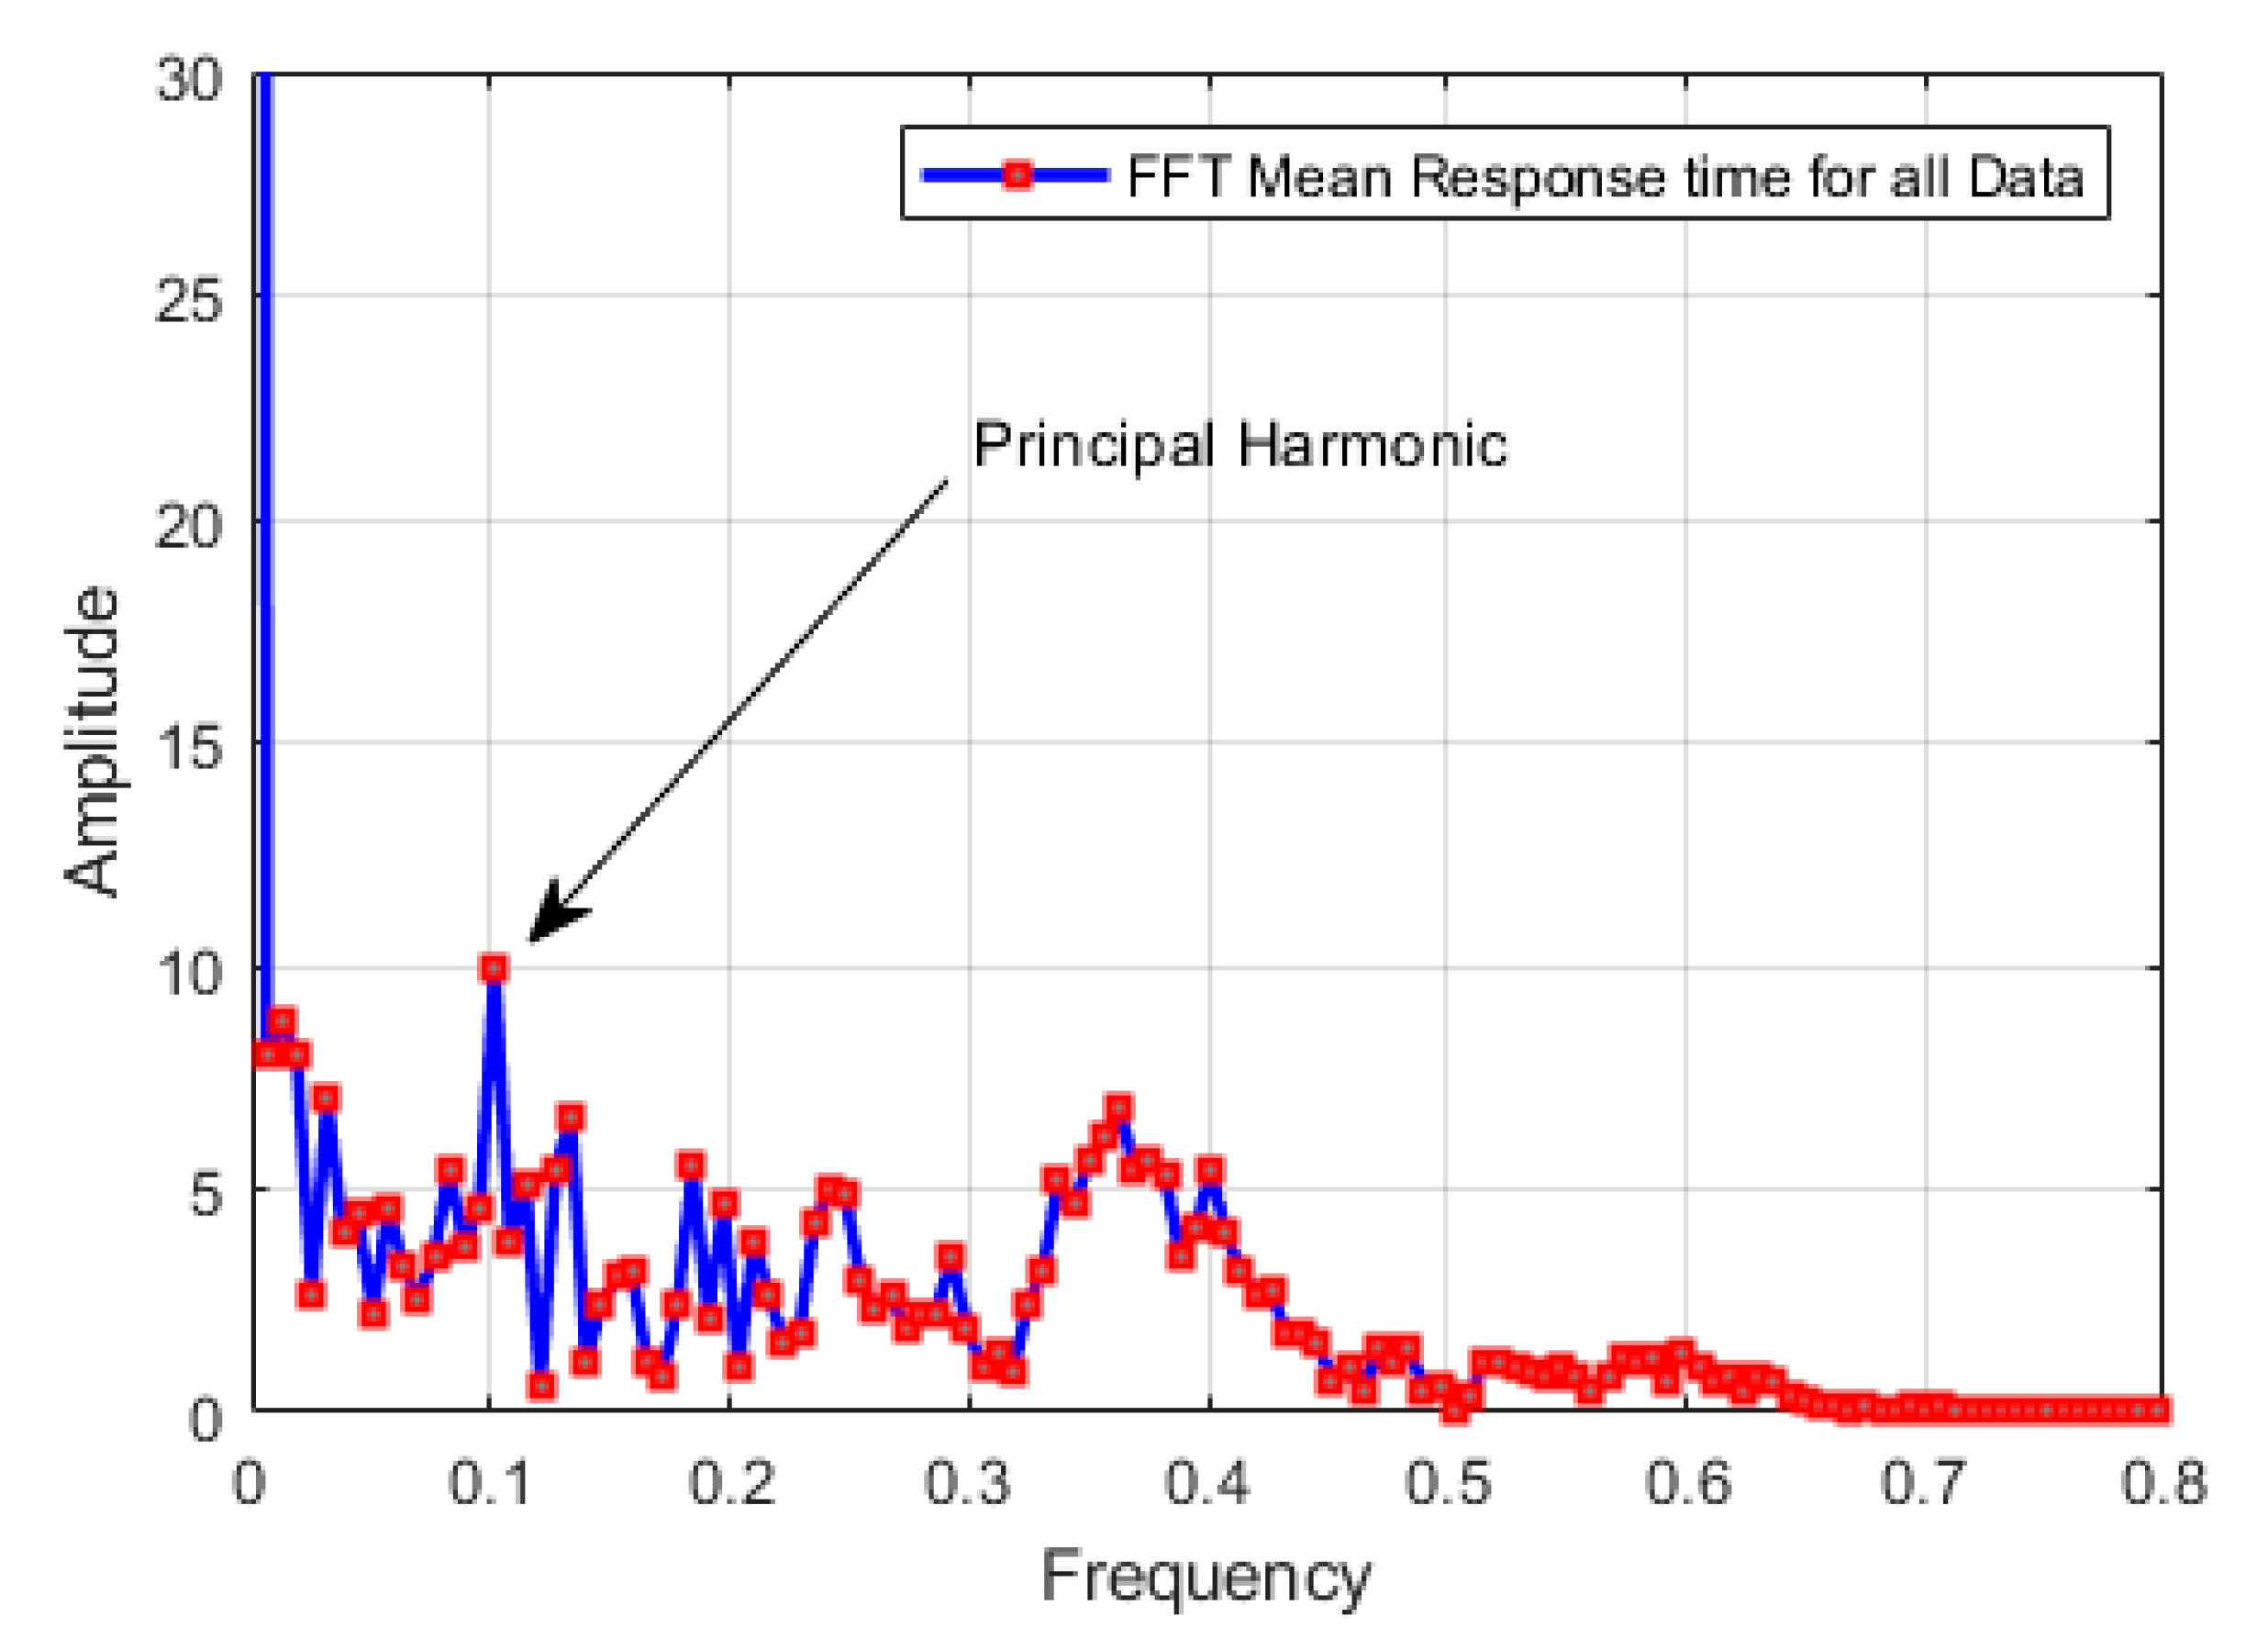
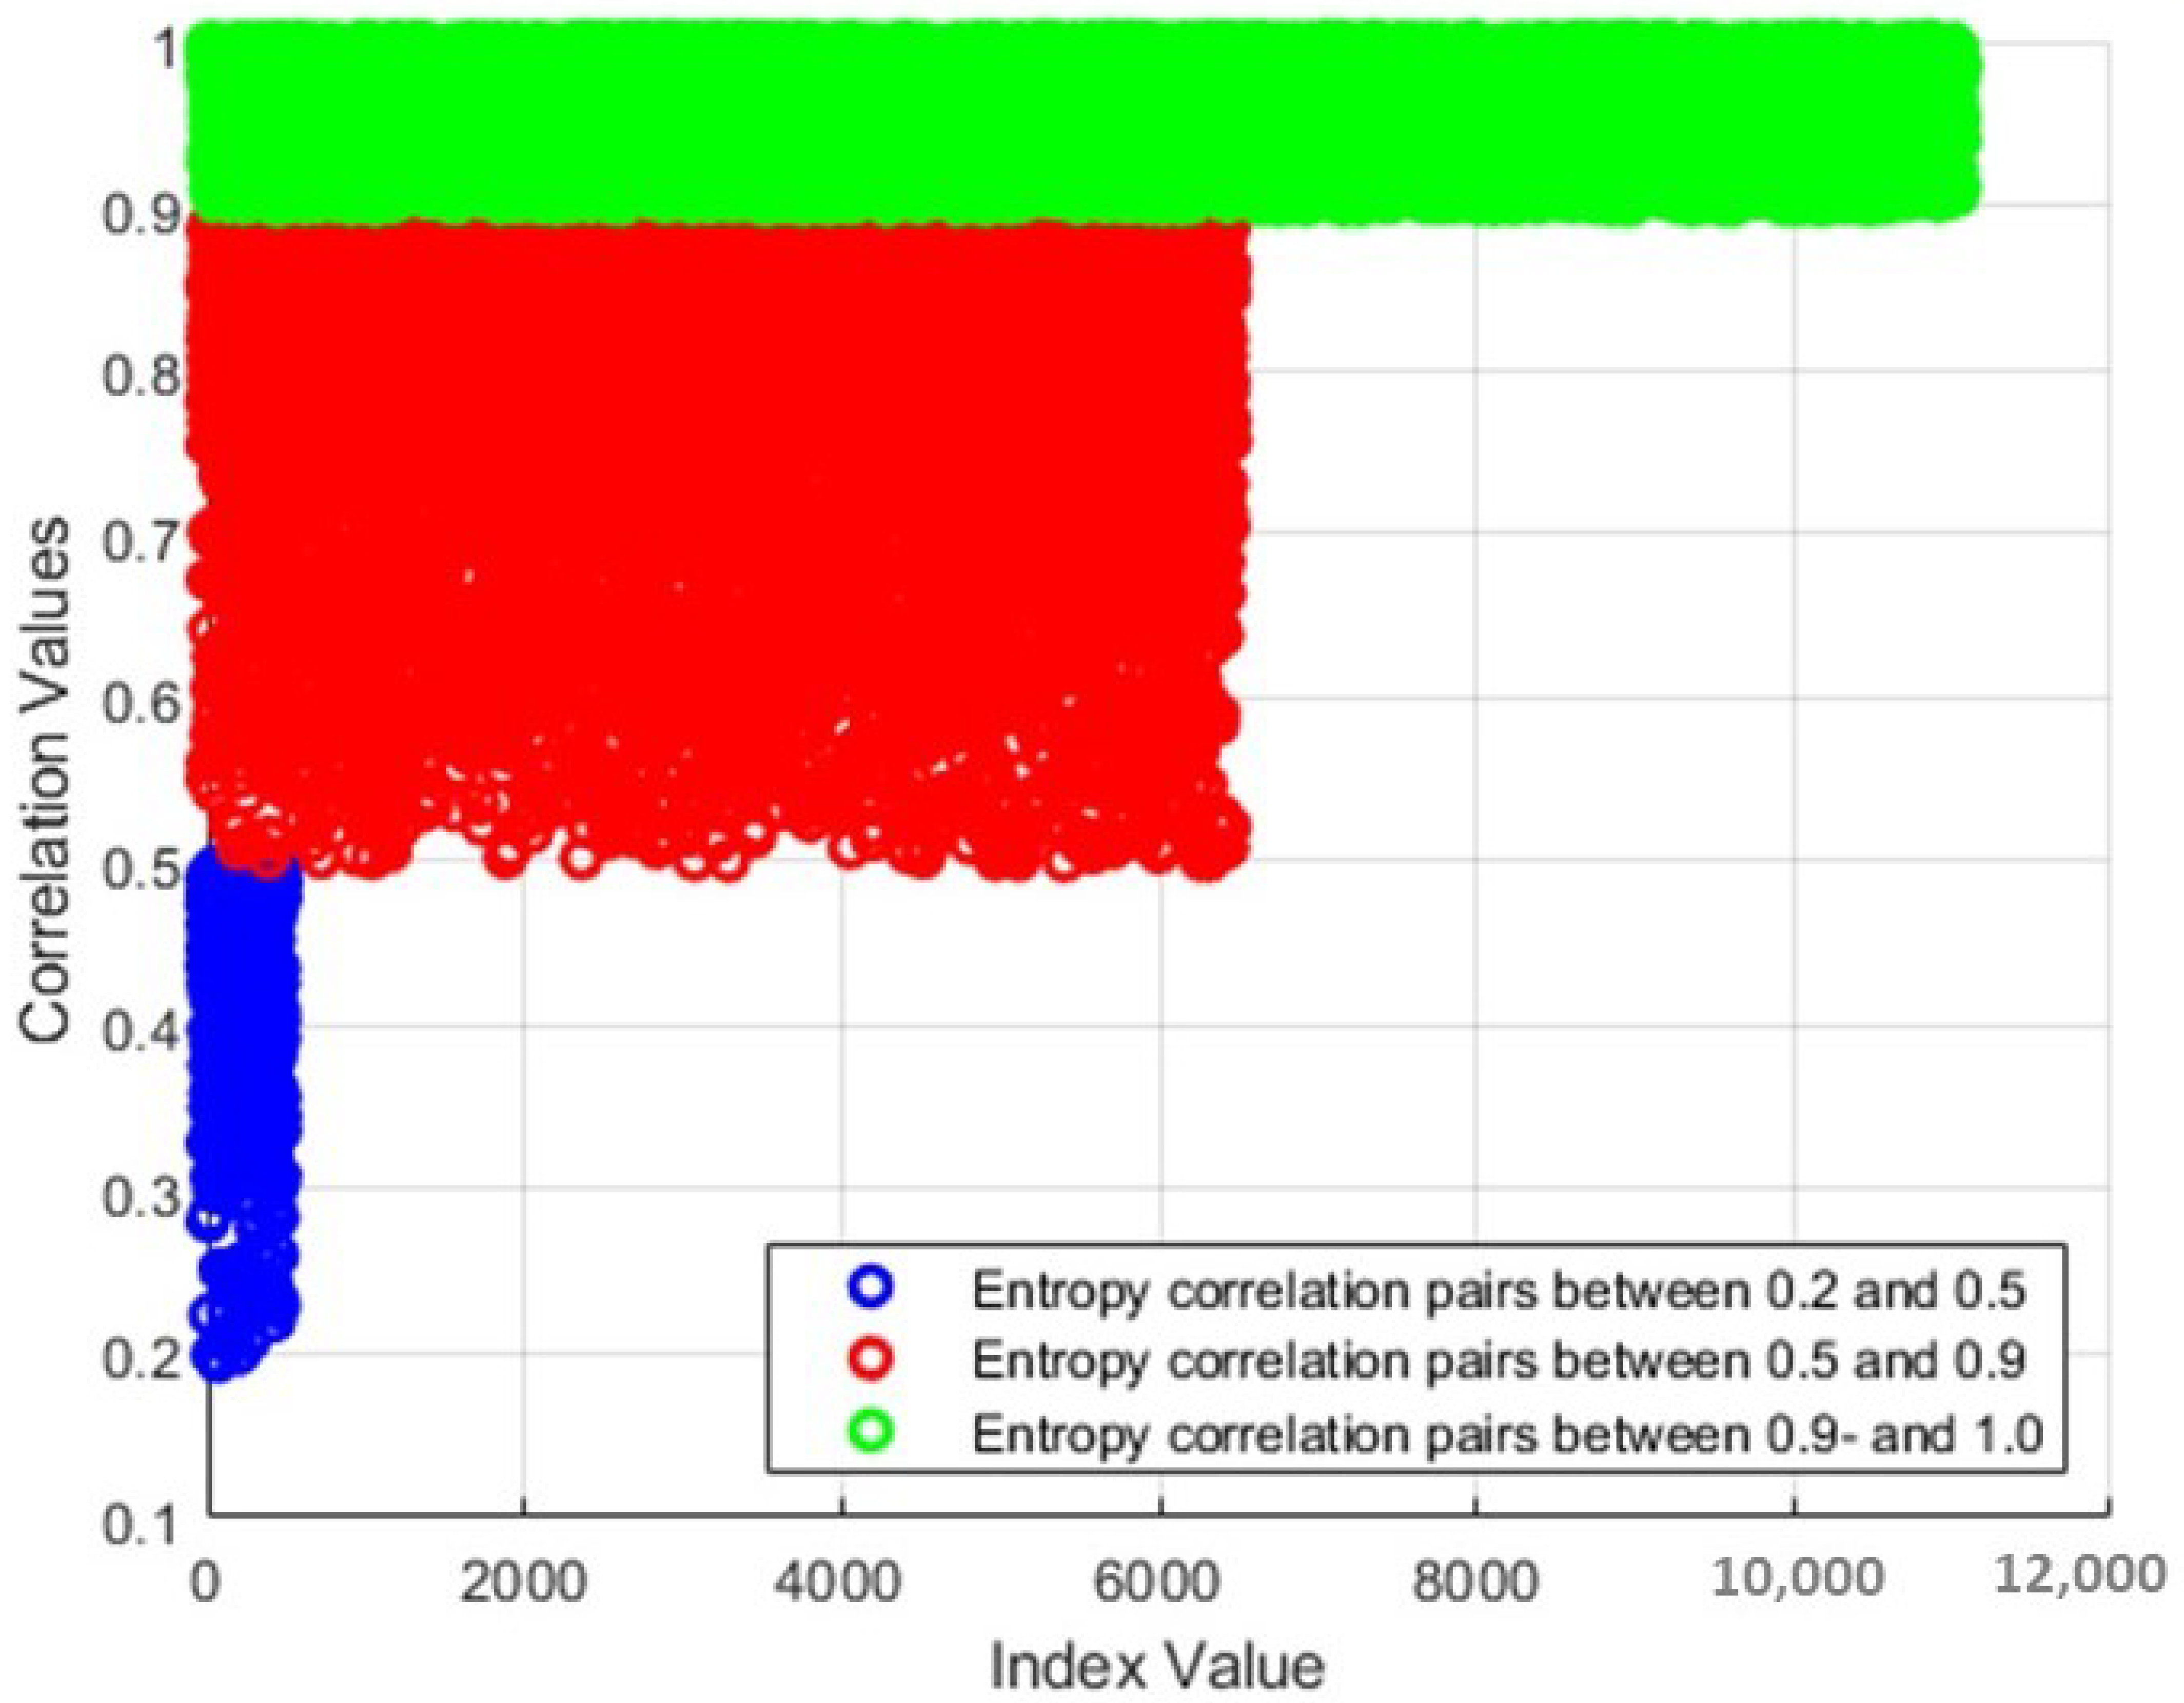
4. Results and Discussion

As a first analysis and to have a measure of the behavior of the response times throughout the entire data, the calculation of the mean value of the RTs to each stimulus over the sample of 190 children is performed. In other words, we construct a response time vector 166 (the number of items in the experiments) values of length, in which each component corresponds to the average response time of each visual stimulus over the sample of 190 participants. The results are shown in Figure 1 with open circles. This time, the mistakes made by the participants while responding to the visual stimuli are not considered. This variable will be analyzed later.
For the purpose of completing the data of response time over consecutive stimuli for each participant, interpolations have been applied. Specifically, we have chosen an interpolation method in the framework of the reproducing kernel Hilbert space (RKHS) formalism, which has been successfully applied in references [32,33,34,35,36,37] to represent the potential energy surface (PES) of small molecular systems. We decided to use this interpolation method as it shows several advantages over other methods, for instance, they are generic and parameter-free and for the interpolation at each point, the whole dataset is considered. By using the whole dataset, this method can retain any pattern manifested in the response time data over the consecutive stimuli.
This redensification of the data (upsampling) has been performed in order to increase the spectral resolution and to make the frequency spectrum look better visually. The original values are kept as well as their frequencies so that this process does not affect the original data. The results of the averaged RTs over the sample of 190 participants using this interpolation procedure are also presented in Figure 1 with a solid red line.
The fast Fourier transform (FFT) technique has been applied to the response times of each participant in order to obtain the spectrum. Figure 2 shows the average spectrum over the sample of participants. The average spectrum shows some frequency peaks, indicating that there are frequencies that are repetitive throughout the sample of all participants, which can result in a common spectral pattern. The main frequency of the spectrum is at 0.1 item−1, which means that there is a common pattern every 10 items. The corresponding period of the pattern would be approximately 7.5 s, considering a mean value over the participants of 750 ms within the first 10 items (Figure 1). Studies of intra-individual variability in children have found that children with ADHD show a characteristic pattern in the response at a frequency of 0.05 Hz (every 20 s) vs. a frequency of 0.075 Hz (13.3 s) in children taken as control sample [16].
To complement the FFT results, the spectral entropy for the entire data sample is calculated. This calculation involves a spectral matrix of dimension 166 × 190 (166 reaction times for each of the 190 participants), which is evaluated to determine if there is a similar distribution in the frequency spectrum of each participant (Equation (3)), what would imply a common reaction time against a common visual stimulus. To find out if there is a linear similarity relationship, the pairwise correlations across entire sample of students (190) are calculated. The correlation algorithm used was based on the Pearson correlation coefficient.
Figure 3 shows the results of the correlation matrix calculated from the spectral entropy values over all participants. The graph includes a first group of 11,026 correlation pair values greater than 0.9 (corresponding to a 61.41% of the total number of pairs). This group involves a set of 149 participants with a very similar pattern of frequency distribution. There is a second group of 6441 correlations values (35.87%) ranging between 0.5 and 0.9 and involving 114 participants presenting certain similar characteristics. Finally, a third group with 33 participants presented less distinctive similarities, with 528 correlations pairs values under 0.5 (2.94%).
It should be taken into account that the analysis based on entropy involves correlation pairs. Therefore, there are participants who appear in several associative groups since they can present linear relationships to a greater or lesser extent according to their correlation coefficient. In consequence, the sum of the values 149, 114 and 33, respectively, is greater than 190 participants.
As is well known, the entropy measures the degree of organization of a system. In accordance with this, there is an increase in the measured energy (power spectrum) that results from the interactions of the associations. The latter are represented in this case by a quantitative variable such as the correlation, and by a random or deterministic change in the system, represented in this case by the visual stimuli. Each associative state shown in Figure 3 is the result of each of these individual interactions for each participant, which is quantified by Pearson’s correlation coefficient.
For the analyzed case, this behavioral relationship measured through the entropy and show in Figure 3, provides an idea of the collective behavior in relation to independent characteristics of the group as it shows the intrinsic linear relationship between the response times of various individuals without sharing knowledge among them. This suggests some regularity and a certain common pattern for certain group characteristics in a population.
Figure 4 shows the mean spectral entropy as a function of time and over the sample of participants. This quantity says about the coherence of the individuals’ responses along the course of the experiments. In this respect, this quantity is proportional to the probability that participants make mistakes while responding to the consecutive visual stimuli. It can be seen in Figure 4 that the spectral entropy values start from a point of instability because the participants begin to adapt during the experimental process; then, it follows a stationary behavior given that the participants are adapted to the visual stimuli showing a stable response time; then, at the end, they begin to visualize transient values and peaks in the entropy values, which is due to the fact that the participants have been running the process for a certain time and a dependent variable such as “fatigue” can influence the results.
This result is in a good qualitative agreement with the failure modelling using Mean Time Between Failures (MTBF), widely used in industry for the predictive diagnosis of electrical machines and equipment. The mean time between failures is the arithmetic mean of the time between failures of a system. MTBF is typically part of a model that assumes that the failed system is repaired immediately as part of a renewal process [38].
Figure 5 illustrates a schematic representation of this model, where three stages are manifested. In the first stage, the machine is in the test period, when failures can occur randomly depending on the conditions and operating regimes. The second stage includes the stability period of the machine, when it has already passed the trial period and has adapted to the working conditions and regimes. Finally, the third stage refers to the period of overuse of the machine, time after the hours that the manufacturer guarantees for its proper functioning have passed, with which the failures can increase again.

5. Conclusions

Reaction times from visual stimuli experiments have been analyzed using a machinery failure approach and a spectral analysis. Results from the spectral analysis through the Fourier transform show that the participants have patterns in the responses along a series of visual stimuli, where the fundamental frequency for these experiments locates at 0.1 item−1, that is, every 10 items (every around 7.5 s). Similarly, the correlation analysis based on the spectral entropy showed that there are correlations among the reaction time series of the participants who carry out the experiments independently and without exchanging information. This result can be rationalized by considering that the participants form a system or a collective whose responses are not independent from one another. On the other hand, the analysis of the mistakes made by the participants while responding to the visual stimuli shows that they follow a behavior consistent with the MTBF model used in the industry for the predictive diagnosis of electrical machines and equipment.

Author Contributions

Conceptualization, M.E.I.-M., M.H.-G., J.C.C.-P., P.F.-d.-C., J.M.I. and E.N.-P.; data curation, M.E.I.-M., M.H.-G., J.C.C.-P., P.F.-d.-C., J.M.I. and E.N.-P.; formal analysis, M.E.I.-M., M.H.-G., J.C.C.-P., P.F.-d.-C., J.M.I.; investigation, M.E.I.-M., M.H.-G., J.C.C.-P., P.F.-d.-C., J.M.I.; methodology, M.E.I.-M., M.H.-G., J.C.C.-P., P.F.-d.-C., J.M.I. and E.N.-P. All authors have read and agreed to the published version of the manuscript.

Funding

This research was partially supported by grant no. RTI2018-102256-B-I00 (Spain).

Conflicts of Interest

The authors declare no conflict of interest.

References

  1. Thorpe, S.J.; Fize, D.; Marlot, C. Speed of processing in the human visual system. Nature 1996, 381, 520–522. [Google Scholar] [CrossRef] [PubMed]
  2. Krajbich, I.M.; Bartling, B.; Hare, T.A.; Fehr, E. Rethinking fast and slow based on a critique of reaction-time reverse inference. Nat. Commun. 2015, 6, 7455. [Google Scholar] [CrossRef] [PubMed] [Green Version]
  3. Barinaga, M. Neuroscience: Neurons Put the Uncertainty Into Reaction Times. Science 1996, 274, 344. [Google Scholar] [CrossRef] [PubMed]
  4. Tuch, D.S.; Salat, D.H.; Wisco, J.J.; Zaleta, A.K.; Hevelone, N.D.; Rosas, H.D. Choice reaction time performance correlates with diffusion anisotropy in white matter pathways supporting visuospatial attention. Proc. Natl. Acad. Sci. USA 2005, 102, 12212–12217. [Google Scholar] [CrossRef] [PubMed] [Green Version]
  5. Colonius, H.; Diederich, A. Measuring multisensory integration: From reaction times to spike counts. Sci. Rep. 2017, 7, 1–11. [Google Scholar] [CrossRef] [PubMed] [Green Version]
  6. Ritchie, J.B.; De Beeck, H.O. Using neural distance to predict reaction time for categorizing the animacy, shape, and abstract properties of objects. Sci. Rep. 2019, 9, 1–8. [Google Scholar] [CrossRef] [PubMed]
  7. Castro-Palacio, J.C.; Fernández de Córdoba, P.; Isidro, J.M.; Navarro-Pardo, E.; Selvas Aguilar, R. Percentile study of Chi distribution. Application to response time data. Mathematics 2020, 8, 514. [Google Scholar] [CrossRef] [Green Version]
  8. Hernaiz-Guijarro, M.; Castro-Palacio, J.C.; Pardo, E.N.; Isidro, J.M.; Castellá, P.F.D.C.; Guijarro, H.; Palacio, C.; Pardo, N.; Córdoba, F.-D. A Probabilistic Classification Procedure Based on Response Time Analysis Towards a Quick Pre-Diagnosis of Student’s Attention Deficit. Mathematics 2019, 7, 473. [Google Scholar] [CrossRef] [Green Version]
  9. Ruhai, G.; Weiwei, Z.; Zhong, W. Research on the Driver Reaction Time of Safety Distance Model on Highway Based on Fuzzy Mathematics. In Proceedings of the IEEE 2010 International Conference on Optoelectronics and Image Processing (ICOIP), Haikou, China, 11–12 November 2010; pp. 293–296. [Google Scholar]
  10. Yamagishi, T.; Matsumoto, Y.; Kiyonari, T.; Takagishi, H.; Li, Y.; Kanai, R.; Sakagami, M. Response time in economic games reflects different types of decision conflict for prosocial and proself individuals. Proc. Natl. Acad. Sci. USA 2017, 114, 6394–6399. [Google Scholar] [CrossRef] [Green Version]
  11. Badau, D.; Baydil, B.; Badau, A. Differences among Three Measures of Reaction Time Based on Hand Laterality in Individual Sports. Sports 2018, 6, 45. [Google Scholar] [CrossRef] [Green Version]
  12. Abbasi-Kesbi, R.; Memarzadeh-Tehran, H.; Deen, M.J. Technique to estimate human reaction time based on visual perception. Health Technol. Lett. 2017, 4, 73–77. [Google Scholar] [CrossRef]
  13. Gmehlin, D.; Fuermaier, A.B.M.; Walther, S.; Debelak, R.; Rentrop, M.; Westermann, C.; Sharma, A.; Tucha, L.; Koerts, J.; Tucha, O.; et al. Intraindividual Variability in Inhibitory Function in Adults with ADHD—An Ex-Gaussian Approach. PLoS ONE 2014, 9, e112298. [Google Scholar] [CrossRef]
  14. Adamo, N.; Hodsoll, J.; Asherson, P.; Buitelaar, J.K.; Kuntsi, J. Ex-Gaussian, Frequency and Reward Analyses Reveal Specificity of Reaction Time Fluctuations to ADHD and Not Autism Traits. J. Abnorm. Child Psychol. 2019, 47, 557–567. [Google Scholar] [CrossRef] [Green Version]
  15. Shahar, N.; Teodorescu, A.R.; Karmon-Presser, A.; Anholt, G.E.; Meiran, N. Memory for Action Rules and Reaction Time Variability in Attention-Deficit/Hyperactivity Disorder. Biol. Psychiatry Cogn. Neurosci. Neuroimaging 2016, 1, 132–140. [Google Scholar] [CrossRef] [PubMed]
  16. Castellanos, F.X.; Sonuga-Barke, E.J.; Scheres, A.; Di Martino, A.; Hyde, C.; Walters, J.R. Varieties of Attention-Deficit/Hyperactivity Disorder-Related Intra-Individual Variability. Biol. Psychiatry 2005, 57, 1416–1423. [Google Scholar] [CrossRef] [Green Version]
  17. Johnson, K.A.; Kelly, S.P.; Bellgrove, M.A.; Barry, E.; Cox, M.; Gill, M.; Robertson, I.H. Response variability in Attention Deficit Hyperactivity Disorder: Evidence for neuropsychological heterogeneity. Neuropsychologia 2007, 45, 630–638. [Google Scholar] [CrossRef]
  18. Di Martino, A.; Ghaffari, M.; Curchack, J.; Reiss, P.; Hyde, C.; Vannucci, M.; Petkova, E.; Klein, D.F.; Castellanos, F.X. Decomposing Intra-Subject Variability in Children with Attention-Deficit/Hyperactivity Disorder. Biol. Psychiatry 2008, 64, 607–614. [Google Scholar] [CrossRef] [Green Version]
  19. Vaurio, R.; Simmonds, D.J.; Mostofsky, S.H. Increased intra-individual reaction time variability in attention-deficit/hyperactivity disorder across response inhibition tasks with different cognitive demands. Neuropsychologia 2009, 47, 2389–2396. [Google Scholar] [CrossRef] [Green Version]
  20. Tarantino, V.; Cutini, S.; Mogentale, C.; Bisiacchi, P.S. Time-on-Task in Children with ADHD: An ex-Gaussian Analysis. J. Int. Neuropsychol. Soc. 2013, 19, 820–828. [Google Scholar] [CrossRef] [PubMed]
  21. Moret-Tatay, C.; Perea, M. Is the go/no-go lexical decision task preferable to the yes/no task with developing readers? J. Exp. Child Psychol. 2011, 110, 125–132. [Google Scholar] [CrossRef]
  22. World Medical Association. Declaration of Helsinki: Ethical Principles for Medical Research Involving Human Subjects. J. Am. Med. Assoc. 2013, 310, 2191–2194. [Google Scholar] [CrossRef] [Green Version]
  23. Rueda, M.; Fan, J.; McCandliss, B.D.; Halparin, J.D.; Gruber, D.B.; Lercari, L.P.; Posner, M.I. Development of attentional networks in childhood. Neuropsychologia 2004, 42, 1029–1040. [Google Scholar] [CrossRef] [PubMed]
  24. Forster, K.I.; Forster, J.C. DMDX: A Windows display program with millisecond accuracy. Behav. Res. Methods Instrum. Comput. 2003, 35, 116–124. [Google Scholar] [CrossRef] [PubMed] [Green Version]
  25. Moret-Tatay, C.; Leth-Steensen, C.; Irigaray, T.Q.; Argimon, I.I.L.; Gamermann, D.; Abad-Tortosa, D.; Oliveira, C.; Sáiz-Mauleón, B.; Vázquez-Martínez, A.; Navarro-Pardo, E.; et al. The Effect of Corrective Feedback on Performance in Basic Cognitive Tasks: An Analysis of RT Components. Psychologica Belgica 2016, 56, 370–381. [Google Scholar] [CrossRef]
  26. Moreno-Cid, A.; De Valencia, S.U.; Moret-Tatay, C.; Irigaray, T.Q.; Argimon, I.I.L.; Murphy, M.; Szczerbinski, M.; Martínez-Rubio, D.; Beneyto-Arrojo, M.J.; Navarro-Pardo, E.; et al. The role of age and emotional valence in word recognition: An ex-gaussian analysis. Stud. Psychol. 2015, 57, 83–94. [Google Scholar] [CrossRef]
  27. Moret-Tatay, C.; Moreno-Cid, A.; Argimon, I.I.L.; Irigaray, T.Q.; Szczerbinski, M.; Murphy, M.; Vázquez-Martínez, A.; Molina, J.V.; Sáiz-Mauleón, B.; Navarro-Pardo, E.; et al. The effects of age and emotional valence on recognition memory: An ex-Gaussian components analysis. Scand. J. Psychol. 2014, 55, 420–426. [Google Scholar] [CrossRef] [Green Version]
  28. Fan, J.; McCandliss, B.D.; Sommer, T.; Raz, A.; Posner, M.I. Testing the Efficiency and Independence of Attentional Networks. J. Cogn. Neurosci. 2002, 14, 340–347. [Google Scholar] [CrossRef]
  29. Posner, M.I.; Dehaene, S. Attentional networks. Trends Neurosci. 1994, 17, 75–79. [Google Scholar] [CrossRef]
  30. Posner, M.I.; Raichle, M.E. Images of Mind; Scientific American Library: New York, NY, USA, 1994. [Google Scholar]
  31. Martínez, M.E.I.; Garcia-Gomez, J.M.; Sáez, C.; Castellá, P.F.D.C.; Conejero, J.A. Feature Extraction and Similarity of Movement Detection during Sleep, Based on Higher Order Spectra and Entropy of the Actigraphy Signal: Results of the Hispanic Community Health Study/Study of Latinos. Sensors 2018, 18, 4310. [Google Scholar] [CrossRef] [Green Version]
  32. Ho, T.S.; Rabitz, H. A general method for constructing multidimensional molecular potential energy surfaces from ab initio calculations. J. Chem. Phys. 1996, 104, 2584–2597. [Google Scholar] [CrossRef]
  33. Castro-Palacio, J.C.; Nagy, T.; Meuwly, M. Computational study of the O(3P) + NO(2π) reaction at temperatures relevant to the Hypersonic Flight Regime. J. Chem. Phys. 2014, 141, 164319. [Google Scholar] [CrossRef] [Green Version]
  34. Unke, O.T.; Castro-Palacio, J.C.; Bemish, R.; Meuwly, M. Collision-induced rotational excitation in N+2 (2Σ+g, v = 0)–Ar: Comparison of computations and experiment. J. Chem. Phys. 2016, 144, 224307. [Google Scholar] [CrossRef] [PubMed] [Green Version]
  35. Denis-Alpizar, O.; Inostroza, N.; Castro Palacio, J.C. Rotational relaxation of CF^+ (X^1 Sigma) in collision with He (1^S). Mon. Not. R. Astron. Soc. 2018, 473, 1438–1443. [Google Scholar] [CrossRef]
  36. Castro-Palacio, J.C.; Bemish, R.J.; Meuwly, M. Communication: Equilibrium rate coefficients from atomistic simulations: The O(3P) + NO(2π) = O2(X3Σg) + N(4S) reaction at temperatures relevant to the hypersonic flight regime. J. Chem. Phys. 2015, 142, 091104. [Google Scholar] [CrossRef] [Green Version]
  37. Unke, O.T.; Meuwly, M. Toolkit for the Construction of Reproducing Kernel-Based Representations of Data: Application to Multidimensional Potential Energy Surfaces. J. Chem. Inf. Model. 2017, 57, 1923–1931. [Google Scholar] [CrossRef] [PubMed]
  38. Ferreira, F.J.T.E.; Baoming, G.; De Almeida, A.T. Reliability and Operation of High-Efficiency Induction Motors. In Proceedings of the IEEE Transactions on Industry Applications, Calgary, AB, Canada, 5–8 May 2015; Volume 52. [Google Scholar] [CrossRef]
  39. Tavner, P.; Ran, L.; Penman, J.; Sedding, H. Condition Monitoring of Rotating Electrical Machines; Bibliovault OAI Repository, University of Chicago Press: Chicago, IL, USA, 2008. [Google Scholar] [CrossRef]
Figure 1. Mean reaction time over the sample of 190 participants versus the item ordering number.
Mathematics 08 01979 g001
Figure 2. Mean fast Fourier transform (FFT) over a sample of 190 participants.
Mathematics 08 01979 g002
Figure 3. Spectral entropy correlation pairs grouped by intervals of association as a function of the pair index value within each group.
Mathematics 08 01979 g003
Figure 4. Mean spectral entropy as a function of time.
Mathematics 08 01979 g004
Figure 5. Schematic representation of the Mean Time Between Failures (MTBF) curve for machinery [39].
Mathematics 08 01979 g005
Publisher’s Note: MDPI stays neutral with regard to jurisdictional claims in published maps and institutional affiliations.

