1. Introduction
The evolution of supply chain management over the last three decades has shown a remarkable change in company purchasing departments towards the strategic role of their activities, such as the evaluation of providers and the decision-making in this area. As the literature provides thousands of research articles, there are many reviews focused on particular aspects and from different perspectives. In general, reviews of international journals classify research by decision-making problems, criteria, approaches and solving techniques, applications, journals, or methodological perspectives.
Reviews vary in studied period and perspective, but all together offer a general view of the evolution, state of the art and recommendations for future research. Some authors focused on Multiple Criteria Decision Making approaches and criteria to deal with supplier evaluation and selection. Data envelopment analysis (DEA) appeared as the method most applied to classify suppliers as efficient or inefficient, followed by goal and multiobjective programming, as well as linear and integer optimisation models. The analytic hierarchy process (AHP) has mainly been used to obtain the weights of criteria [
1]. Most recent reviews show less interest in DEA and increasing use of AHP, which has become the most applied multicriteria method, either alone or integrated with other techniques. Many fuzzy hybrid approaches were proposed during the first decade of this century based on uncertainty analysis, but their interest has declined in recent years in favour of risk analysis [
2,
3,
4,
5].
In addition to AHP, other discrete multicriteria methods applied to solve supplier evaluation problems are Analytic Network Process (ANP), ELimination Et Choice Translating Reality (ELECTRE), Preference Ranking Organisation Method for Enrichment Evaluation (PROMETHEE), Simple Multi-Attribute Rating Technique (SMART) and Technique for Order Performance by Similarity to Ideal Solution (TOPSIS). Manufacturing sectors, such as automotive, electrical and electronics, concentrate on applications [
1,
2,
3,
4,
5,
6,
7,
8,
9,
10,
11].
Latest reviews include green and sustainable perspectives in supplier evaluation. As future research, they highlight the strong potential for growth, the need to increase real-world modelling and validation [
2,
5,
7,
8,
9,
10,
11]. In particular, the most recent methodological analysis points out the great interest in contributing to establishing and maintaining the supplier base, adopting sorting techniques, and advancing the green and strategic evaluation, as well as in group and negotiation processes [
5].
When companies consider sustainability in their business process, supplier evaluation involves at least economic, environmental and social criteria [
2,
12,
13,
14]. Nevertheless, there are few research papers that include social criteria [
13,
15,
16]. Another literature limitation is that problems are focused on selecting suppliers to buy one product only, although in practice, companies keep a number of suppliers for the same product to avoid risks, while purchasing several products from each of them [
17,
18,
19,
20,
21,
22,
23,
24,
25]. This drawback has been overcome by first assessing products, followed by the supplier evaluation, which explicitly considers product scores [
15,
26].
Robust optimisation is another approach to generate robust portfolios of suppliers. Some authors have developed binary integer programming models to deal with both the selection of suppliers and development from a sustainable perspective [
27]. This technique requires assumptions about data difficult to measure in practice. It has been applied to solve small selection problems in manufacturing companies and tested by random generated instances. The use of illustrative examples with hypothetical data in manufacturing applications is also frequent in other methods of supplier evaluation [
11,
27,
28,
29]. Thus, some authors have pointed out the lack of multicriteria models to solve real-world problems and their validation with real data, as well as applications in the service sector [
3,
5,
15,
26,
27].
In sustainable supply chain management, evaluation is needed to qualify suppliers, as well as other problems, such as selection, ranking, classify and/or sorting suppliers. In the multicriteria approach, classification and sorting are two different problems. Classification methods assign alternatives into predefined groups in a nominal way, while the groups are ordered by sorting [
30].
The interest and relevance of these multicriteria problems depend on the sector, company, and nature of products or services that suppliers provide. The objectives of the decision makers and the data availability also determine the most suitable approaches and criteria to apply. For instance, these problems in industries of the electricity and electronic sectors are quite different to those from industries and food distribution [
2].
PROMETHEE is an outranking method, initially developed to rank projects [
31], which has been applied to solve other types of complex multicriteria problems, such as supplier segmentation [
15,
26]. The noncompensatory nature of this method makes it appropriate to evaluate sustainability for which compensatory multicriteria approaches are not suitable, as economic criteria cannot always compensate those environmental and social factors [
8]. The PROMETHEE method has also been extended to sorting alternatives to be classified into ordered predefined categories [
32]. To the best of our knowledge, two articles have proposed multicriteria sorting methods to solve the supplier evaluation problem, both tested with illustrative examples, without real-world data [
11,
28].
The aim of this research is twofold. First, it is to propose a hybrid methodology for developing portfolios of providers that help to improve sustainable food supply chains, based on multicriteria models used to qualify, evaluate and monitor fresh foods and their suppliers. Secondly, it is to validate the models proposed with real data on organic fruits through a case study from a supermarket chain.
One contribution of this article is a complete model for qualifying and evaluating fresh products in food distribution companies, which captures real supply chain problems and data to evaluate their performance through quality criteria and strategic criteria. Other important contributions are outranking models based on the PROMETHEE method to evaluate, rank and segment suppliers in order to classify and sort them. Both segmentation approaches, validated with real data, contribute significantly to improving supply chain management at an operational, tactical and strategic level.
The remainder of the paper is organised as follows: Materials and methods are presented in the second section. First, the main results from a survey with managers are presented to elicit the criteria of products and supplier evaluation. Secondly, a brief explanation is given of the multicriteria methods used, multi-attribute utility theory (MAUT), PROMETHEE and FlowSort. The multicriteria system developed and validated is presented in the third section. The fourth section focuses on the product evaluation model, which integrates MAUT and PROMETHEE, whose results are incorporated in the supplier evaluation presented in the fifth section. Based on this analysis, the suppliers are ranked, classified and sorted with PROMETHEE and FlowSort. Finally, the last two sections are dedicated to the discussion of results and conclusions, respectively.
2. Materials and Methods
2.1. Decision Makers and Criteria from a Survey to Food Distribution Companies
The first step to develop decision-making models consists of identifying the decision makers and their objectives. Nowadays, supplier evaluation in companies is a complex task, which involves several departments, such as purchasing, logistics and quality. Each department and manager will have their main priorities about the objectives to optimise, which make it difficult to establish a consensus in companies.
A literature review does not provide enough information of real criteria to evaluate suppliers of fresh food [
14,
33]. Therefore, a survey to obtain these relevant data was carried out in 2019 (
Appendix A). Personnel from a main supermarket chain with 775 stores in Spain answered this survey. In particular, 14 people from the three departments involved in supplier evaluation (seven from meat and/or fruit purchasing departments, four from quality and three from logistics).
The majority of the staff (85%) stated that the current evaluation system is based on real data, as well as on the opinion of the company’s managers and experts. On the one hand, one third of the staff interviewed considered that the current fresh food supply system is satisfactory and sufficient, 4 from the meat purchasing area and 1 from logistics. On the other hand, some people highlighted the need to improve the system, for example, to achieve certifications and consider the business practice explicitly.
The survey distinguishes between criteria used to evaluate products and suppliers, as the relationship between product and supplier is not biunivocal. In practice, the same fresh food is provided by several suppliers and providers usually offer various products. In addition, supermarket chains are interested in identifying the best suppliers for each food.
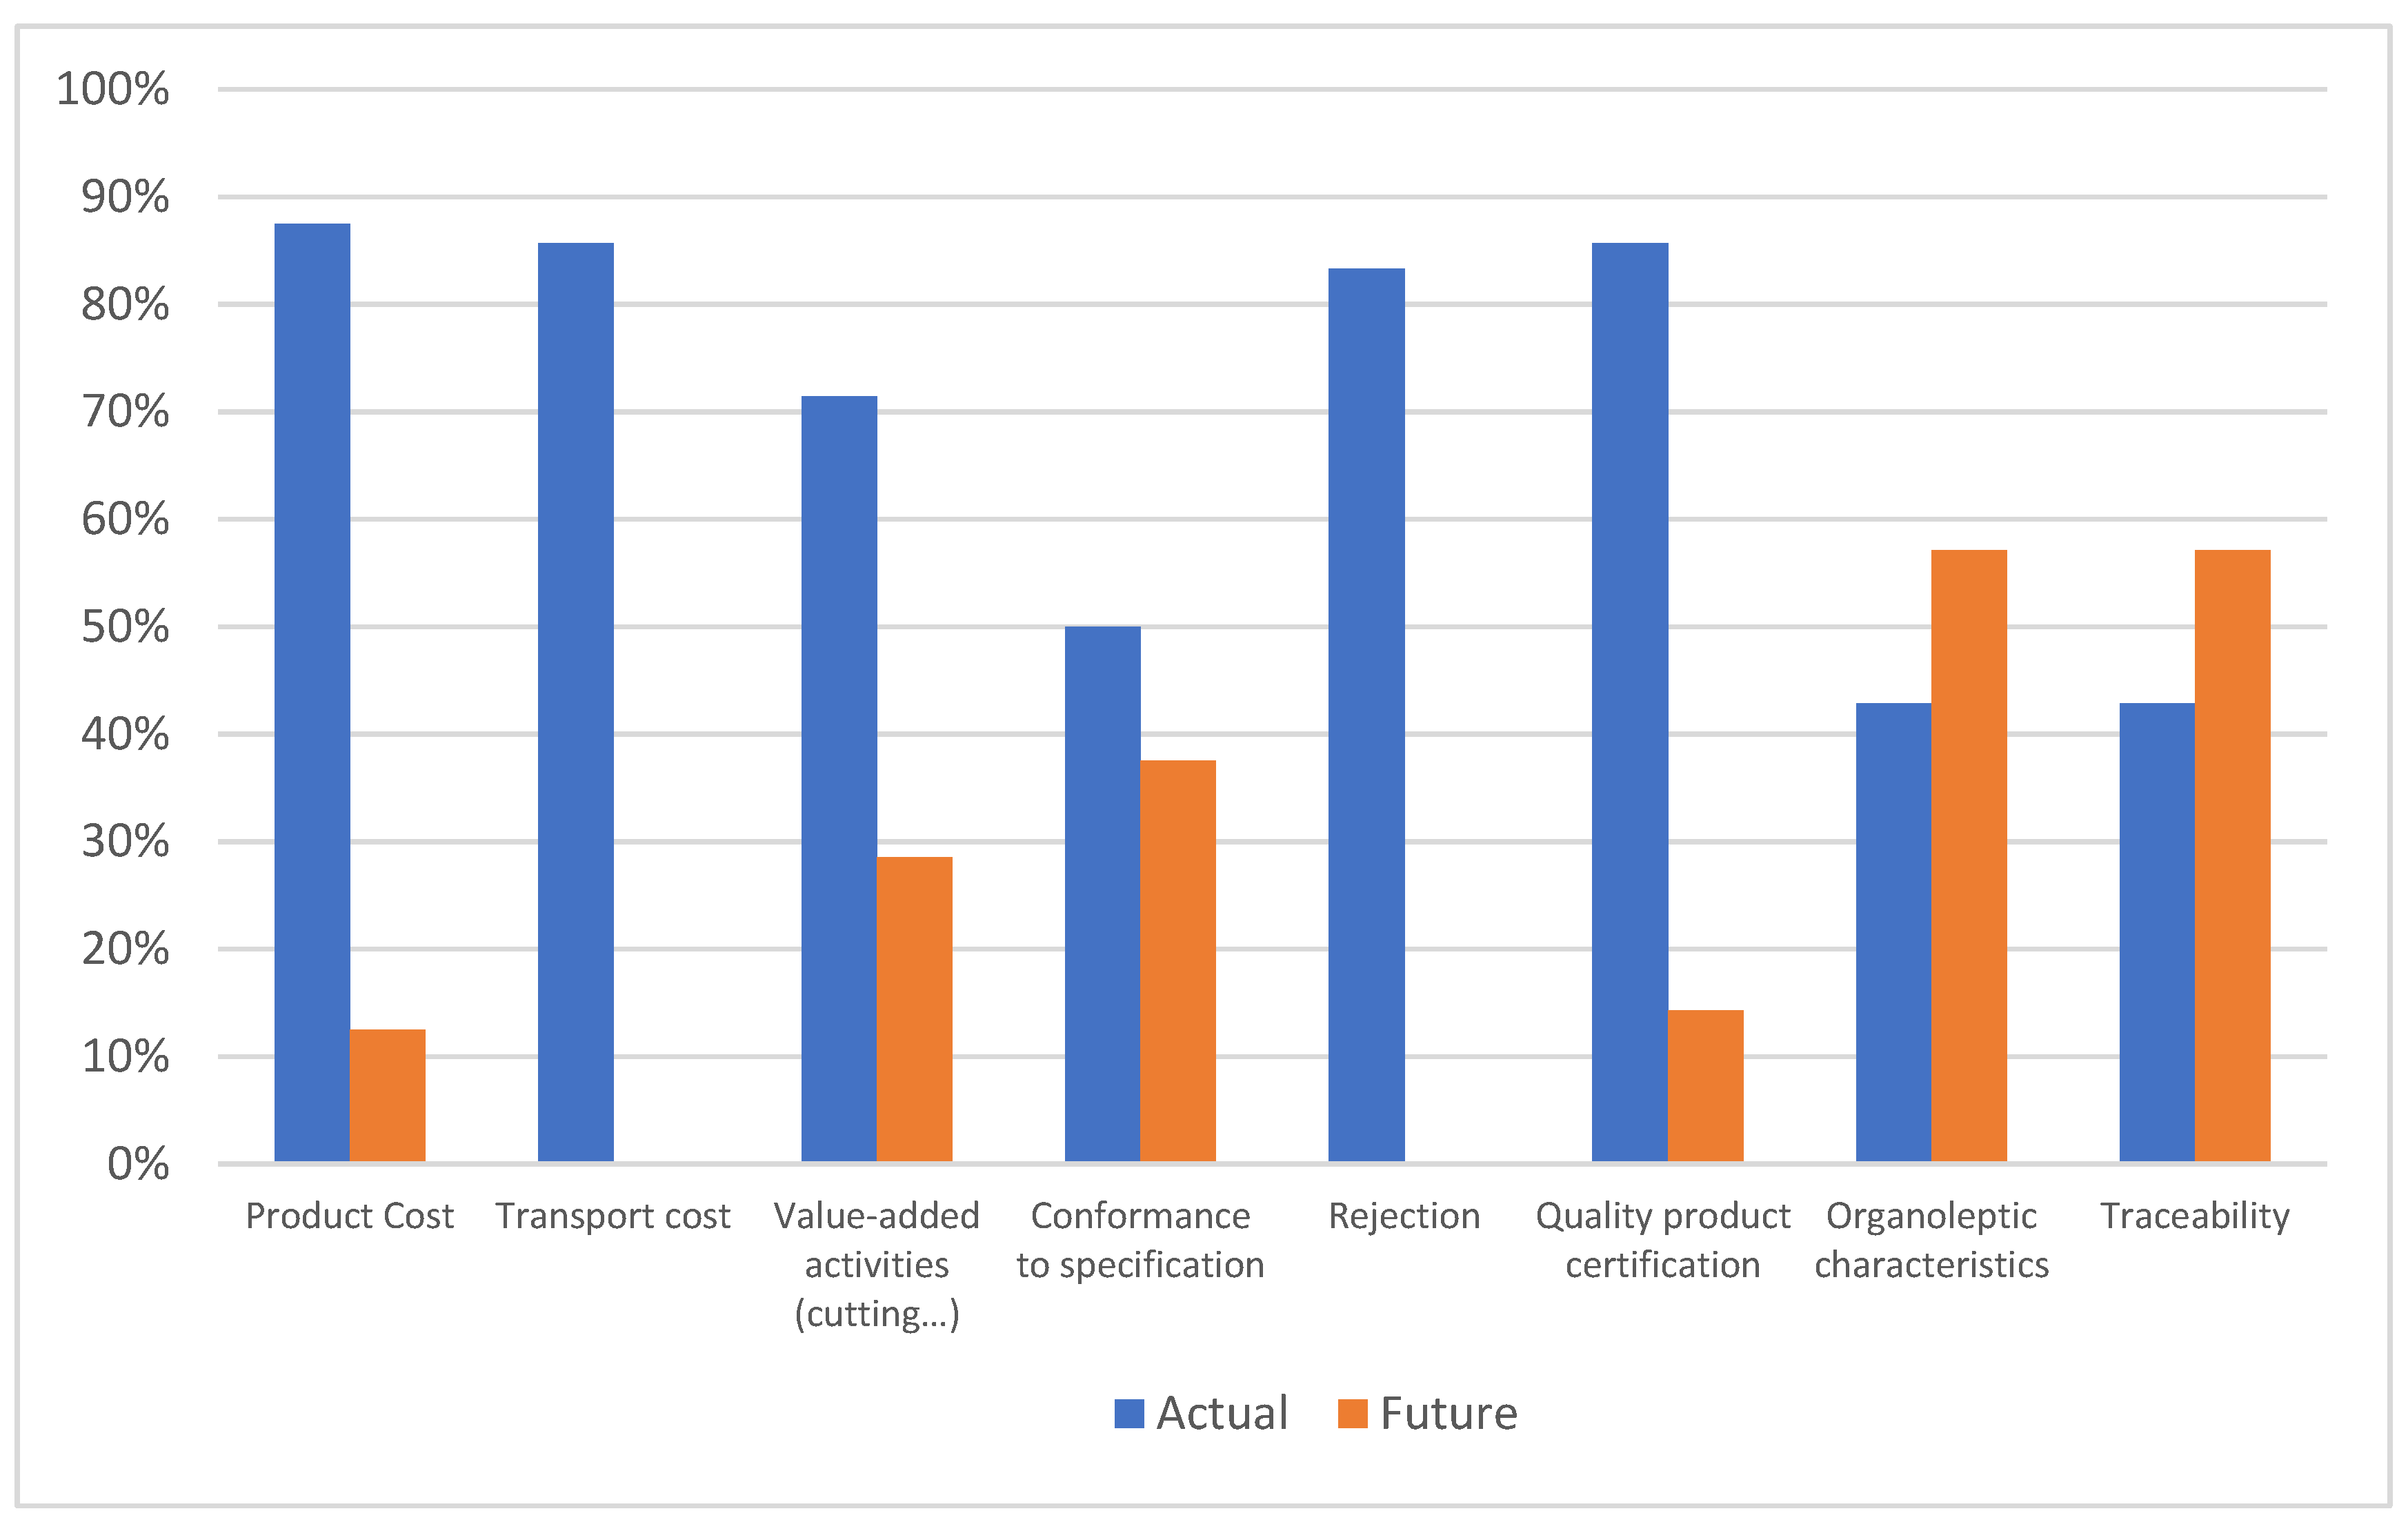
Figure 1 shows the results for criteria used to evaluate fresh fruits and vegetables. Organoleptic characteristics and traceability are the more interesting criteria to be implemented in the future. The current evaluation system in the company considers other criteria (cost, value-added activities, conformance to specifications and rejection), but only at the supplier level. The rejection criterion is quantified explicitly, while others are not and are considered through subjective evaluations from managers.
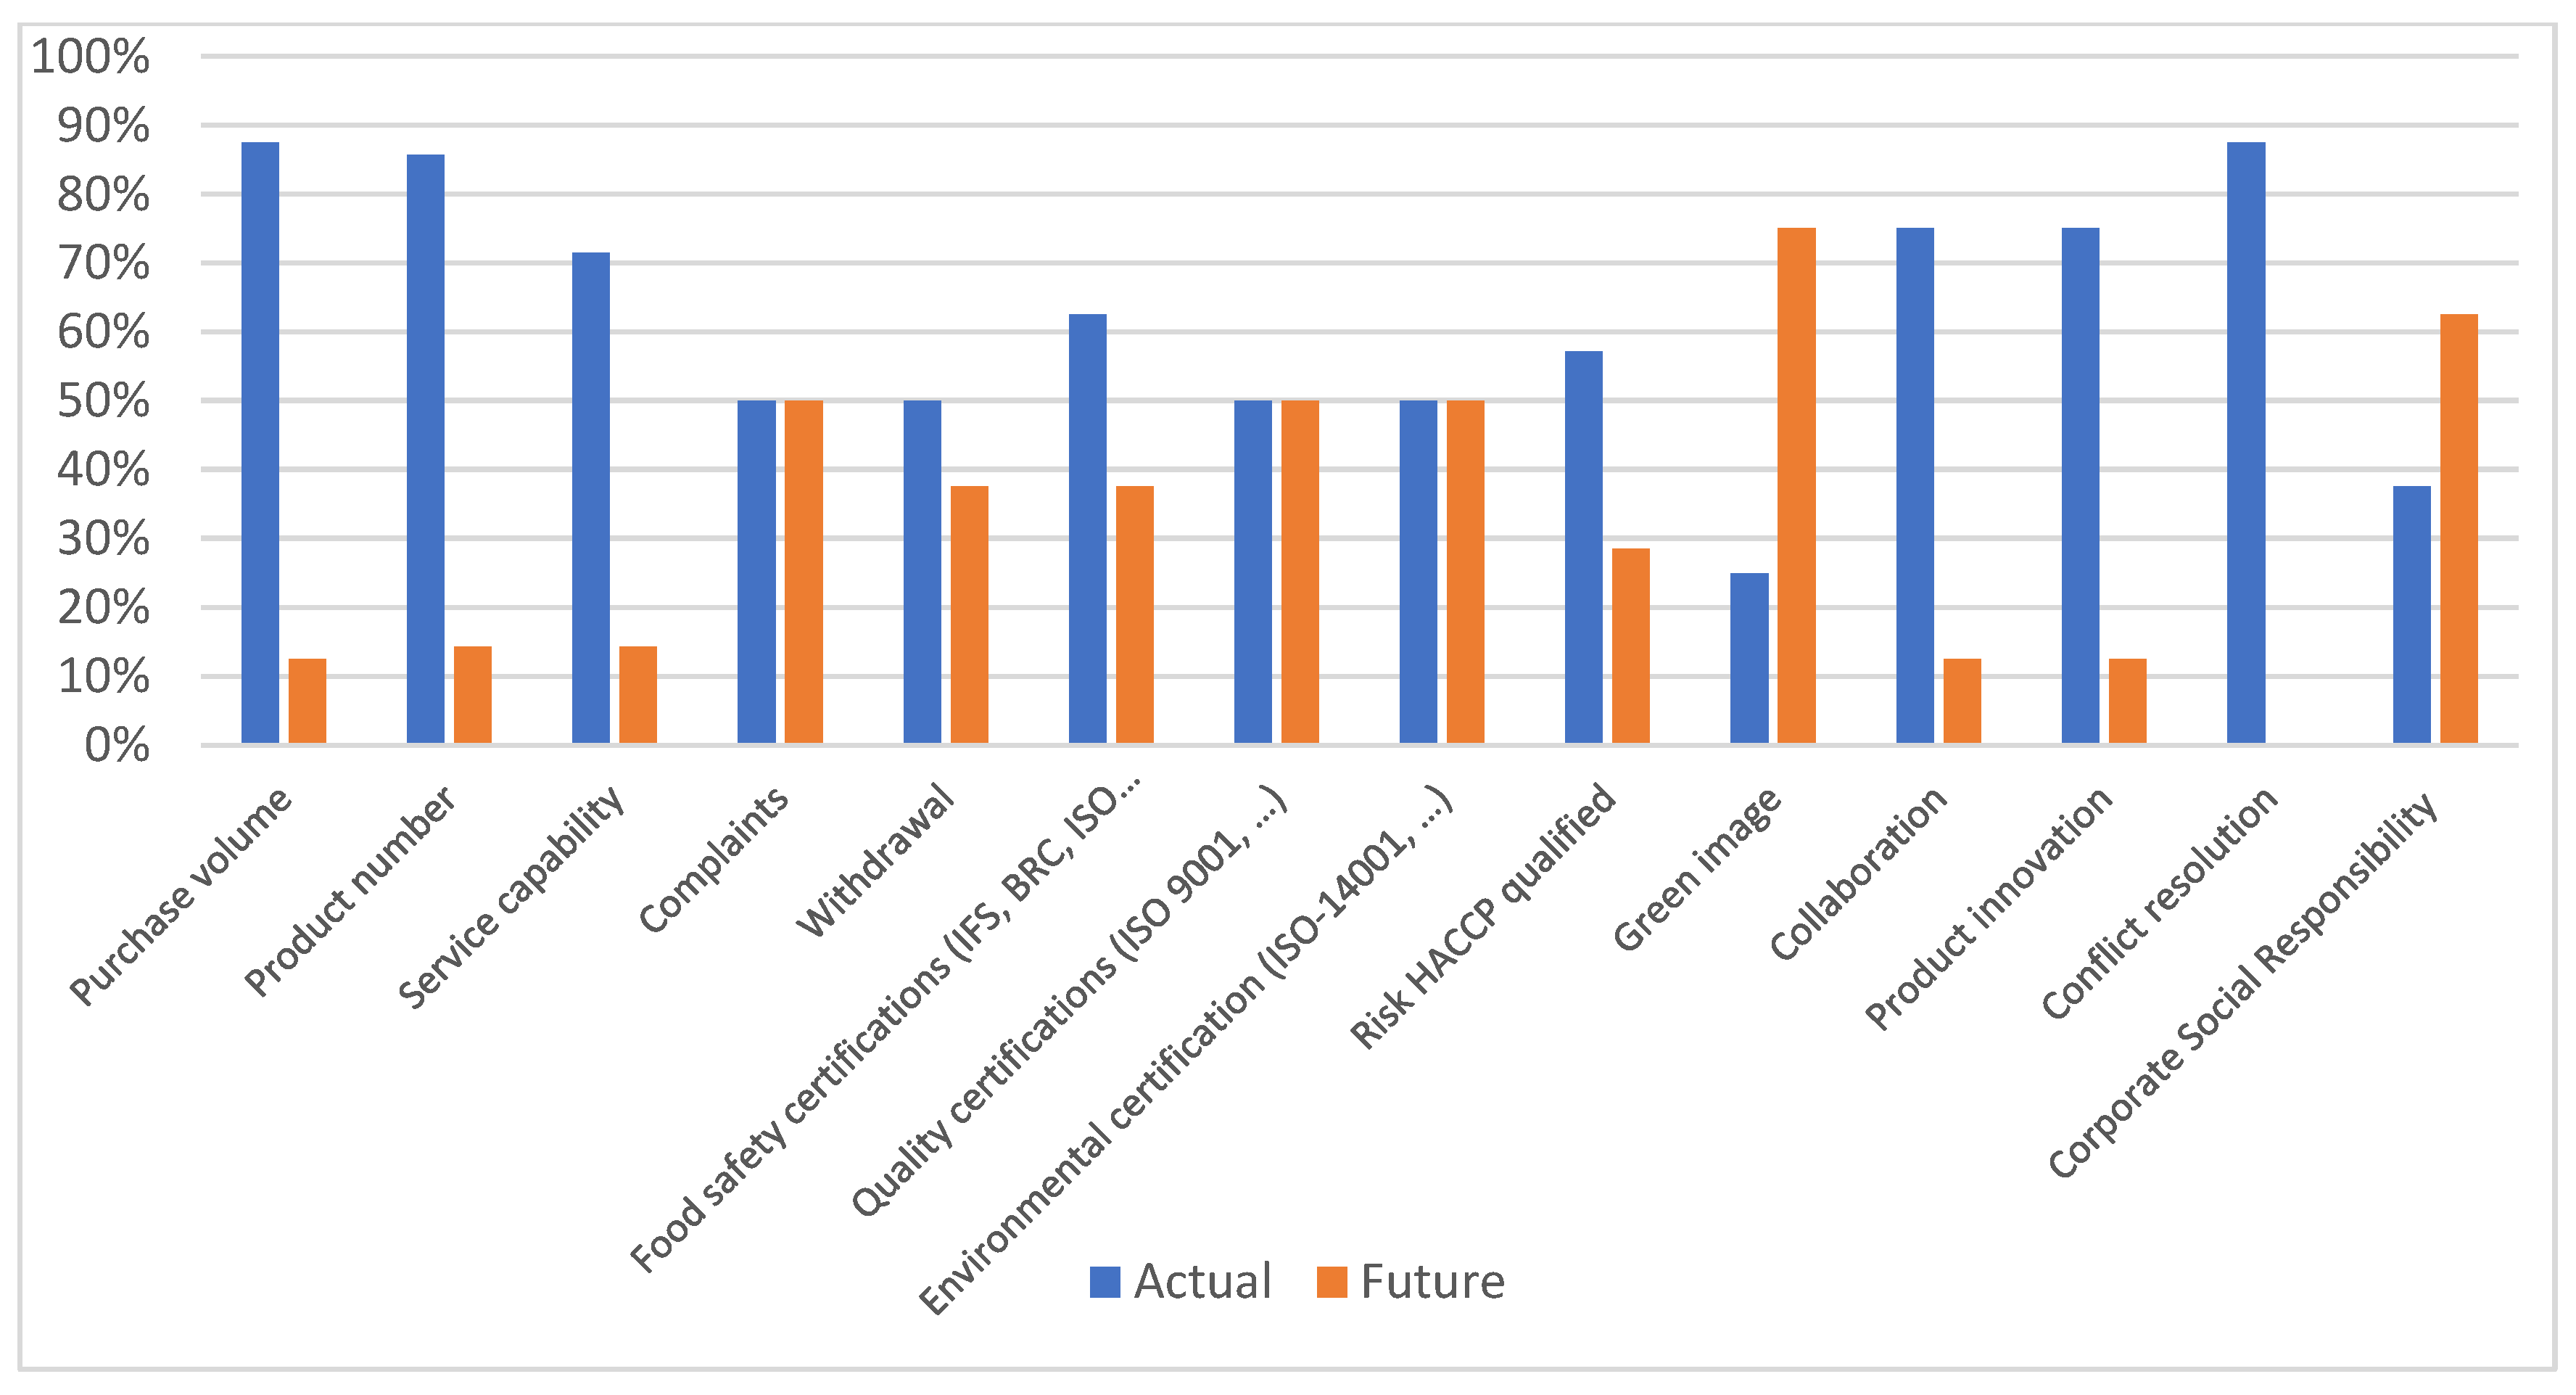
Figure 2 shows the answers about criteria used to evaluate suppliers in the company’s current system and to be applied in the future, where the ordinate expresses the percentage of people that indicate the criterion. Some criteria are measured quantitatively, such as service capability, which is calculated by the average of the degree of compliance with delivery day and time by suppliers in the company’s logistic platform. While service capability is included in the company evaluation system explicitly, purchase volume is not, although it is easy to obtain from the company databases. The same situation occurs with complaints, withdrawal and products number. On the contrary, other criteria currently applied to assess suppliers are qualitative, such as collaboration, product innovation and conflict resolution. In this case, managers assign a value on a scale from 0 to 10 to supplier performance in the annual assessment needed for ISO certification. Finally, green image and corporate social responsibility stand out as the main criteria to include in future evaluation systems.
2.2. Multicriteria Decision Making
In general, discrete multicriteria methods need an evaluation table with the alternatives, products or suppliers in this case, and the indicators
gj to measure the performance of the alternatives in each criterion, as shown in
Table 1. Moreover, it is necessary to know the relative importance of criteria, which are measured by weights
wj. The sum of all is the unit (1).
2.2.1. Multi-Attribute Utility Theory
In this study, MAUT is used to assess the conformance to specifications of fresh food and score its quality at the same time. In particular, the additive model of the value function is represented in (2).
V(s) represents the utility or overall value of a product and
vj (
s) is the utility score of the performance of the product
s in criterion
j, while the importance of criterion
j is expressed by weight
wj. MAUT is a multicriteria compensatory method, which provides scores based only on the own performance of alternatives with no rank reversal problem. A complete description of this method can be found in [
34,
35,
36]. Previous works have shown the suitability of MAUT for this purpose [
15,
26].
2.2.2. Preference Ranking Organisation Method for Enrichment Evaluation and FlowSort
PROMETHEE is an outranking multicriteria method that requires information from the evaluation table and weights of criteria for the problem. The preference structure in this method is based on pairwise comparisons between alternatives (products/suppliers), as shown in Equations (3) to (5). The preference of an alternative
S1 compared to another
S2 is a function of the difference between the evaluations of both, and it is a real number between 0 and 1. The decision maker establishes a preference function for each criterion that can be maximised or minimised.
The degree to which an alternative
Si is preferred over
Sh is calculated by the aggregated preference indices, as follows:
To rank alternatives, this method applies the positive and negative outranking flows, and the difference of both concepts, that is the net flow, is represented in (8)–(10). A complete explanation of PROMETHEE is available in [
37].
For sorting suppliers, this study uses FlowSort. The main idea is to apply PROMETHEE concepts and rules comparing each alternative to those used to establish the reference profiles that define the ordered groups. A modified version of this method is also tested, by comparing all the alternatives and profiles in one step [
32].
3. Multicriteria Methodology for Ranking, Classifying and Sorting Suppliers in Food Distribution
Food distribution supply chain management involves many decisions, which entail a high degree of complexity in the case of fresh food due to the change in quality over time and conflicting criteria, such as food safety, cost and consumer preferences. In this context, a decision support system based on multicriteria models is necessary to carry out a transparent evaluation, which balances the objectives of the company using real data and improves coordination among stakeholders and departments.
Figure 3 shows a flowchart with the steps to follow in order to produce information useful to develop and maintain a portfolio of providers, which allows the ranking of suppliers by product, classifying them into relevant categories, as well as sorting suppliers into ordered groups. The first step is to identify the groups of products to be evaluated and the departments involved. The origin of the multicriteria nature in supplier evaluation is due to the objectives of each department. For instance, the logistics department is focused on service capability, while the purchasing department is more interested in costs and the quality department in food safety and product quality.
The second step is related to splitting the criteria applied to evaluate products, as well as the weights of each criteria. Some commodities need to be qualified through special certification previously, such as organic food or the products with designation of origin. In this point, it is necessary to highlight that there are certifications for products and certifications at the supplier level.
In addition, a complete supplier assessment should include the evaluation of products provided, as shown in the third step of the flowchart in
Figure 3. In food evaluation, there are two groups of important criteria: Those related to food quality and others, which denominate strategic criteria. The former depends on the specific food item, and MAUT is the appropriate model to obtain the score for product quality by defining the utility functions based on expert knowledge.
The complete product evaluation is obtained by applying PROMETHEE with the quality indicator and the strategic criteria. On the one hand, these results allow the suppliers for each product to be ranked, identifying the best ones. On the other hand, they are basic information for the evaluation table with all criteria to be considered in supplier evaluation, that is, the performance of suppliers related to the products they provide and other criteria such as those from trading, environmental and social aspects.
When the evaluation table for suppliers is complete with their performance for all relevant criteria, measured mainly by real and objective data, the methodology proposes to apply PROMETHEE and FlowSort. Both methods require the definition of the preference functions for each criterion, and this calls for the participation of all departments involved. Results from PROMETHEE contribute the general ranking of supplier and categories of suppliers according to their performance in groups of criteria, such as food safety versus trading or trading versus environmental performances. In addition, to apply FlowSort, the company needs to define the reference profiles that characterise suppliers, such as excellent, good, acceptable or bad.
Both approaches allow analysis of the performance of suppliers from different perspectives, giving new insight and also providing visualisation tools to improve supply chain management, for example, through a quick response, solving problems and negotiation with suppliers, improving coordination and achieving a consensus among departments. Therefore, the insights obtained from the results of PROMETHEE and FlowSort inform and facilitate the operational, tactical and strategic decisions in fresh food distribution.
4. Results of Multicriteria Evaluation of Fresh Fruits
To minimise risks, a complete evaluation of suppliers must include a transparent assessment of the commodities provided, their nature and the objectives of the company, which in the case of food distribution, are related to consumer preferences.
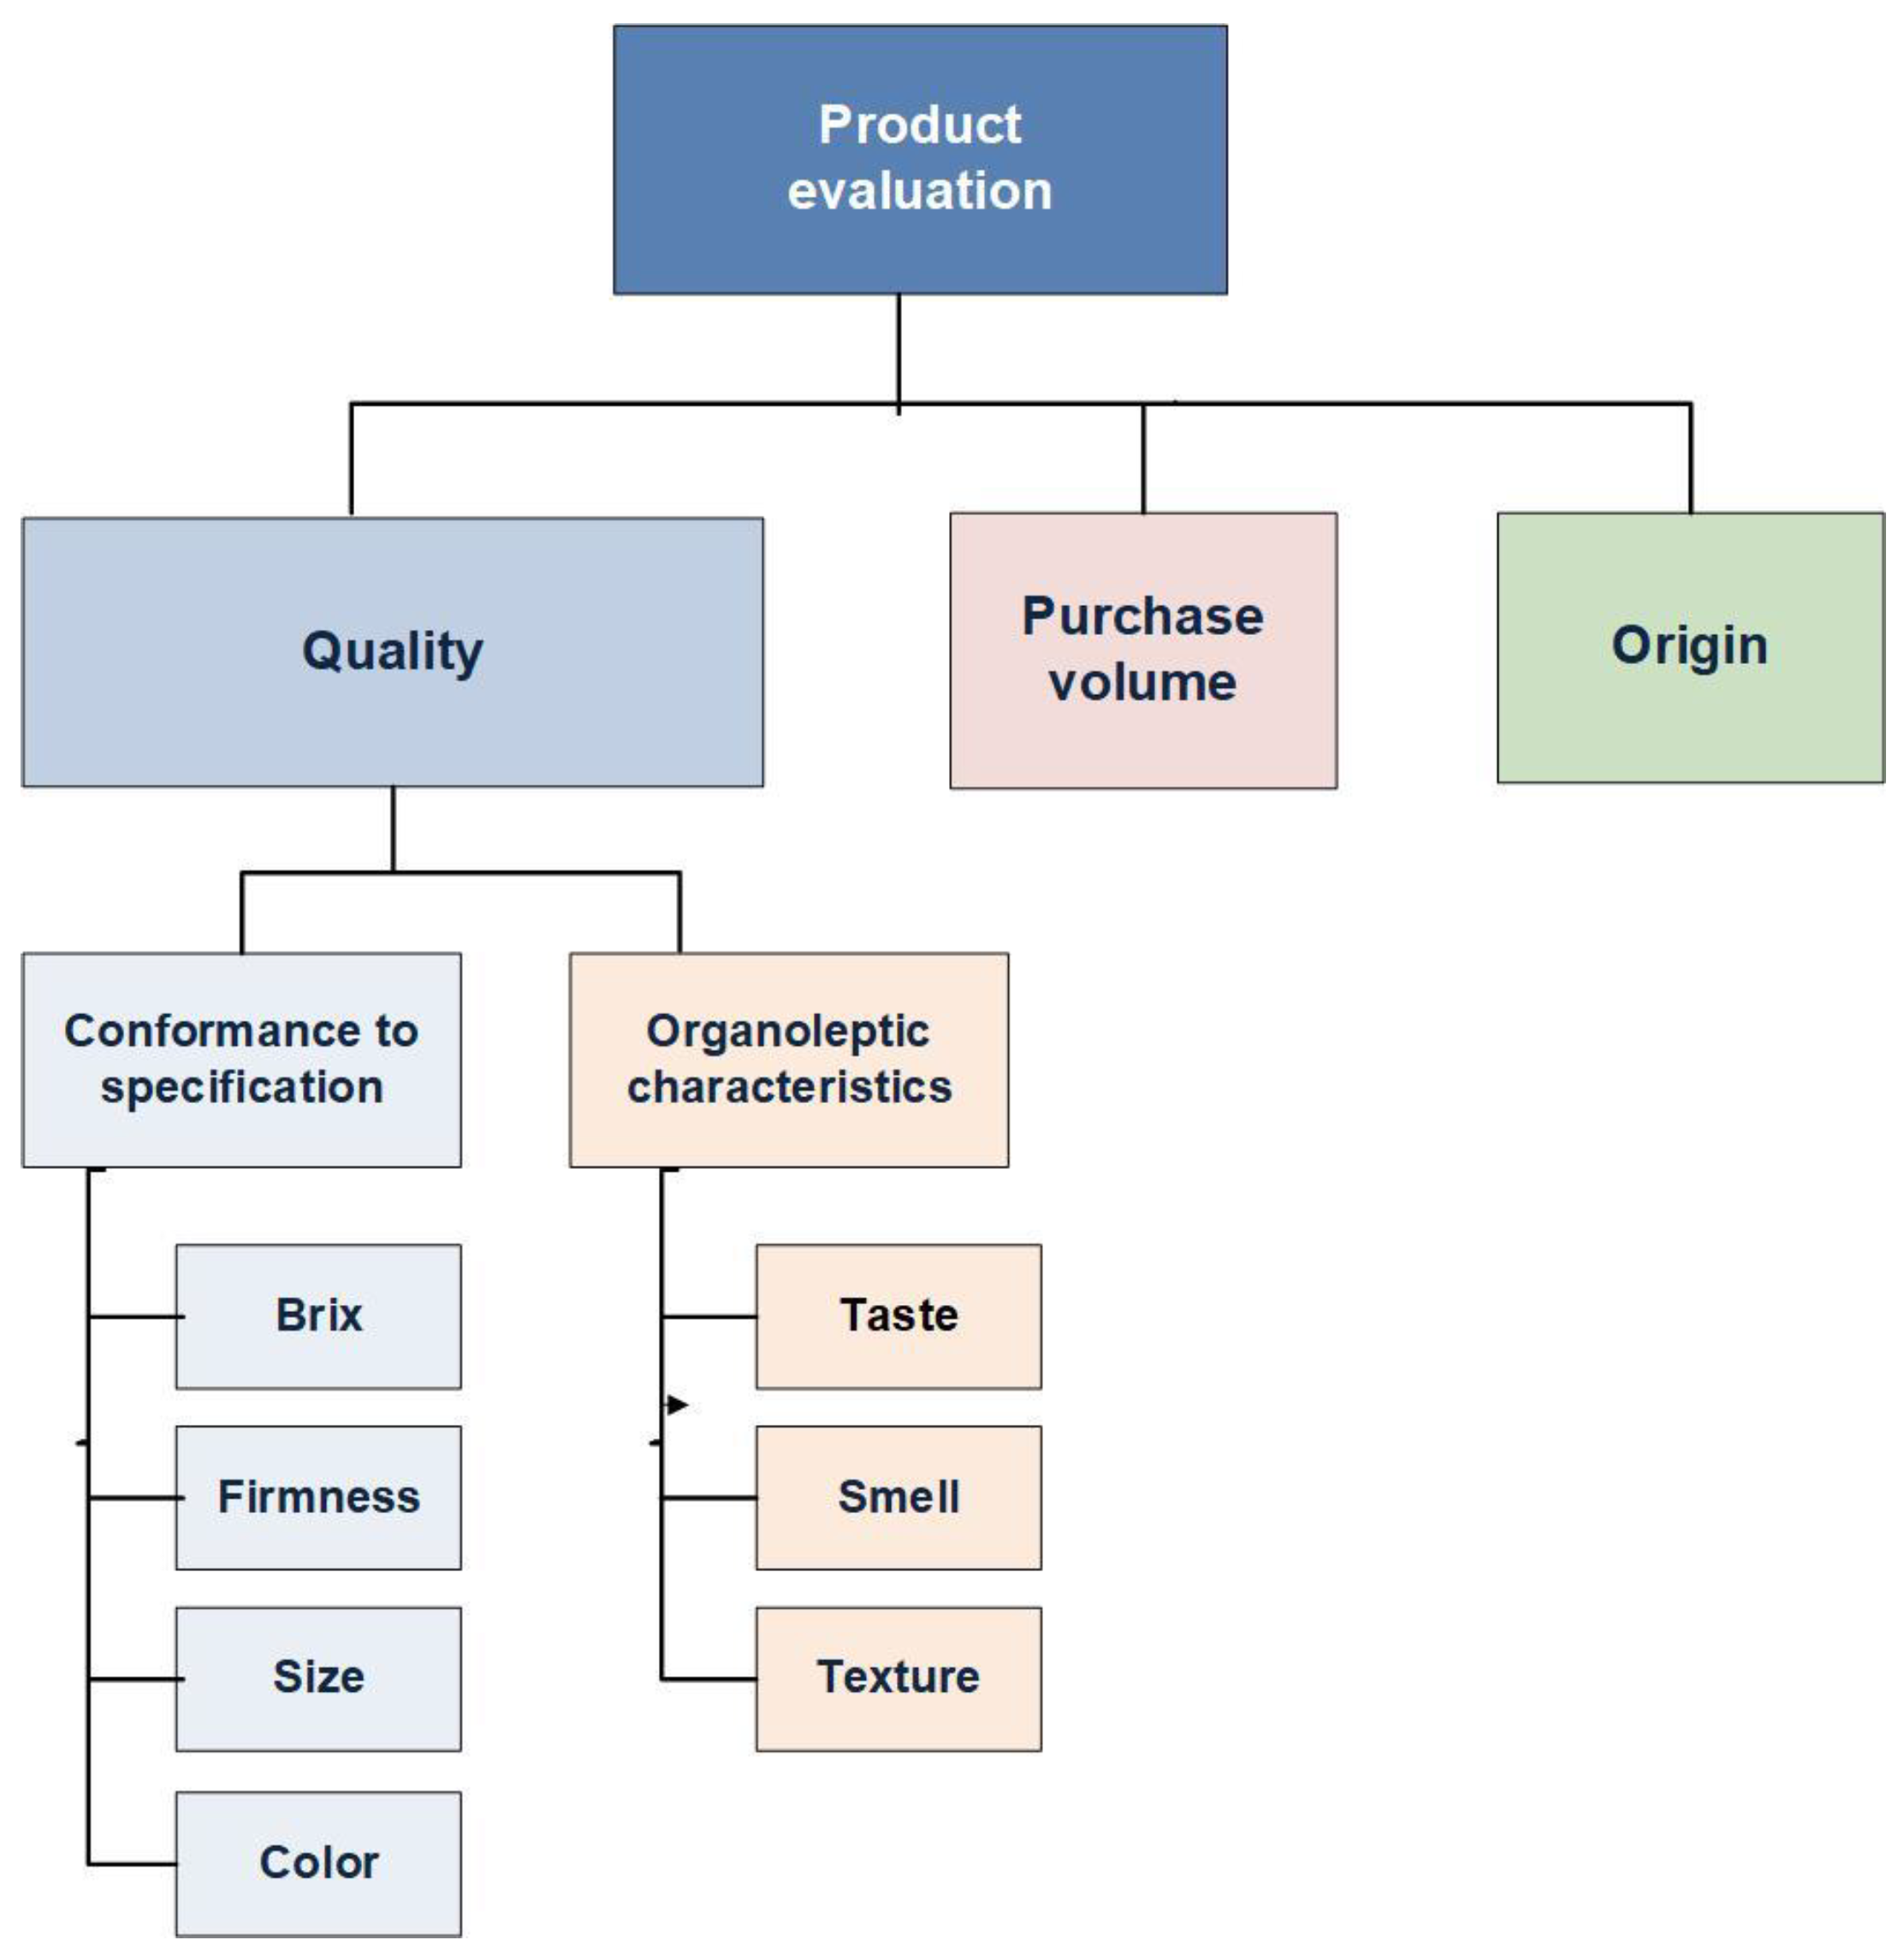
Figure 4 shows the hierarchy of criteria for product evaluation in the case of fresh fruit. Supermarket chains measure the quality of fruits in the logistic platforms by using an inspection system to test if batches conform to specifications. In general, the conformance to specification is checked through the values of brix degrees, firmness, size and/or colour of fruit, depending on the product. The product is accepted when these values are between the minimum and maximum established. Moreover, consumer evaluations are sometimes carried out in the supermarket stores, which provide information about taste, smell and/or texture of fruit, as well as consumer preferences.
Data collected about criteria used to measure the conformance to specification and organoleptic characteristics allow us to obtain an indicator of fruit quality by MAUT, which is easy to include in a system to support operational decisions. In addition, to complete the evaluation, the model proposed considers several strategic criteria for supply chain management, such as the purchase volume and origin of the product. Consumer preferences for local or national products are becoming increasingly important in the food market.
4.1. Obtaining a Quality Indicator by the Multi-Attribute Utility Theory Method
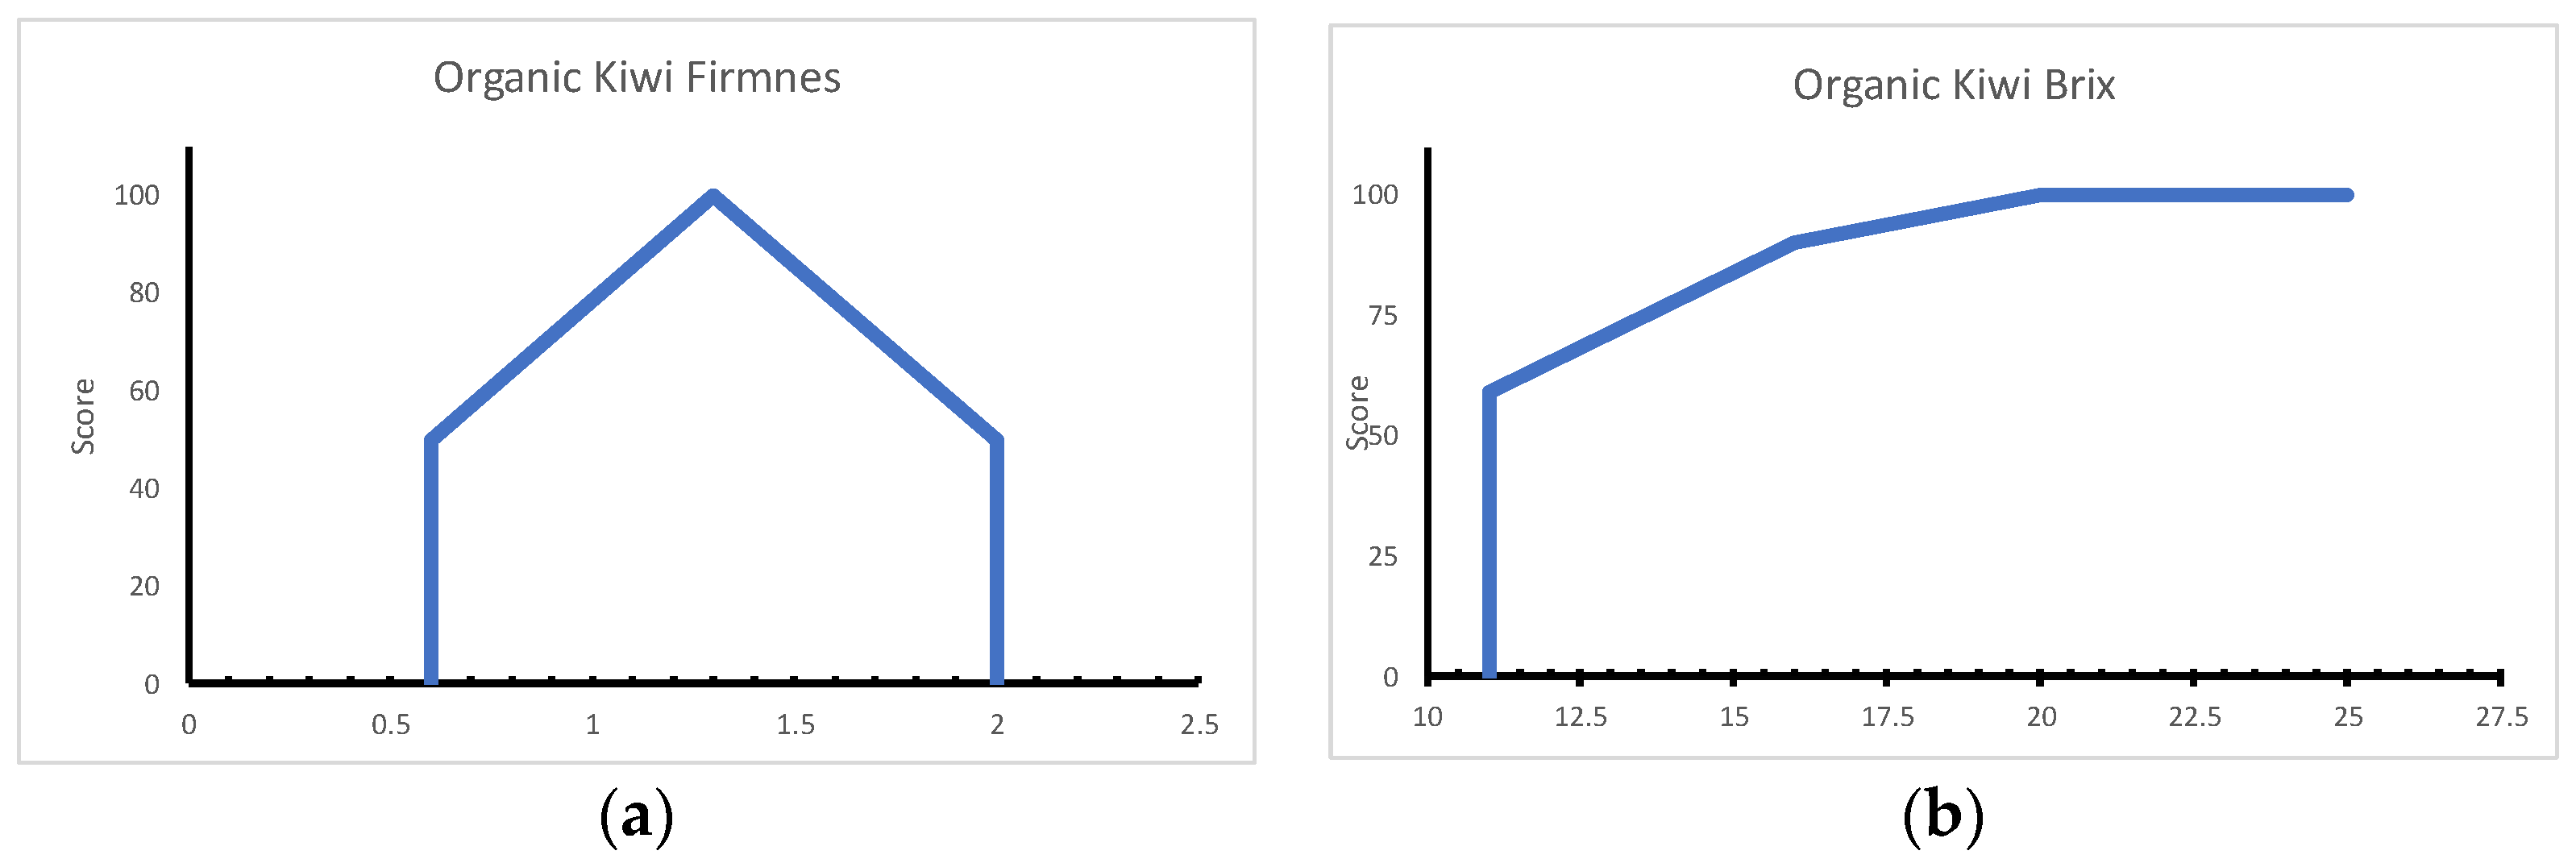
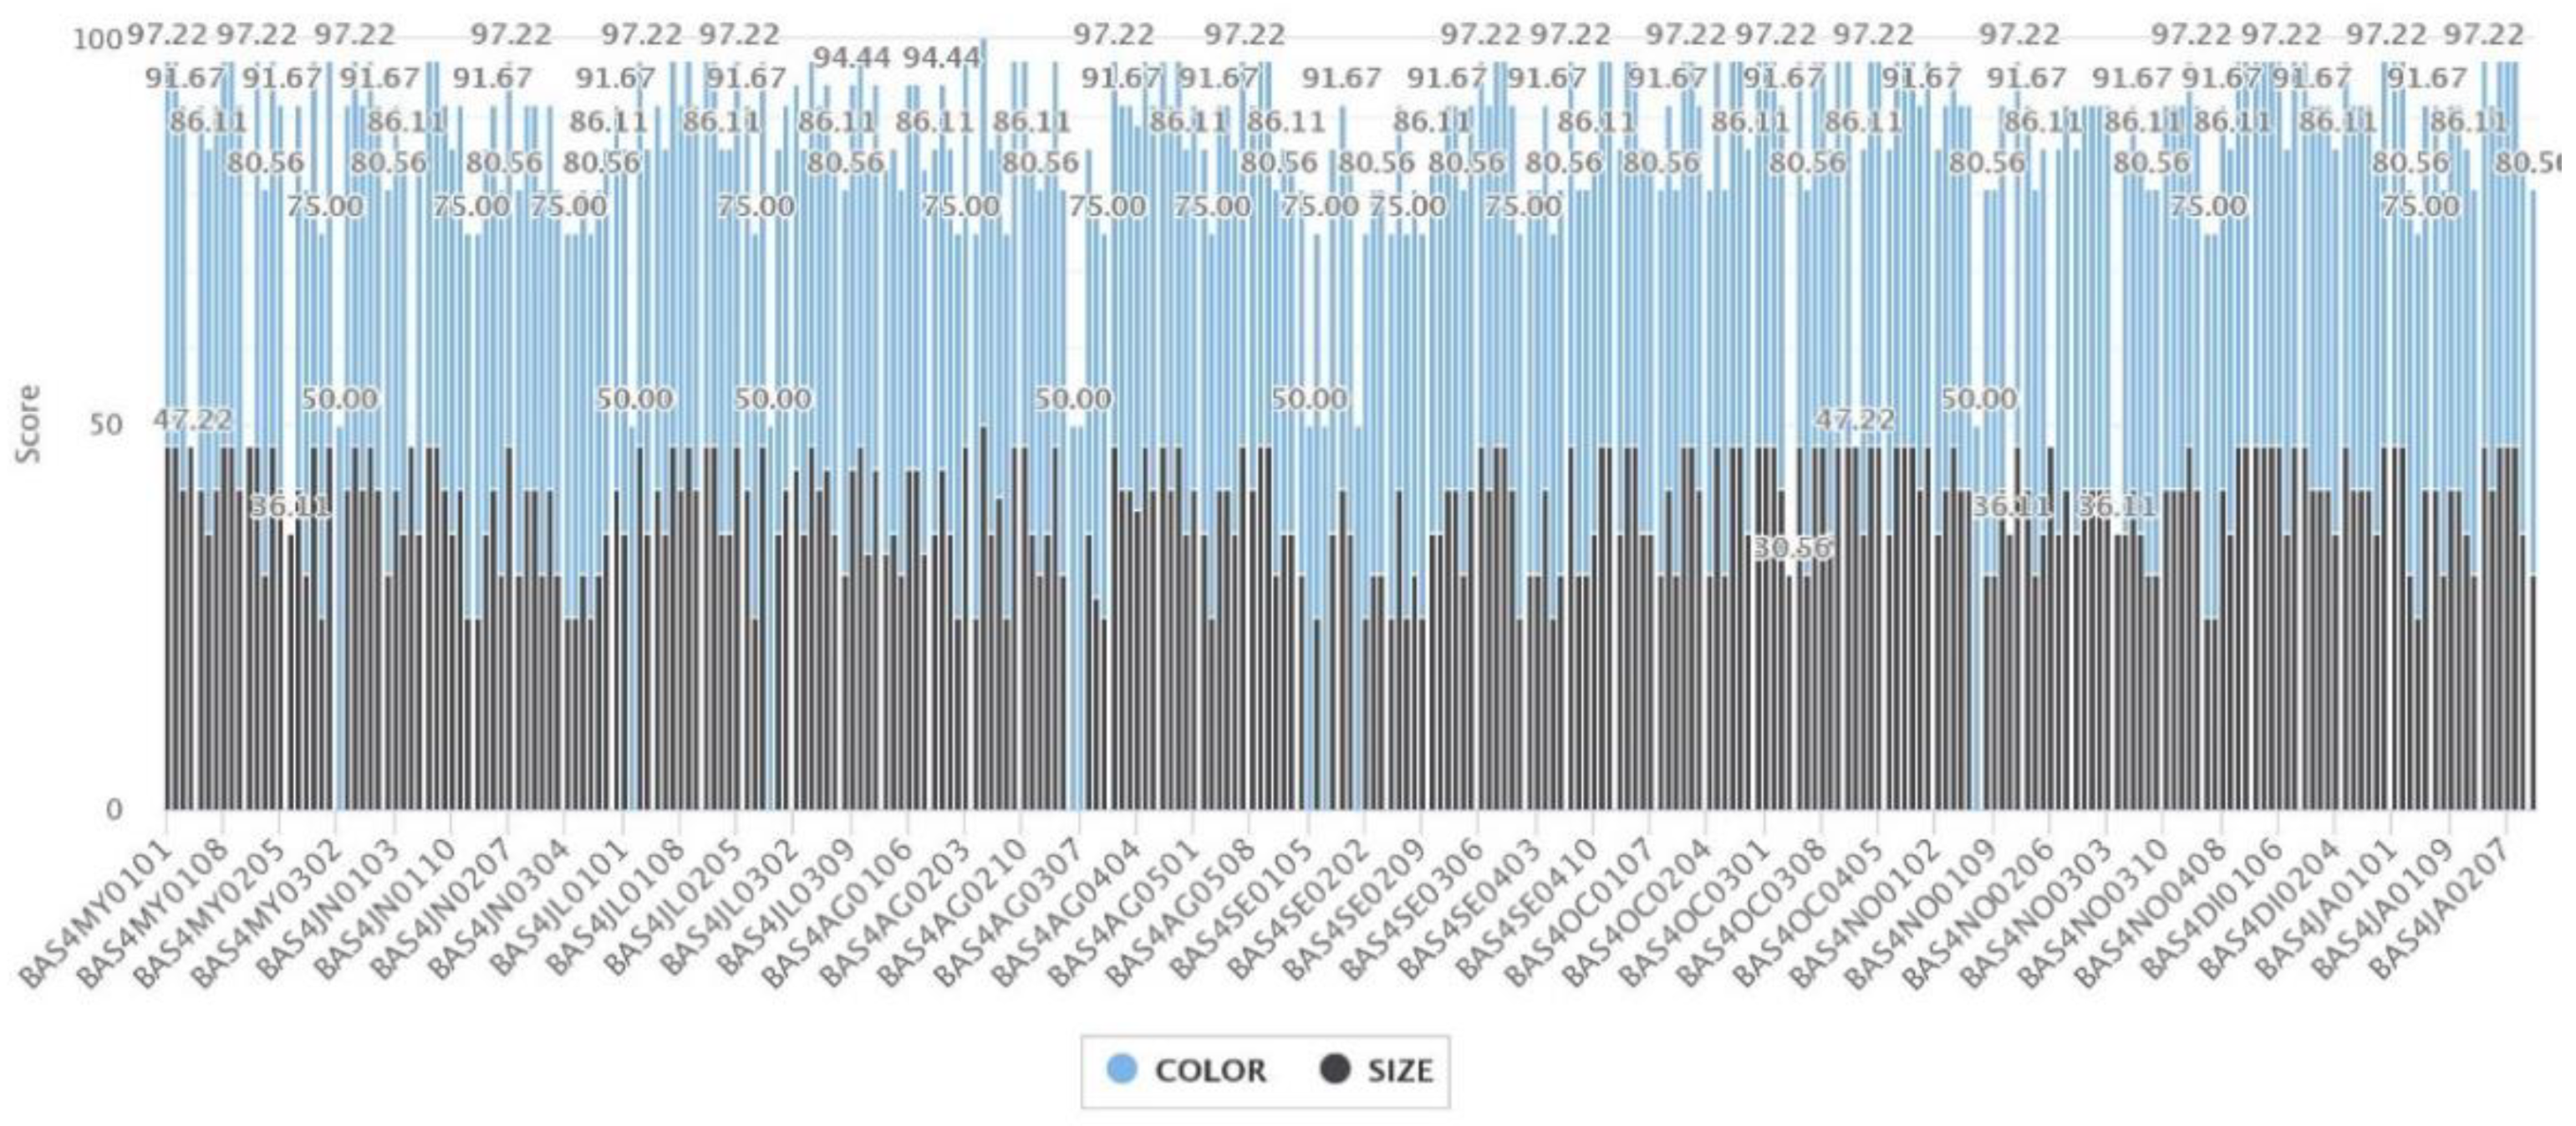
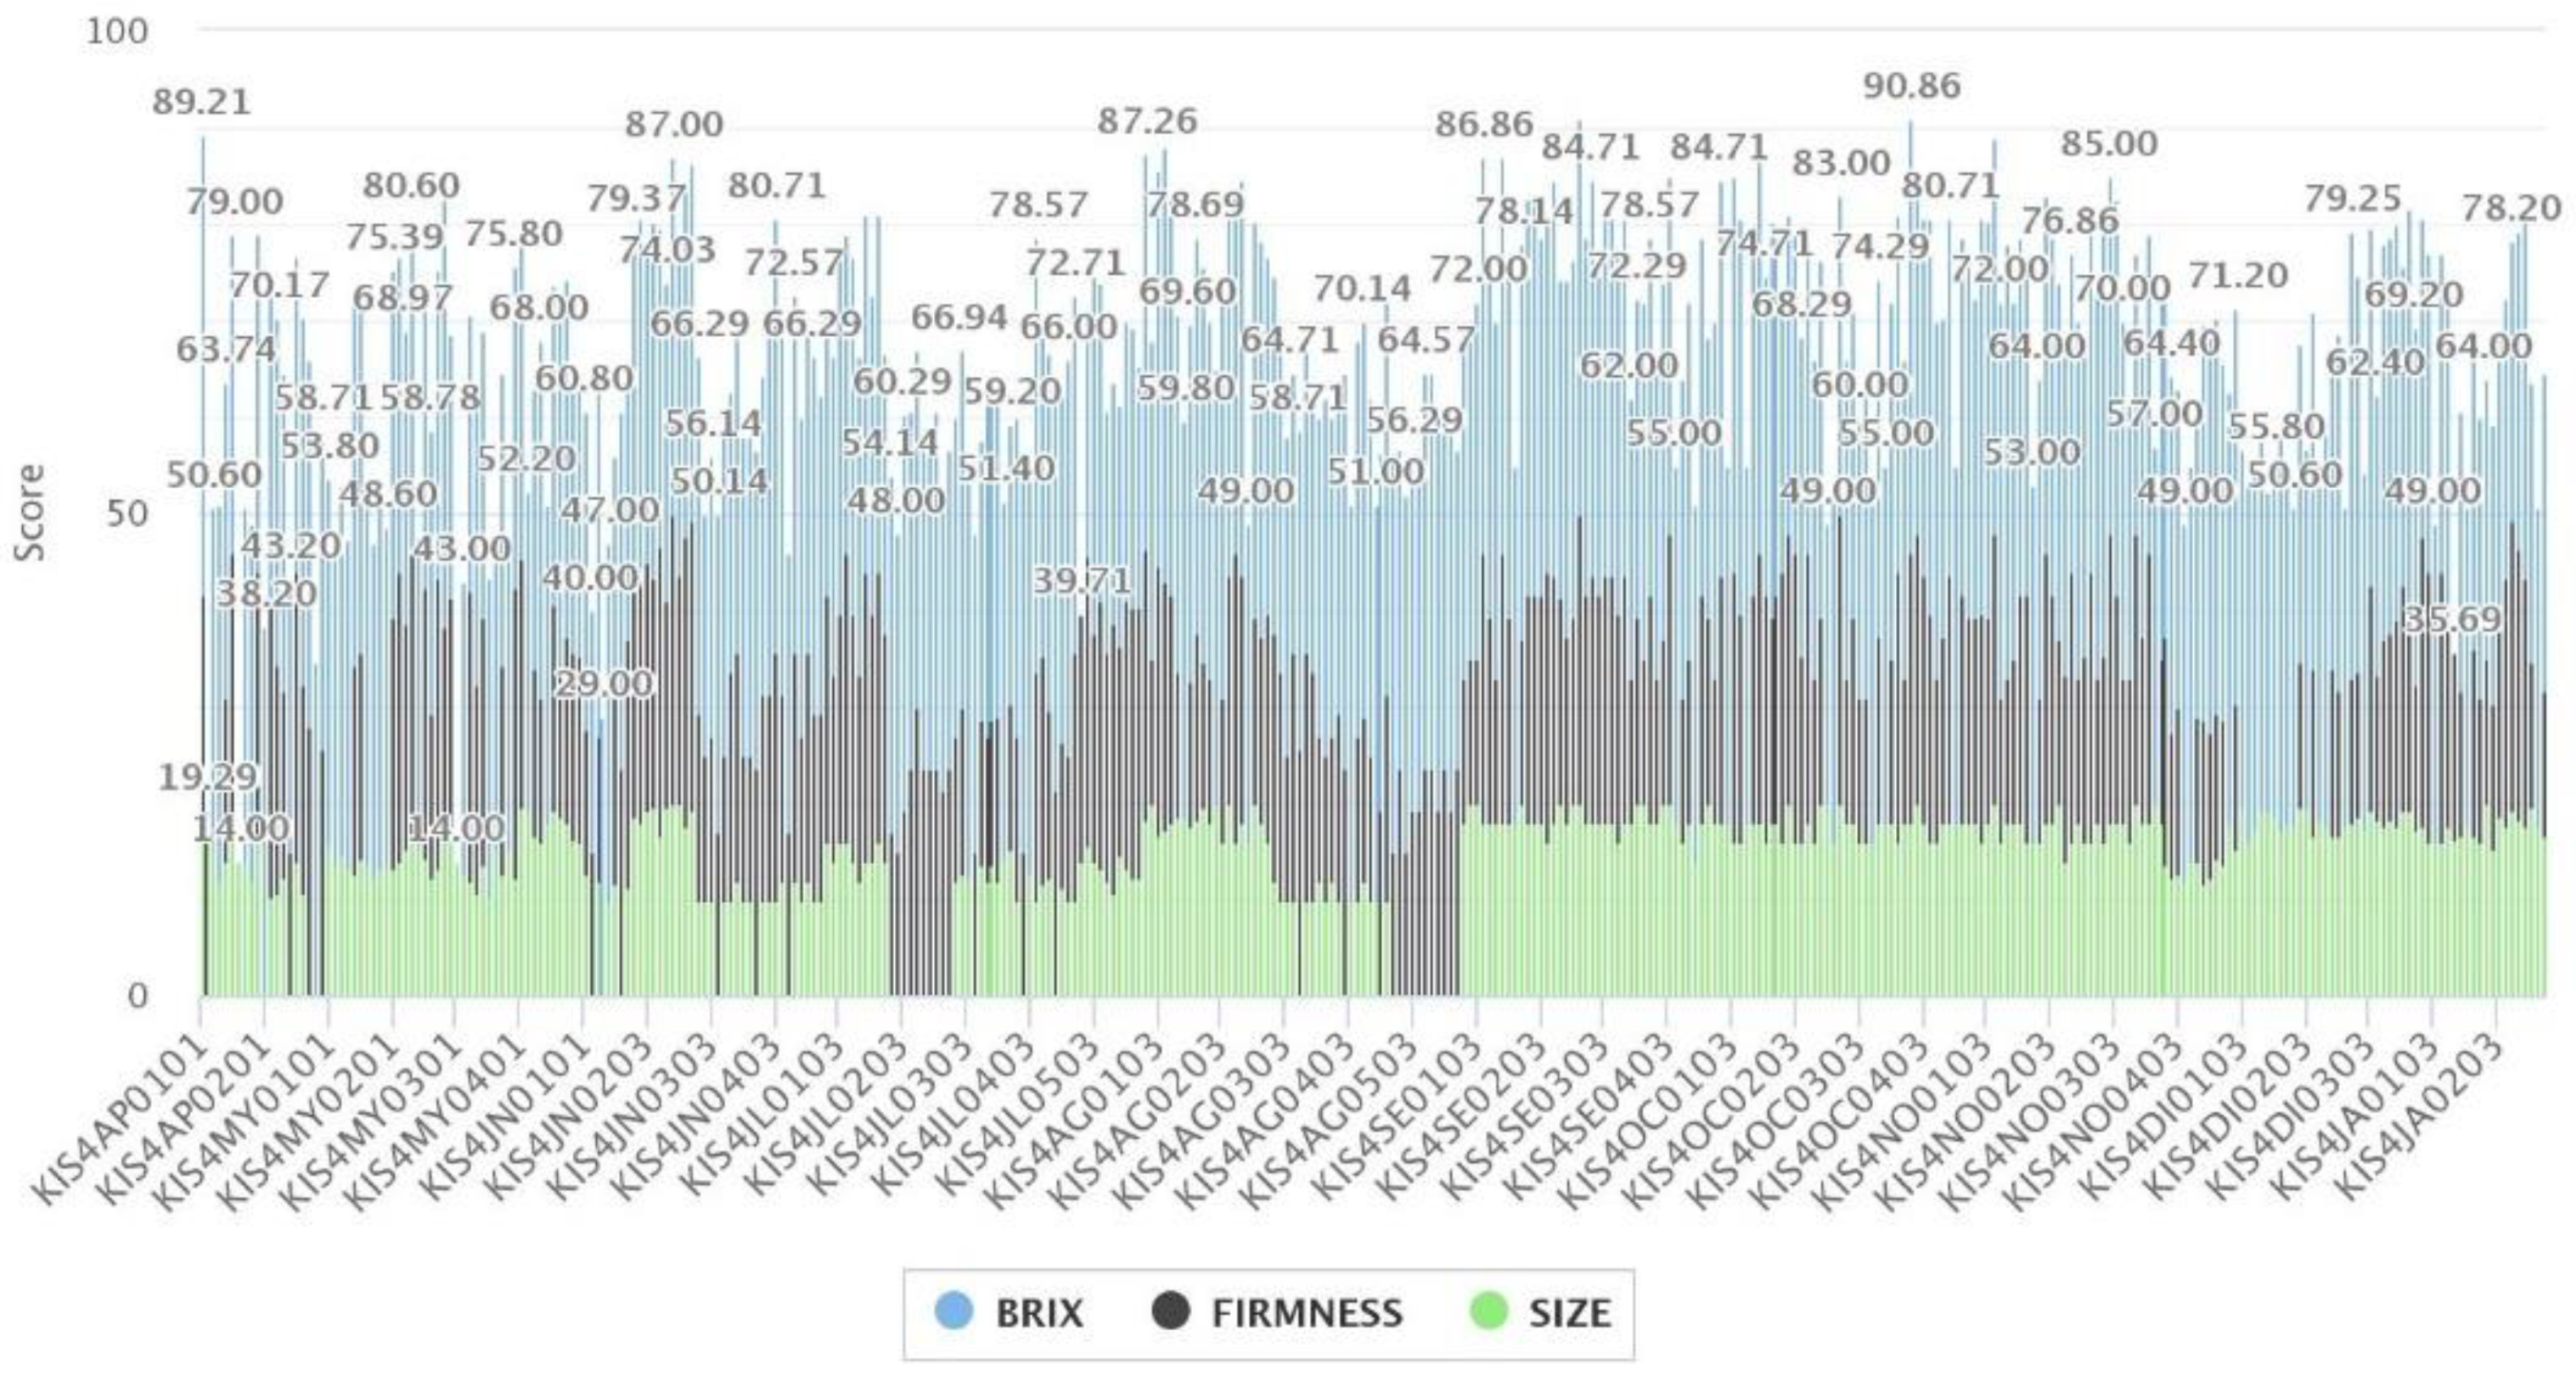
To validate the model proposed to obtain an indicator for product quality based on MAUT, it has been applied to eight organic fruits using real data from a supermarket chain of conformance to specification from 2018. There are not enough data to include the organoleptic characteristics in the assessment. In addition to the evaluation table, it is necessary to establish the utility functions for each criterion with the support of experts.
Figure 5 and
Figure 6 show some examples for organic banana and kiwi. Size and firmness are criteria with minimum and maximum values to be acceptable, as well as a linearly increasing utility until the average and decreasing from this value to the maximum. In term of colour, the criterion applied to measure the degree of maturity of the banana, values 3 and 4 are the only ones acceptable with the maximum utility. Finally, brix degrees, which indicate the sweetness of fruit, are one of the most important criteria to evaluate the quality of many fruits. In this case, the utility function has a minimum value only, and from this point, the utility increases linearly, but the increments are lower when the brix degrees have high values, as can be observed in
Figure 6b.
The values of the quality indicators obtained by MAUT and the contribution of each criterion are shown in
Figure 7 for organic banana and in
Figure 8 for the organic kiwi. The results of all computational analysis in this study were obtained using D-Sight software [
38]. The high quality of the organic banana is highlighted in
Figure 7, while there is high variability in organic kiwi with failures in size. These graphs represent very useful visual tools for making tactical and strategic decisions in the purchasing department.
4.2. Aggregated Evaluation of Product by Preference Ranking Organisation Method for Enrichment Evaluation
The product evaluation considers additional criteria as proposed in
Figure 4. The purchase volume and origin of fruits are strategic criteria for supply chain management in food distribution. The multicriteria method proposed to obtain a complete product evaluation is PROMETHEE, which is more discriminant than MAUT and allows managers to focus mainly on those that are more strategic for the company.
First, in PROMETHEE, it is necessary to establish the weights and the preference functions for the three criteria, which are maximised. In order to balance the priorities of the departments involved—quality, purchasing and logistics—the consensus weights of criteria are 50% for fruit quality, 40% for purchase volume and 10% for origin. All preference functions are linear without the indifference threshold, but their preference thresholds are different. The performance of fruits for the quality indicator is measured on a scale from 1 to 100 obtained by MAUT, as explained in the previous section, and its preference threshold is 5. The purchase volume is measured in euros with a preference threshold of 50,000 euro.
Origin is a criterion that distinguishes among national fruit, from the European Union and other countries with values of 100, 75 and 50. The preference threshold for the origin criterion is 20. All values are 100, except for avocado and kiwi. Avocado is from Peru, Mexico and national sources (Spain). Italy and New Zealand are the origin of kiwi. The values assigned to both fruits in the evaluation table are the average weighted by the proportion of fruit from each group of countries.
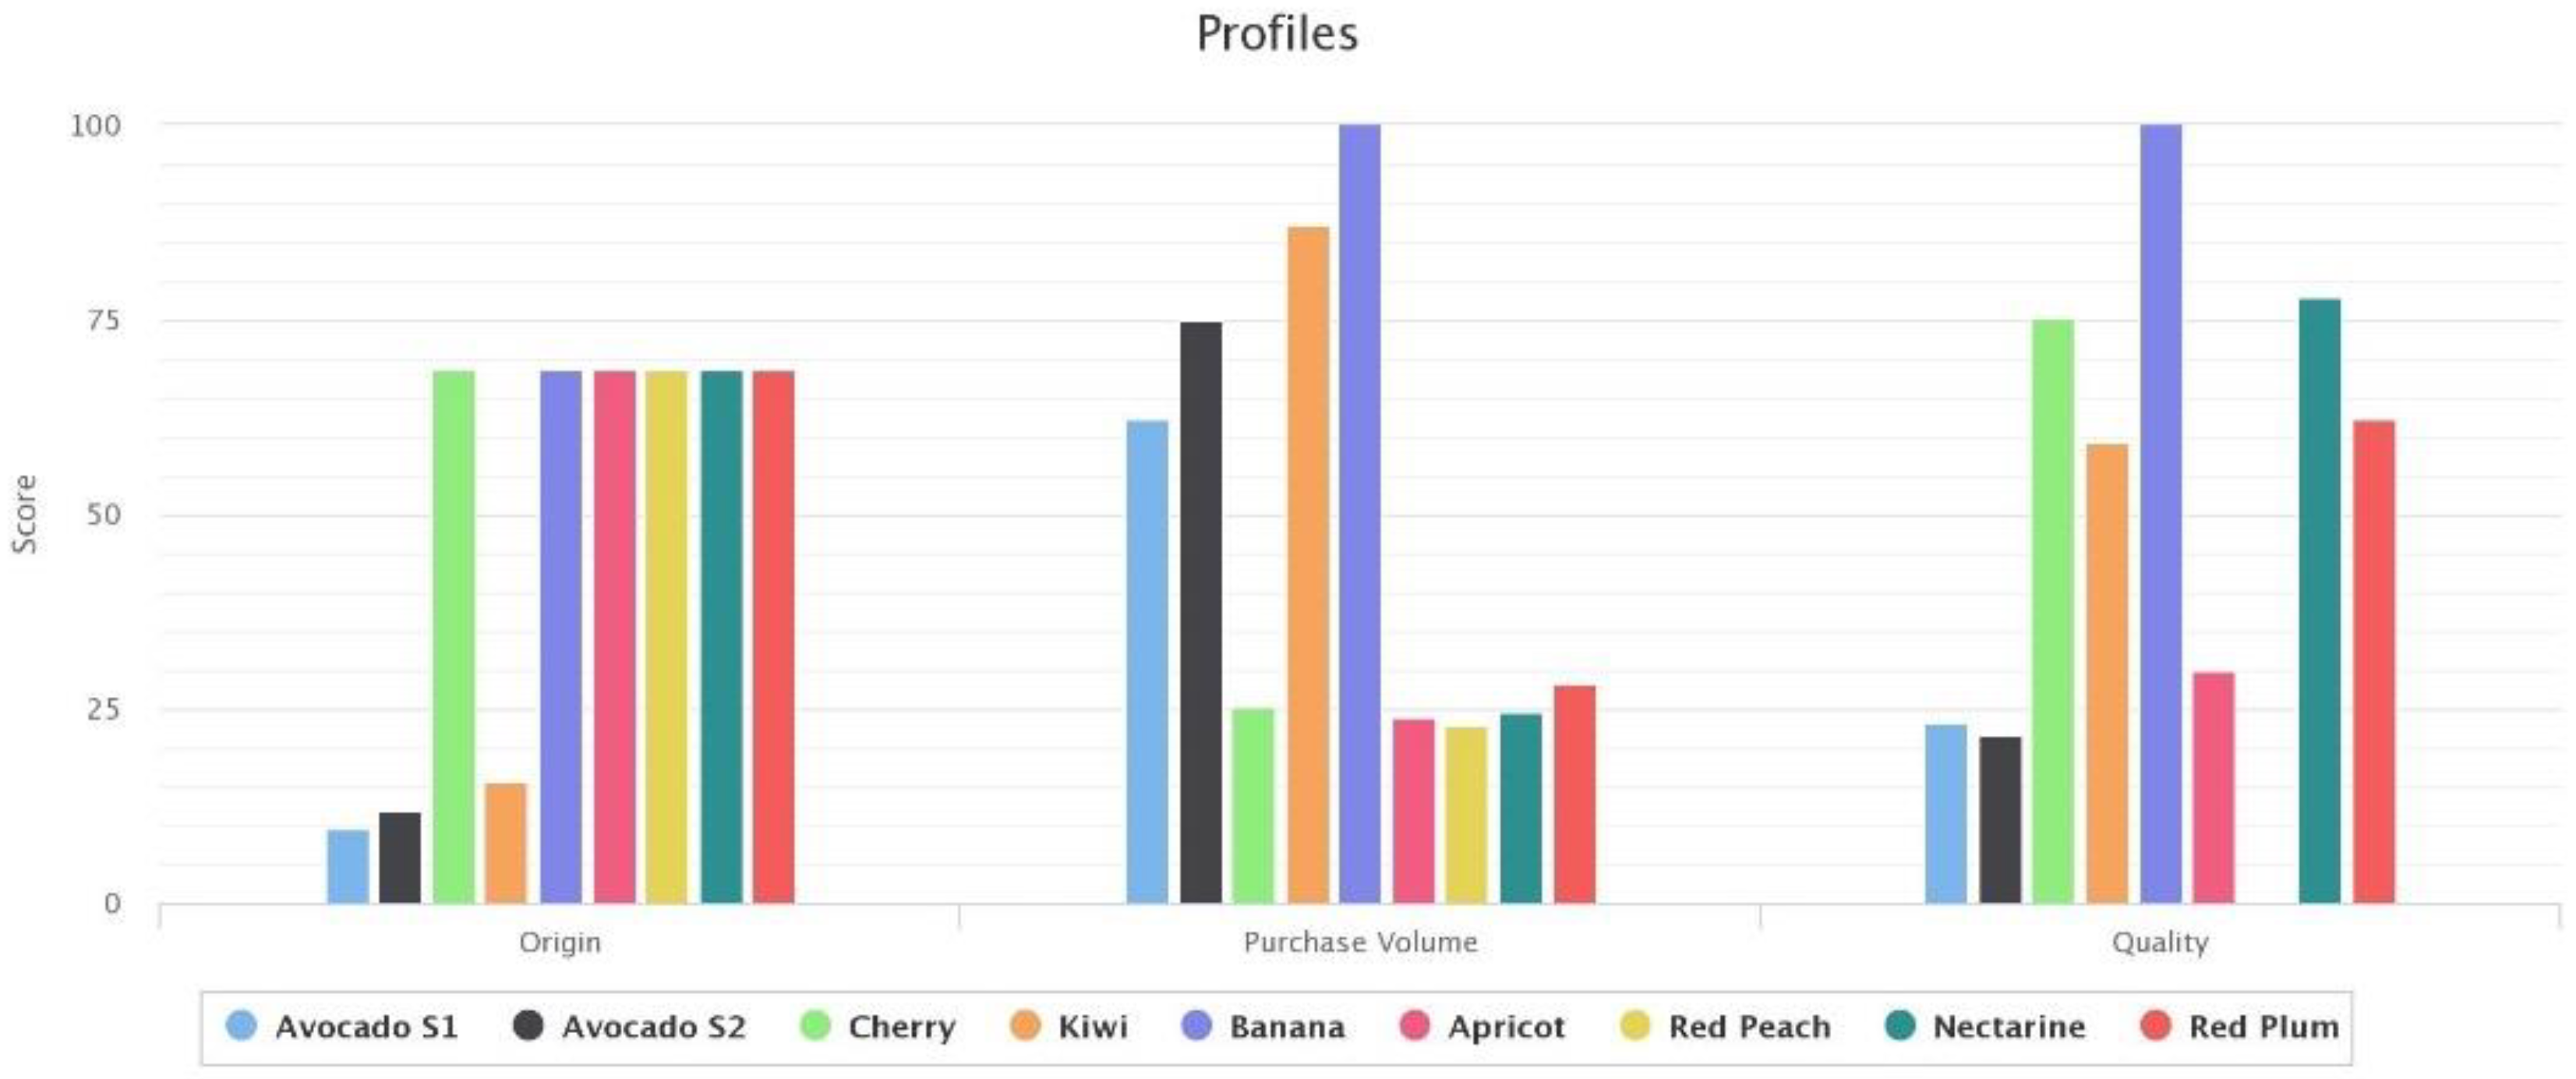
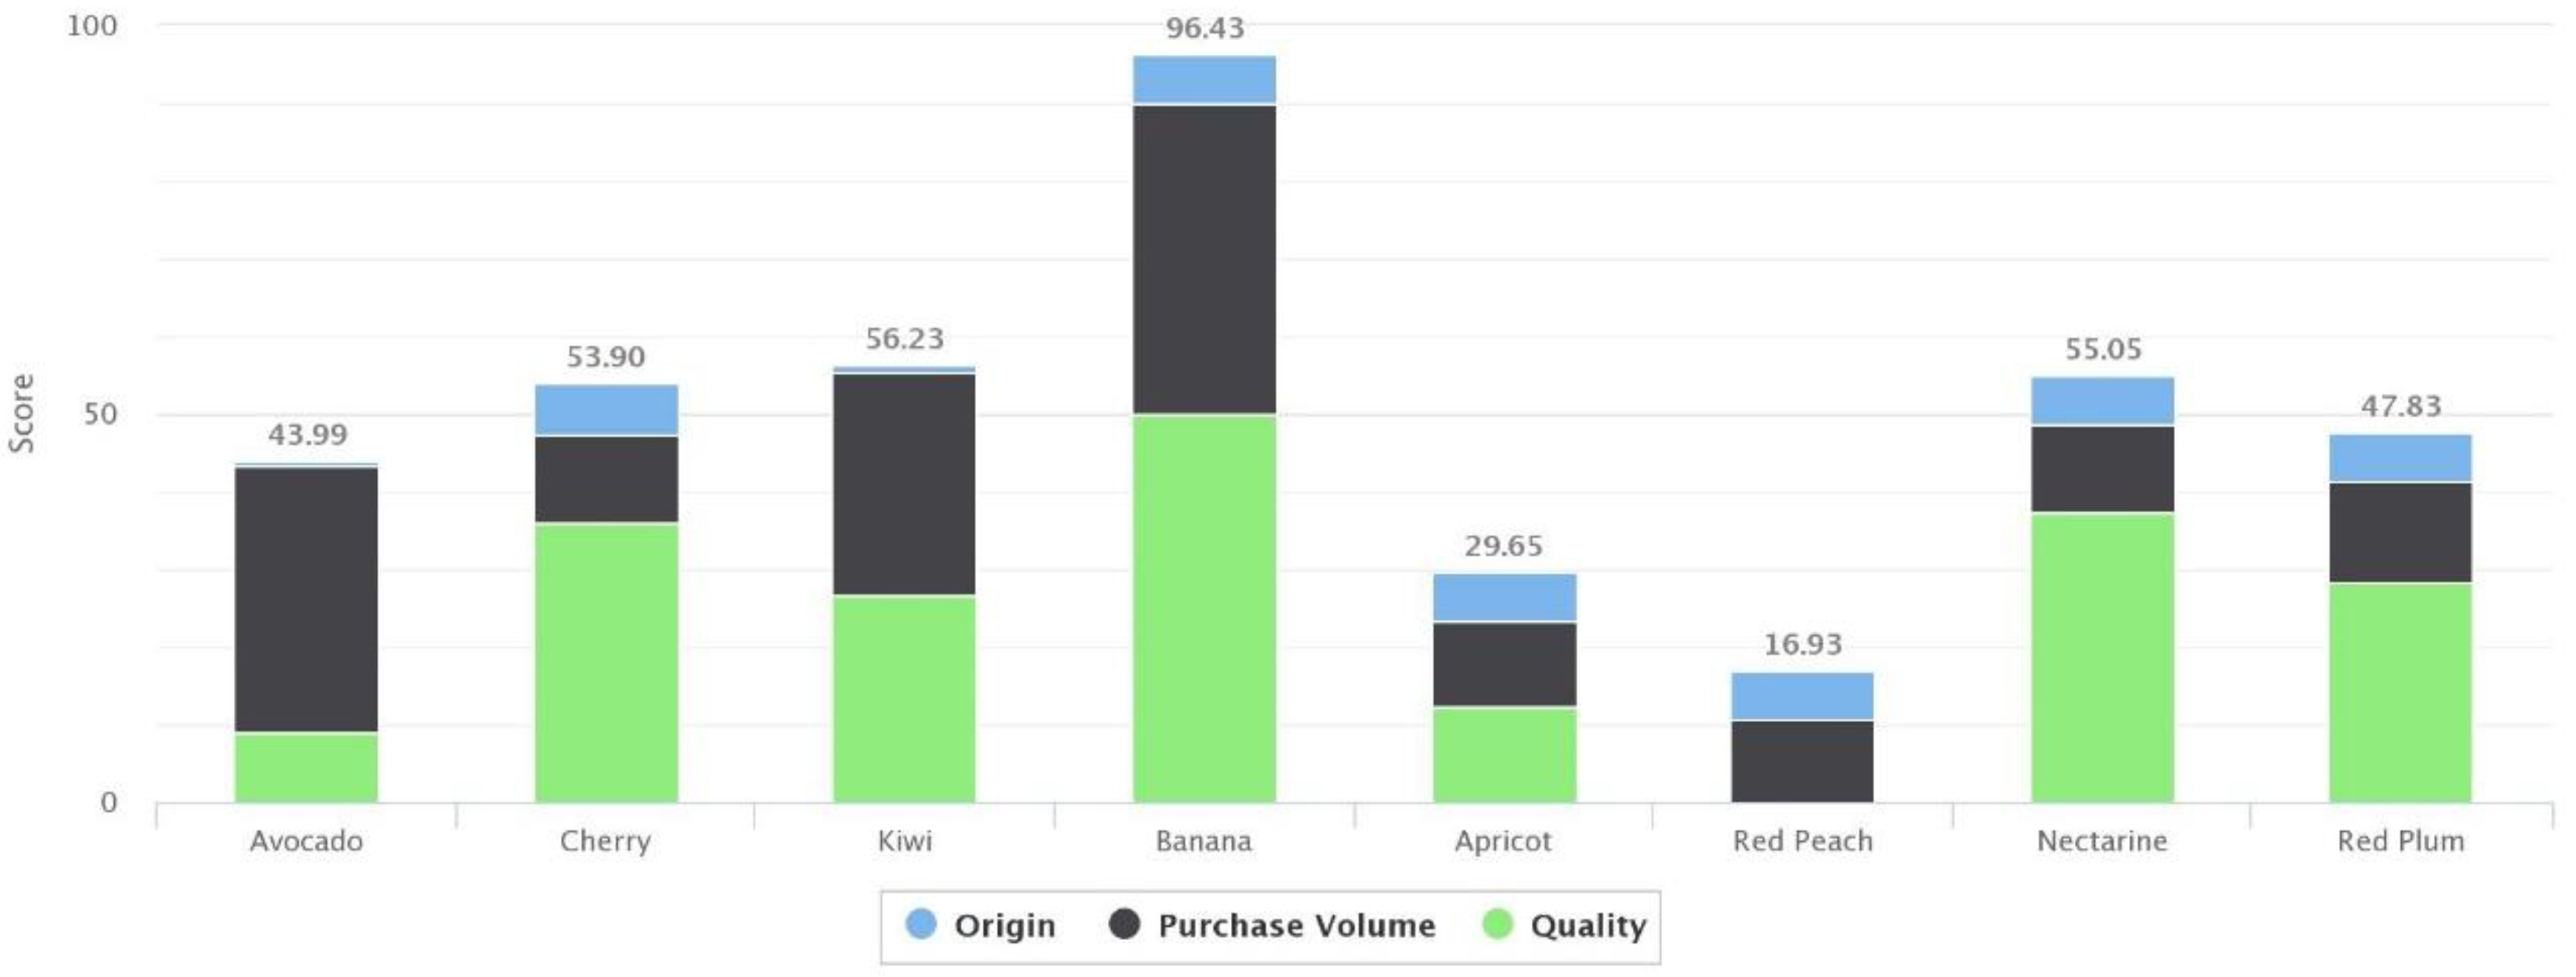
Figure 9,
Figure 10 and
Figure 11 represent some of the main results of the product evaluation by PROMETHEE.
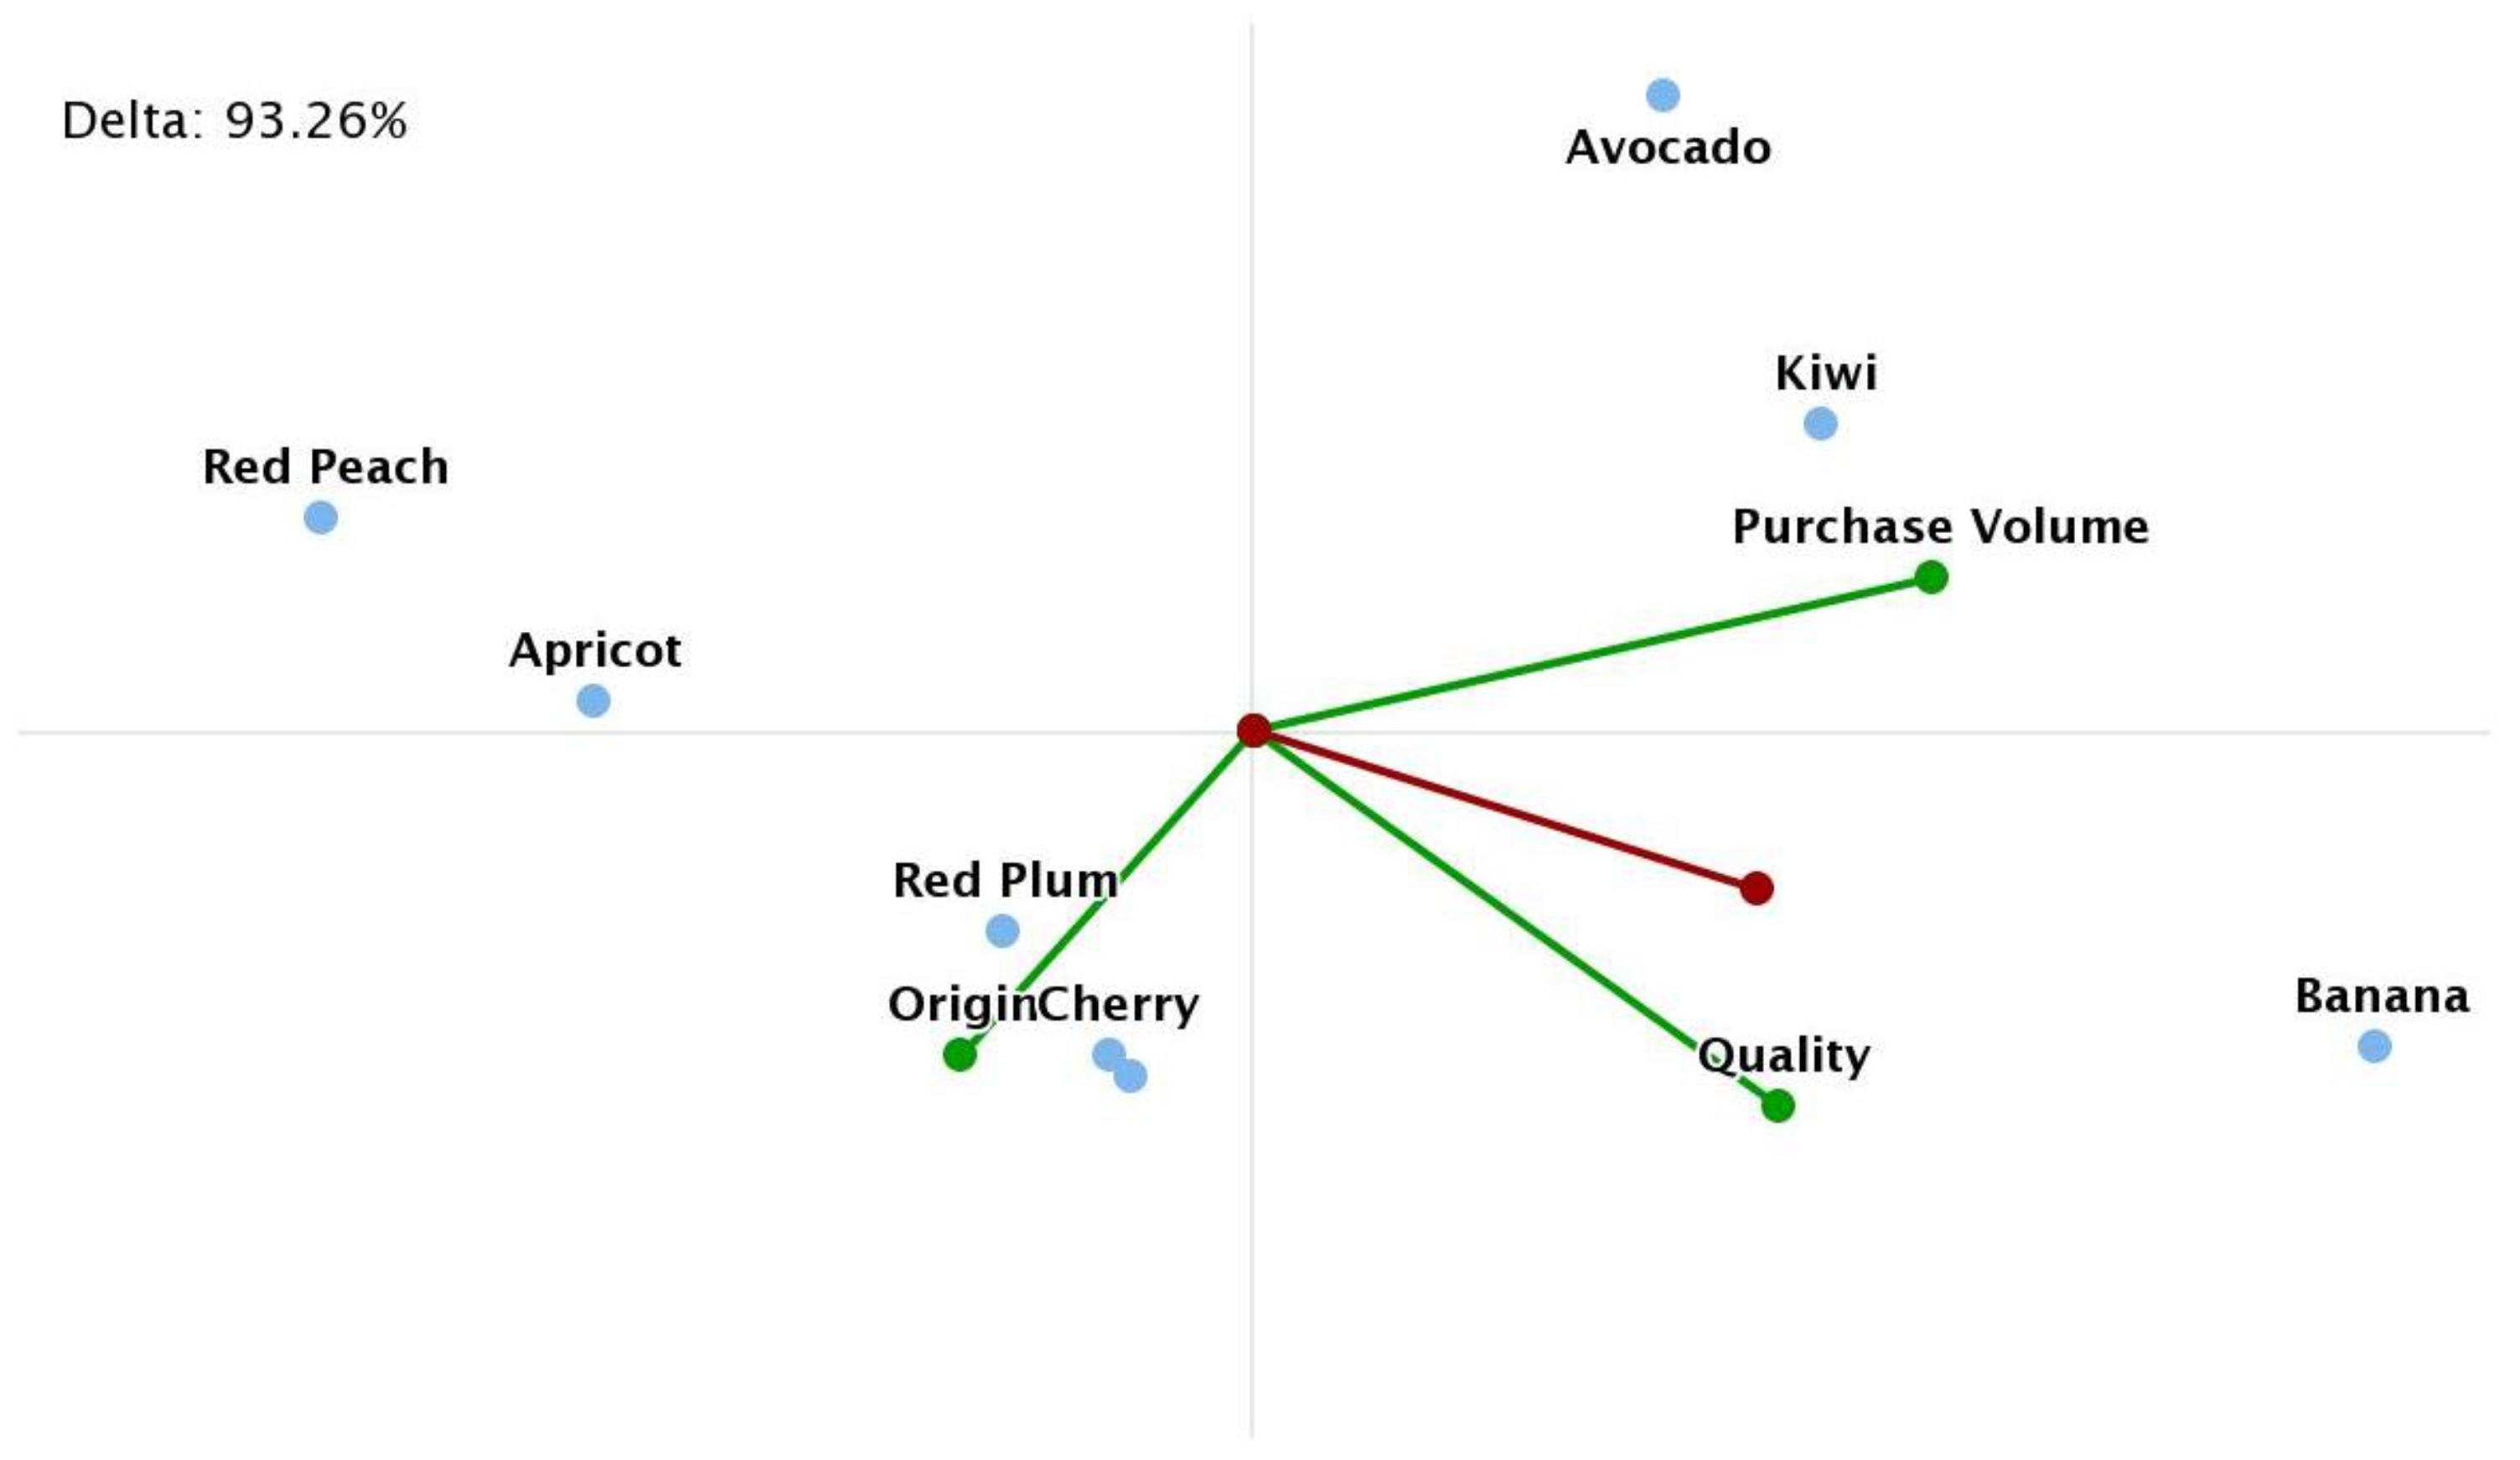
Figure 9 shows the profiles for the eight fruits and each criterion. Banana stands out with the best score in purchase volume and quality. As it is a national product, banana has the maximum score in origin. As a result, banana is the fruit with the best evaluation, followed by kiwi, nectarine and cherry (
Figure 10).
Figure 9 also shows the evaluation of avocado by two suppliers, which present small differences in origin and quality and somewhat greater differences with respect to purchase volume.
Figure 10 presents the criteria contribution for total avocado fruit. The global visual analysis based on the GAIA plane, represented in
Figure 11, provides another important perspective of the PROMETHEE results. Banana has the best evaluation, being good in quality and purchase volume. Kiwi is good due to this latter criterion, while it is the opposite in red peach, apricot, red plum, cherry and nectarine. The nectarine point is close, below that of cherry in
Figure 11.
5. Results of Supplier Evaluation
Sustainable supply chain management is a very complex task due to many and conflicting aspects that are necessary to consider. Sustainability involves at least economic, environmental and social criteria. The complexity is greater in the food supply chain, given the relevance of food safety and its impact on final consumers and distribution companies.
Hierarchies are good support when defining models that represent an approach to the sustainable evaluation of suppliers.
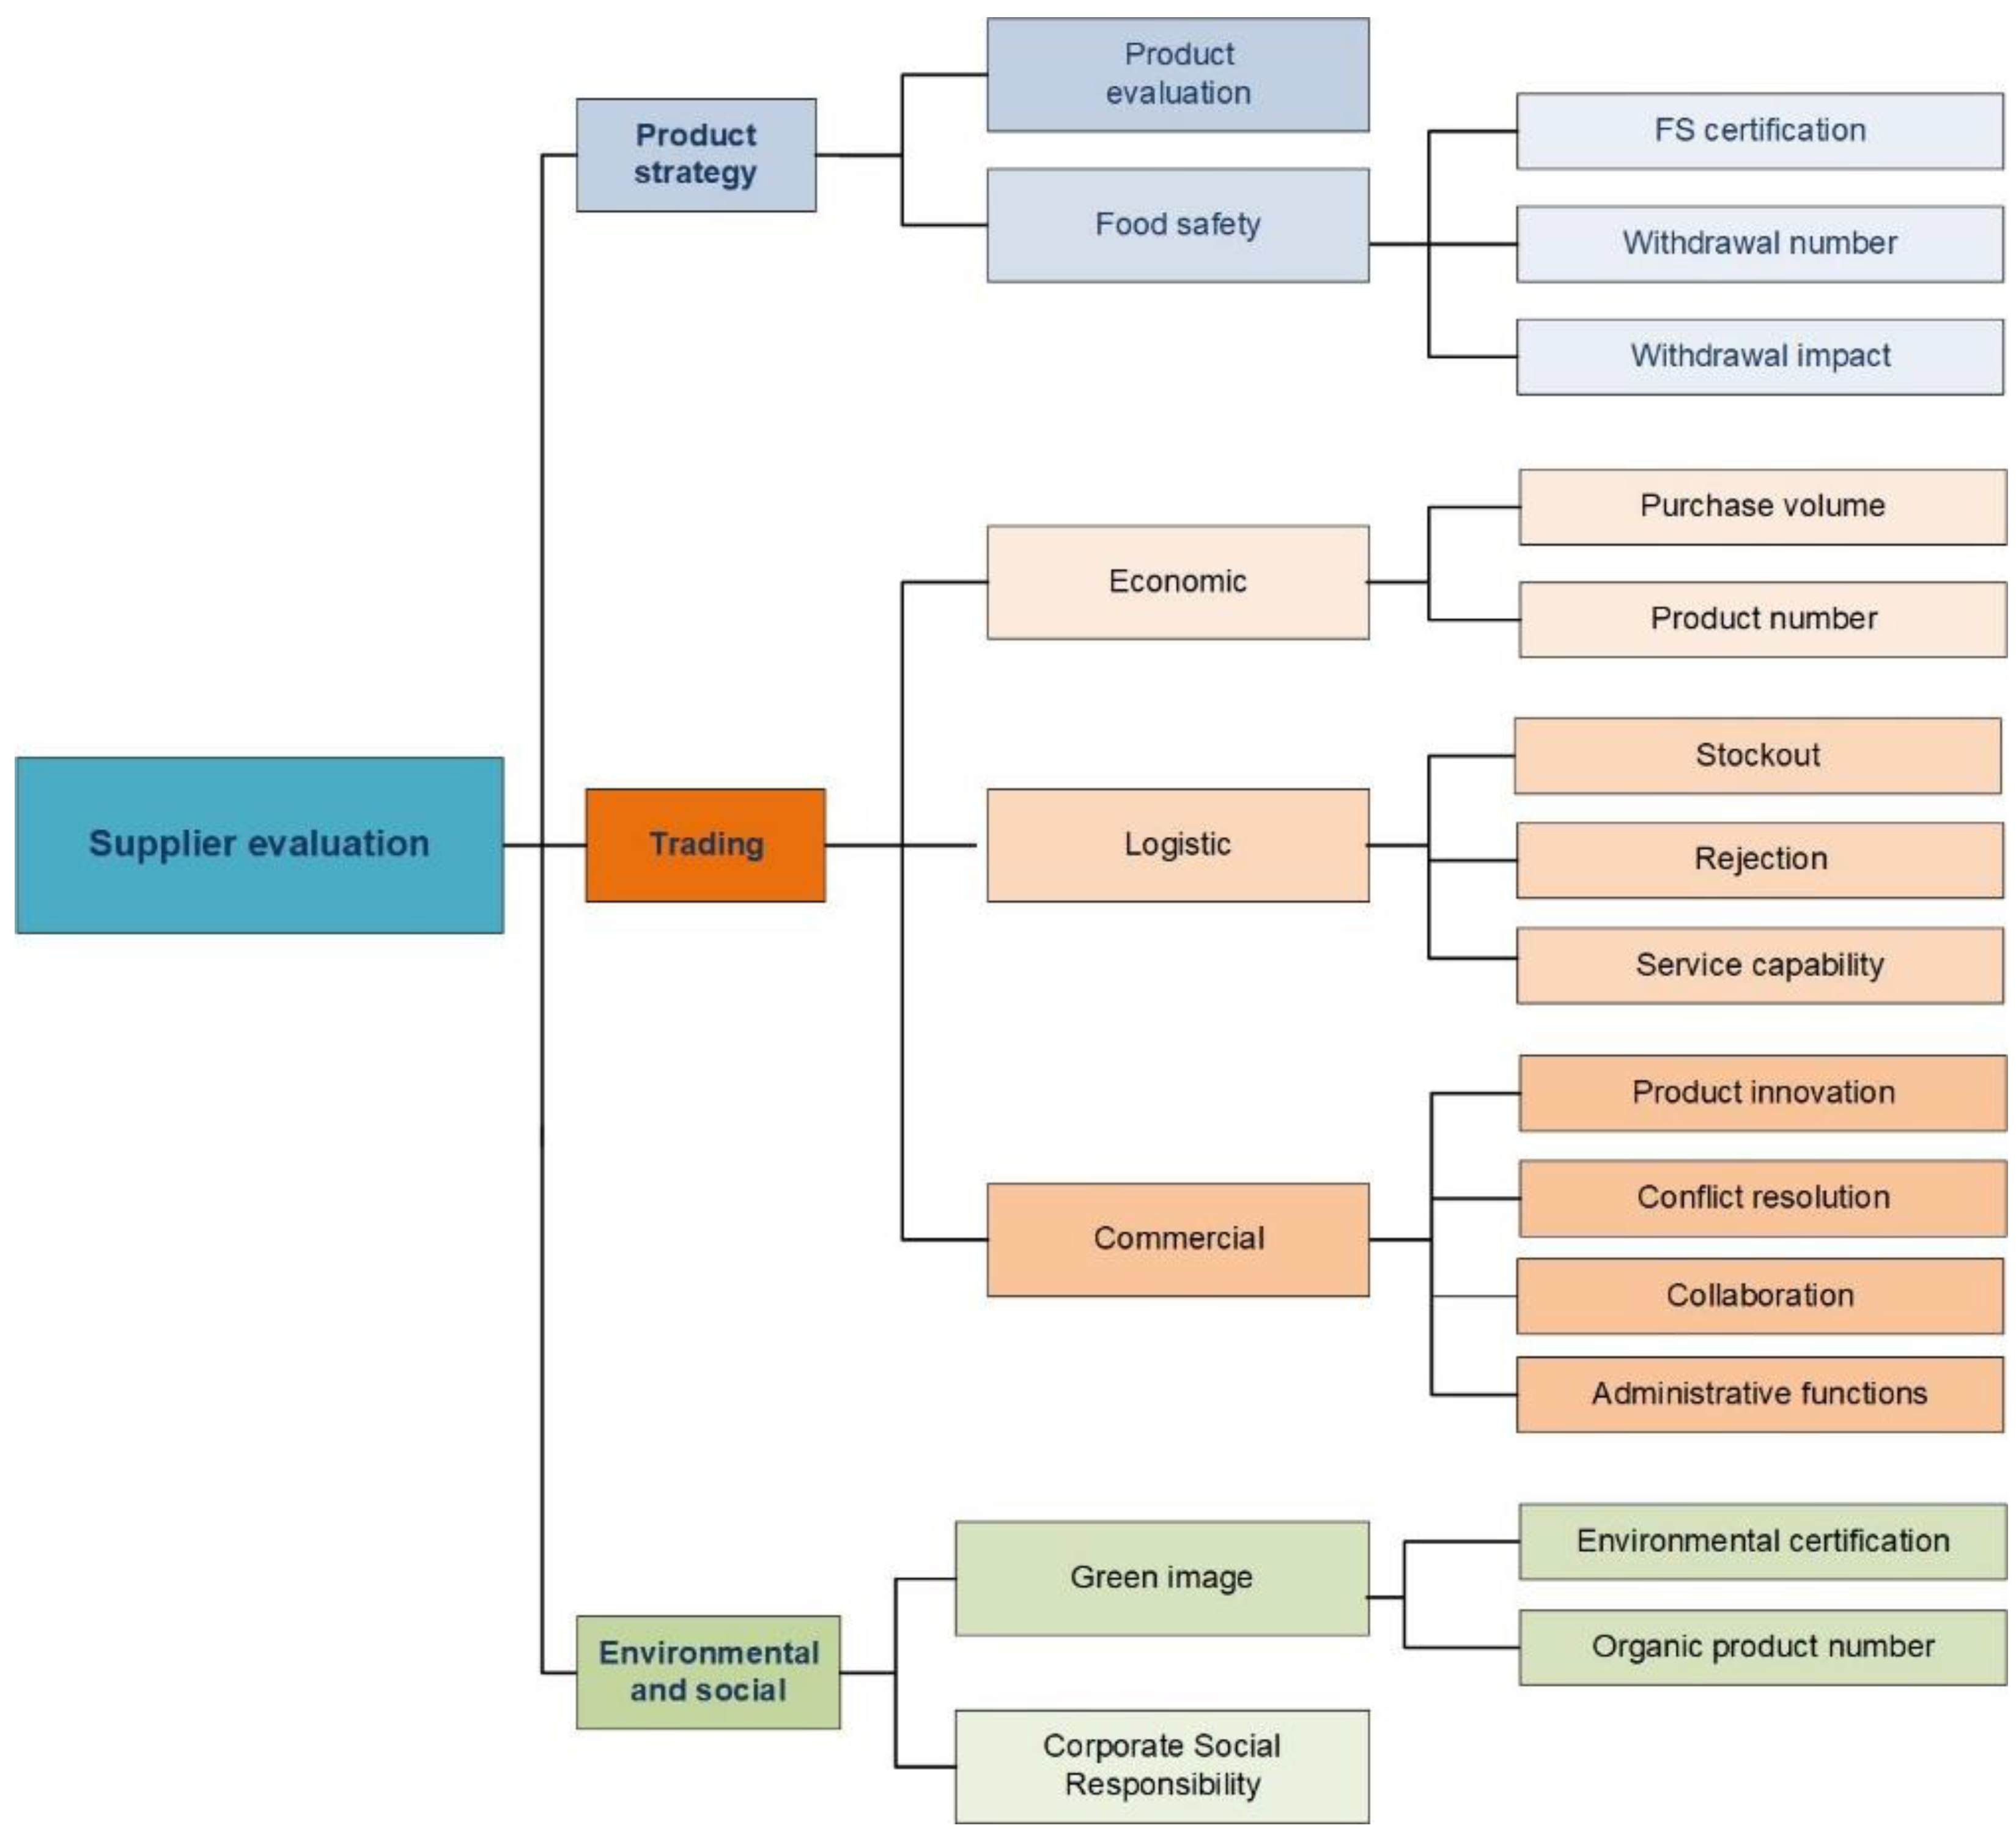
Figure 12 presents the hierarchy of criteria for supplier evaluation for food products, which is applied to fresh fruit with real data from a supermarket chain. The criteria are organised in three main categories: Product strategy, trading and environmental and social.
Product strategy consists of two subcategories: Product evaluation, explained in the previous section, and food safety. The performance of suppliers related to food safety can be measured through certifications, such as IFS, BRC, ISO 22000, …, as well as the number and the impact of withdrawals in stores. When a supplier has one or more food safety certifications, they receive a score of 100 in the evaluation table. If this is not the case, but the supplier has Hazard Analysis and Critical Control Points (HACCP) implemented, the value is 50 and zero otherwise. The impact of withdrawals in stores can be measured quantitatively if the economic effect is known or qualitatively by using a scale from zero to 100, zero being the best value when there is no impact. In addition, traceability can be another criterion to complete the food safety assessment.
The trading category aggregates economic, logistic and commercial subcategories, while the first two are evaluated through quantitative criteria, whose data are available in companies, such as purchase volume, number of products, percentages of stockout and rejection in logistic platform. The supermarket chain that provides real data also measures the service capability quantitatively by using the average percentage of compliance with the day and time. On the contrary, the commercial criteria are qualitative and to evaluate suppliers in these criteria, managers assign values directly using a scale from zero to ten.
Finally, the third category considers the green image of the supplier by the accreditation of environmental certifications (ISO 14001, ISO 14064, Eco-Management and Audit Scheme, Zero Waste…) and the number of organic commodities provided. These two criteria measure the environmental protection in supplier selection, and their choice is mainly due to their objective nature and data availability. The product origin could be included, as local products entail less transport pollution, but it has been already considered in the product evaluation. Corporate social responsibility is a new criterion, evaluated by the authors based on information available on the suppliers’ websites.
5.1. Supplier Evaluation by Preference Ranking Organisation Method for Enrichment Evaluation
The multicriteria model proposed is applied in a supermarket chain with 775 stores in Spain. The company has six suppliers for the eight organic fruits included in this research. For confidential reasons, the suppliers are named Sj for j = 1, …, 6. Avocado is provided by S1 and S2, cherry by S3 and apricot by S5. S4 supplies kiwi and banana, while red peach, nectarine and red plum are from S6.
This section presents the main results obtained by applying PROMETHEE to carry out the evaluation of organic fruit suppliers. All criteria are maximised, except the following four: Number and impact of withdrawal and stockout and rejection. The preference functions are all linear without the indifference threshold, but with the preference threshold, whose value depends on the criteria. The evaluation table, weights and preference threshold of criteria are available in
Appendix B,
Table A1.
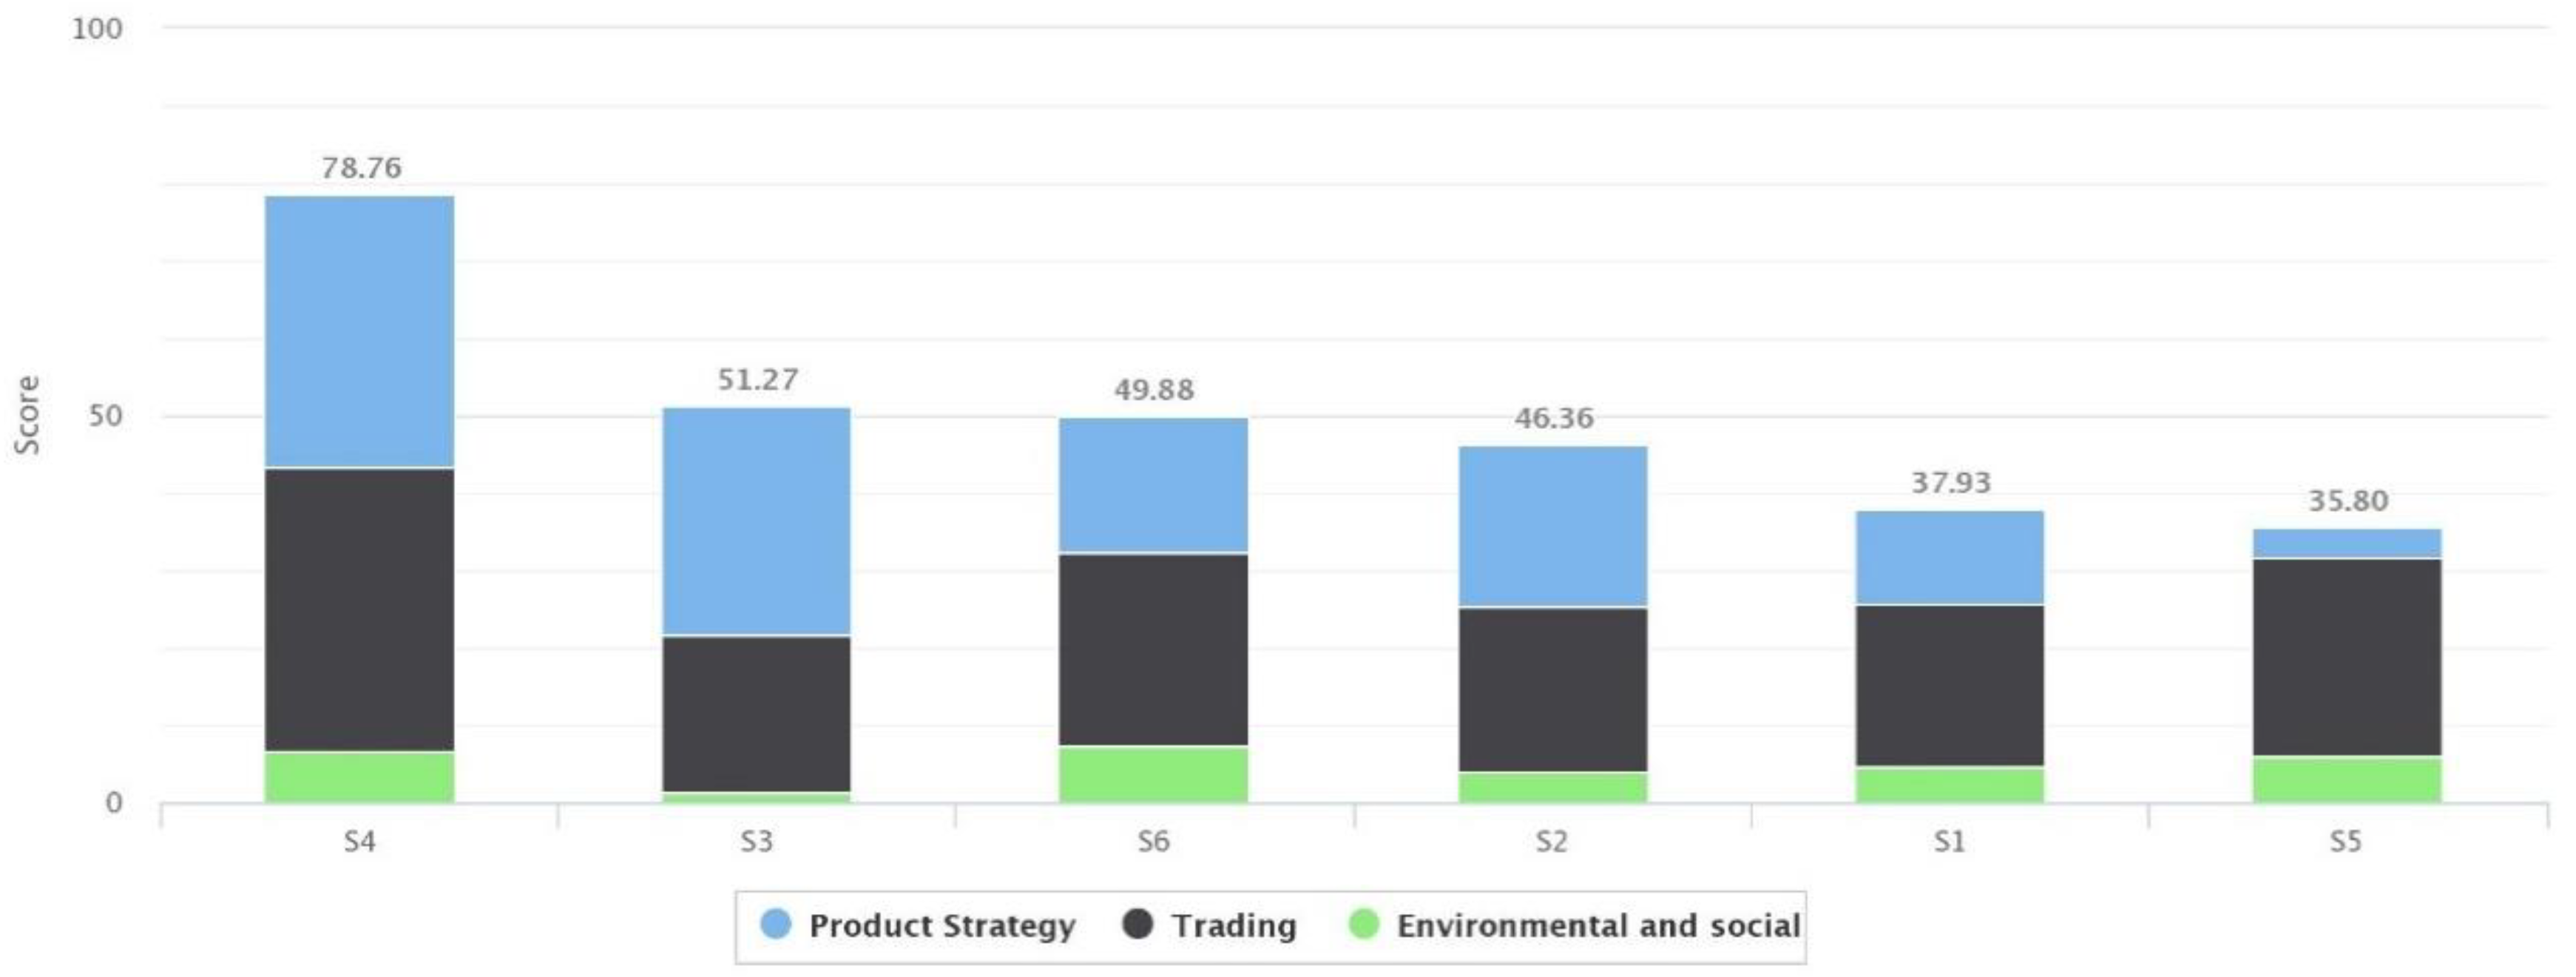
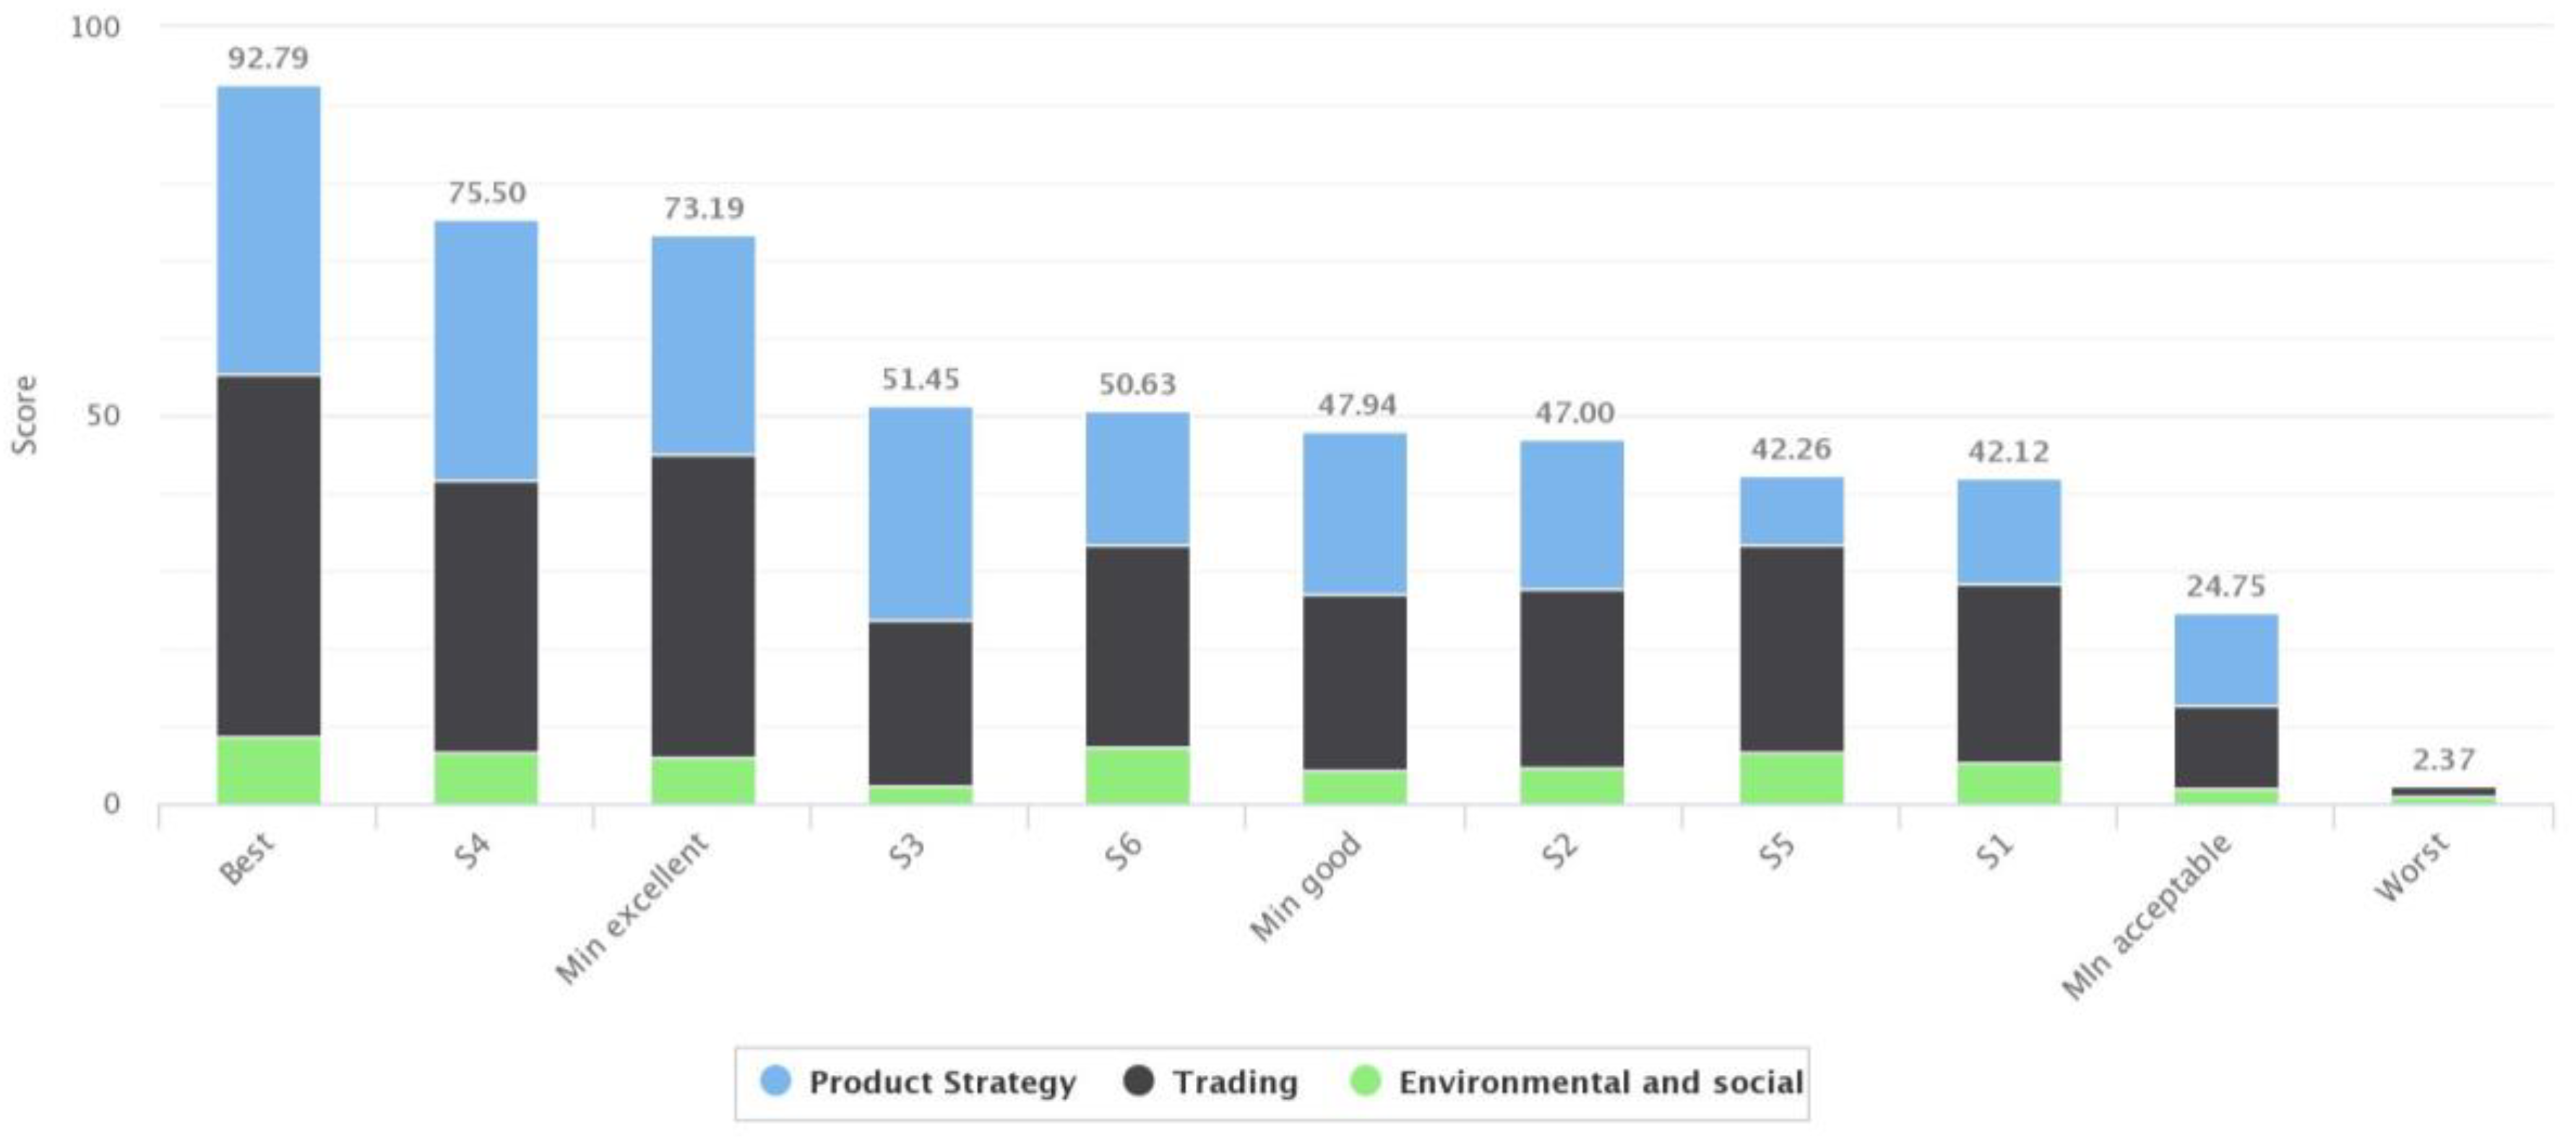
Figure 13 presents the ranking of suppliers, as well as the contribution of the main criteria categories. Supplier
S4 stands out from the rest, followed by
S3,
S6 and
S2, with
S1 and
S5 being the worst rated. One strength of the PROMETHEE method is its possibility of visualising its results in order to facilitate analysis for decision making, as shown
Figure 14 and
Figure 15 [
39,
40]. Although
S3 and
S6 have similar scores, both figures highlight different performances by the main group of criteria.
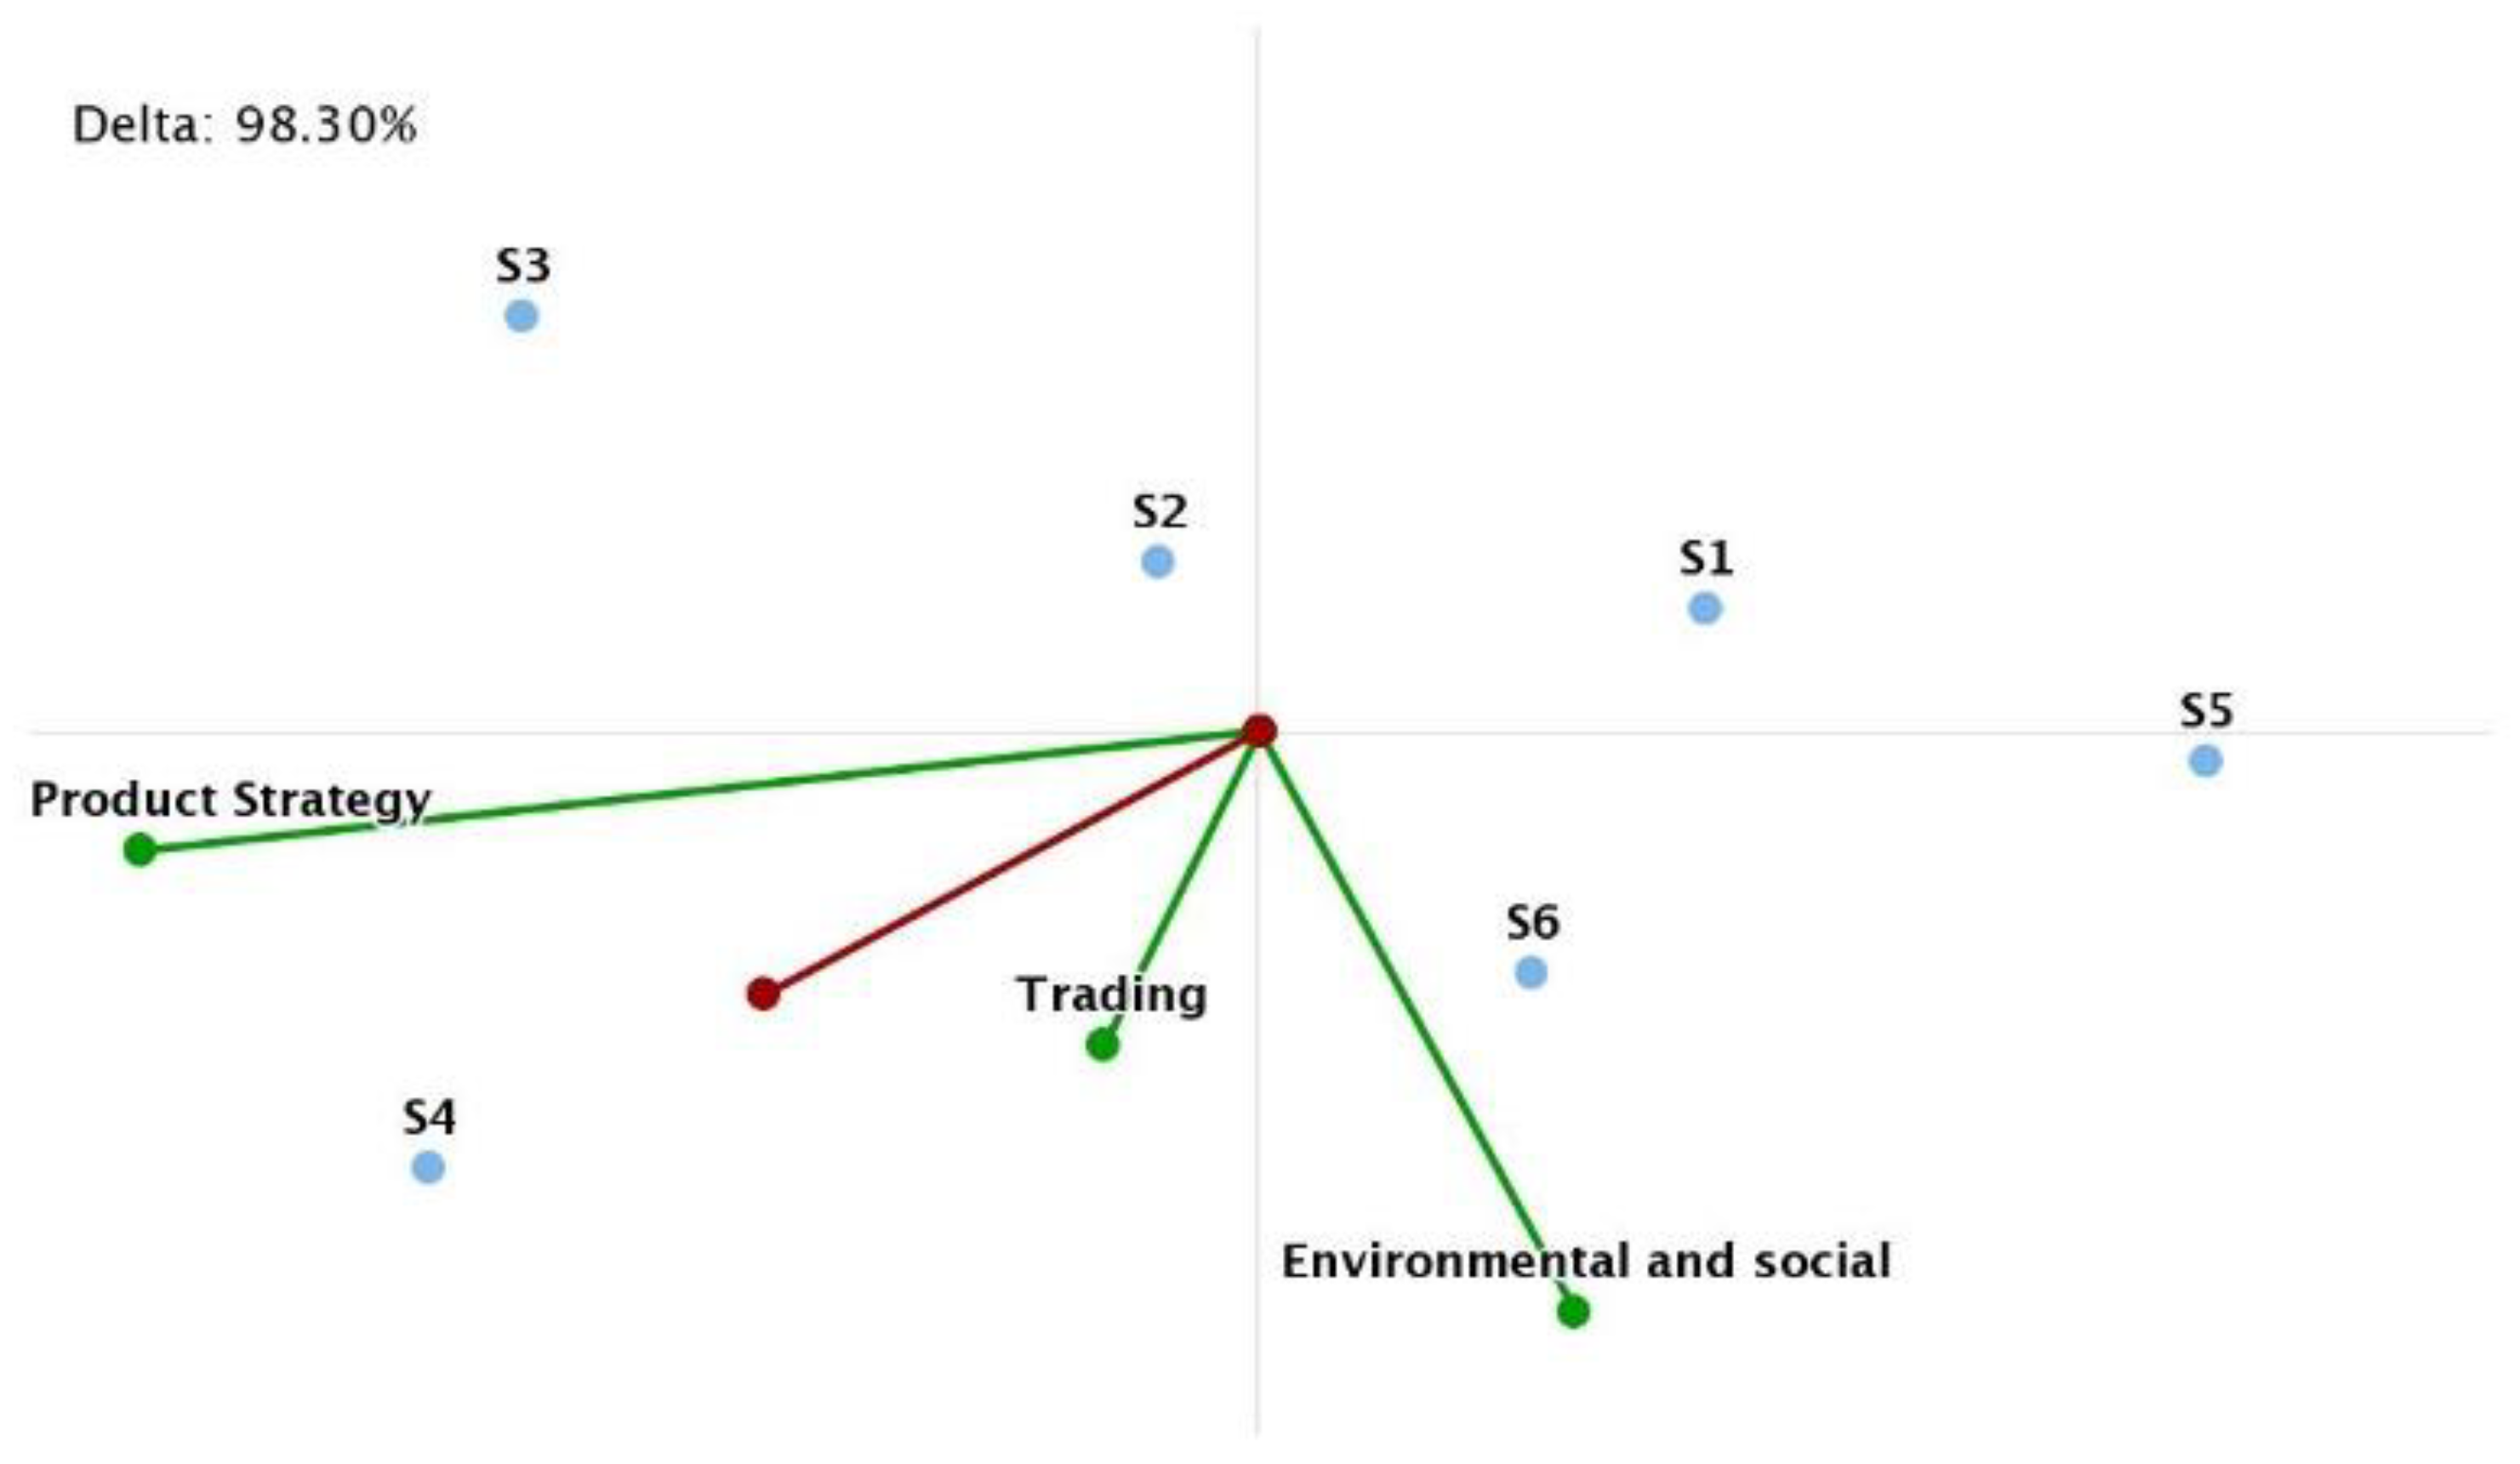
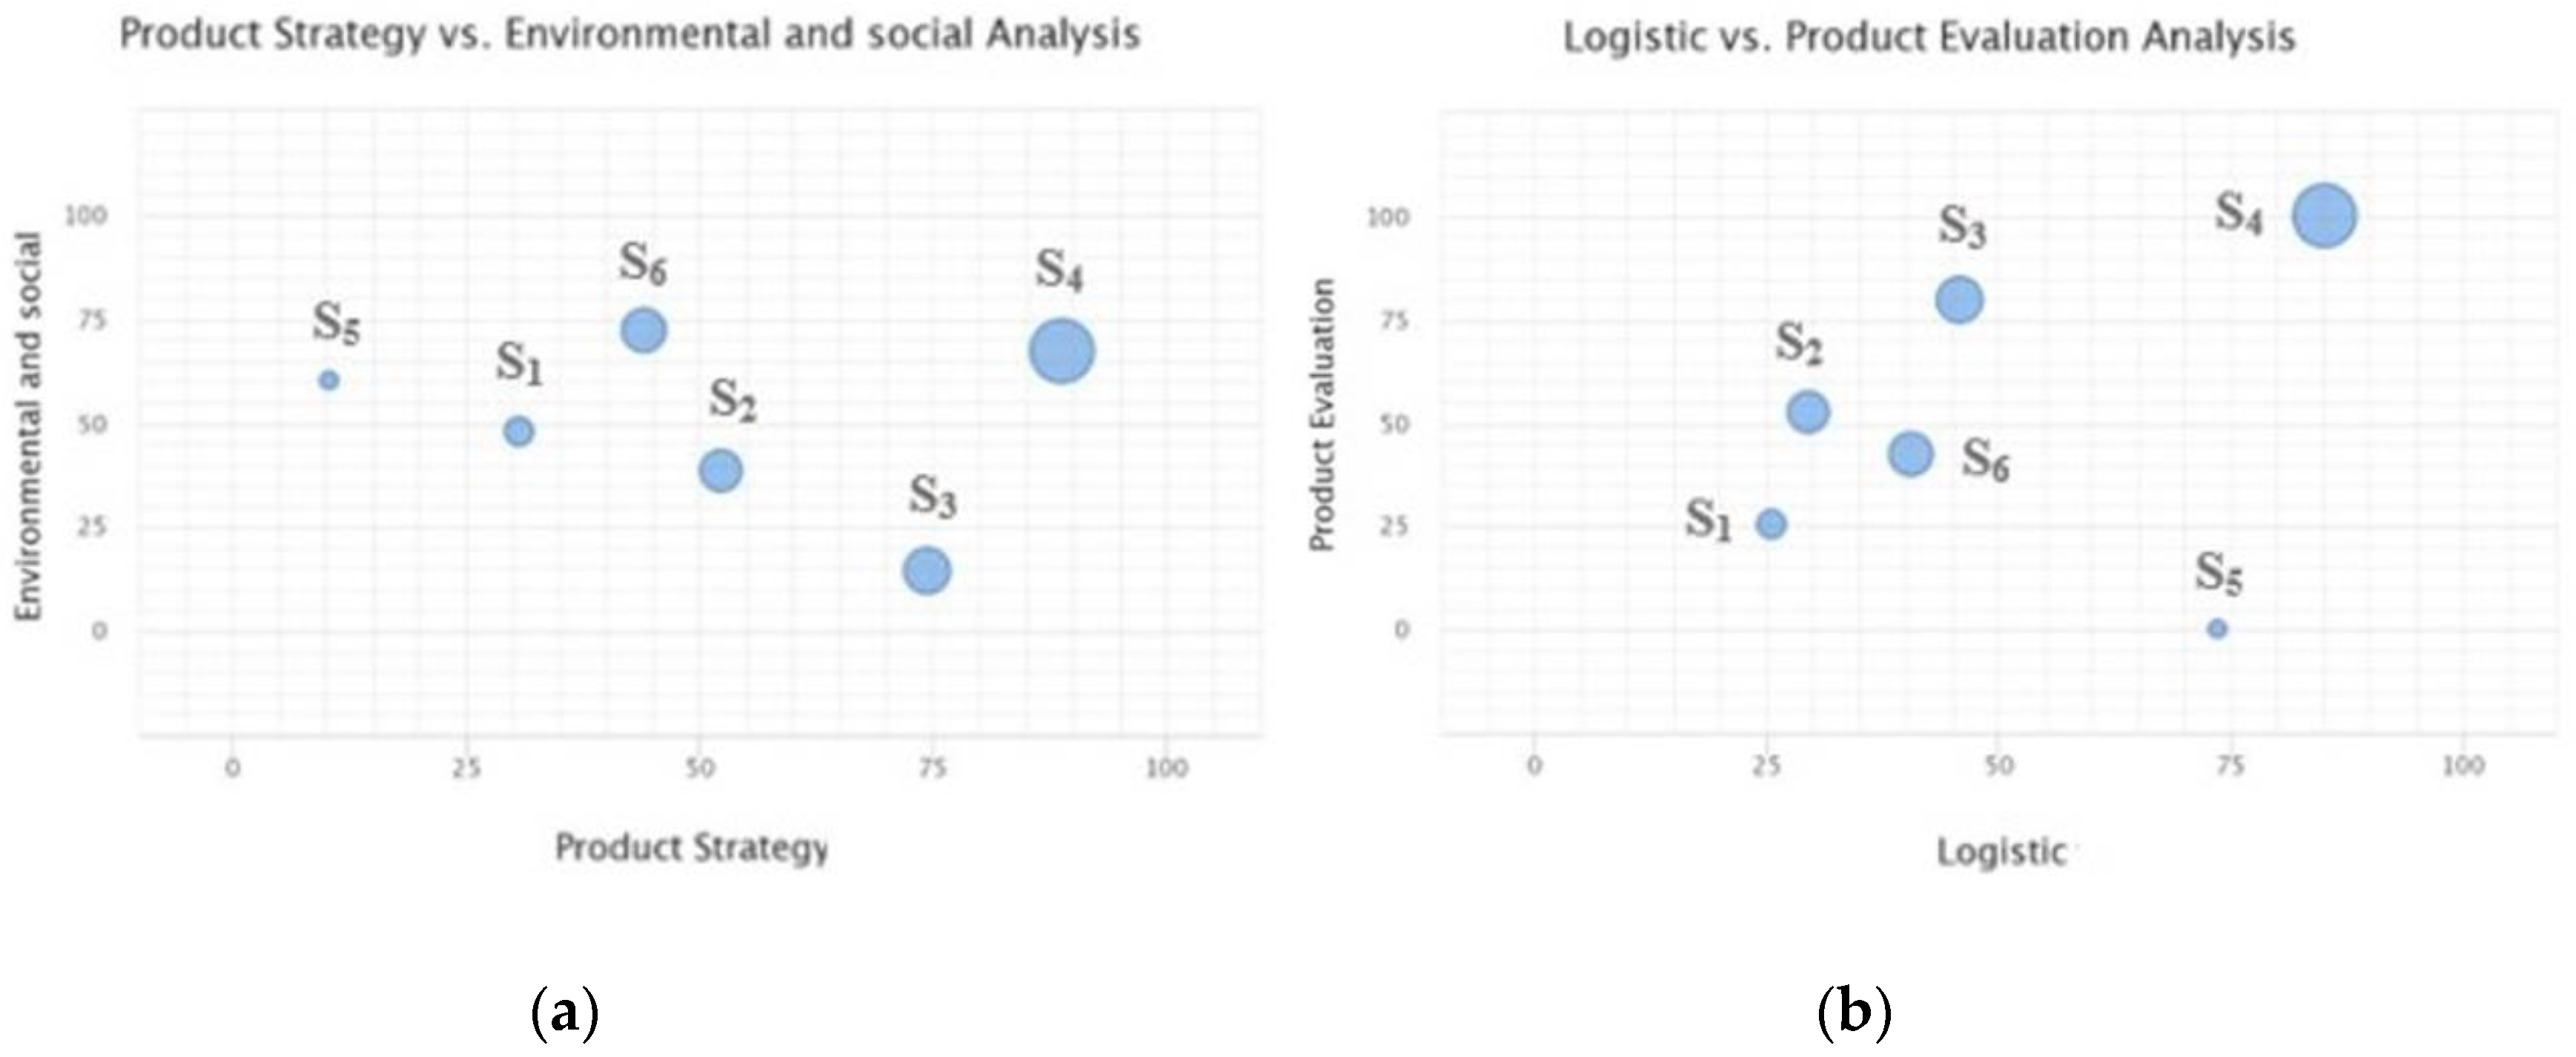
In complex decision problems, it is interesting to apply PROMETHEE with categories of criteria, as it allows the classification of alternatives according to them, as shown in
Figure 16, where the size of the bubble represents the total score of the supplier.
Figure 16a clearly distinguishes among
S2,
S3 and
S6 by product strategy and their performance in environmental and social criteria. This type of graphs helps to define the most appropriate actions for negotiation procedures with suppliers in order to improve their performance in weaker aspects and/or select those to sign contracts or other relationships. If a comparison were to be drawn between product strategy versus trading, it would show that the performance of suppliers according to trading criteria is similar for all suppliers. Nevertheless, if the graph only considers logistic criteria versus product evaluation, the supplier can be classified according these criteria, which would allow managers to focus on their area of interest, the best providers, those for which to indicate improvements, etc. (
Figure 16b).
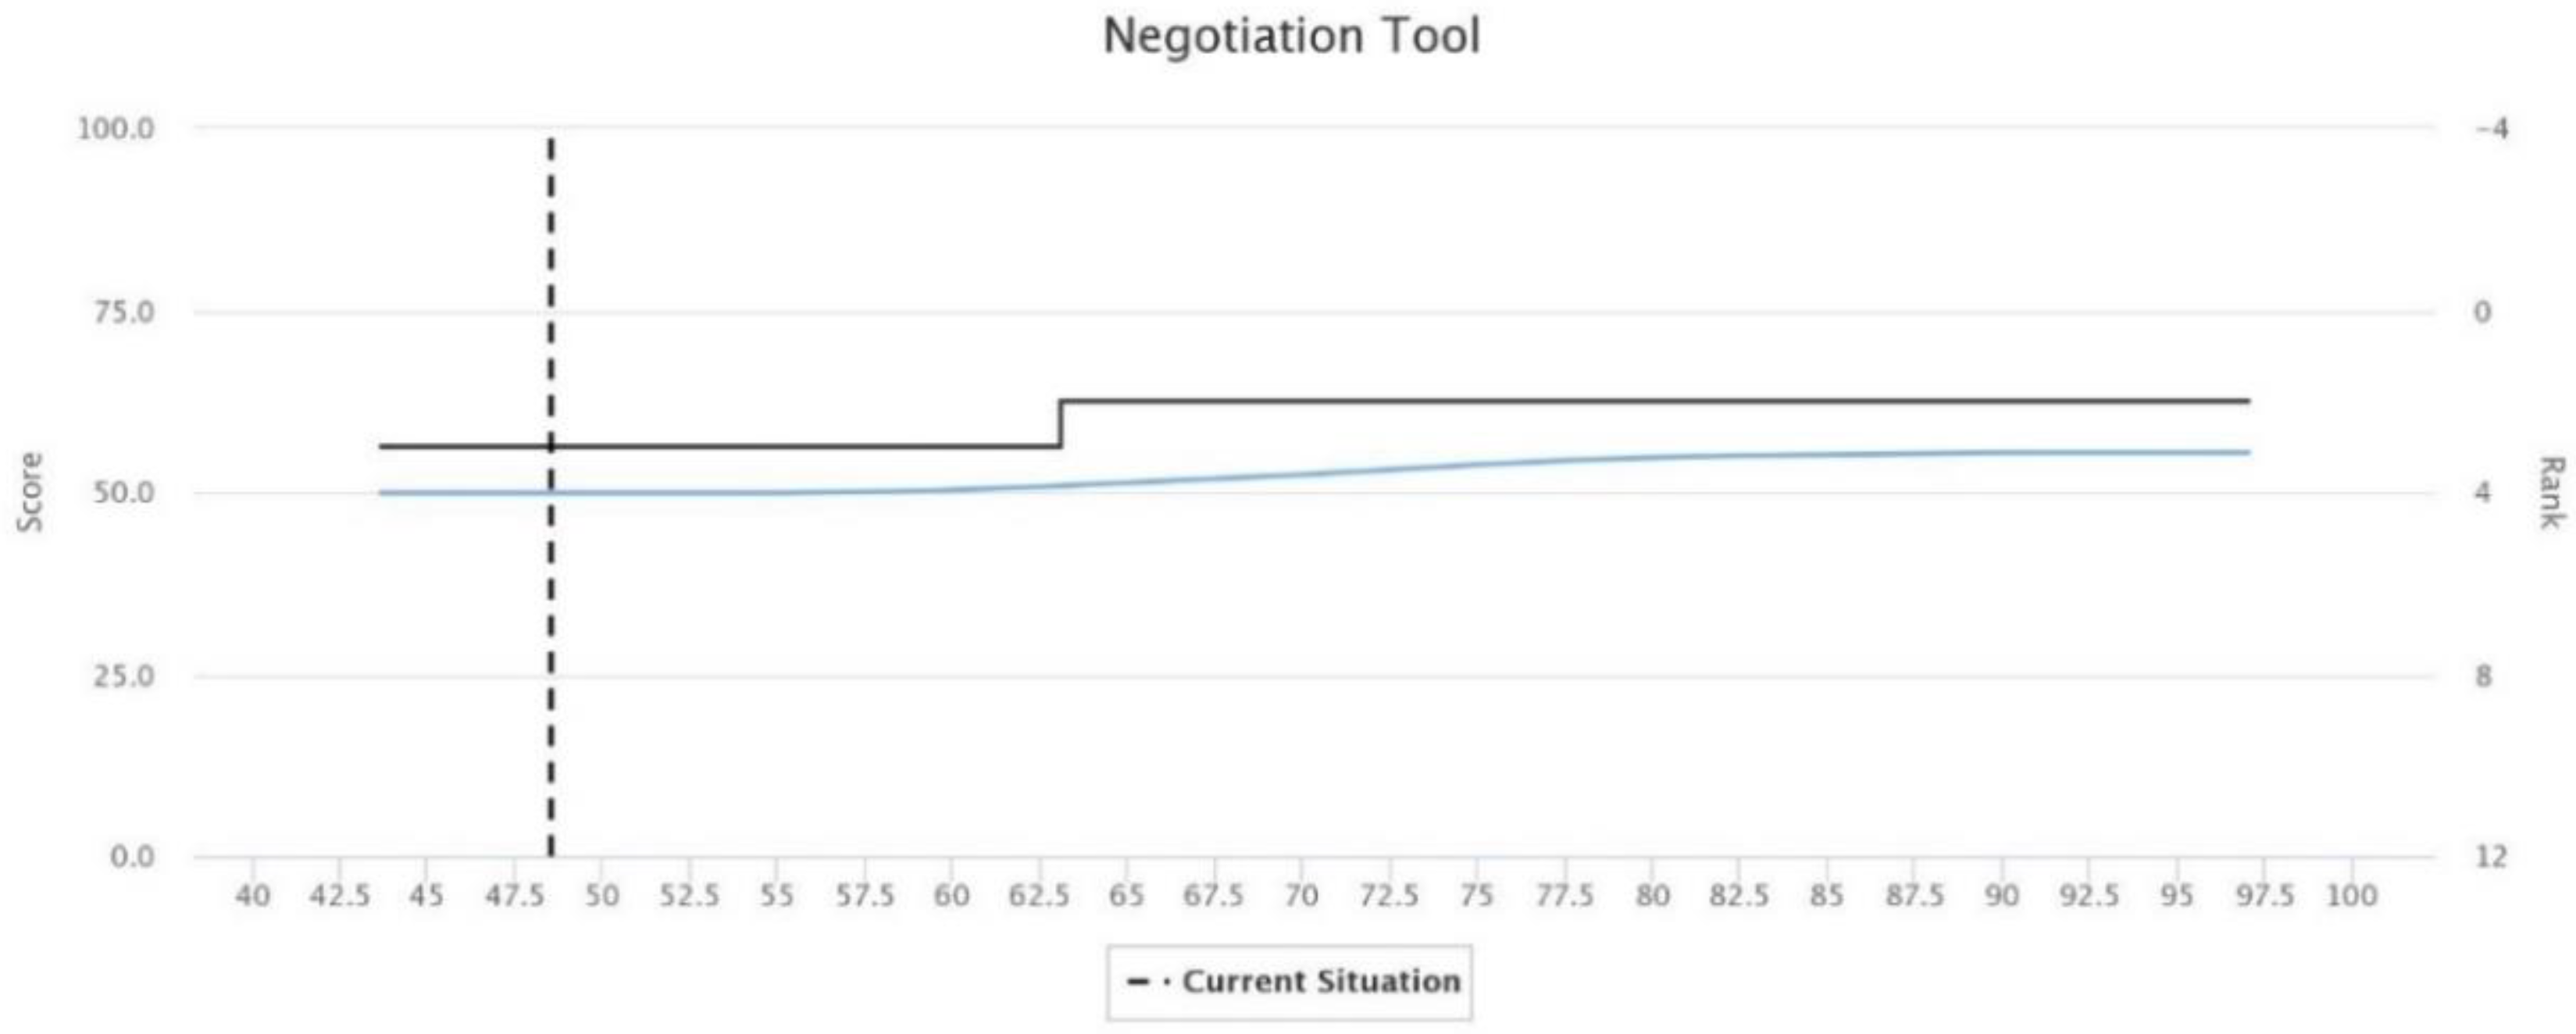
After carrying out sensitivity analysis, with the weights of the product strategy increasing up to 60% and with the trading weight being 30%, the ranking of suppliers is stable. Nevertheless,
S3 is in second place and only provides one organic fruit, while
S6 which contributes three products is in third place. More detailed analysis provides insights about the changes required to rank S
6 in second position, as shown in
Figure 17. It is necessary to improve its performance in service capability from 48.5% at least up to 63%.
5.2. Supplier Evaluation by FlowSort
Although PROMETHEE has excellent capabilities to select, rank and classify suppliers, the analysis can be enriched by a sorting approach in order to generate ordered groups of suppliers. The FlowSort method has been applied to classify the suppliers in ordered categories [
32], in particular, excellent, good, acceptable and bad. The limiting profiles for these categories are available in
Appendix B,
Table A2.
Applying FlowSort with the categories defined by limiting profiles, the set of suppliers is assigned as follows:
S4 is an excellent supplier,
S3 and
S6 are good, while
S1,
S2 and
S5 are acceptable. In addition, the set of suppliers is compared to the reference profiles by PROMETHEE, whose results are shown in
Figure 18. This modified version of FlowSort generates the same distribution of suppliers into the established categories, as apparent in
Figure 18. Comparing the ranking from
Figure 13 and
Figure 18, the position is the same for all suppliers, except
S1 and
S5, which are the last ones. Nevertheless, both are included in the same group of suppliers. In addition, no supplier better than another is assigned to a worse group.
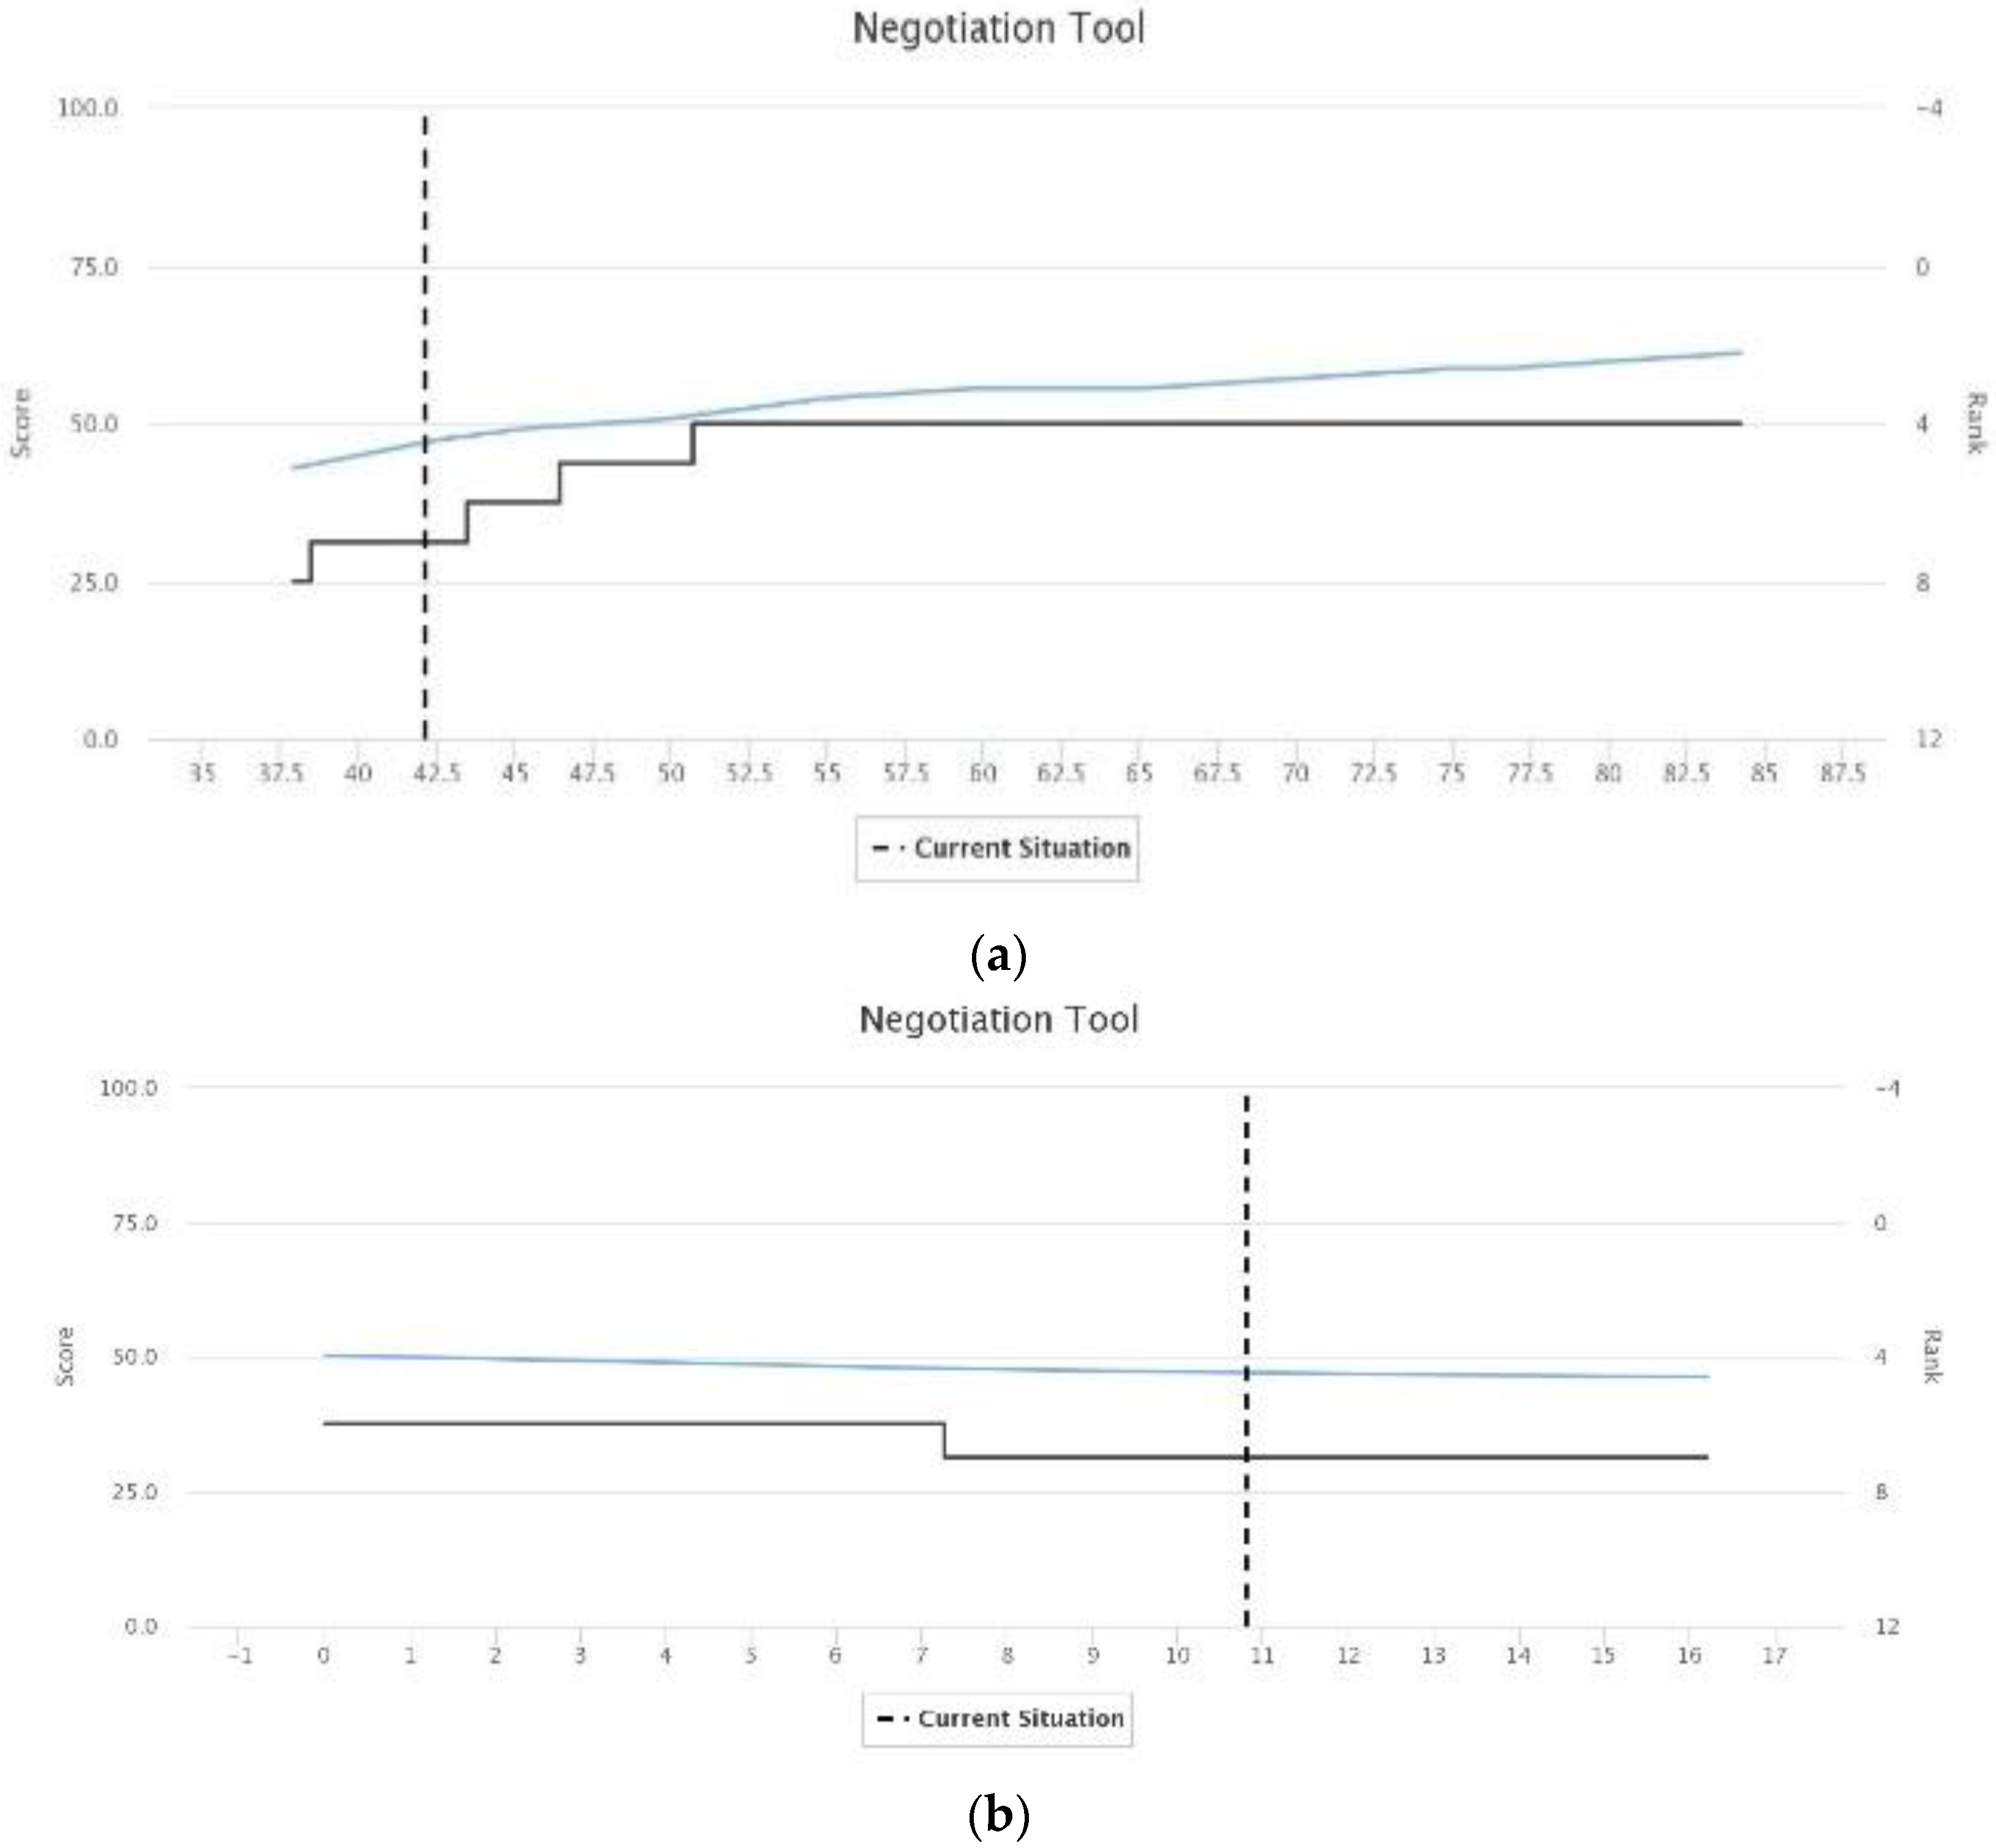
When the global scores of suppliers are close, but they are assigned to different groups as
S2,
S3 and
S6, it is advisable to carry out a sensitivity analysis and/or use the negotiation tool provided by D-Sight software. The product evaluation score for supplier
S2 is 42.1, it is ranked seventh and assigned to the group of acceptable suppliers. Nevetheless,
Figure 19a highlights that for a small increase up to 43.4,
S2 will rank sixth and be considered a good supplier. As its performance in product evaluation improves, the position of S
2 in the ranking is better. A similar situation appears in
Figure 19b, when the stockout percentage decreases, as this criterion is minimised.
6. Discussion
The multicriteria methodology to evaluate the proposed suppliers advances the research line introduced in [
26], representing an extension and an adaptation of that introduced by the authors. It is an extension because this work contributes the sorting of suppliers, in addition to ranking and classifying them. It is an adaptation, as the model for the food industry that makes products for other industries, without final consumers as customers, is not appropriate for food distribution companies, such as supermarket chains.
This work also broadens the scope of [
15] from several dimensions. First, work products are only assessed by the quality indicator in the logistic platform, while the present research also includes in-store consumer evaluation, applying MAUT in both studies because the quality of a product only depends on its specifications. In addition, this proposal adds two strategic criteria, purchase volume and origin, in order to complete the product evaluation. Secondly, the previous work considered a single product with several suppliers, while in this research, the model is applied to eight organic fruits with several suppliers, which are ranked and classified by PROMETHEE, but also sorted using the Nemery and Lamboray method [
32] and a new variant based on concepts from PROMETHEE and FlowSort. The decision hierarchy has also been extended by new criteria elicited through a survey to managers with expert knowledge in all key departments involved, such as green image and corporate social responsibility. In addition, criteria have been better organised into main categories and subcategories to improve the usefulness of the analysis.
To the best of our knowledge, there is only one other research work, in addition to [
15], that applies multicriteria methodology to evaluate suppliers for fresh food. In [
33], authors applied a hybrid procedure based on fuzzy AHP to weight the assessment criteria, ELECTRE to qualify suppliers according to food safety and TOPSIS to rank suitable suppliers. In addition to methods, there are other important differences between both works starting from the objective of research. In [
33], the purpose was to identify and manage the best suppliers, which present sufficient food safety. A panel with three managers from the purchasing department is involved in choosing the evaluation criteria, while in this research, 14 managers from purchasing, quality and logistics took part. In [
33], one main criterion is supplier relationship, while in this research, relations with suppliers depend on the evaluation results. Another difference is that there is no specific focus on sustainability to guide the supplier evaluation in [
33].
Both studies develop a hybrid model, which integrates three multicriteria methods: Fuzzy AHP, ELECTRE and TOPSIS in [
33]. This research integrates MAUT to assess product quality, while PROMETHEE and FlowSort are applied to product and supplier evaluation. Although consensus among departments is advisable, AHP is also applicable when there are difficulties in practice to achieve an understanding of the importance of criteria, as proposed in [
15,
26]. A well-known procedure is as follows: Each manager involved completes AHP pair comparison matrices, from which consensus matrices are calculated by the geometric mean [
41,
42,
43,
44].
Both cases use a noncompensatory approach (ELECTRE and PROMETHEE) and validate the model with real data in a supermarket chain. The number of suppliers is similar in these studies. Nevertheless, in [
33], there is no information about the products included and how their conformance to specifications is determined, as well as the way to quantify the performance of suppliers in the large number of subcriteria, such as traceability or compliance with international human rights among many others. In total, they establish ten main criteria: Product, price, food safety, quality, delivery, commercial position, serviceability, risk factors, supplier relationship and corporate social responsibility. All of them are disaggregated into several subcriteria with a total of 63. The authors refer to three data sources: Supplier management system, corporate survey database and external databases, without any detailed information. Although ELECTRE is an adequate approach to qualify suppliers by a noncompensatory method, a practical procedure in many companies is to require at least one food safety certification or HACCP implemented. Then, these certifications can be assessed together with other criteria, such as traceability.
TOPSIS is a classical multicriteria method, which has good properties and does not need additional information about preferences as PROMETHEE does. Nevertheless, TOPSIS is a compensatory method, in which the best alternative is identified by the shortest geometric distance to the positive ideal solution and the longest distance to the negative ideal solution. These concepts are not easy to identify and understand in real contexts for supplier evaluation. In addition, the visualisation of the results from the PROMETHEE analysis, such as profiles from the net flows matrix, GAIA plane and negotiation tool, represents an advantage of PROMETHEE compared to TOPSIS [
39,
40].
In [
33], the authors do not carry out product evaluation. Product quality is integrated as one indicator into supplier evaluation. By contrast, the model proposed in this research evaluates the quality and other strategic criteria for each food. Thus, it allows us to generate a ranking of suppliers by product, as well as classifying and sorting suppliers to establish and better manage relationships with providers according to the global and partial evaluations. Another study has applied the TOPSIS method to the food supply chain, focusing on the performance of companies processing and distributing pork meat in Colombia [
44].
Finally, the lack of sorting methods proposed and validated in real problems can be confirmed, as well as in food distribution companies and the service sector. A key issue for discussion is the credibility of models in decision making. Quantitative data have to be available or easy to obtain and must be reliable. In the case of qualitative data, a transparent procedure to include them into the model is needed. Thus, the models with many criteria based only on rating suppliers by managers are not suitable for decision making. Models integrated into decision support systems supported by company databases are desirable for the future in order to improve management of sustainable supply chains.
7. Conclusions
Today, the relevance of the sustainable production of food is unquestionable, as well as the role of the distribution companies that carry food to consumers, especially fresh products. A review of the literature highlights the lack of research into proposing and validating methodologies that improve this important area of the supply chain, in the same way as manufacturing industries have done. The complexity of supplier evaluation in the food distribution chain is due to many reasons, related to market and consumer preferences. The high number of different products and suppliers, risks linked to food safety, seasonality, countries of origin, the importance of different aspects in consumer performance, among others, make it advisable to balance all of them by using multicriteria approaches.
This research contributes a hybrid model that takes advantage of real data generated in this business activity for product criteria in the first step, whose results are used in the second step in addition to other specific criteria of suppliers. This procedure allows us to identify the most appropriate suppliers for each food in order to create a portfolio that minimises risks and identifies areas to improve. This model is based on MAUT for quality assessment and PROMETHEE for complete evaluation of products. PROMETHEE is also the base to rank and classify suppliers, which are also organised in ordered groups by FlowSort approaches. The capabilities for ranking, classifying and sorting suppliers of these noncompensatory methods based on PROMETHEE make them especially useful for improving food supply chain sustainability in comparison to other compensatory approaches, such as MAUT [
15,
26] and TOPSIS [
33]. In addition, the graphic capabilities of the results generated in the analysis by PROMETHEE through profiles of the suppliers, GAIA plane and negotiation tool represent another strength of this method [
15,
26,
40].
It is important to highlight that this research contributes to the application of sorting methods and validation of the model proposed with real data on organic fruits from a supermarket chain in line with the recommendations for future research in [
5]. This model can be the base of a decision support system for assessing and monitoring suppliers in supermarket chains systematically. This would contribute to increasing the food supply chain efficiency and the provision of safer and more affordable food to society. Future research can adapt the model to other fruits and vegetables, as well as fresh meat and fish. Finally, it is also interesting to advance the sorting algorithms for supplier evaluation that are validated in practical business contexts.


