Article

Prediction of Important Factors for Bleeding in Liver Cirrhosis Disease Using Ensemble Data Mining Approach

by
Aleksandar Aleksić
1,
Slobodan Nedeljković
2,
Mihailo Jovanović
3,
Miloš Ranđelović
4,
Marko Vuković
5,
Vladica Stojanović
6,
Radovan Radovanović
7,
Milan Ranđelović
8 and
Dragan Ranđelović
1,*
1
Faculty of Diplomacy and Security, University Union-Nikola Tesla Belgrade, 11000 Beograd, Serbia
2
Ministry of Interior, Government of the Republic of Serbia, 11000 Beograd, Serbia
3
Office for Information Technologies and e-Government, Government of the Republic of Serbia, 11000 Beograd, Serbia
4
Magna Seating D.O.O., 25250 Odžaci, Serbia
5
Public Utillity Company for Underground Exploatation of Coal Resavica, 11000 Beograd, Serbia
6
Department of Information Technology, University of Criminal Investigation and Police Studies, 11000 Beograd, Serbia
7
Department of Forensic Engineering, University of Criminal Investigation and Police Studies, 11000 Beograd, Serbia
8
Science Technology Park Niš, 18000 Niš, Serbia
*
Author to whom correspondence should be addressed.
Mathematics 2020, 8(11), 1887; https://doi.org/10.3390/math8111887
Submission received: 17 September 2020 / Revised: 9 October 2020 / Accepted: 13 October 2020 / Published: 30 October 2020
(This article belongs to the Special Issue Dynamics under Uncertainty: Modeling Simulation and Complexity)

Abstract

:
The main motivation to conduct the study presented in this paper was the fact that due to the development of improved solutions for prediction risk of bleeding and thus a faster and more accurate diagnosis of complications in cirrhotic patients, mortality of cirrhosis patients caused by bleeding of varices fell at the turn in the 21th century. Due to this fact, an additional research in this field is needed. The objective of this paper is to develop one prediction model that determines most important factors for bleeding in liver cirrhosis, which is useful for diagnosis and future treatment of patients. To achieve this goal, authors proposed one ensemble data mining methodology, as the most modern in the field of prediction, for integrating on one new way the two most commonly used techniques in prediction, classification with precede attribute number reduction and multiple logistic regression for calibration. Method was evaluated in the study, which analyzed the occurrence of variceal bleeding for 96 patients from the Clinical Center of Nis, Serbia, using 29 data from clinical to the color Doppler. Obtained results showed that proposed method with such big number and different types of data demonstrates better characteristics than individual technique integrated into it.

1. Introduction

Determination of relevant predictors in many fields of human life is important research challenge, including medicine. Research described in this paper is motivated from the fact that from one side, the liver disease causes about 3.5% of all deaths, which is a big number from approximately two million deaths per year worldwide, and that bleeding of varices is most common complication for successful treatment of liver cirrhosis [1]. On the other side, fact that the development of improved computer solutions for prediction of factors of bleeding, at the beginning of the 21th century, enables significantly more comprehensive, accurate, and fast diagnosis. Namely, the best way to determine esophageal varices is through gastrointestinal endoscopy. Since less than 50% of cirrhotic patients have varices and endoscopy is a nonconforming intervention, this way, a noninvasive methodology for predicting patients with the highest risk of bleeding and then applying endoscopy is the right choice [2]. In that way, good prediction indirectly reduces mortality of cirrhosis patients caused by bleeding of varices, so that further researches in this area impose itself as a serious challenge [3].
Basic idea of authors in research proposed in this paper was to apply concept of the classification algorithm, as one of a group of machine learning algorithms, so that a two-class classifier classifies the results into two classes, which is in each classification procedure completely defined with suitable 2 × 2 confusion matrix that content number of a true and false positive classification attempts and true and false negative classification attempts and could be applied in prediction of significant factors for bleeding in liver cirrhosis. Namely, concepts of diagnostic sensitivity and specificities are commonly used in the field of laboratory medicine [4]. Diagnostic test results are classified as positive or negative, where positive results imply the possibility of illness, whereas negative results indicate higher probability of absence of the illness. However, most of these tests are conducted by the instruments with high but not perfect accuracy, thus introducing certain errors in the diagnosis results and causing false positive and false negative results. Diagnosis sensitivity that is also known as true positive rate represents the possibility to detect ill patients actually, and it is defined as the number of true positive over the total number of ill patients, including the true positive and false negative patients. Hence, proper detection should discover patients with positive results within ill patients. On the other hand, specificity that is also known as a true negative rate represents possibility to detect healthy patients, and it is defined as the number of true negative patients over the total number of healthy patients, including the true negative and false positive ones. Thus, proper determination should also provide negative result for healthy patients. Assuming that determination provides only positive result, then the sensitivity will be 100%, but in that case, healthy patients would be falsely identified as ill [5]. In theory of statistic, experiments can be used to affirm hypotheses on differences and relationship between two or more groups of variables, and such experiments are called tests, or they can be used to determine influence of variables on dependent variable(s), such multifactor experiments are called valuations, [6] and such one is applied in the presented case study in this paper. Data mining approach, where belongs classification methodology, has been widely used in different fields of human life, such as economics [7], justice [8], medicine [9], etc. Data mining has also been applied for solving various problems, especially in diagnosis in medicine [10] and in the field of diagnosis of liver cirrhosis as in [11]. Bioinformatics and data mining have been the research hot topics in the computational science field [12,13,14,15,16]. Data mining is generally a two stage methodology that in the first stage involves the collection and management of a large amounts of data, which in second stage is used to determine patterns and relationships in collected data using machine learning algorithms. [17,18,19,20].
It is known that esophagus bleeding is not only the most frequent but also the most severe complication in cirrhotic patients that directly threatens patient’s life [21,22,23,24]. Because of this fact, the main objective of this paper is to analyze as many factors as possible, which cause this bleeding, and specifically in this study, we have determined 29 factors, which belong to different types of data, from clinical and biochemical view, obtained via endoscopic and ultrasound data to the color Doppler data. In this way, we aimed to be as comprehensive as possible and determine and rank these factors as risk indicators of varices bleeding. Consequently, due to high mortality ratio caused by bleeding of varices, considering the bleeding risk assessment is crucial for proper therapy admission. The case study, we included 96 cirrhotic patients from the Clinical Center of Nis, Serbia. This mentioned study studied risks of initial varices in cirrhosis patients, as well as risks of early and late bleeding reoccurrence. As the main result of this study, authors proposed model which predicts the assessment of the significance of the individual parameters for variceal bleeding and survival probability of cirrhotic patients, which is in addition to the above adequate therapy very important and for determination of patient priority on the liver transplant waiting lists. Namely, in literature and practice connected with the problem of bleeding in liver cirrhosis, we can find research gap between request that for considering this problem, it is necessary to include more different types of parameters and, e.g., uncomfortable endoscopy, which, in turn, may be cost ineffective because less than 50% of a cirrhosis patients are with varices, from the medical standpoint from one side [25]. From the other mathematical side, we have the research gap between the need to include as many factors as possible in the consideration of bleeding problems in liver cirrhosis, which, in turn, cause the undesirable occurrence of noise in the data and, consequently, the need to reduce their number provided that the accuracy of the prediction is maintained [26]. Due to this fact, it is becoming more common request for using more noninvasive factors as possible, which is commonly solved using data mining technique. We can find more articles that deals with using different techniques of data mining for determination of risk indicators in different complications in disease liver cirrhosis [27,28,29] and risk for variceal bleeding as in [30,31]. Because two main methodologies of data mining approach are used in this paper, data mining classification technique with feature selection and logistic regression for prediction of variceal bleeding in cirrhotic patients, it is necessary to present the state of the art closely observed on the subject methodology, which solves the considered problem. This enabled authors to produce one new ensemble data mining model whose validity is proven by the results obtained in the case study. In literature, we find few papers that deals with machine learning approaches, which studied general complications in liver cirrhosis disease as, e.g., in [32,33], also on prediction of esophageal varices [34,35,36,37,38], and we found different forms of their integration but we did not find integration that we propose in this paper.
Authors as the subject of the paper set the answer to the research question, i.e., proof of the hypothesis, that it is possible to integrate classification method with attribute reduction also and regression into one ensemble method, which has better characteristics than each of them individually applied. To confirm the hypothesis and answer the research question, the authors used the results obtained with application of their novel proposed model in the case study described in previous paragraph of this section.
The remaining of this paper is organized as follows. After Section 1 Introduction, which after short explanation of motivation for authors to work on this paper, describes in four paragraphs the concept, objectives and existing research gap, contribution, and the organization of the paper and gives author’s review of world literature which deal with bleeding problems in liver cirrhosis as well as with application of classification and logistic regression in prediction models, the other sections continues. Next, Section 2 Materials and Methods is part of paper that presents the background, which enables solving of the considered problem to be solved in this paper, introducing the methodology adopted in the proposed solution. In Section 3 Results are presented results obtained with proposed new methodology at concrete case study performed in the Clinical Center of Nis, Serbia. In Section 4 Discussion, authors discuss possibilities of theirs proposed approach and especially to clinical interpretation of the results, and in the end of this paper are conclusion remarks in Section 5 Conclusions.

2. Materials and Methods

2.1. Materials

2.1.1. Determination of Relevant Predictors of Bleeding Problems

The aim of this paper is to apply the integrated data mining methodology to the prediction on risk indicators of bleeding of varices using comprehensive analyze of different types of the clinical, biochemical, endoscopic, ultrasound, and color Doppler data [36]. As mentioned previously, the study included 96 cirrhotic patients. In order to conduct the case study more efficiently, two groups of patients were formed according to whether they previously had bleeding. The group of patients with episodes of bleeding of varices was divided into two subgroups, namely, patients with and without endoscopic sclerosis of esophagus varicosity. Clinical and biochemical parameters (Child–Pugh and MELD score) were analyzed along with endoscopic parameters (size, localization, and varicosity appearance) and ultrasound and color Doppler parameters. So big number of 29 considered factors in which 5 different type of parameters are used, because of the high mortality rate due to bleeding of varices, it is necessary to have precise risk assessment of bleeding for timely implementation of therapeutic interventions and also to assess precise prognosis and survival rate of patients with cirrhosis, which is important for appropriate therapy of patients and good patient prioritization on the waiting list for liver transplantation.
Benedeto-Stojanov et al. in [37] considered the bleeding problem in cirrhotic patients with the aim to evaluate the survival prognosis of patients with liver cirrhosis using the Model of End-stage Liver Disease (MELD) and Child–Pugh scores and to analyze the MELD score prognostic value in patients with both the liver cirrhosis and the bleeding of varices. Benedeto-Stojanov et al. studied in [38] the bleeding of varices as the most common life-threating complication of a cirrhotic patient with the aim to analyze the sources of gastroesophageal bleeding in cirrhotic patients and to identify the risk factors of bleeding from esophageal varices. Durand and Valla in [39] introduced a MELD score that was originally designed for assessing the prognosis of cirrhotic patients that underwent the transjugular intrahepatic portosystemic shunt (TIPS) and defined it as a continuous score relying on three objective variables. In the case of TIPS, MELD score has been proven as a robust marker of early mortality across a wide spectrum of causes of cirrhosis, but even though, 10–20% of patients have been still misclassified. In [40], authors described their developed Rockall risk scoring system for predicting the outcome of upper gastrointestinal (GI) bleeding, including bleeding of varices with the aim to investigate the mortality rate of first bleeding of varices and the predictability of each scoring system. Kleber and Sauerbruch studied in [41] the hemodynamic and endoscopic parameters as well as liver function and coagulation status and patient’s history regarding the bleeding incidence. The following parameters were found to be correlated with an increased risk of bleeding: the first year after diagnosis of varices, positive history of bleeding of varices, presence of varices with large diameters, high blood pressure or a red color sign, concomitant gastric varices or development of a liver cell carcinoma. Authors concluded in [42] that using MELD score-based allocation, many current transplant recipients have shown advanced end-stage liver disease with an elevated international normalized ratio (INR).
The relationship between abnormalities in coagulation tests and the risk of bleeding has recently been investigated in patients with liver disease. In [32], we can notice that risk factors for mortality and rebleeding following acute variceal hemorrhage (AVH) were not well enough and completely established, and they tried to determine risk factors for emergence of mortality in 6-week and rebleeding within 5 days in cirrhotic patients and AVH.

2.1.2. Methods of Aggregation in Classification and Prediction Models

Boosting as an ensemble algorithm is one of the most important recent technique in classification methodology. Boosting sequentially applies classification algorithm to readjust the training data and then takes a weighted majority of the votes of a series of classifiers. Even being simple, this strategy improves performances of many classification algorithms significantly. For a two-class problem, boosting can be viewed as an approximation to additive modeling on the logistic scale using the maximum Bernoulli likelihood as a criterion [43]. Over the past few years, boosting technique has appeared as one of the most powerful methods for predictive analytics. Some implementations of powerful boosting algorithms [44] can be used for solving the regression and classification problems, using continuous and/or categorical predictors [45,46]. Finally, using predictive analytics with gradient boosting in clinical medicine is discussed in [47].
We can find a different kind of mentioned ensemble algorithm in prediction of most important factors using other methodologies as well as aggregation methods in decision-making problem, e.g., [48,49].
In computer science, e.g., a logistic model tree (LMT) represents a classification model which has an associated supervised training algorithm in which logistic regression and decision tree learning are combined [50].

2.2. Methods

2.2.1. Classification Method for Relevant Predictor Determination

Classification is frequently studied methodology in field of machine learning. Classification algorithm, as a predictive method, represents a supervised machine learning technique and implies the existence of a group of labeled instances for each class of objects and predicts the value of a (categorical) attribute (i.e., class) based on the values of other attributes, which are called predicting attributes [51]. The algorithm tries to discover relationships between the attributes in order to achieve accurate prediction of the outcome. The prediction result depends on the input and discovered relationships between the attributes. Some of the most common classification methods are classification and decision trees (e.g., ID3, C4.5, CART, SPRINT, THAID, and CHAID), Bayesian classifiers (e.g., Naive Bayes and Bayes Net), artificial neural networks (Single-Layer Perceptron, Multilayer Perceptron, Radial Base Function Network, and Support Vector Machine), k-nearest neighbor classifier (K-NN), regression-based methods (e.g., Linear Regression and Simple Logistic), and classifiers based on association rules (e.g., RIPPER, CN2, Holte’s 1R, and C4.5) [52]). Selection of the most appropriate classification algorithm for a certain application is one of crucial points in data mining-based application and processes.
Consider a classifier that classifies the results into two classes, positive and negative. Then, the possible prediction results are as shown in Table 1.
It should be noted that in Table 1, TP + FN + FP + TN = N where N is the total number of members in the considered set to be classified. The matrix presented in Table 1 is called a 2 × 2 confusion matrix. As presented in Table 1, there are four results, true positive (TP), false positive (FP), true negative (TN), and false negative (FN). It is important to notice that these numbers are counts, i.e., integers, not ratios, i.e., fractions. Based on the possible results that are presented in Table 1, for a two-class classifier, the accuracy, precision, recall, and F1 measure can be, respectively, calculated as:
A c c u r a c y = ( T P + T N ) / N
P r e c i s i o n = T P / ( T P + F P )
R e c a l l ( S e n s i t i v i t y ) = T P / ( T P + F N )
S p e c i f i c i t y = T N / ( T N + F P ) .
Method based on the Receiver Operating Characteristic (ROC) curves are widely used in evaluation of prediction performance of a classifier. These represent on the OX axe, the rate of false positive cases and on the OY axe, the rate of true positive cases [53].
The ROCs of five classifiers denoted as A–E are displayed in Figure 1. A discrete classier output only a class label. Also, a discrete classier produces an (FP_Rate and TP_Rate) pair, which corresponds to a single point in the ROC space, where FP_Rate represents false positive rate and TP_Rate represents true positive rate. A binary classifier is represented by a point on the graph (FP_Rate and TP_Rate), as follows [54]:
  • Point (0,1) of the ROC plot represents perfect, ideal prediction, where the samples are classified correctly as positive or negative;
  • Point (1,1) represents a classifier that classifies all cases as positive;
  • Point (1,0) represents a classifier that classifies all samples incorrectly.
Generally, in the ROC space, a point is classified more accurately when its true positive rate is higher and false positive rate is lower. In the ROC graph, classifiers appearing on the left-hand side of the ROC graph, which are near the y-axis, are considered as conservative. Namely, these classifiers make positive classifications only based on a strong evidence, so there can be only a few false positive errors, but there is also a low true positive rate as well. On the other hand, classifiers on the upper right-hand side of the ROC graph are considered as liberal. These classifiers make positive classifications based on weak evidence, so they classify almost all positives correctly, but they often have high false positive rate. For instance, in Figure 1, classifier A is more conservative than classifier B.
Decision trees or rule sets only make a decision on one of two classes a sample belong to in the case considered in this paper. When a discrete classifier is applied to a sample set, it yields to a single confusion matrix, which in turn corresponds to one ROC point. Thus, a discrete classifier produces only a single point in ROC space. On the other hand, the output of Naive Bayes classifier or neural networks is a probability or a score, i.e., a numeric value that represents the degree to which a particular instance is a member of a certain class [55].
Many classifiers scan yield to incorrect results. For instance, logistic regression provides approximately well-calibrated probabilities; in the Support Vector Machine (SVM) and similar methods, the outputs have to be converted into reasonable probabilities; regression analysis establishes a relationship between a dependent or outcome variable and a set of predictors. Namely, regression, as a data mining technique, belongs to supervised learning. Supervised learning partitions data into training and validation data sets, so regression model is constructed using only a part of the original data, that is, training data.
The classification performance of a classifier can be evaluated using:
  • a user-defined data set,
  • the n-fold cross validation division of the input data set,
  • division of the input data set into the training and test sets.
The data are divided into two sets, training set and test set. The training set is used to train a selected classification algorithm, and test set is used to test the trained algorithm. If the classifier classifies most instances in the training set correctly, it is considered that it can classify correctly some other data as well. However, if many samples are incorrectly classified, it is considered that the trained model is unreliable. In addition to training and testing as a common approach to efficient use, model validation is most often used [56] to:
-
select the best model from multiple candidates
-
determine the optimal configuration of model parameters
-
avoid over- or underfitting problems.
In summary, the classification model is defined by its true positive rate, false positive rate, precision, F1 measure, and confusion matrix, which represent basic parameters of precision evaluation of the implemented classifier.

2.2.2. Calibration Method

Calibration is applicable in the case a classifier output is the probability value. Calibration refers to the adjustment of the posterior probability output by a classification algorithm towards the true prior probability distribution of target classes. In many studies [57,58,59], machine learning and statistical models were calibrated to predict that for every given data row the probability that the outcome is 1. In classification, calibration is used to transform classifier scores into class membership probabilities [11,60]. The univariate calibration methods, such as logistic regression, exist for transforming classifier scores into class membership probabilities in the two-class case [61]. Logistic regression represents a statistical method for analyzing a dataset including one or more independent variables that determine an outcome, which is measured with a dichotomous variable, where there are only two possible outcomes, i.e., it contains only the data coded as 1, which is positive result (TRUE, success, pregnant, etc.), or 0, which is negative result (FALSE, failure, nonpregnant, etc.).
Logistic regression generates the coefficients, and the corresponding standard errors and significance levels, to predict a logit transformation of the probability of presence of a characteristic of interest, which can be expressed as:
l o g i t ( p ) = b 0 + b 1 X 1 + b 2 X 2 + b 3 X 3 + + b k X k ,
where p denotes the probability of presence of the characteristic of interest. The logit transformation is defined as the logged odds as follows:
o d d s = p 1 p = p r o b a b i l i t y   o f   p r e s e n c e   o f   c h a r a c t e r i s t i c s p r o b a b i l i t y   o f   a b s e n c e   o f   c h a r a c t e r i s t i c s
l o g i t ( p ) = l n ( p 1 p ) .
Logistic regression selects parameters that increase the probability of observing sample values, instead of selecting parameters that minimize the sum of square errors (as in ordinary regression). The regression coefficients are coefficients b0, b1, …, bk in the regression Equation (8). In the logistic regression, coefficients indicate the change (an increase when bi > 0, or a decrease when bi < 0) in the predicted logged odds of the characteristic of interest for a one-unit change in the independent variables. When the independent variables that are denoted as Xa and Xb in (8) are dichotomous variables (e.g., smoking and sex), then the influence of these variables on the dependent variable can be compared by matching their regression coefficients ba and bb. By applying the exponential function on the both sides of the regression Equations (7) and (5), considering Equation (6) as well, Equation (7) can be rewritten as the following equation:
o d d s = p 1 p = e b 0 × e b 1 x 1 × e b 2 x 2 × e b 3 x 3 × × e b k x k .
Thus, according to (8), when a variable Xi increases by one, while all other factors remain unchanged, then the odds will increase by a factor ebi, which is expressed as:
e b t ( 1 + x t ) e b t x t = e b t ( 1 + x t ) b t x t = e b t + b t x t b t x t = e b t .
The odds ratio (OR) of an independent variable Xi is notated as factor ebi, and it denotes a relative amount by which the odds of the outcome increase (OR greater than 1) or decrease (OR less than 1) when the value of the independent variable is increased by one.

2.2.3. Aggregation Method of Boosting using Classification and Calibration

Boosting as ensemble algorithm, which often uses more different supervised machine learning algorithms with minimum two from decision trees, classification and regression algorithm has become one of the most powerful and popular approaches in knowledge discovery and data mining field. It is commonly applied in science and technology when exploring large and complex data for discovering useful patterns is required, which allows different ways of modeling knowledge extraction from the large data sets [62].
In supervised learning, feature selection is most often viewed as a search problem in a space of feature subsets. In order to conduct our search, we must determine a starting point, a strategy for traversing trough the space of subsets, a function for evaluation, and a criterion to stop. This formulation allows that a variety of solutions can be developed, but usually two method types are considered, called filter methods and wrapper methods. Filter methods use an evaluation function that relies solely on data properties. Due to that fact, it is independent on any particular algorithm, and wrapper methods use inductive algorithm to estimate the value of a given subset. In our approach, there method types are combined: filter (information gain, gain ratio, and other four classifiers) and wrapper (search guided by the accuracy) [63].
As mentioned previously, the ROC analysis has been used in medicine, radiology, biometrics, and other areas for many decades, and recently, it has been increasingly used in machine learning and data mining research. In this study, the authors used the areas under the ROC curves to identify the classification accuracy of more classifiers, which is most important for proposed model to order the minimal number of attributes enough to give maximum value on the ROC curve [64].
In addition, most popular calibrating methods use isotonic regression to fit a piecewise-constant nondecreasing function. Isotonic regression is a useful nonparametric regression technique for fitting an increasing function to a given dataset. An its alternative is to use a parametric model and that most common model called univariate logistic regression. The model is defined as:
l = l o g ( p / ( 1 p ) ) = a + b f ,
where f denotes a prediction score and p denotes the corresponding estimated probability for predicted binary response variable y. Equation (10) shows that the logistic regression model is essentially a linear model with intercept a and coefficient b, so it can be rewritten as:
p = 1 1 + e ( a + b f ) .
Assume fi is prediction score on the training set, and let yi ∈″{0, 1} be the 2009 true label of the predicted variable. The parameters a and b are chosen to minimize the total sum i l ( p , y i ) .
For example, in paper [35], which deals with prediction of risk of bleeding of varices using 25 attributes, we can find one aggregation of six classification’s algorithms and six feature selection classifiers and that three from wrapper and three from filter group proposes model, which gives best solution than each of aggregated methods individually.
In this paper, authors propose model which:
-
integrates classification (choosing the best of 5 selected)
-
uses attribute reduction (choose from 5 proposed classifiers the one that reaches the maximum ROC value with the least number of attributes)
-
than uses regression (which performs a fine calibration of the obtained results) as one boosting method, which has better characteristics and gives better results than any of those integrated into it, when they are individually applied. To confirm the hypothesis and answer the research question, the authors used the results provided by the case study described in Section 2.1 Material of this paper uses the procedure of obtaining significant bleeding predictors and setting great importance for further treatment and prevention of bleeding, which is summarized in Algorithm 1.
Algorithm 1: Procedure of obtaining significant predictors of bleeding in cirrhotic patients.
  • Determine an optimal classification algorithm with the highest value of ROC among enough number of minimum five algorithms, each from different class of classifiers, e.g., Naive Bayes, J48 Decision Trees, HyperPipes, Ada LogitBoost, and PART.
2.
Perform attribute ranking according to the informativeness of the attribute that provides information on the presence of a certain attribute in a particular class. Using enough number of classifiers for attribute selection we proposed minimum of five classifiers, i.e., chi-square attribute evaluation, gain-ratio attribute evaluation, information-gain attribute evaluation, relief attribute evaluation, and symmetrical uncertainty attribute evaluation, to determine the feature subset methods and determine the set of attribute ranks
R = {r1, r2, …, rn}, where n is the starting number of attributes.
3.
Compute a subset A′ = {a1, a2, …, am} of the starting set A = {a1, a2, …, an}, m < = n of attributes as the most “useful” amongst. The ROC value is obtained by the optimal classification algorithm determined in Step 1.
4.
Univariate logistic regression is used to calculate and the odds ratio for each attribute. Thus, a set of attributes with diverse distribution of attributes ranks is obtained OR = {or1, or2, …, ork}.
5.
Over acquired subset of attributes A’ = {a1, a2, …, am} in Step 3 with the set of attribute ranks R = {r1, r2, …, rn} acquired in Step 2 performs the attribute rank calibration. Attribute calibration is performed on the basis of OR = {or1, or2, …, ork} distribution of attribute influences acquired in Step 4.
The calibration process is given in Algorithm 2.
Algorithm 2: The pseudocode of the calibration process used most significant predictors of death income in cirrhotic patients part.
//Set the great importance for further treatment and prevention of bleeding for 15
predictive//variables
fori = 1 to (n − 1) inclusive do:
/* if odds ratio value pair is out of order */
if OR[i] > OR [i + 1] then
/* swap attributes in subset A′ and remember something changed */
swap (A[i], A[i + 1])
end if
end for
The ignored predictive variables are variables that have the accuracy less than 0.85%.

3. Results

The study from Benedeto-Stojanov and other coauthors in [36] involved 96 subjects, 76 (79.2%) male and 20 (20.8%) female participants. There were 55 patients without bleeding, of which 44 (80.0%) were male and 11 (20.0%) were female. The group of 41 patients with bleeding included 32 (78.0%) male and 9 (22.0%) female participants. The average age of all patients was (56.99 ± 11.46) years. The youngest and oldest patients were 14 and 80 years old, respectively.
The data used in the study were obtained by the Clinical Center of Nis, Serbia. The original feature vector of patient data consisted of 29 features that were predictive variables. As the thirtieth variable, there was a two-case class variable result (yes/no), which was considered as a dependent variable. All predictive variables and dependent variable are shown in Table 2, where it can be seen that they were of numerical data type.
In the case study, five classification algorithms were implemented, i.e., Naive Bayes, J48, Decision Trees, HyperPipes, Ada LogitBoost, and PART for designing prediction modes. Method of training set was applied in model for proposed classification algorithms where the authors chose the most famous from different groups of classifiers. This method was chosen and training set mode combined with test as well as 10-cross validation were not used because of a small number of instances in the case study.
The performance indicators of five classification algorithms are given in Table 3, where it can be seen that the LogitBoost classifier achieved the most accurate prediction results among all the models.
As presented in Table 3, the LogitBoost classifier achieved the F1 measure of 97.9%, accuracy of 98.0% (0.980), and the ROC of 0.999.
In Table 4, CCI denotes the number of correctly classified inputs, and ICI denotes the number of incorrectly classified inputs.
The LogitBoost classifier achieved a relatively good performance on classification tasks, due to the boosting algorithm [65]. Boosting process is based on the principle that finding many rough rules of thumb can be much easier than finding a single, highly accurate prediction rule. This classifier is a general method for accuracy improvement of learning algorithms. In the WEKA [66], LogitBoost classifier is implemented as class which performs additive logistic regression, which performed classification using a regression scheme as a base learner, and also can handle multiclass problems.
Feature selection is normally realized by searching the space of attribute subsets and evaluating each attribute. This is achieved by combining attribute subset evaluator with a search method. In this paper, five filter feature subset evaluation methods with a rank search or greedy search method were conducted to determine the best feature sets, and they are listed as follows:
(1)
Chi-square attribute evaluation (CH),
(2)
Gain-ratio attribute evaluation (GR),
(3)
Information-gain attribute evaluation (IG),
(4)
Relief attribute evaluation (RF) and
(5)
Symmetrical uncertainty attribute evaluation (SU).
The feature ranks obtained by the above five methods on the training data are presented in Table 5.
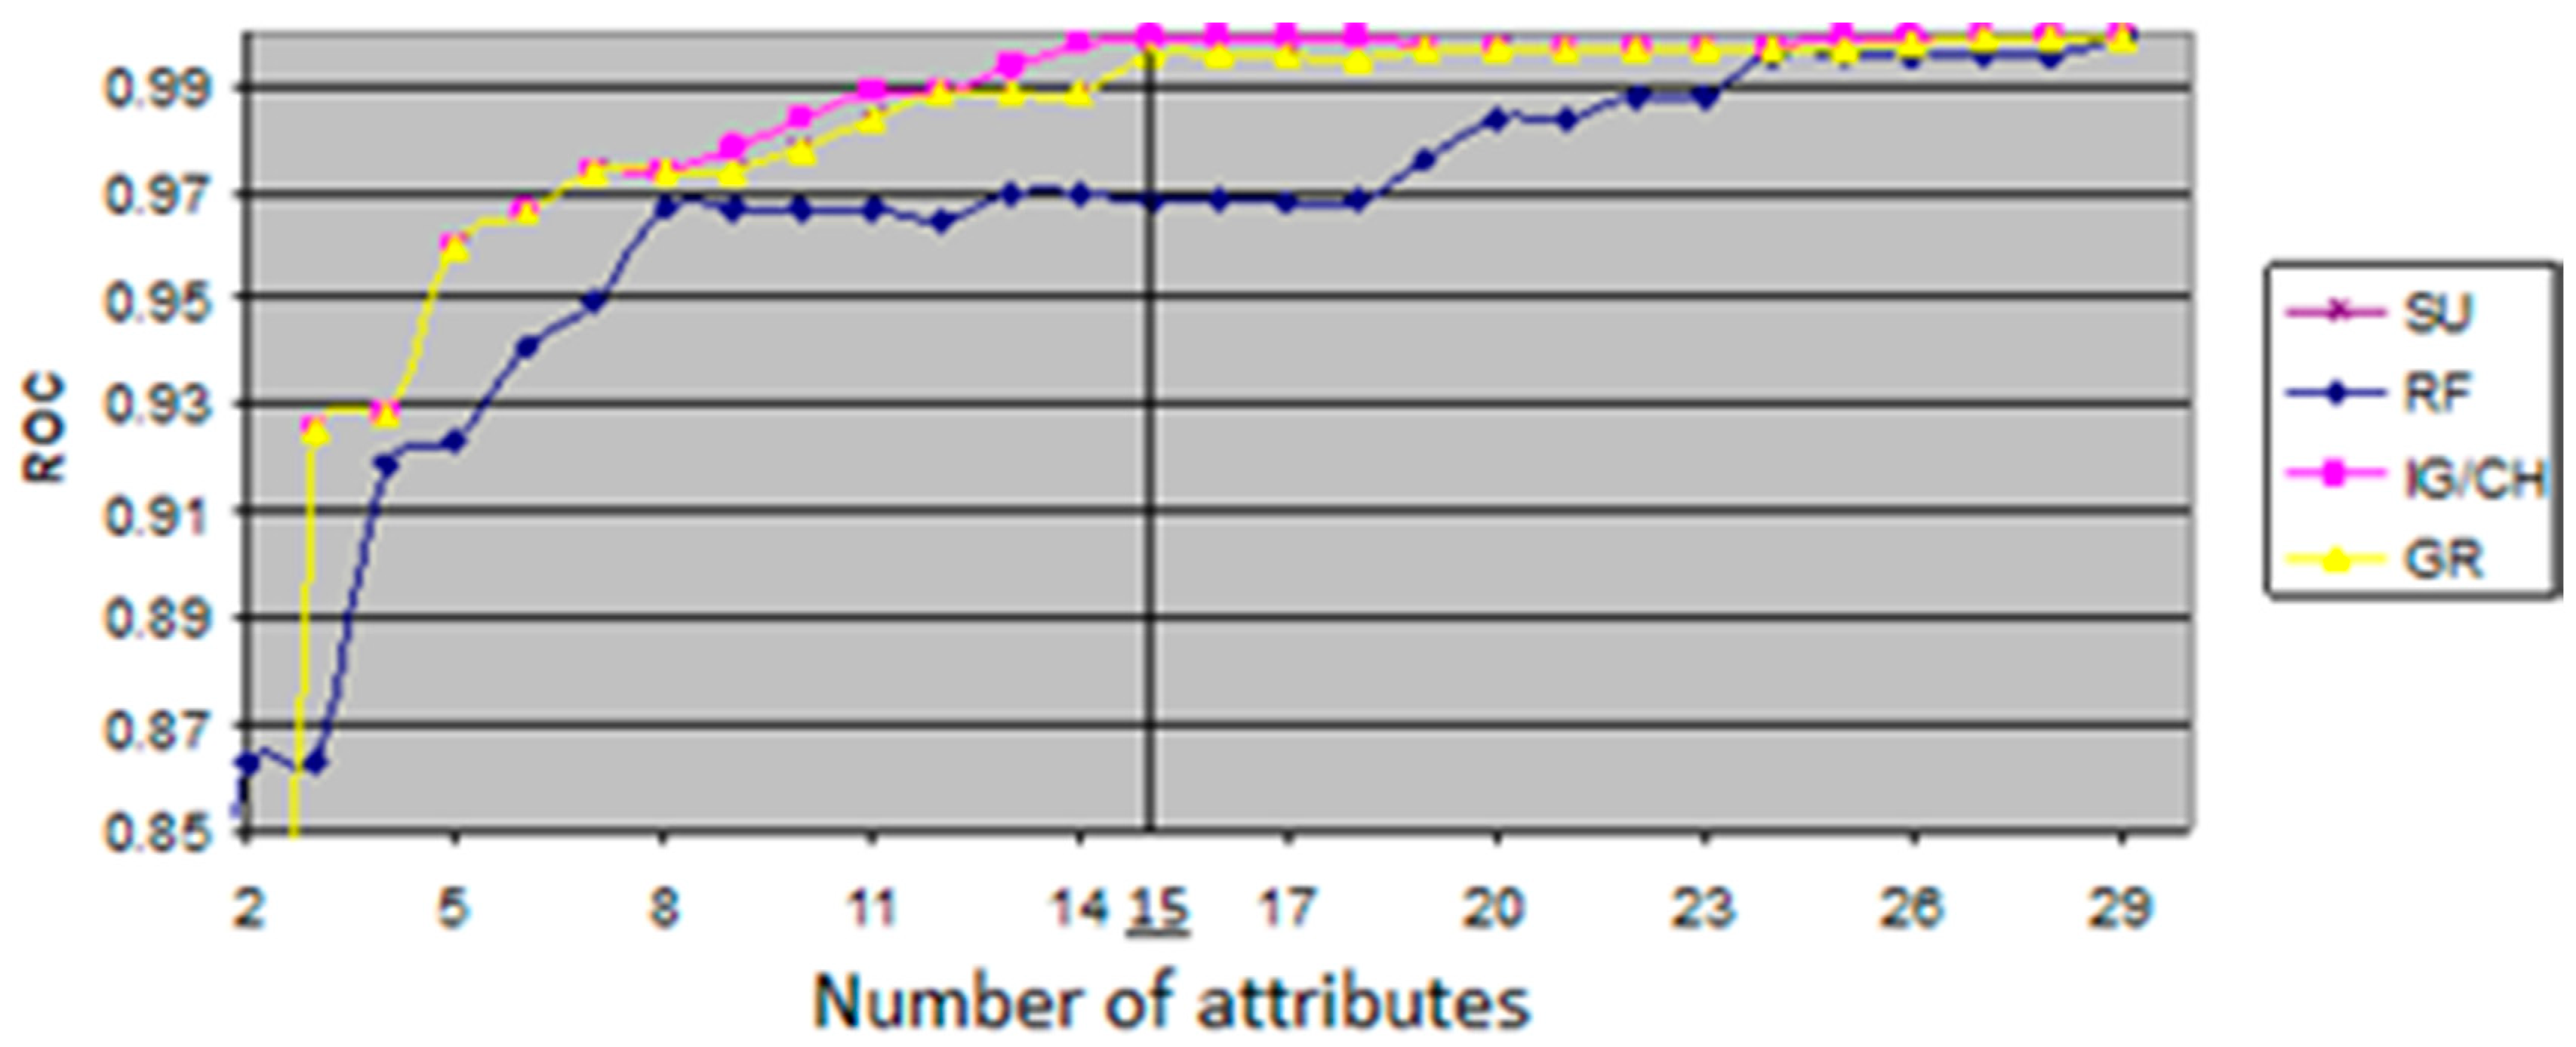
The ROC value shows relationship between sensitivity, which represents measure of the proportion of positives that are correctly identified TP, and specificity, which represents measure of the proportion of negative that are correctly identified, both in executed process of classification. The evaluation measures with variations of ROC values were generated from an open source data mining tool, WEKA, that offers a comprehensive set of state-of-the-art machine learning algorithms as well as set of autonomous feature selection and ranking methods. The generated evaluation measures are shown in Figure 2, where the x-axis represents the number of features, and the y-axis represents the ROC value of each feature subset generated by five filter classifiers. The maximum ROC value of all the algorithms and the corresponding cardinalities that are illustrated in Figure 2 are given numerically in Table 5. This is quite useful for finding an optimal size of the feature subsets with the highest ROC values. As given in Table 5, the highest ROC values were achieved by CH and IG classifiers. Although the CH and IG resulted in the ROC value of 0.999, the IG/CH could attain the maximum ROC value when the number of attributes reached the value of 15. Thus, it was concluded that IG has an optimal dimensionality in the dataset of patients.
The top ranking features in Table 5 that were obtained by CH and IG classifiers were used for further predictive analysis as significant predictors of bleeding, and they were as follows: (A15)—Red color signs, (A14)—large esophageal varices, (A17)—congestive gastropathy, (A7)—international normalized ratio, (A23)—collateral circulation, (A24)—flow speed in portal vein, (A9)—ascites, (A8)—creatinine, (A6)—prothrombin time, (A29)—MELD score, (A2)—age, (A5)—albumin, (A11)—platelet count/spleen diameter ratio, (A3)—etiology, and (A25)—flow speed in lienal vein.
This study analyzes risks of initial bleeding of varices in cirrhotic patients, and the risks of early and late bleeding reoccurrence. The obtained results are important for further treatment and prevention of bleeding from esophageal varices, the most common and life-threatening complications of cirrhosis. Coauthors in this manuscript, Randjelovic and Bogdanovic, still used the univariate logistic regression analysis to demonstrate the most significant predictors of bleeding. Results of this analysis obtained using same input data are given in Table 6 [67].
After conducting the experiment with the real medical data, important predictors of bleeding were determined by performing logistic regression analysis.
Univariate logistic regression analysis indicated the most significant predictors of bleeding in cirrhotic patients: the value of the Child–Pugh/Spleen Diameter ratio, platelet count, as well as the expression of large esophageal varices, red color signs, gastric varices, and congestive gastropathy collateral circulation. Approximate values were calculated relative risk (odds ratio—OR), and their 95% confidence intervals. The statistical significance was estimated by calculating the OR Wald (Wald) values.
The increase in the value of Child–Pugh/Spleen Diameter ratio for one unit resulted in the reduction in the risk of bleeding by 0.2% (from 0.1% to 0.3%, p < 0.05), while the increase in platelet count to 1 × 10⁹/L yielded to the decrease in risk of bleeding by 0.8% (from 0.1% to 1.5%, p < 0.05). Expression of the following factors indicating an increased risk of bleeding: large esophageal varices 24.589 (7.368–82.060, p < 0.001), red color signs 194.997 (35.893–1059.356, p < 0.001), gastric varices 4.110 (1.187–14.235, p < 0.05), congestive gastropathy 10.153 (3.479–29.633, p < 0.001), and collateral circulation 1.562 (1.002–2.434, p < 0.05).
Following performed univariate logistic regression analysis, it is enabled that previously acquired set of 15 attributes with attribute rank given in columns one (CH) and three (IG) of Table 5 can be calibrated using results for OR given in column three (OR) in Table 6. The calibration process is showed in Table 7. It was carried out so that the mentioned set of 15 attributes from Table 5, which is given in the first row of Table 7 using extracting those of the 15 attributes for which OR > 1 in Table 6 is given in the second row of Table 7 and using extracting those of the 15 attributes for which OR < 1 in Table 6 is given in the third row of Table 7.
According to the results in Table 6, the independent (predictive) variables were A1–A29 attributed to number p smaller than 0.05, which significantly influenced on dependent, binary variable A30—bleeding.
According to the results in Table 7, we have 15 significant predictors given in first row. On the one hand, in second row, we have 12 predictors from this 15 with OR greater than one and characteristic when the predictive variable, bleeding, increased, and the risk that binary variable would acquire value Yes also increased.
On the other hand, in third row we have 3 predictors from this 15 with OR smaller than one and characteristic when the predictive variable increased, and the risk that binary variable would acquire value Yes decreased.

4. Discussion

In the machine learning and statistics, dimensionality reduction is the process of reducing the number of random variables under a certain consideration and can be divided into feature selection and attribute importance determination.
Feature selection approaches [68,69,70] try to find a subset of the original variables. In this work, two strategies, namely, filter (Chi-square, information gain, gain ratio, relief and symmetrical uncertainty) and wrapper (search guided by the accuracy) approaches are combined. The performance of classification algorithm is commonly examined by evaluating the classification accuracy.
In this study, the ROC curves are used to evaluate the classification accuracy. By analyzing the experimental results presented in Table 3, it can be observed that the LogitBoost classification technique achieved better result than the other techniques using training mode of valuation applied classification algorithms.
The results of the comparative application of different classifiers conducted in described case study on feature subsets generated by the five different feature selection procedures are shown in Table 5. The LogitBoost classification algorithm is trained using decision stumps (one node decision trees) as weak learners. The IG attribute evaluation can be used to filter features, thus reducing the dimensionality of the feature space [71].
The experimental results presented on Table 8 show that IG feature selection significantly improves the all observed performance of the LogitBoost classification technique in spite of the fact that decision tree has inherited ability to focus on relevant features while ignoring the irrelevant ones (refer to Section 3).
The authors performed 10-cross validation of the proposed model using Weka software and it confirmed the validity of the proposed model defined by the procedures given in the work with Algorithm 1 and Algorithm 2 as it is given in Table 9.
As we mentioned in Section 3 Results, results of univariate regression on same data set [67] are used for fine calibration in proposed model. In that paper was considered comparison of use of classic and gradual regression in prediction of risk of variceal bleeding in cirrhotic patients.
Table 10 shows results obtained using multivariate gradual regression and recognizes only two factors as significant for risk of variceal bleeding, which are in comparison with results of proposed model evidently a worse result in terms of requested prediction.
The regression calibration is a simple way to improve estimation accuracy of the errors-in-variables model [72].
It is shown that when variables are small, regression calibration using response variables outperforms the conventional regression calibration.
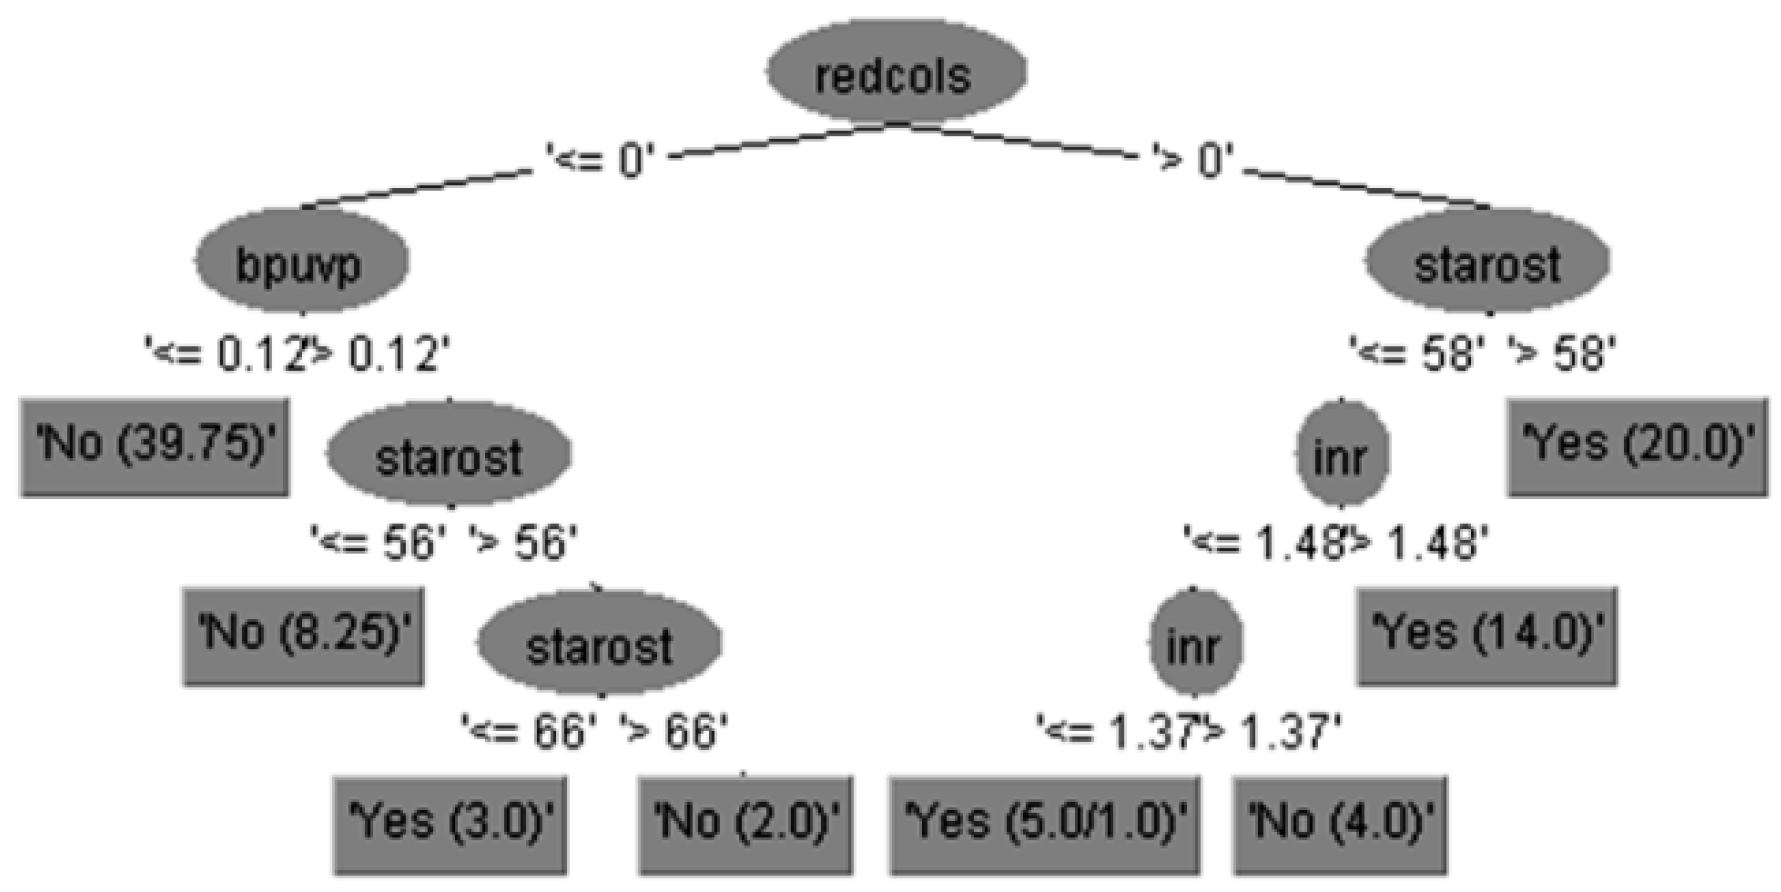
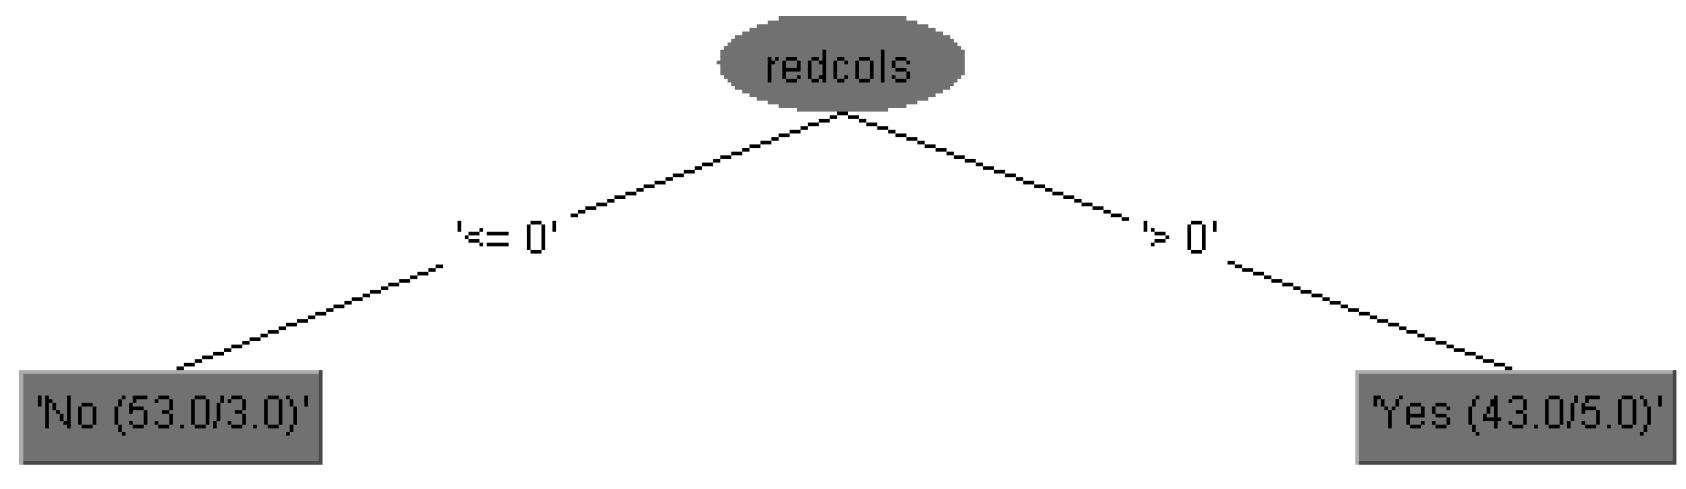
Expert clinical interpretation of obtained results for risk of bleeding prediction in cirrhotic patients could be given using decision tree diagram with feature subset of 15 attributes, which is practically equal to set of 29 attributes in the case without feature selection but more precise and accurate.
The run information part contains general information about the used scheme, the number of instances, 96 patients, in the case of 15 attributes is shown in Figure 3, i.e., the case of 29 attributes is shown in Figure 4, and in both cases as well as the attributes names.
The output for predicted variable represented by the decision tree given in Figure 3 can be interpreted using the If-Then 14 rules in Equation (12), as follows:
I f   ( A 15 = < 0.0 )   a n d   ( A 24 = < 0.12 )   t h e n   A 30 = N o   ( 39 , 75 / 96 ) .
Authors contribution is demonstrated in obtained result with application of proposed new ensemble boosting model of data mining, which integrates classification algorithm with attribute reduction and regression method for calibration and which shows that proposed model has a better characteristic than each of individually applied model and authors could not find in existing literature.
The authors confirmed originality of the proposed ensemble model by reviewing the state of the art, generally observed, end especially in the liver disease prediction, which are given in the introduction of the paper and could be confirmed by observation updated state of the art in both disciplines:
-
in the different machine learning methodologies [73,74,75] and
-
in the use of differently constructed ensemble methodologies [76,77].
Advantage of proposed model is, in fact, that it is evaluated on the case study including big number of different types of considered factors. Finally, one advantage of the proposed model is in the fact that it could be applied worldwide where it will generate prediction that is suitable according the specificity of each locality individual so that the paper is suitable for broad international interest and applications.
In such a way, authors confirmed the hypothesis and answered the research question set in introduction of this paper and thus contributed to the creation of a tool that can successfully and practically serve to solve their perceived research gap.
This described study has several limitations that must be addressed:
First, we collected data only from one medical center (as it is given in [78] as Supplementary Material) that reflects its particularities; the sample would be more representative if it is from many different localities, so that results can be generalized. Second, we evaluated small size of only 96 patient’s information, although most of the variables were statistically significant. Third, we have not included all possible factors that could cause bleeding. Finally, we must notice that noninvasive markers may be useful only as a first step to possibly identify varices for cirrhosis patients and in this way to reduce the number of endoscopies.
In further work and research authors plan to test proposed model on the data set obtained in last 10 years in Clinical Center of Nis, Serbia. Authors also intend to include in further research at least two other clinical centers in Serbia or in the Western Balkans that are topologically distant and located in different locations with different features (hilly and lowland coastal locality) where the population has other habits and characteristics and, in this way, to obtain bigger size of cirrhotic patients and more representative sample for proposed model evaluation. Authors plan also to deal with determining more precise type and number in each type of classification algorithms and type and number of classifiers for feature selection used in proposed model. Finally, proposed model can be suggested for prediction and monitoring of risk of bleeding in cirrhotic patients, e.g., by implementing as a software tool.

5. Conclusions

Analysis of significance of factors that are influencing an event is a very complex task. Factors can be independent or dependent, quantitative or qualitative, i.e., deterministic or probabilistic nature, and there can be a complex relationship between them. Due to the importance of determination of risk factors for bleeding problems in cirrhotic patients and the fact that early prediction of varices bleeding in cirrhotic patients in last 20 years help this complication to be reduced, it is clear that it is necessary to develop an accurate algorithm for selection of the most significant factors of the mentioned problem.
Among all techniques of statistics, operation research, and data mining techniques, in this work, statistical univariate regression and data mining technique of classification are aggregated to obtain one boosting method, which has better characteristics than each of them individually. Data mining is used to find a subset of the original set of variables. Also, two strategies, filter (information gain and other) and wrapper (search guided by the accuracy) approaches, are combined. Regression calibration is utilized to improve estimation performance of the errors in variables model. Application of the bleeding risk factors-based univariate regression presented in this paper can help decision-making and higher risk identification of bleeding in cirrhotic patients.
The proposed method uses advantages of data mining decision tree method to make good beginning classification of considered predictors and then univariate regression is utilized for fine calibration of obtained results, resulting in developing a high-accuracy risk prediction model.
It is evident that the proposed ensemble model can be useful and extensible to other hospitals in the world treating this illness, the liver cirrhosis and its consequences as the bleeding of varices studied in this case.

Supplementary Materials

The following are available online at https://www.mdpi.com/2227-7390/8/11/1887/s1, Table S1: The data in study described in (Benedeto-Stojanov, 2010) 29 attributes—involved 96 subjects by Clinical Center of Nis, Serbia.

Author Contributions

Conceptualization: A.A.; Project administration: S.N.; Validation: M.J.; Writing—original draft: M.V.; Writing—review & editing: M.R. (Miloš Ranđelović); Formal analysis: M.R. (Milan Ranđelović); Software: V.S.; Investigation: R.R.; Supervision, Methodology: D.R. All authors have read and agreed to the published version of the manuscript.

Funding

The authors are grateful to the Science technology park Niš that paid to publish the manuscript.

Conflicts of Interest

The authors declare no conflict of interest.

Abbreviations

MELDModel of End-Stage Liver Disease
TIPSTransjugular Intrahepatic Portosystemic Shunt
GIGastrointestinal
INRInternational normalized ratio
AVHAcute variceal hemorrhage
LMTLogistic model tree
K-NNK-nearest neighbor
TPTrue positive
TNTrue negative
FPFalse positive
FNFalse negative
ROCReceiver Operating Characteristic
SVMSupport Vector Machine
PProbability
OROdds ratio
CCICorrectly classified inputs
ICIIncorrectly classified inputs
CIConfidence interval
CHChi-square
GRGain ratio
IGInformation gain
RFRelief attribute evaluation
SUSymmetrical uncertainty

References

  1. Liu, Y.; Meric, G.; Havulinna, A.S.; Teo, M.S.; Ruuskanen, M.; Sanders, J.; Zhu, Q.; Tripathi, A.; Verspoor, K.; Cheng, S.; et al. Early prediction of liver disease using conventional risk factors and gut microbiome-augmented gradient boosting. medRxiv 2020. [Google Scholar] [CrossRef]
  2. Rajoriya, N.; Tripathi, D. Historical overview and review of current day treatment in the management of acute variceal haemorrhage. World J. Gastroenterol. 2014, 20, 6481–6494. [Google Scholar] [CrossRef]
  3. Barbu, L.; Mărgăritescu, N.D.; Şurlin, M. Diagnosis and Treatment Algorithms of Acute Variceal Bleeding. Curr. Health Sci. J. 2017, 43, 191–200. [Google Scholar] [PubMed]
  4. Matheny, M.; Thadeney Israni, S.; Ahmed, M.; Whicher, D. (Eds.) Artificial Inelligence in Health Care: The Hope, the Hype, the Promise, the Peril; National Academy of Medicine, NAM Special Publication: Washington, DC, USA, 2019. [Google Scholar]
  5. Zhu, W.; Zeng, N.; Wang, N. Sensitivity, Specificity, Accuracy, Associated Confidence Interval and ROC Analysis with Practical SAS Implementations. In Proceedings of the NESUG 2010 Conference, Baltimore, MD, USA, 14–17 November 2010; Available online: www.lexjansen.com/cgi-bin/xsl_transform.php?x=nesug2010#NESUG2010-hl006 (accessed on 1 August 2020).
  6. Kempthorne, O. The Design and Analysis of Experiments; John Wiley&Sons Inc: New York, NY, USA, 1952. [Google Scholar]
  7. Koop, G. Analysis of Economic Data; Wiley: Chichester, UK, 2000. [Google Scholar]
  8. Oatley, G.; Ewart, B. Data mining and crime analysis. Wiley Interdiscip. Rev. Data Min. Knowl. Discov. 2011, 1, 147–153. [Google Scholar] [CrossRef]
  9. Elrazek, A.E.A.; Elbana, A. Validation of Data Mining Advanced Technology in Clinical Medicine. Appl. Math. Inf. Sci. 2016, 10, 1637–1640. [Google Scholar] [CrossRef]
  10. Chimieski, B.F.; Fagundes, R.D.R. Asociation and Clasifcation Data Mining Algorithms Comparison over Medical Datasets. J. Health Inform. 2013, 5, 44–51. [Google Scholar]
  11. D’Amico, G.; Garcia-Tsao, G.; Pagliaro, L. Natural history and prognostic indicators of survival in cirrhosis: A systematic review of 118 studies. J. Hepatol. 2006, 44, 217–231. [Google Scholar] [CrossRef] [PubMed]
  12. Kumar, R.P.; Rao, M.; Kaladhar, D.; Raghavendra, P.K.; Malleswara, R.; Dsvgk, K. Data Categorization and Noise Analysis in Mobile Communication Using Machine Learning Algorithms. Wirel. Sens. Netw. 2012, 4, 113–116. [Google Scholar] [CrossRef] [Green Version]
  13. Lavrač, N. Selected techniques for data mining in medicine. Artif. Intell. Med. 1999, 16, 3–23. [Google Scholar] [CrossRef]
  14. Cios, K.J.; Moore, G.W. Uniqueness of medical data mining. Artif. Intell. Med. 2002, 26, 1–24. [Google Scholar] [CrossRef]
  15. Richards, G.; Rayward-Smith, V.J.; Sönksen, P.; Carey, S.; Weng, C. Data mining for indicators of early mortality in a database of clinical records. Artif. Intell. Med. 2001, 22, 215–231. [Google Scholar] [CrossRef]
  16. Warner, J.L.; Zhang, P.; Liu, J.; Alterovitz, G. Classification of hospital acquired complications using temporal clinical information from a large electronic health record. J. Biomed. Inform. 2016, 59, 209–217. [Google Scholar] [CrossRef] [Green Version]
  17. Hall, M.; Frank, E.; Holmes, G.; Pfahringer, B.; Reutemann, P.; Witten, I.H. The WEKA data mining software. ACM SIGKDD Explor. Newsl. 2009, 11, 10–18. [Google Scholar] [CrossRef]
  18. Berman, J.J. Confidentiality issues for medical data miners. Artif. Intell. Med. 2002, 26, 25–36. [Google Scholar] [CrossRef]
  19. Chen, W.; Cockrell, C.H.; Ward, K.; Najarian, K. Predictability of intracranial pressure level in traumatic brain injury: Features extraction, statistical analysis and machine learning-based evaluation. Int. J. Data Min. Bioinform. 2013, 8, 480–494. [Google Scholar] [CrossRef] [Green Version]
  20. Bardsiri, M.K.; Eftekhari, M. Comparing ensemble learning methods based on decision tree classifiers for protein fold recognition. Int. J. Data Min. Bioinform. 2014, 9, 89–105. [Google Scholar] [CrossRef]
  21. Kovačić, Z.J. Multivarijaciona Analiza; Ekonomski Fakultet: Beograd, Srbija, 1994. [Google Scholar]
  22. Xu, X.-D.; Dai, J.-J.; Qian, J.-Q.; Pin, X.; Wang, W.-J. New index to predict esophageal variceal bleeding in cirrhotic patients. World J. Gastroenterol. 2014, 20, 6989–6994. [Google Scholar] [CrossRef]
  23. Kumar, M.K.; Sreedevi, M.; Reddy, Y.C.A.P. Survey on machine learning algorithms for liver disease diagnosis and prediction. Int. J. Eng. Technol. 2018, 7, 99–102. [Google Scholar] [CrossRef] [Green Version]
  24. Jain, D.; Singh, V. Feature selection and classification systems for chronic disease prediction: A review. Egypt. Inform. J. 2018, 19, 179–189. [Google Scholar] [CrossRef]
  25. Provost, F.; Fawcett, T. Analysis and visualization of classifier performance: Comparison under imprecise class and cost distributions. In Proceedings of the 3rd International Conference on Knowledge Discovery and Data Mining, Newport Beach, CA, USA, 14–17 August 1997; pp. 14–17. [Google Scholar]
  26. Joloudari, J.H.; Saadatfar, H.; Dehzangi, A.; Shamshirband, S. Computer-aided decision-making for predicting liver disease using PSO-based optimized SVM with feature selection. Inform. Med. Unlocked 2019, 17, 100255. [Google Scholar] [CrossRef]
  27. Goldis, A.; Lupușoru, R.; Goldis, R.; Raţiu, I. Prognostic Factors in Liver Cirrhosis Patients with Upper Gastrointestinal Bleeding. Biol. Med. 2017, 10, 1–6. [Google Scholar] [CrossRef]
  28. Al Ghamdi, M.H.; Fallatah, H.I.; Akbar, H.O. Transient Elastography (Fibroscan) Compared to Diagnostic Endoscopy in the Diagnosis of Varices in Patients with Cirrhosis. Sci. J. Clin. Med. 2016, 5, 55–59. [Google Scholar] [CrossRef] [Green Version]
  29. Wu, C.-C.; Yeh, W.-C.; Hsu, W.-D.; Islam, M.; Nguyen, P.A.; Poly, T.N.; Wang, Y.-C.; Yang, H.-C.; Li, Y.-C. Prediction of fatty liver disease using machine learning algorithms. Comput. Methods Programs Biomed. 2019, 170, 23–29. [Google Scholar] [CrossRef] [PubMed]
  30. Abd Elrazek, E.M.A.; Hamdy, A.M. Prediction analysis of esophageal variceal degrees using data mining: Is validated in clinical medicine? Global. J. Comp. Sci. Technol. 2013, 13, 1–5. [Google Scholar]
  31. Augustin, S.; Muntaner, L.; Altamirano, J.T.; González, A.; Saperas, E.; Dot, J.; Abu–Suboh, M.; Armengol, J.R.; Malagelada, J.R.; Esteban, R.; et al. Predicting early mortality after acute variceal hemorrhage based on classification and regression tree analysis. Liver Pancreas Biliary Tract 2009, 7, 1347–1354. [Google Scholar] [CrossRef]
  32. Breiman, L.; Friedman, J.H.; Olshen, R.A.; Stone, C.J. Classification and Regression Trees; Wadsworth & Brooks/Cole Advanced Books & Software: Monterey, CA, USA, 1984. [Google Scholar]
  33. Abu-Hanna, A.; De Keizer, N. Integrating classification trees with local logistic regression in Intensive Care prognosis. Artif. Intell. Med. 2003, 29, 5–23. [Google Scholar] [CrossRef]
  34. Abdel-Aty, M.; Fouad, M.; Sallam, M.M.; Elgohary, E.A.; Ismael, A.; Nawara, A.; Hawary, B.; Tag-Adeen, M.; Khaled, S. Incidence of HCV induced—Esophageal varices in Egypt. Medicine 2017, 96, e5647. [Google Scholar] [CrossRef]
  35. El-Salam, S.M.A.; Ezz, M.M.; Hashem, S.; Elakel, W.; Salama, R.; Elmakhzangy, H.; Elhefnawi, M. Performance of machine learning approaches on prediction of esophageal varices for Egyptian chronic hepatitis C patients. Inform. Med. Unlocked 2019, 17, 100267. [Google Scholar] [CrossRef]
  36. Benedeto-Stojanov, D. Indikatori Rizika Varikoznog Krvarenja u Bolesnika sa Cirozom Jetre; Medicinski Fakultet: Niš, Srbija, 2010. [Google Scholar]
  37. Benedeto-Stojanov, D.; Nagorni, A.; Bjelaković, G.; Stojanov, D.; Mladenović, B.; Djenić, N. The model for the end-stage liver disease and Child-Pugh score in predicting prognosis in cirrhotic patients and esophageal bleeding of varices. Vojnosanit. Pregl. 2009, 66, 724–728. [Google Scholar] [CrossRef]
  38. Benedeto-Stojanov, D.; Nagorni, A.; Bjelaković, G.; Mladenović, B.; Stojanov, D.; Djenić, N. Risk and causes of gastroesophageal bleeding in cirrhotic patients. Vojnosanit. Pregl. 2007, 64, 585–589. [Google Scholar] [CrossRef]
  39. Durand, F.; Valla, D. Assessment of Prognosis of Cirrhosis. Semin. Liver Dis. 2008, 28, 110–122. [Google Scholar] [CrossRef] [PubMed]
  40. Lee, J.Y.; Lee, J.H.; Kim, S.J.; Choi, D.R.; Kim, K.H.; Kim, Y.B.; Kim, H.Y.; Yoo, J.Y. Comparison of predictive factors related to the mortality and rebleeding caused by bleeding of varices: Child-Pugh score, MELD score, and Rockall score. Taehan Kan Hakhoe Chi 2002, 8, 458–464. [Google Scholar] [PubMed]
  41. Kleber, G.; Sauerbruch, T. Risk indicators of bleeding of varices. Y. Gastroenterology 1988, 26, 19–23. [Google Scholar]
  42. Esmat Gamil, M.; Pirenne, J.; Van Malenstein, H.; Verhaegen, M.; Desschans, B.; Monbaliu, D.; Aerts, R.; Laleman, W.; Cassiman, D.; Verslype, C.; et al. Risk factors for bleeding and clinical implications in patients undergoing liver transplantation. Transplant Proc. 2012, 44, 2857–2860. [Google Scholar] [CrossRef] [PubMed]
  43. Aggarwal, C. Machine Learning for Text; Springer Nature: Lawrence Livermore National Labaratory: Livermore, CA, USA, 2018; ISBN 978-3-319-73530-6. [Google Scholar]
  44. Friedman, J.H. Data Mining and Statistics: What’s the Connection? Technical Report; Department of Statistics: Stanford University: Stanford, CA, USA, 1997. [Google Scholar]
  45. Friedman, J.H.; Hastie, T.; Tibshirani, R. Additive Logistic Regression: A Statistical View of Boosting; Technical Report; Department of Statistics, Stanford University: Stanford, CA, USA, 1998. [Google Scholar]
  46. Hastie, T.; Tibshirani, R.; Friedman, J. The Elements of Statistical Learning, Data Mining, Inference, and Prediction; Springer Series in Statistics; Springer: Berlin, Germany, 2008. [Google Scholar]
  47. Zhang, Z.; Zhao, Y.; Canes, A.; Steinberg, D.; Lyashevska, O. Predictive analytics with gradient boosting in clinical medicine. Ann. Transl. Med. 2019, 7, 152. [Google Scholar] [CrossRef]
  48. Žižović, M.; Pamučar, D. New model for determining criteria weights: Level Based Weight Assessment (LBWA) model. Decis. Mak. Appl. Manag. Eng. 2019, 2, 126–137. [Google Scholar] [CrossRef]
  49. Roy, J.; Pamučar, D.; Adhikary, K.; Kar, K. A rough strength relational DEMATEL model for analysing the key success factors of hospital service quality. Decis. Making: Appl. Manag. Eng. 2018, 1, 121–142. [Google Scholar] [CrossRef]
  50. Niculescu-Mizil, A.; Caruana, R. Obtaining calibrated probabilities from boosting. In Proceedings of the 21st Conference on Uncertainty in Artificial Intelligence (UAI’05), Edinburgh, Scotland, 26–29 July 2005; pp. 413–420. [Google Scholar]
  51. Tan, P.N.; Steinbach, M.; Kumar, V. Classification: Basic Concepts, Decision Trees, and Model Evaluation. In Introduction to Data Mining; Addison-Wesley: Boston, MA, USA, 2005; ISBN 0321321367. [Google Scholar]
  52. Romero, C.; Ventura, S.; Espejo, P.; Hervas, C. Data mining algorithms to classify students. In Proceedings of the 1st IC on Educational Data Mining (EDM08), Montreal, QC, Canada, 20–21 June 2008; pp. 20–21. [Google Scholar]
  53. Fawcett, T. ROC Graphs: Notes and Practical Considerations for Data Mining Researchers; Technical Report HPLaboratories: Palo Alto, CA, USA, 2003. [Google Scholar]
  54. Vuk, M.; Curk, T. ROC curve, lift chart and calibration plot. Metodoloski Zv. 2006, 3, 89–108. [Google Scholar]
  55. Dimić, G.; Prokin, D.; Kuk, K.; Micalović, M. Primena Decision Trees i Naive Bayes klasifikatora na skup podataka izdvojen iz Moodle kursa. In Proceedings of the Conference INFOTEH, Jahorina, Bosnia and Herzegovina, 21–23 March 2012; Volume 11, pp. 877–882. [Google Scholar]
  56. Xu, Y.; Goodacre, R. Splitting Training and Validation Set: A Comparative Study of Cross-Validation, Bootstrap and Systematic Sampling for Estimating the Generalization Performance of Supervised Learning. J. Anal. Test. 2018, 2. [Google Scholar] [CrossRef] [Green Version]
  57. Bella, A.; Ferri, C.; Hernández-Orallo, J.; Ramírez-Quintana, M.J. Calibration of machine learning models. In Handbook of Research on Machine Learning Applications; IGI Global: Hershey, PA, USA, 2009. [Google Scholar]
  58. Sousa, J.B.; Esquvel, M.L.; Gaspar, R.M. Machine learning Vasicek model calibration with gaussian processes. Commun. Stat. Simul. Comput. 2012, 41, 776–786. [Google Scholar] [CrossRef] [Green Version]
  59. Zadrozny, B.; Elkan, C. Obtaining calibrated probability estimates from decision trees and naive bayesian classifiers. In Proceedings of the Eighteenth International Conference on Machine Learning, Williamstown, MA, USA, 28 June–1 July 2001; Morgan Kaufmann Publishers, Inc.: San Francisco, CA, USA; pp. 609–616.
  60. Agarwal, N. Calibration of Models. 2019. Available online: https://www.changhsinlee.com/python-calibration-plot/ (accessed on 1 August 2020).
  61. Friedman, J.; Hastie, T.; Tibshirani, R. Additive Logistic Regression: A Statistical View of Boosting. Ann. Stat. 2000, 28, 337–407. [Google Scholar] [CrossRef]
  62. Blagus, R.; Lusa, L. Bosting for high-dimensional two-class prediction. BMC Bioinform. 2015, 16, 300. [Google Scholar] [CrossRef] [PubMed]
  63. Srimani, P.K.; Koti, M.S. Medical Diagnosis Using Ensemble Classifiers-A Novel Machine Learning Approach. J. Adv. Comput. 2013, 1, 9–27. [Google Scholar] [CrossRef]
  64. Bettinger, R. Cost Sensitive Classifier Selection Using the ROC Convex Hull Method. 2003. Available online: https://www.reserachgate.net/publication/228969570 (accessed on 1 August 2020).
  65. Kotsiantis, S.B.; Pintelas, P.E. Logitboost of Simple Bayesian Classifier. Informatica 2005, 29, 53–59. [Google Scholar]
  66. WEKA Software. The University of Waikato: Hillcrest, New Zealand, 2009. Available online: http://www.cs.waikato.ac.nz/ml/weka (accessed on 1 August 2020).
  67. Randjelovic, D.; Bogdanovic, D. Health Risk Factors Assessment using Gradual and Classic Logistics Regression Analysis. In Proceedings of the 1st WSEAS International Conference on Advances in Environment, Biotechnology and Biomedicine, Tomas Bata University, Zlin, Czech Republic, 20–22 September 2012; pp. 378–385. [Google Scholar]
  68. Fodor, I.K. A Survey of Dimension Reduction Techniques; Technical Report UCRL-ID-148494; Lawrence Livermore National Lab.: Livermore, CA, USA, 2002.
  69. Bachu, V.; Anuradha, J. A Review of Feature Selection and Its Methods. Cybern. Inf. Technol. 2019, 19, 3. [Google Scholar] [CrossRef] [Green Version]
  70. Guyon, I.; Elisseeff, A. An introduction to variable and feature selection. J. Mach. Learn. Res. 2003, 3, 1157–1182. [Google Scholar]
  71. Zeeshan, A.R.; Awais, M.M.; Shamail, S. Impact of Using Information Gain in Software Defect Prediction Models. In Lecture Notes in Computer Science: Intelligent Computing Theory; Springer: Berlin/Heidelberg, Germany, 2014; Volume 8588, pp. 637–648. [Google Scholar]
  72. Huang, S.Y.H. Regression calibration using response variables in linear models. Stat. Sin. 2005, 15, 685–696. [Google Scholar]
  73. Baitharu, T.R.; Pani, S.K. Analysis of Data Mining Techniques for Healthcare Decision Support System Using Liver Disorder Dataset. Procedia Comput. Sci. 2016, 85, 862–870. [Google Scholar] [CrossRef] [Green Version]
  74. Marozas, M.; Zykus, R.; Sakalauskas, A.; Kupcinskas, L.; Lukoševičius, A. Noninvasive Evaluation of Portal Hypertension Using a Supervised Learning Technique. J. Health Eng. 2017, 2017, 1–10. [Google Scholar] [CrossRef] [Green Version]
  75. Shung, D.L.; Au, B.; Taylor, R.A.; Tay, J.K.; Laursen, S.B.; Stanley, A.J.; Dalton, H.R.; Ngu, J.; Schultz, M.; Laine, L. Validation of a Machine Learning Model That Outperforms Clinical Risk Scoring Systems for Upper Gastrointestinal Bleeding. Gastroenterology 2020, 158, 160–167. [Google Scholar] [CrossRef] [PubMed]
  76. Latha, C.B.C.; Jeeva, S.C. Improving the accuracy of prediction of heart disease risk based onensemble classification techniques. Inform. Med. Unlocked 2019, 16, 100203. [Google Scholar] [CrossRef]
  77. Nahar, N.; Ara, F.; Neloy, M.; Istiek, A.; Barua, V.; Hossain, M.S.; Andersson, K. A Comparative Analysis of the Ensemble Method for Liver Disease Prediction. In Proceedings of the ICIET 2019 Conference, Dhaka, Bangladesh, 23–24 December 2019. [Google Scholar]
  78. Available online: http://www.diplomatija.com/wp-content/uploads/2020/02/The-data-in-study-described-in-Benedeto-Stojanov2010-29-attributes-involved-96-subjects-by-Clinical-center-of-Nis-Serbia.xlsx (accessed on 1 August 2020).
Figure 1. The Receiver Operating Characteristic (ROC) graph of five discrete classifiers.
Mathematics 08 01887 g001
Figure 2. ROC value as a function of attribute number.
Mathematics 08 01887 g002
Figure 3. The decision tree with feature subsets (using 15 attributes).
Mathematics 08 01887 g003
Figure 4. The decision tree without feature subsets (using 29 attributes).
Mathematics 08 01887 g004
Table 1. The confusion matrix of a two-class classifier.
Predicted
PositiveNegative
TruePositiveTPFN
NegativeFPTN
Table 2. List of features used in study.
Attribute Label and NameDescription
(A1) sexGender (male or female)
(A2) ageAge (year)
(A3) etiologEtiology
(A4) bilirubBilirubin (mg/dL)
(A5) albumAlbumin (g/dL)
(A6) protrvrProthrombin time (s)
(A7) inrInternational normalized ratio (s)
(A8) keratinCreatinine (mg/dL)
(A9) ascitesAscites
(A10) neurporNeurological dysfunction
(A11) pcsdrPlatelet count/spleen diameter ratio
(A12) uhranjBody mass index
(A13) trombThrombocytes (109/L)
(A14) velikiLarge esophageal varices
(A15) redcolsRed color signs
(A16) gastvarGastric varices
(A17) konggasCongestive gastropathy
(A18) veljetreLiver diameter (mm)
(A19) velslezSpleen diameter (mm)
(A20) dijvportPortal vein diameter (mm)
(A21) dzidavpPortal vein wall thickness (mm)
(A22) dvldvmsLienal + mesenteric superior vein diameter(mm)
(A23) kolcirk1Collateral circulation
(A24) bpuvpFlow speed in portal vein (m/s)
(A25) bpuvlFlow speed in lienal vein (m/s)
(A26) konindvpCongestion index in the portal vein (cm/s)
(A27) konindvlCongestion index in the lienal vein (cm/s)
(A28) childpsChild–Pugh score
(A29) meldsMELD score
(A30) krvarenjeBleeding (binominal response-dependent variable Yes, No)
Table 3. Performance indicators obtained by the classification algorithms.
Naive BayesJ48HyperPipesLogitBoostPART
Accuracy0.9000.9180.6880.9800.959
Error0.1040.0830.3130.0210.042
F1 measure0.8960.9170.6710.9790.958
ROC0.9450.9180.8140.9990.982
Table 4. Accuracy of the LogitBoost algorithm.
CCI (%)ICI (%)TP_RateFP_Rate
LogitBoost97.9172.0830.9790.028
Table 5. Results of the five ranking methods (bigger number mark highest rank).
CHGRIGRFSU
(A15)2929292929
(A14)2828282816
(A17)2727272727
(A23)262526269
(A25)252425911
(A29)242624151
(A24)2311231822
(A8)2222221725
(A9)2123211018
(A6)2020201326
(A7)191919142
(A5)1818182221
(A11)171317217
(A2)1616161128
(A3)151515310
(A4)141414823
(A10)132113715
(A12)1217122319
(A22)11911513
(A20)1071028
(A21)9109112
(A18)86844
(A19)7871214
(A26)626163
(A13)51252020
(A27)45465
(A28)3431917
(A16)232246
(A1)1112524
Table 6. Odds ratio values for bleeding risk factors (univariate logistic regression).
FactorPOR95% CI for OR
Lower BoundUpper Bound
(A1)0.8161.1250.4173.033
(A2)0.1661.0270.9891.065
(A3)0.6060.6290.1083.662
(A4)0.2041.0530.9721.140
(A5)0.9621.0130.6021.703
(A6)0.3931.0530.9351.187
(A7)0.4211.6400.4915.470
(A8)0.2901.3240.7872.228
(A9)0.6311.4170.3425.865
(A10)0.2911.6000.6683.830
(A11)0.0200.9980.9970.999
(A12)0.0600.1480.0201.081
(A13)0.0230.9920.9850.999
(A14)<0.00124.5897.36882.060
(A15)<0.001194.99735.8931059.356
(A16)0.0264.1101.18714.235
(A17)<0.00110.1533.47929.633
(A18)0.0780.9860.9701.002
(A19)0.3901.0070.9911.024
(A20)0.4050.9360.8001.094
(A21)0.8590.9450.5091.755
(A22)0.6000.9600.8261.117
(A23)0.0491.5621.0022.434
(A24)0.9581.4410.03011.321
(A25)0.0540.0020.0011.166
(A26)0.6760.2940.00191.338
(A27)0.9071.7260.04016.690
(A28)0.5741.0480.8901.233
(A29)0.3381.0290.9711.091
Table 7. Top ranking feature subsets.
Ranking SubsetAttribute
Start top ranking attribute numbers based on ROC values in the descending order—Table 5A15, A14, A17, A23, A25, A29, A24, A8, A9, A6, A7, A5, A11, A2, A3.
Top ranking attributes after calibration by OR values greater than one—Table 6A15, A14, A17, A7, A23, A24, A9, A8, A6, A29, A2, A5.
Top ranking attributes after calibration by OR values smaller than one—Table 6A11, A3, A25.
Table 8. Performance of LogitBoost classification before and after information-gain attribute evaluation/Chi-square attribute evaluation (IG/CH) feature selection.
LogitBoost before
IG/CH Feature Selection
LogitBoost after
IG/CH Feature Selection
Accuracy0.9800.990
Error0.0210.014
F1 measure0.9790.990
ROC0.9990.999
Table 9. Performance of LogitBoost before/after IG/CH feature selection using 10-cross validation.
LogitBoost before
IG/CH Feature Selection
LogitBoost after
IG/CH Feature Selection
Accuracy0.8960.896
Error0.1040.104
F1 measure0.8960.896
ROC0.9300.948
Table 10. Odds ratio values for bleeding risk factors (multivariate logistic regression).
FactorPOR95% CI for OR
Lower BoundUpper Bound
Red color signs<0.001116.57819.744688.326
Congestive gastropathy0.0376.1161.11333.611
Constant<0.0010.010
Publisher’s Note: MDPI stays neutral with regard to jurisdictional claims in published maps and institutional affiliations.

