Article

An Empowerment Scale Analysis of Mexican MSMEs: Modeling with Covariance Structures

by
María de la Cruz del Río-Rama
1,
Martha Ríos-Manríquez
2,*,
José Álvarez-García
3 and
María Dolores Sánchez-Fernández
4
1
Business Management and Marketing Department, Faculty of Business Sciences and Tourism, University of Vigo, 32004 Ourense, Spain
2
Finance and Administration Department, University of Guanajuato, Guanajuato 38110, Mexico
3
Financial Economy and Accounting Department, Faculty of Business, Finance and Tourism, University of Extremadura, 10071 Cáceres, Spain
4
Department of Business, University of A Coruña, Campus de Elviña, 15071 A Coruña, Spain
*
Author to whom correspondence should be addressed.
Mathematics 2020, 8(10), 1817; https://doi.org/10.3390/math8101817
Submission received: 23 August 2020 / Revised: 10 October 2020 / Accepted: 12 October 2020 / Published: 16 October 2020

Abstract

:
Trained human capital is a source of incalculable resources, with an impact on the results of companies. For this reason, companies must carefully consider three aspects: empowerment with the consideration of the cognitive state of their collaborators; training and compensation; and fluidity in information sharing. Although granting empowerment to collaborators has been shown to be beneficial for organizations, its adoption has not been popularized. Therefore, it remains a construct that needs to be studied and understood, considering that it is influenced by the organizational culture of companies. In this research, the main objective was to examine the factor structure of the empowerment scale from the perspective of the owner or manager of the micro, small and medium-sized companies of Guanajuato, Mexico; using the dimensions of psychological empowerment; fluidity in information sharing; as well as training and compensation. The methodology is based on the Mathematical Economy; application of mathematical methods to represent theories and analyze problems in economics. This investigation used an exploratory and confirmatory factor analysis (CFA) to validate the proposed measurement scale. The sample is made up of 222 valid questionnaires. The CFA provided evidence that the model that best fits the data is a second-order model made up of two dimensions: self-efficacy and influence on the company’s results, which carry the psychological empowerment construct. These results make clear that although information is necessary to train human capital, cognitive variables are more important in the empowerment of human capital.

1. Introduction

Companies, whether micro, small, medium, or large, need management approaches that help them in their relationship, commitment, and involvement with their human capital. One of these approaches is to empower employees to actively participate in the challenges that the company constantly faces. People that impact positively the results of the company have initiative and autonomy; and are competent, satisfied, motivated, committed, responsible, and control their work performance. This is how empowerment is a management approach [1], which helps companies to achieve their objectives and goals better than their competition. Small and medium-sized companies are characterized by limited development in their operations and by their work culture [2], and therefore they must do more to empower their human capital, which can be a characteristic differentiator and an important competitive advantage.
Trained human capital is an incalculable resource for improving the results of companies. In this sense, there are cognitive aspects that affect collaborators in their relationships with the company and their coworkers, and it is through psychological empowerment that their skills and capacities are enhanced, whereby the company achieves a focus on stability with its collaborators and the impact on the company’s results, which occur in regard to the level of operational processes, the activities carried out, the decisions that help the company to sustain itself in the market, and the increase in performance or profit. Therefore, psychological empowerment continues to be an aspect to which companies must pay careful attention, in order to achieve their objectives and obtain a competitive advantage [3,4].
Empowerment in the operation of companies can entail many different scales to measure this concept in different economies and cultural environments: combining empowerment scales, or some variables and even adding other issues in order to propose models that support companies [5]. However, although the benefits are clear [6,7], as Hofstede [8] points out, the variables or dimensions of this concept vary from country to country, influenced by their choice of organizational culture, so it cannot be taken for granted that the studies and scales created and validated in other countries are valid for Mexico. In the literature available in the geographical area of Mexico, there are few investigations of this topic [2], and no proposals were found for the construction and validation of an instrument for measuring psychological empowerment (meaning, competence, self-determination, and impact).
In this context, the need to build and evaluate a scale adapted to the organizational culture of Mexico is observed, in order to have an instrument for measuring empowerment adapted to Mexican companies, this being the main novelty of this study. Mexico is a country that has a context of great economic and education polarization [9], characteristics that must be considered in the construction of an empowerment model.
Furthermore, it is important to study empowerment from the perspective of the owners and/or managers of human capital, since they have the capacity to implement it and mediate the relationship of human capital to business culture [10]. Nowadays, a fundamental tool is added to these studies: the importance of promoting fluidity in information sharing, which must be provided to human capital so that people can take control of their decisions by means of arguments. As Matthews, Díaz, and Cole [11] assert, the employee needs access to information, and in this globalized world, the need is even greater. However, when Spreitzer [12] first disseminated the concept of psychological empowerment, communication conditions were very different; now it is an unavoidable and therefore indispensable topic in this research. In addition, it should be noted that the impact of training and compensation is of great importance, and both aspects affect the perception that the employee has of the company. For all this, it is relevant to approach, from this position, investigations that can help to halt the demise of micro, small, and medium-sized companies in Mexico [13].
The challenge in this study is to see if a model developed in 1995 is still compatible with micro, small, and medium-sized enterprises (MSMEs) today. It is also intended to consider if the model remains the same or if different importance is given to the cognitive values of collaborators, given the current organizational conditions of business. Thus, the main objective of this research is to examine the factorial structure of an empowerment scale, as adapted to the organizational culture of Mexico, from the perspective of the owner or manager, suitable for MSMEs companies in Guanajuato, Mexico.
The paper is divided into five sections. The first is a brief introduction justifying the research, the objectives and the methodology used. In the second section, the approach, variables, and hypotheses for empowerment are established, based on the literature, then the methodology is described. In the fourth section, the results are presented, and in the last, the discussion is carried out, and then the conclusions, limitations, and future lines of research are outlined.

2. Empowerment

Empowerment as a concept was first analyzed, in different areas, in the 1960s [14]. In the business sphere, Vázquez [15] asserts that it was in the late 1970s; however, this statement is not fully supported in the literature. It is in the early 1980s when Rappaport [16] conceptualized empowerment as a factor by which people achieve control of their lives. Herriger [17] aligns with this definition, and it is Bartunek and Spreitzer [18] who point out its incorporation into management in 1988.
From a business point of view, Blau and Alba [19] conceive empowerment as a management practice, delegating decision-making to all levels of the company. Conger and Kaungo [20] indicate that it is a motivational and self-efficacy concept [20]. Recently, there have been various researchers who have delved into the definition of empowerment. Davis and Newstrom [21] indicate that it is the action of giving autonomy and relevant information, and promoting people in order to influence their work performance. Menon [22] defines it as the state of cognition that allows the collaborator to self-perceive control and competence in order to share the objectives and goals of the company. For Molina [23], it is to enable, grant, and allow people to act for themselves. Buelga [24], as well as Ríos, Téllez, and Ferrer [2], define it as the act of empowering, although the second authors delve deeper, pointing out that it is to delegate authority to human resources in their work activities in a responsible manner and according to the objectives of the company. Jáimez and Bretones [14] indicate that it is the freedom and initiative that the collaborator has to establish actions to carry out their activities, while Chee et al. [25] point out that it is the process by which human resources participate in decision-making.
Although the definitions of empowerment in the organizational sphere are diverse, it is difficult to find a term that fully captures its essence. As Thomas and Velthouse [26] affirmed, since the 1990s, empowerment has been a multidimensional concept. The definition that best suits our research is the one given by Ríos-Manríquez et al. [27] (pp. 72–73), “It is the power granted to human capital to make the most of its capacities to develop their activities autonomously, but with this they also take responsibility for the results that contribute to the success or failure of the business strategies established by the company”.

2.1. Economic and Management Theories Related to Empowerment

The concept of human capital theory evolved from economic theory [28], which establishes that employees accumulate knowledge and improve their capabilities [29,30], with a positive relationship between human capital and the economic results of the companies [31]. This theory, in turn, is related to the theory of resources and capabilities, by establishing that the internal capabilities of the company are valuable, distinctive, irreplaceable, and unique characteristics, necessary for the company to achieve competitive advantages [32,33]. In this way, it is determined by the capabilities of its collaborators [34]) and is responsible for the distribution of human capital resources in a homogeneous way in the company [35].
On the other hand, organizational theory considers leadership as an essential element that encourages the initiative and motivation of human resources in companies. A new form of leadership is the empowerment that fosters decentralized responsibility, knowledge, teamwork, communication networks, and the delegation of power [36], contributing to the improvement of the capacities of collaborators [37] allowing the collaborator to generate capacity to face any business challenge [36]. Thus, empowerment allows the employee to develop their activities satisfactorily and plays a leading role in decision-making and in the results of the company. In this sense, for the organization, it is a management strategy to achieve business success [2,38]. The success of companies is identified and explained by various theories such as institutional economic theory [39,40] and the theory of resources and capacities [32,41], which link business success closely with empowerment [42].
On the other hand, from the theory of innovation and management theory, empowerment generates innovative behaviors and a creative attitude in both managers and their collaborators [36], stimulating innovative companies, a necessary aspect to improve and preserve its competitive position [43]. In this sense, it is necessary in addition to providing employees with the necessary education, training, and involving them in development programs to generate capacities and give them access to tools of opportunity, information, resources, and power [44].
All these theories prompted the creation of a business management tool called “empowerment”, or empowerment theory [28]. This is considered a contemporary management theory, since within it empowerment is located [45]. Lincoln, Travers, Ackers, and Wilkinson [46] recommend being careful to assume that empowerment permeates employees in the same way, they do not react in a similar way to empowerment, so companies must consider objective and subjective, individual, and collective of collaborators. Therefore, in this research psychological and organizational aspects such as meaning, capacity, self-determination, impact, fluidity in information sharing, training, and compensation are considered.
In summary, empowerment is a new style of managing human resources [47] and a strategy to obtain competitive advantages [48]. Its origin is found in different economic and management theories that, although some do not deal with it explicitly, do address different characteristics of empowerment.

2.2. Approaches to Empowerment

Companies that introduce empowerment break paradigms and strike a balance between goals and profit, utility, or performance [6,49,50], and potentiate human capital [7,51], individually, and as a team [52,53]. Furthermore, companies that implement empowerment are more competitive, innovative, and efficient, and have more satisfied customers [50,54]. For this reason, researchers have made different methodological proposals for the empowerment of human capital under different approaches: relational or mechanical [20,55], psychological [12,26], organizational [11], and structural [56].
Relational or mechanical empowerment is approached from top-down [20] and mechanistic [55] processing. Given a hierarchical system, the higher levels share their power with the lower levels, effectively favoring the empowerment of human resources [57,58]. However, there are cognitive aspects that affect human capital, and therefore these aspects affect the objectives of the company, resulting in psychological empowerment.
This new approach to empowerment, a psychological one, refers to internal aspects of the collaborator (meaning and competence) and external aspects (self-determination and impact) that influence the results of the company [12]. These aspects are described by Thomas and Velthouse [26] and reflect the disposition of the person towards work; that is, it focuses on discernment of the human capital of empowerment [12,26].
Spreitzer [12] proposes a model of structural equations to measure psychological empowerment, with a scale drawn from four authors, using the variable “meaning” from the study by Tymnon [59]; the variable “competence” adapted from Jones [60] scale of self-efficacy; “self-determination” adapted from the Hackman and Oldham [61] autonomy scale; and, for the variable “impact”, he considered the learned helplessness scale of Ashforth [62]. Other authors have proposed other models, such as Foster-Fishman et al. [63], with six dimensions: autonomy, knowledge, trust, creativity, accomplishment, and influence. Menon [22] proposes a model with three dimensions: perceived control, perceived competence, and internalization of goals.
Organizational empowerment arises from the need to examine macro elements of organizations, considering the relational and psychological perspective of empowerment [55,57]. Hence, Matthews, Diaz, and Cole [11] designed a scale they call organizational empowerment, which evaluates elements that enhance human capital empowerment for any company; this includes three variables [11]: dynamic structure, control over decisions at work, and fluidity in information sharing. Finally, structural empowerment refers to the ability to strengthen interpersonal relationships and effective communication, as a measure of achieving a company’s goals [56], promoting the ability to carry out activities and mobilize resources [64]; it considers three variables: access to resources, access to information, and access to support. While Laschinger et al. [65,66] added one more variable to the Kanter scale: access to opportunity.
Matthews et al. [11] point out that relational empowerment is the most studied aspect in terms of distribution of power, which, in turn, gives power to human resources. At present, it is considered that this approach is a little outdated, according to the different forms of management implemented in companies, where a hierarchical system of authority, in many of them, no longer exists, and where power is shared. The authority is required to be accepted by the collaborator, who is affected by cognitive aspects in their work performance that must be addressed regarding psychological empowerment. Zimmerman [67] states that the most widely used and researched scale is psychological empowerment. While structural empowerment [56], analyzed by Laschinger et al. [65], added an item called development opportunity structure to the set of previous variables. This scale was perfected by Greco, Laschinger, and Wong [68]. Mendoza et al. [69] validated the organizational empowerment scale of Matthews et al. [11].
Analyzing the attributes of these approaches and their combination, Monje et al. [70]; Gupta et al. [71]; Silén et al. [72]; Singh and Sarkar [73]; Konczak et al. [74]; Matthews et al. [11]; Quinn and Spreitzer [55]; and Siegall and Gardner [57] argue that different scales should be elaborated, using elements both from the relational as well as from the psychological approach, to evaluate the level of empowerment, although they leave out structural empowerment. Jáimez and Bretones [14] analyzed the influence of structural empowerment at the level of psychological empowerment, relating it to organizational commitment.
Furthermore, Menon [22] analyzed psychological empowerment with organizational variables, while Ríos et al. [2] validated the Spreitzer scale [12] in Mexican SMEs, relating it to organizational commitment. Orgambídez-Ramos et al. [75] analyzed structural empowerment as a process to prevent and alleviate burnout. Gupta et al. [71] related structural empowerment to team building and employee competencies in learning organizational culture. Patterson, West, and Wall [76] related it to competitiveness and integrated manufacturing. Schneider, Dowling, and Raghuram [77] addressed empowerment as a success factor in newly created companies. Under the focus of the influence on the capacity and performance of innovation in SMEs, Sulistyo and Siyamtinah [78] investigated empowerment. It is clear that all the approaches are important and that they can be combined, not only with each other, but with other issues.

2.3. Theoretical Construction of Research Variables and Hypotheses

Under the premise that no one approach is better than the others, it is suggested to extract theoretically structured dimensions for the design of models that serve companies for the design of successful strategies and programs that generate empowerment in human capital. In addition, it is proposed to include other theoretically related structures, as stated by Spreitzer [12] and Suárez-Vélez [79]. Analyzing these approaches in this research, a scale is constructed considering: the four dimensions of psychological empowerment by Spreitzer [12]; the variable of fluidity in information sharing and organizational empowerment proposed by Matthews, Diaz and Cole [11]; as well as training and compensation. All these variables are based on the literature and come under the following arguments.
The collaborator, in its essence, is complex. The company must address psychological aspects that affect the employee’s perception of the empowerment granted [2,55]. These are internal and external cognitive aspects that affect the objectives and goals to be achieved by the company. It must be taken into consideration that the perception of a company and its colleagues (internal: meaning and competence), as well as their ability to evaluate the results and consequences of their activities (external: self-determination and impact) affects, either positively or negatively, the results of the company. These aspects are defined according to how they are described in the literature [2,11,12,26,27]:
  • Meaning. The collaborator connects his values, beliefs, and behaviors with the goals and objectives of the company.
  • Competition. The confidence the collaborator has in his abilities, skills, and knowledge to carry out his work independently of other collaborators.
  • Self-determination. The autonomy and initiative that the collaborator has to choose and make decisions to execute and develop his activities.
  • Impact. The collaborator’s perception of the consequences of his actions and his influence on the results of the company.
Under this paradigm, the following research hypotheses are proposed:
Hypothesis H1.
The factors meaning, competence, self-determination and impact influence psychological empowerment in the MSMEs of Guanajuato, Mexico.
Conger and Kanungo [20] classify the internal cognitive factors of the collaborator: meaning and competence, as self-efficacy. So, collaborators with a higher level of empowerment are more self-effective [80]. In addition, Stander and Rothmann [81] state that external cognitive factors (self-determination and impact) are united in a single variable called influence, related to the results of the company. Regarding these statements, the following hypothesis is proposed:
Hypothesis H2.
Self-efficacy and influence on results have an effect on psychological empowerment in the MSMEs of Guanajuato, Mexico.
Access to information is a relevant variable to empower human capital. Mendoza-Sierra and Borrego-Alés [80] define this as the communication process to transmit information from the company to human capital efficiently and quickly, individually, and as a team, to obtain optimal results [53,82]. As Siegall and Gardner [57] point out, the provision of information eliminates ambiguity and provides security for the collaborator, which should be taken in a broad sense, regarding the operation of the company, and not limited to its activities [11]. Efficient communication that expresses ideas, responsibility, commitment, and autonomy must be guaranteed, as well as promoting innovation in employees and strengthening their skills and abilities, with consequent organizational changes and impact on the results and performance of the company. It must be taken into consideration as a necessary element in their work performance [11,12,20,21,57,74,83], facilitating decision-making with an impact on the company’s results [11,12,50,74,80,84,85]. Matthews et al. [11] also consider communication to be part of organizational empowerment, calling it fluidity in information sharing. Regarding these statements, the following hypothesis is proposed:
Hypothesis H3.
Fluidity in information sharing influences psychological empowerment in the MSMEs of Guanajuato, Mexico.
Training and compensation are part of the process of empowering human capital. Sáenz [86] and Zimmerman [45] emphasize the need to strengthen the development of skills and capacities in human resources that cause the organizational changes required by the company, as well as compensation for human capital. In this regard, Viñán-Villagrán et al. [87] point out the importance of compensation for individual and team performance; therefore, training and empowerment are important elements for companies [88]. In this sense, Laschinger et al. [66], as well as Nnaemek et al. [89] establish that training and compensation must be adequate and effective in the process of empowering human capital. The following hypothesis is therefore proposed:
Hypothesis H4.
Training and compensation influence psychological empowerment in MSMEs in Guanajuato, Mexico.
Some studies of psychological empowerment were found to be using the Spreitzer scale [12], such as those of Konczak et al. [74]; Foster-Fishman et al. [63]; Menon [22]; Orgambídez-Ramos et al. [90]; Ríos, Téllez and Ferrer [2]; Siegall and Gardner [57]; Zaki and Mohammed [64]; and Santos et al. [91]. However, in relation to small and medium-sized Mexican companies, it was found that the level of empowerment of employees is different [2]. From the perspective of employees, the human capital of small companies shows higher levels of empowerment than that of medium-sized ones.
In the literature, a study was found from the perspective of owners and managers that analyzes the psychological empowerment of Spreitzer [12], used as an attribute inherent to human capital and fluidity in information sharing, with the objective of evaluating “if the impact of human capital in business performance is determined by the meaning, self-determination, competence and fluidity in information sharing, of the micro companies located in Celaya, Guanajuato, Mexico” [27] (pp. 72–73), which is different from this research proposal, in where the variables meaning; competence; self-determination; impact; fluidity in the exchange of information; training and compensation; and its influence in psychological empowerment is analyzed from the perspective of the owners or managers of the collaborators.

3. Methods

3.1. Sample and Data Collection

From the population made up of 261,005 economic units of the state of Guanajuato, Mexico [92], a sample was determined of 267 MSMEs with a confidence level of 95% and a margin of error of 6%. The data was collected through a questionnaire applied in a personal interview with the owners or managers of human resources. The final number of valid questionnaires is 222, which represents a response rate of 83.15%; collecting data from June 2018 to March 2019. As the data were collected from a single data source, following Aguirre-Urreta and Hu [93], the common method bias (CMB) was verified. For this, the Harman single-factor test was applied. The results show that a single factor, that could explain most of the total variance (>50%), was not detected, and therefore it can be said that the non-existence of common bias in this investigation is confirmed.

3.2. Measurement Instruments

The original measurement scale was made up of 19 items. Twelve items were adapted from the Spreitzer [12] psychological empowerment scale, divided into four subscales: meaning (three items); ability or competence (three items); self-determination (three items); and impact (three items). There are also four items of organizational empowerment: one from Matthews, Diaz and Cole [11], which is the fluidity in information sharing dimension, and three items obtained based on the literature considering the statement by Daily et al. [88]; Viñán-Villagrán et al. [87]; Laschinger et al. [66]; and Zimmerman [67], on the importance of training and compensation in the process of empowering human capital (see Appendix A). The Likert scale used is a six-point scale that goes from 1, strongly disagree to 6, strongly agree. So, higher scores indicate higher levels of empowerment.

3.3. Statistical Analysis

The statistical software programs Statistical Package for the Social Sciences (SPSS 19.0) and AMOS 25.0 (Analysis of Moment Structures) were used to perform the analyzes.
First, a descriptive analysis was performed by calculating the mean and its variability through the standard deviation. Next, the psychometric properties of the scale were validated, thereby delimiting the number of items that would measure the empowerment concept (reliability, one-dimensionality and validity) [94]. Two analyses were applied: the exploratory factor and the confirmatory analysis.
Applying the exploratory factor analysis, the reliability of the scale is analyzed, which refers to the degree to which a measure is free of random errors [95] (p. 367). The Kunder Richardson Method is followed, analyzing the item-total correlation, in which those indicators with low correlation (<0.3) are eliminated [96]. Then, estimation of α Cronbach, for which a value greater than 0.7 is recommended [97,98].
The item-total correlation refers to the correlation coefficients between the estimated scores of the attribute, without taking into account item i (Yxi) and the scores of the individuals in item i (xi). They can be expressed as
C o r ( x i ,   Y x i ) = σ x i y x i σ x i σ y x i = j = 1 m σ x i x j σ x i 2 σ x i ( i = 1 m j = 1 m σ x i x j 2 j = 1 m σ x i x j +   σ x i 2 ) 1 / 2
where,
  • m = number of items on the scale.
  • xi = items on the scale.
For the calculation of the α Cronbach coefficient, if it is considered that the scale scores are the mean of the items, it is expressed as
Y M = x 1 + x 2 x 1 + + x m m
α M = m m 1 ( 1 i = 1 m σ x i 2 m 2 σ Y 2 )
where,
  • m = number of items on the scale.
  • xi = items on the scale.
To finalize this analysis, the unidimensionality, percentage of explained variance, and factor load of each indicator are studied. As a preliminary step, it is verified that the data is adequate, using correlation matrix examination, Bartlett’s Sphericity Test (estimate of the χ2 test (high and significant value less than 0.05), Kaiser’s Measurement Adequacy Test-Meyer–Oklin (KMO), measure of sampling adequacy (MSA index), unacceptable for values below 0.5. To apply exploratory factor analysis of principal components, an analysis of principal axes with varimax rotation is performed [99]. Those indicators whose factorial load is very low (>0.5) should be suppressed [98]. This analysis allows identification of the underlying dimensions in the empowerment construct.
Continuing with the validation of the scale and its refinement, since the previous analysis is exploratory, the confirmatory factor analysis is applied, which allows examination of the measurement model and the structural model, guaranteeing the validity and reliability of the measurement scales, refining them further, if necessary. Using the sequence of Hair et al. [98], the model is proposed and estimated using the maximum likelihood method, applying bootstrapping with 500 samples. First, the model is evaluated for offending detections (negative or non-significant error variances and very high standard errors). The fit of the structural measurement model is analyzed. The critical ratio for regression weight must exceed ±1.96, the standard regression weight (β), mostly higher than 0.5 [100], and the R2 parameter must take values above 0.4 [101].
Finally, the global fit of the model is analyzed, and the following indices are chosen: chi-square (χ2) and significance level (p). Both variables are very sensitive to the sample size, and when it is very high, the test may not be reliable, especially for samples greater than 200 [102,103]. Thus, the goodness of fit index (GFI) is also used, as well as the adjusted goodness of fit index (AGFI) and the Tucker Lewis index (TLI; acceptable fit for values close to 0.9; [100]), and root mean square error of approximation (RMSEA) in which, according to Maydeu-Olivares et al. [104], values around 0.08 represent a reasonable error, and Reeve et al. [105] indicate that a value of 0.05 shows an excellent fit. For normalized χ22/df), values between 2, 3, or 5 are recommended [98,100].
Where each of the indices are calculated according to the following expressions [106] (pp. 28–29):
Chi-squared (χ2) following the maximum likelihood estimation method:
χ M L 2 = ( N 1 ) [ T r ( S 1 ) ( p + q )   ln | | ln | S | ]
The setting function is
F M L = [ T r ( S 1 ) ( p + q )   ln | | ln | S | ]
where,
  • Tr = trace.
  • Ln = natural logarithm.
  • P = total number of estimated independent parameters.
  • N = sample size.
  • p + q = number of observable variables analyzed.
  • df = degrees of freedom = 0.5 (p + q)(p + q + 1) − P.
  • S = observed covariance matrix (initial).
  • χ2 = Chi squared.
  • ∑ = matrix of covariances reproduced by the model.
Goodness of fit index (GFI)
G F I = 1 T r ( 1 S I ) 2 T r ( 1 S ) 2
where,
  • Tr = trace.
  • S = observed covariance matrix (initial).
  • I = Identity matrix.
Comparative fit index (CFI).
C F I = M a x [ ( χ P r o p o s e d   M o d e l 2 d f P r o p o s e d   M o d e l ) ,   0 ] M a x [ ( χ N u l l   M o d e l 2 d f N u l l   M o d e l ) , ( χ P r o p o s e d   M o d e l 2 d f P r o p o s e d   M o d e l ) ,   0 ]
where,
  • χ2 = Chi squared.
  • df = degrees of freedom = 0.5 (p + q) (p + q + 1) − P.
Root mean square error of approximation (RMSEA)
R M S E A = [ M a x   { χ 2 ( d f N 1 ) ,   0 } d f ] 1 / 2
where,
  • χ2 = Chi squared.
  • df = degrees of freedom = 0.5 (p + q) (p + q + 1) − P.
  • N = sample size.
Normed chi-square (NCS).
N C S = χ 2 d f
where,
  • χ2 = Chi squared.
  • df = degrees of freedom = 0.5 (p + q) (p + q + 1) − P.
Finally, the reliability of the measurement model is examined again. The composite reliability coefficient (CR) and average variance extracted (AVE) are used. According to Thoemmes, Rosseel, and Textor [107], and Hair et al. [98], the recommended level is 0.7 and >0.5, respectively. Then it is established as [106] (p. 30):
Composite reliability (CR).
C R = ( i = 1 p λ i ) 2 ( i = 1 p λ i ) 2 + ( i = 1 p ε i )
The measurement error of the indicator can be calculated as 1 − λ i 2 , where, λ (lambda) is the standardized factor loading for item i, ε is the respective error variance for item i, and p is the number of variables observed. So, the error variance (ε) is estimated based on the value of the standardized loading (λ) as
Average variance extracted (AVE).
A V E = i = 1 p λ i 2 i = 1 p λ i 2 + i = 1 p ε i
where λ (lambda) is the standardized factor loading for item i, ε is the respective error variance for item i, and p is number of indicators observed variables.

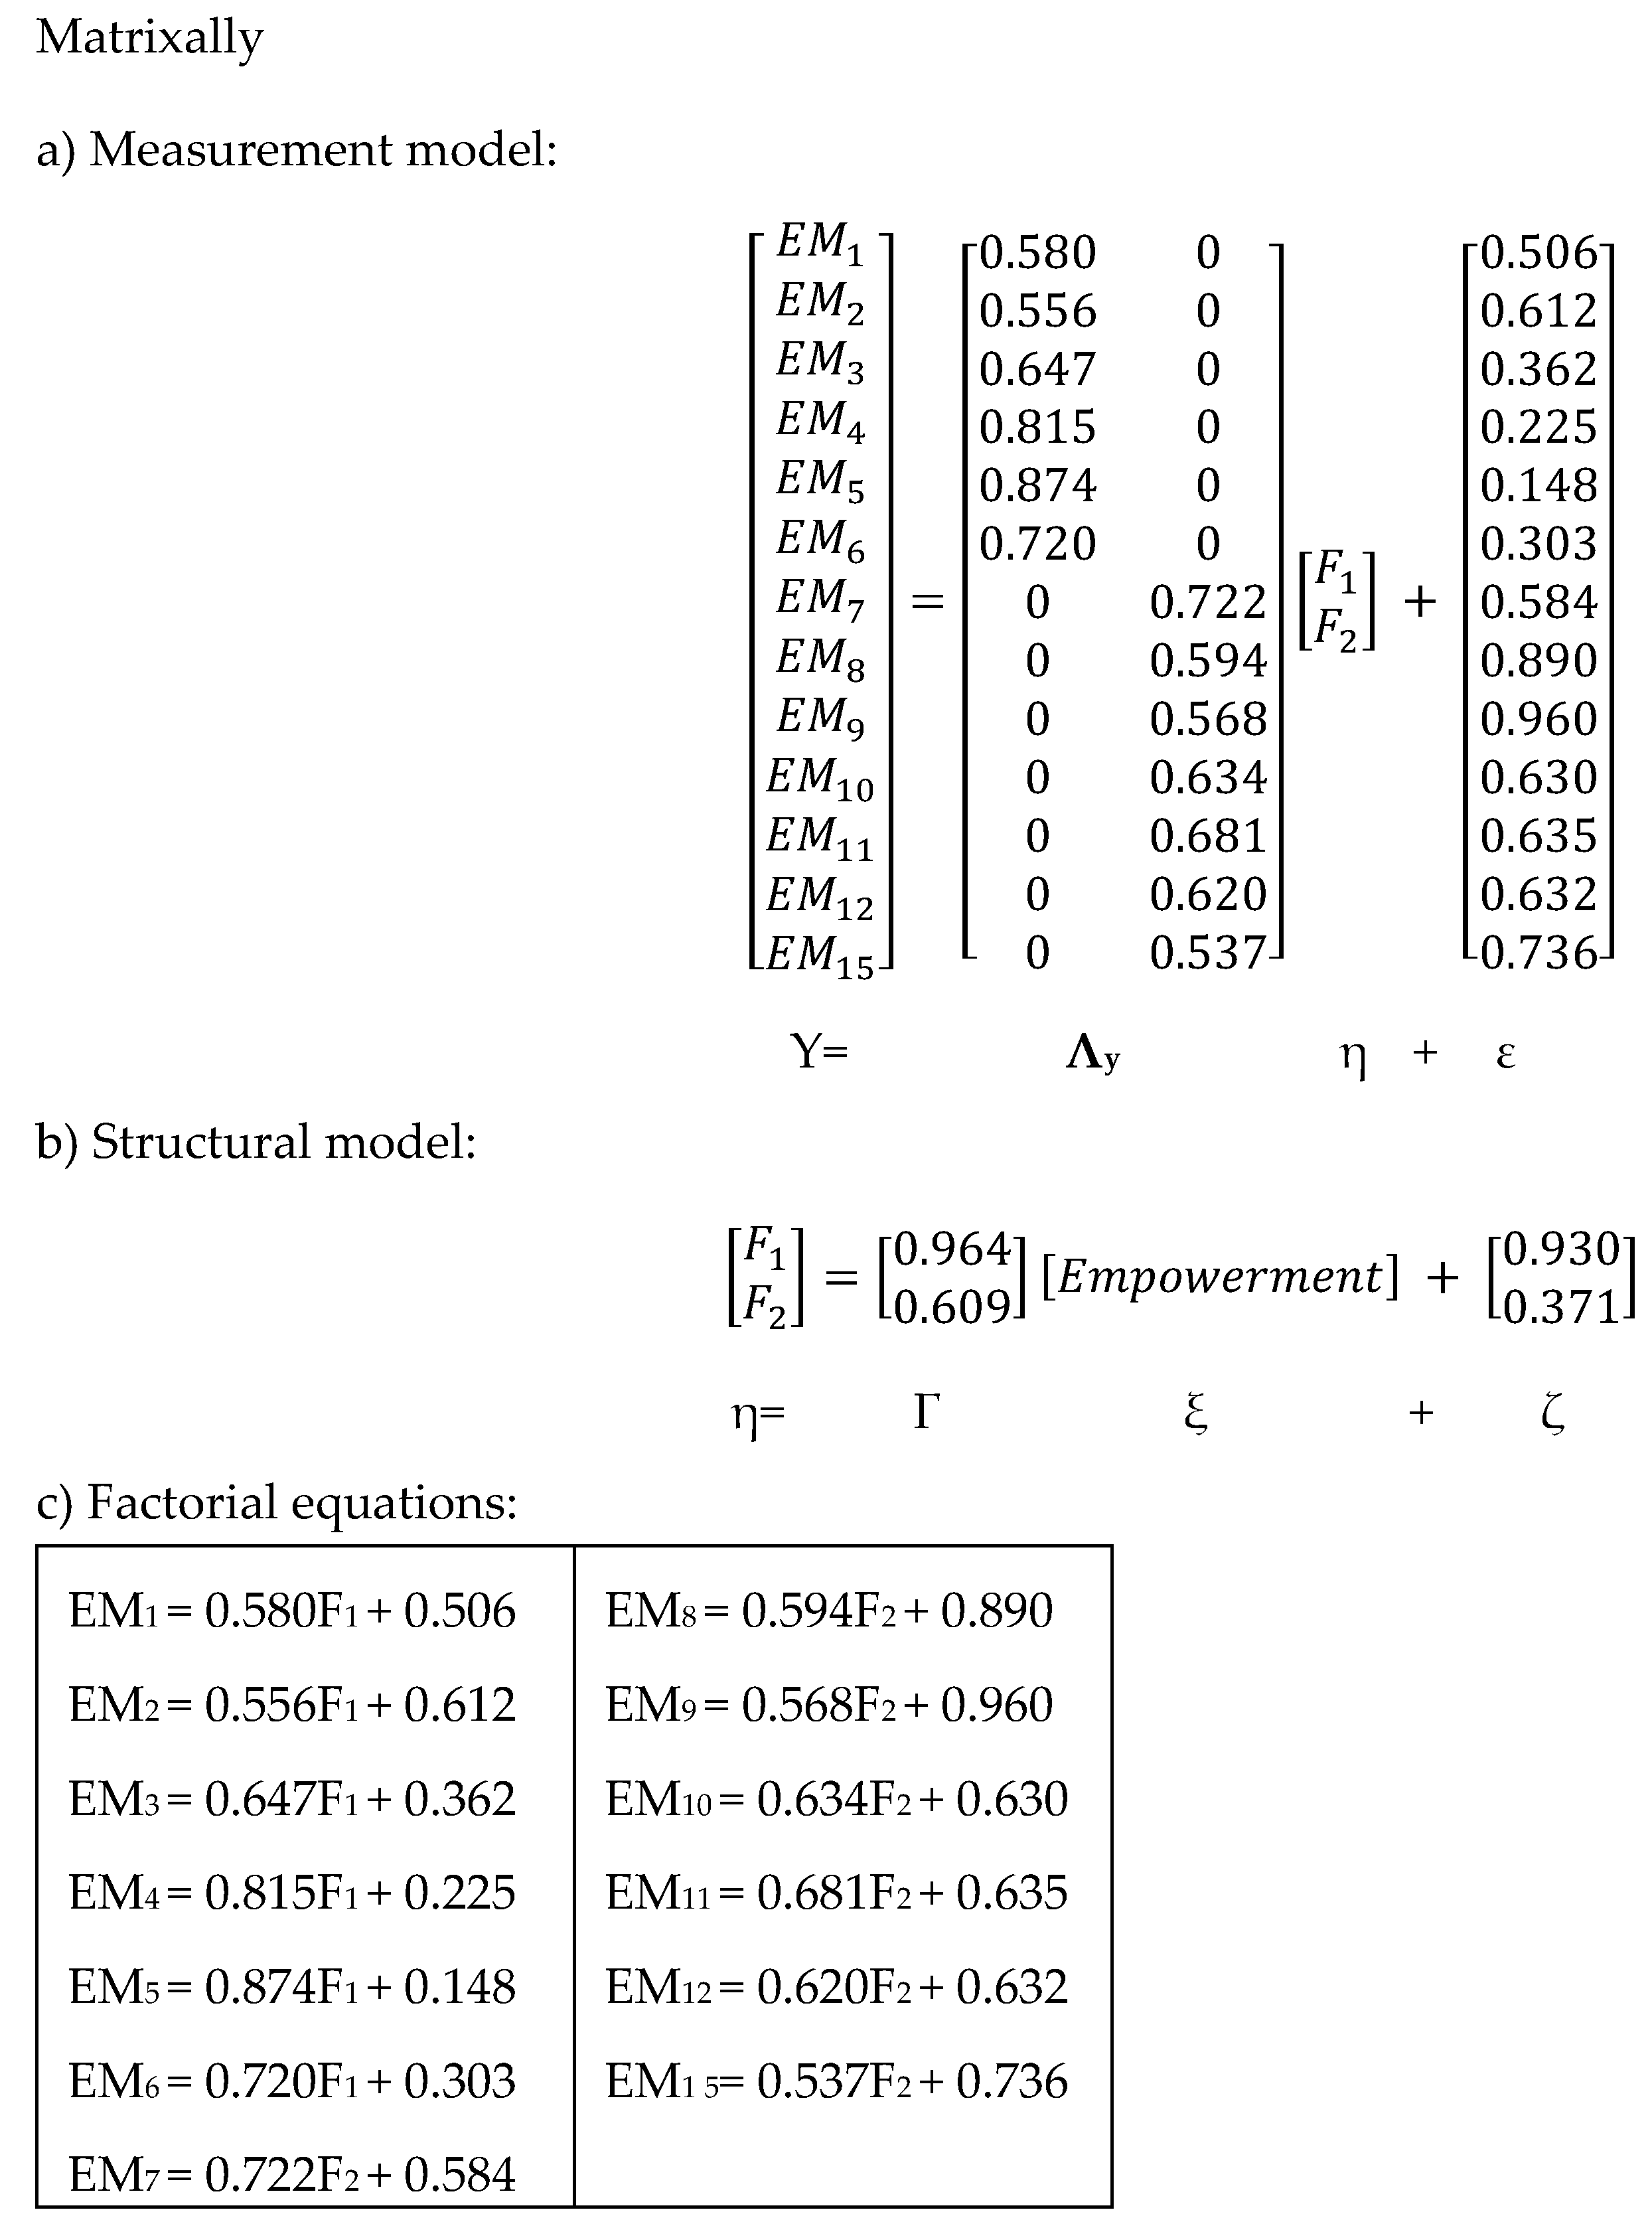
3.4. Formal Establishment of the Model Structure in Confirmatory Factor Analysis

3.4.1. Specification of the Measurement Model

For a set of observable variables ( x 1, x 2, x 3, …, x q), one is likely to find a structure of factors or latent (exogenous) variables ξ1, ξ2, ξ3, …, ξn, which lead to the factorial equation: X = λξ + δ, where each observable variable will be a function of the contribution of each factor and the measurement error associated with it. All variables are assumed to be deviated from their means, with an expected value equal to 0; E (X) = 0; E (ξ) = 0; E (δ) = 0. The interdependence between common and specific factors is also assumed; COV (ξ, δ’) = 0 [107] (p. 30). Table 1 shows the description of the matrices.
Matrix expression of the measurement model: X = Λxξ + δ.
[ x 1 . . . x q ] = [ .   .   .   .   . .   .   .   .   . .   .   .   .   . .   .   .   .   . .   .   .   .   . ] [ ξ 1 . . . ξ n ] + [ δ 1 . . . δ q ] q × 1     q × n     n × 1     q × 1
where X is a vector of observable measures q × 1 of independent variables. Λx (lambda x) is a matrix q × n of regression coefficients of X with respect to the latent variable ξ (ksi), and δ (delta) is a vector q × 1 of measurement errors of X. Factorial equations of the model are X1 = λ1ξ1 + δ1… Xq = λqξn + δq.
The procedure is similar for endogenous variables. Matrix expression of the measurement model: Y = Λy η + ε [106] (p. 18).
[ y 1 . . . y p ] = [ .   .   .   .   . .   .   .   .   . .   .   .   .   . .   .   .   .   . .   .   .   .   . ] [ η 1 . . . η m ] + [ ε 1 . . . ε p ] p × 1     p × m     m × 1     p × 1
where Y is a vector of p × 1 observable measures for the dependent variable Y. Λy (lambda y) is a p × m matrix of regression coefficients of the latent variable η (eta), and ε (epsilon) represents a vector p × 1 of measurement errors with respect to Y. Factorial equations of the model: Y1 = λ1η1 + ε1 … Yp = λp ηm + εp.

3.4.2. Structural Model Specification

(a) Model of order 1
The structural model allows measurement of the relationships between the observable variables in order to see the direct and indirect influence between them. Matrixally, the structural equation of the model is: η = βη + Γξ + ζ [107] (p.19).
[ η 1 . . . η m ] = [ 0 . . . 0 . . . 0 ] [ η 1 . . . η m ] + [ .   .   .   .   . .   .   .   .   . .   .   .   .   . .   .   .   .   . .   .   .   .   . ] [ ξ 1 . . . ξ n ] + [ ζ 1 . . . ζ m ] m × 1     m × m     m × 1     m × n     n × 1     m × 1
where η (eta) represents a vector m × 1 latent (factorial) endogenous (dependent) variables; β (beta) a matrix of m × m regression coefficients or effects of exogenous variables on endogenous variables; Γ (gamma) an m × n matrix of regression coefficients; ξ (ksi) a vector of latent exogenous (independent) variables n × 1; and ζ (zeta) a vector m × 1 of prediction errors of the structural equations. It is assumed that the matrix β is not singular and that the matrices ξ and ζ are not correlated with each other.
(b) Model of order 2
In these models, the endogenous latent variables (η) only have a common exogenous factor (ξ) that affects them; therefore, the β parameters will have a value of 0, leaving the structural model as η = Γξ + ζ, which means that the value taken by the endogenous latent variables (η) will be a function of their saturation (γ) in the exogenous latent variable (ξ) and the error term or single factor of the variable itself (ζ). Matrixally, the equation of the structural model is [106] (p. 242):
[ η 1 . . . η m ] = [ .   .   .   .   . .   .   .   .   . .   .   .   .   . .   .   .   .   . .   .   .   .   . ] [ ξ 1 . . . ξ n ]   +   [ ζ 1 . . . ζ m ] m × 1     m × n     n × 1     m × 1
If it is assumed that Ψ and Θε are diagonals, then Ψ = ζ and Θε = ε, so the errors would be specified by ζ (structural model) and ε (measurement model). The vector ζ (not present in the first-order confirmatory model) provides the amount of variance of the first-order factors that is not explained by the second-order factors. The starting assumptions in the second-order models are the expected value of the measurement errors is equal to 0 (E (ζ) = 0 and E (εj) = 0), and the expected covariation with the rest of the latent variables (ξ, η, ζ, ε) is 0 [106] (p.242).
Given that the hypothesis to be tested is that the population covariance matrix ∑ will be equivalent to the covariance matrix “implied” by the model parameters ∑(θ), in second-order CFA (confirmatory factor analysis), it will be the covariance matrix observed in the variables, and ∑yy(θ) will contain the covariances defined, based on the unknown parameters of the model, which are found in the vector θ [106] (p. 242).
yy(θ) = Eyy= E(YY´) = (Λy η + ε) (η´Λy´ + ε´) = ΛyE(ηη´)Λy´+ Θε
Given that
E(ηη´) = E[(Γξ + ζ) (ξ´Γ´ + ζ´) = ΓE(ξξ´)Γ´ + Ψ
Substituting in the previous formula, the covariance matrix involved for the second-order CFA is obtained:
E(YY´) = Λy(ΓE(ξξ´)Γ´ + Ψ)Λy´ + Θε
E(YY´) = Λy(ΓΦΓ´ + Ψ) Λy´ + Θε
Thus, each moment of the sample covariance matrix will have its correspondence with a certain combination of the model parameters. The objective, therefore, is to give a value to each of the unknown parameters of the model. It will be obtained in the process of parameter estimation from minimization functions [106] (pp. 242–243).

4. Results

4.1. Participant Characteristics

The sample participants (n = 222), by size, are made up of 44.1% micro companies, and 47.7% small, and 8.1% medium-sized companies. By sector of economic activity, 18.5% are industrial companies, 23% services, and those that participated most are commercial companies (58.6%). Another important characteristic is the age of the company: mostly young with a seniority of 10 years or less (30.6%), followed by companies of between 10.1 and 20 years (23%), 18.5% between 20.1 and 30 years, 5% between 30.1 and 40 years, 3.2% between 40.1 and 50 years, 1.8% between 50.1 and 75 years, and 18% which did not answer.

4.2. Validation of the Scale: Exploratory Factor Analysis

The results obtained show that the total item-correlation of each of the items is >0.3, except in E13, E14, E16, E17, E18, and E19 (0.156, 0.247, 0.210, 0.258, 0.203, and 0.257, respectively), which needed to be removed. Cronbach’s alpha is used as a measure of reliability, which is higher than the recommended minimum of 0.7 (0.870) [97,98]. To analyze the unidimensionality, the extraction method of maximum likelihood with varimax rotation was used. Regarding the criterion of the percentage of explained variance, two factors are identified to explain 57.102% > 50%, and all loadings are higher than the recommended minimum (>0.5). Factor 1 is called self-efficacy and is composed of six items: three of meaning and three of competence. Factor 2 has seven items of influence on the results: three of self-determination, three of impact and one of fluidity in information sharing (Table 2).

4.3. Second-Order Model: Confirmatory Factor Analysis

In order to check if a multidimensional concept (empowerment) is formed by two dimensions, a strategy of rival models was developed by Hair et al. [98]. A first single factor, Model 1 is proposed, in which all items load in a single factor (Figure 1) that is compared with a first-order Model 2, formed by two interrelated factors (oblique), and a first-order Model 3, formed by two factors not interrelated with each other (orthogonal). Model 2 presents a better fit, a model that was re-specified to improve its fit. The fit indices can be seen in Model 4 (first-order model, with two variables and 13 items) (Figure 2). Finally, and taking into account that the two factors are correlated (0.58), a Model 5 of second-order (three variables-13 items) is proposed (Figure 3).
The results of Model 5 show that the chi-square value for this second-order model (χ2 = 94.148, p = 0.001) is significantly lower than that of Model 4 (re-specified first-order model). This indicates that the data are explained more concisely by the second-order model, and better represent the internal structure of the scale. The higher the goodness of fit indices of the model collected, in Table 3, confirm that the optimal measurement model is a second-order model (Model 5); all the indices present values within the generally accepted limits (GFI = 0.941, AGFI = 0.905, CFI = 0.973, RMSEA = 0.054 χ2 Normalized (χ2/df) = 1.652). Therefore, the empowerment scale is made up of two dimensions. In this model, the indicators show β > 0.50 and significant (critical coefficient> ±1.96).
The reliability of the scale is analyzed again for Model 5, through the average variance extracted (AVE) and composite reliability (CR). It is observed that the self-efficacy scale takes values higher than those recommended of 0.5 for AVE, and 0.7 for CR (0.65 and 0.91) [98,102] in the case of factor 2, with CR = 0.81 > 0.7 and AVE (0.38 < 0.5). However, although the AVE does not reach the recommended minimum, it is close. Finally, the convergent validity is verified, which is confirmed through two tests β > 0.5 and statistically significant (t-student> ±1.96) and AVE greater than 0.5.

5. Discussion

This research delves into the validation of a scale in which psychological empowerment variables prevail, and only one impact variable of the variable fluidity in information sharing is added, namely, E15 “Access to the information available to collaborators”. Therefore, H1 is rejected.
For the companies in Guanajuato, the model establishes two overwhelming factors. The first is a self-efficacy factor, theoretically named by Conger and Kanungo [20], which includes the meaning and competence dimensions. The second factor is influence on the results, according to the model presented by Stander and Rothmann [81]. In this research, is deduced that the model coincides with these studies. Therefore, H2 is partially accepted.
In factor 2, item E15 is loaded, agreeing on the importance of access to information in the successful empowerment of human capital performance [11,12,20,21,57,58,74,108], and in the results of the company [11,12,50,74,80]. However, in Model 3, items of the fluidity in information sharing variable were rejected, being relevant in the model only as the access to information for human capital to carry out its activities, so H3 is partially accepted.
Despite the fact that in theory, training and compensation are important elements in the empowerment of human capital [66,67,86,87,88], in this study, they were not significant; therefore, H4 is rejected.
There is no doubt that empowerment is a new paradigm in the business environment, it is a style of managing human capital [47] and a strategy to obtain competitive advantages [48]. Its origin is found in different economic and management theories that, although in some it is not explicit, denote characteristics of empowerment, such as promoting decentralized responsibility, knowledge, teamwork, communication networks, and delegation of power [36] in decision making. In contemporary management theory, empowerment is located [45], and from the position of Lincoln, Travers, Ackers, and Wilkinson [46], who recommend taking care to assume that empowerment permeates employees in the same way, for which companies must consider objective and subjective, and individual and collective, issues of employees. This approach is the one followed in this research when considering cognitive aspects of the collaborator, fluidity in information sharing, training, and compensation. It is determined, from the perception of the owners and managers of Mexican MSMEs that they should focus their efforts on the collaborator’s cognitive aspects (psychological empowerment) and on access to information to guarantee a successful empowerment to benefit the company. Findings that are important in a Latin American culture and in developing countries like Mexico.
The findings in this research are useful for companies when considering empowerment as a business management tool that allows taking advantage of human talent; ideas, talent, knowledge, and capabilities, for the benefit of companies, fostering in them the ability to respond to face changes in a globalized business world.

6. Conclusions

In this research, the factorial structure of the empowerment scale in human capital was examined from the perspective of the owners and managers of micro, small, and medium-sized enterprises of Guanajuato, Mexico, applying exploratory factor analysis and confirmatory factor analysis, in which a rival model strategy was proposed between first-order models and a second-order model. The results confirm that the structure of the empowerment scale is made up of two factors, since the results of the second-order Model 5 show that it is reliable and that the data fit the model well.
The results of this research determine that the cognitive aspects of psychological empowerment and the importance of human capital having access to information to carry out their activities are still relevant today. Although macro factors were examined, combining, on the basis of the theory, a variable of organizational empowerment (such as fluidity in information sharing) and a focus on training and compensation, the model rejects the latter. This study determines that for MSMEs in a developing country, cognitive aspects and access to information are factors that empower their human capital.
Considering that this research contributes to knowledge of the empowerment approach based on the vision and the perception that the owners or managers of MSMEs have of the empowerment granted to human capital, it is intended that the results obtained support companies in Mexico for adequate development of programs focused on the cognitive aspects of employees and access to information. All this is in order to guarantee successful empowerment, and consequently, to benefit the results of the company.
In addition, this research contributes to the literature by linking empowerment from human capital theory, economic theory, resource and capabilities theory, institutional economic theory, contemporary management theory, organizational theory, innovation theory, and managerial theory, coinciding with Petit and Gutiérrez [36]. These authors relate empowerment with innovation theory and managerial theory; that is, for innovation theory, companies have human capital as a characteristic with intuition to solve problems and create transformative strategies and with management theory, because it takes advantage of to the maximum the capacities and competences of the collaborators.
The limitation is that the research was focused on a specific geographic area of Mexico, so a future line of research would be to expand the sample at the country level and transfer this research to Spanish MSMEs to make comparisons that allow confirmation or rejection of the results obtained in this research. Another limitation is that because only psychological empowerment and part of organizational empowerment were used, the results may affect the model, so another line of research would be used to propose a model that includes the variables of psychological, organizational, and structural empowerment.

Author Contributions

All authors contributed equally to this work. All authors wrote, reviewed, and commented on the manuscript. All authors have read and agreed to the published version of the manuscript.

Funding

This research received no external funding.

Conflicts of Interest

The authors declare no conflict of interest.

Appendix A

E1Importance of the work done by workers
E2Personal meaning of the activities carried out by the worker
E3Meaning of worker performance
E4Confidence in the collaborator’s ability
E5Confidence in the knowledge and skills of employees
E6Confidence that the employee has mastered their skills to carry out their activities
E7Confidence in the worker’s autonomy over their activities
E8Freedom granted to the collaborator to plan their activities
E9Freedom and independence granted to the collaborator to carry out their activities
E10Impact of the workers’ initiative
E11Control of collaborators over their work area
E12Collaborator influence on company results
E13Importance given to the worker’s educational level to grant authority
E14Training programs implemented in the company
E15Access to the information available to collaborators
E16Efficiency with which the company distributes information to employees
E17Expectation of remuneration for the work initiative
E18Prize and reward information available to collaborators
E19Information, about clients, available to collaborators
Note: Items that were removed appear in italics.

References

  1. Lee, M.; Koh, J. Is empowerment really a new concept? Int. J. Hum. Resour. Manag. 2001, 12, 684–695. [Google Scholar] [CrossRef]
  2. Ríos, M.; Téllez, M.d.R.; Ferrer, J. El empowerment como predictor del compromiso organizacional. Contaduría y Administración 2010, 231, 103–125. [Google Scholar]
  3. Forrester, R. Empowerment: Rejuvenating a potent idea. Acad. Manag. Exec. 2000, 14, 67–80. [Google Scholar] [CrossRef]
  4. Safari, A.; Adelpanah, A.; Soleimani, R.; Heidari-Aqagoli, P.; Eidizadeh, R.; Salehzadeh, R. The effect of psychological empowerment on job burnout and competitive advantage: The mediating role of organizational commitment and creativity. Manag. Res. J. Iberoam. Acad. Manag. 2020, 18, 47–71. [Google Scholar] [CrossRef]
  5. Dimitriades, Z.S. Creating strategic capabilities: Organizational learning and knowledge management in the new economy. Eur. Bus. Rev. 2005, 17, 314–324. [Google Scholar] [CrossRef]
  6. Yin, Y.; Wang, Y.; Lu, Y. Antecedents and outcomes of employee empowerment practices: A theoretical extension with empirical evidence. Hum. Resour. Manag. J. 2019, 29, 564–584. [Google Scholar] [CrossRef]
  7. Turkmenoglu, M.A. Investigating Benefits and Drawbacks of Employee Empowerment in the Sector of Hospitality. Int. Res. J. Bus. Stud. 2019, 12, 1–13. [Google Scholar] [CrossRef]
  8. Hofstede, G. Dimensionalizing Cultures: The Hofstede Model in Context Psychology and Culture. Online Read. 2011, 2, 2037–2919. [Google Scholar]
  9. COLMEX. Desigualdades en México 2018; El Colegio de México. Red de Estudios sobre Desigualdades: Tlalpan, México, 2018; Available online: https://desigualdades.colmex.mx/informe-desigualdades-2018.pdf (accessed on 30 August 2019).
  10. İzlem, G.; Nurdan, Ç.; Ömer, F.Ş. Development culture and TQM in Turkish healthcare: Importance of employee empowerment and top management leadership. Total Qual. Manag. Bus. Excell. 2019, 30, 1302–1318. [Google Scholar]
  11. Matthews, R.A.; Diaz, W.M.; Cole, S.G. The organizational empowerment scale. Pers. Rev. 2003, 32, 297–318. [Google Scholar] [CrossRef]
  12. Spreitzer, G.M. Psicological empowerment in the workplace: Dimensions measurment and validation. Acad. Manag. J. 1995, 38, 1442–1465. [Google Scholar]
  13. Álvarez, R.; Grazzi, M. Innovation and entrepreneurship in Latín America: What do we know? What would we like to know? Estudios de Economía 2018, 45, 157–171. [Google Scholar]
  14. Jáimez, M.J.; Bretones, F.D. El empowerment organizacional: El inicio de una gestión saludable en el trabajo. Revista de Trabajo y Seguridad Social. Recursos Humanos 2011, 344, 209–232. [Google Scholar]
  15. Vázquez, R.C. Refortalecimiento: Un debate con el empowerment. Revista Interamericana de Psicología 2004, 38, 41–51. [Google Scholar]
  16. Rappaport, J. In praise of paradox: A social policy of empowerment over prevention. Am. J. Community Psychol. 1981, 9, 1–25. [Google Scholar] [CrossRef]
  17. Herriger, N. Empowerment in der Sozialen Arbeit: Eine Einführung, 6th ed.; Kohlhammer Verlag: Stuggart, Germany, 2020. [Google Scholar]
  18. Bartunek, J.M.; Spreitzer, G.M. The interdisciplinary career of a popular construct used in management: Empowerment in the late 20th century. J. Manag. Inq. 2006, 15, 255–273. [Google Scholar] [CrossRef]
  19. Blau, J.R.; Alba, R.D. Empowering Nets of Participation. Adm. Sci. Q. 1982, 27, 363–379. [Google Scholar] [CrossRef]
  20. Conger, J.A.; Kanungo, R.N. The empowerment process: Integrating theory and practice. Acad. Mamag. Rev. 1988, 13, 471–482. [Google Scholar] [CrossRef]
  21. Davis, K.; Newstrom, J. Comportamiento humano en el trabajo; McGraw Hill: Mexico City, Mexico, 2000. [Google Scholar]
  22. Menon, S.T. Employee empowerment: An integrative psychological approach. Appl. Psychol. 2001, 50, 153–180. [Google Scholar] [CrossRef]
  23. Molina, R. Empowerment ¿actitud mental?, ¿técnica?, ¿estrategia? o ¿moda? Trillas: Benito Juárez (CDMX), México, 2006. [Google Scholar]
  24. Buelga, S. El empowerment: La potenciación del bienestar desde la psicología comunitaria. In Gil-Lacruz, M. (Dir), Psicología Social y Bienestar: Una Aproximación Interdisciplinary; Prensas Universitarias de Zaragoza: Zaragoza, Spain, 2007. [Google Scholar]
  25. Chee, H.E.; Zheng, H.L.; Kumar, R.; Ramendran, C.; Kadiresan, V. An Effectiveness of Human Resource Management Practices on Employee Retention in Institute of Higher learning: A Regression Analysis. Inter. J. Bus. Res. Manag. 2012, 2, 60–79. [Google Scholar]
  26. Thomas, K.W.; Velthouse, B.A. Cognitive elements of empowerment: An “interpretative” model of intrinsic task motivation. Acad. Manag. Rev. 1990, 15, 666–681. [Google Scholar]
  27. Ríos-Manríquez, M.; López-Mateo, C.; Sánchez-Fernández, M.D. El capital humano como factor clave en el desempeño empresarial: Una visión desde el empowerment. Revista de Gestão e Secretariado 2019, 10, 69–88. [Google Scholar]
  28. Villa, H.O.; Márquez, M.B.L. Relación del empowerment con el compromiso organizacional influenciado por el capital humanoy prácticas de alto involucramiento de empleados en maquiladoras automotrices. Glob. Conf. Bus. Financ. Proc. 2016, 11, 855–867. [Google Scholar]
  29. Cardona, M.; Montes, C.; Vásquez, J.; Villegas, M.; Brito, T. Capital Humano: Una Mirada Desde la Educación y la Experiencia Laboral; Universidad EAFIT: Medellín, Colombia, 2007. [Google Scholar]
  30. Castillo, R. Desarrollo del Capital Humano en las Organizaciones; Primera edición; Red Tercer Milenio: Estado de México, México, 2012. [Google Scholar]
  31. Alama, E.M. Capital Intelectual y Resultados Empresariales en las Empresas de Servicios Profesionales de España/Intellectual Capital and Business Results in Professional Services Companies in Spain. Ph.D. Thesis, Universidad Complutense de Madrid, Madrid, Spain, 2008. [Google Scholar]
  32. Barney, J.B. Firm resources and sustained competitive advantage. J. Manag. 1991, 17, 99–120. [Google Scholar] [CrossRef]
  33. Peteraf, M.A. Thecornerstones of competitiveadvantage: A resource-basedview. Strategic Manag. J. 1993, 14, 179–192. [Google Scholar] [CrossRef]
  34. Hernández, N.H.; Sánchez Tovar, Y.; Lavín Verástegui, J. Identificación de las capacidades empresariales como factor generador de la competitividad en el sector hotelero de la ciudad de Victoria, México. Revista de Investigación Administrativa 2014, 113, 78–94. [Google Scholar]
  35. Álvarez, L. Competencias centrales y ventaja competitiva: El concepto, su evolución y su aplicabilidad. Revista de Contaduría y Administración 2003, 209, 5–22. [Google Scholar]
  36. Petit, T.E.E.; Gutiérrez, G.L.B. Liderazgo con Empowerment: Promotor de la innovación. Revista Venezolana de Gerencia 2007, 12, 207–217. Available online: http://ve.scielo.org/scielo.php?script=sci_arttext&pid=S1315-99842007000200004&lng=es&tlng=es (accessed on 30 August 2019).
  37. Quigley, J. Visión. Como la Desarrollan los Líderes, la Comparten y la Sustentan; Mc Graw Hill: Bogotá, Colombia, 1997. [Google Scholar]
  38. De Talavera, D.M.; De Condoré, I. Empowerment como estrategia empresarial en organizaciones sociales. México SINNCO 2010, 1–26. Available online: https://docplayer.es/13388686-Empowerment-como-estrategia-empresarial-en-organizaciones-sociales.html#show_full_text (accessed on 30 August 2019).
  39. North, D. Institutions, Institutional Change and Economic Performance, 1st ed.; Cambridge University Press: Cambridge, UK, 1990. [Google Scholar]
  40. Urbano, D.; Díaz, C.; Hernández, R. Evolución y principios de la teoría económica institucional: Una propuesta de aplicación para el análisis de los factores condicionantes de la creación de empresas/Evolution and principles of institutional economic theory: An application proposal for the analysis of the conditioning factors of business creation. Revista de Investigaciones Europeas de Dirección y Economía de la Empresa 2007, 13, 183–198. [Google Scholar]
  41. Grant, R. Prospering in dynarnically-competitive environrnents: Organizational capability as knowledge integration. Organ. Sci. 1996, 7, 109–122. [Google Scholar] [CrossRef]
  42. Geovany, C.G.; Martinez, L.B.; Vigier, H.P.; Nuñez, J.J. El rol del Empowerment en el Exito Empresarial. Investigación Administrativa 2016, 117, 23–37. [Google Scholar]
  43. Cardona, S. Intrategia: Una Dimensión Básica de la Cultura Empresarial; Álvarez de Mon, C.S., Chinchilla, A., Millar, E., Pérez, L., Pin, A., Poelmans, I., Rodríguez, L., Rodríguez, P., Torres, A., Eds.; Paradigmas de Liderazgo; McGraw-Hill Interamericana de España, S.A: Madrid, Spain, 2001. [Google Scholar]
  44. Spreitzer, G. Taking stock: A review of more than twenty years of research on empowerment at work1. In Organizational Behavior; SAGE Publications Ltd.: London, UK, 2008; pp. 54–72. [Google Scholar] [CrossRef] [Green Version]
  45. Codina, A. Tendencias del Management contemporáneo. In Proceedings of the Conferencia impartida en I Evento Nacional de Gestión Empresarial, Holguín, Cuba, 27 June 2008. [Google Scholar]
  46. Lincoln, N.D.; Travers, C.; Ackers, P.; Wilkinson, A. TheMeaning of Empowerment: Theinterdisciplinaryetymology of a new management concept. Int. J. Manag. Rev. 2002, 4, 1–20. [Google Scholar] [CrossRef] [Green Version]
  47. Prati, G.; Zani, B. The relationship between psychological empowerment and organizational identification. J. Community Psychol. 2013, 41, 851–866. [Google Scholar] [CrossRef]
  48. Ghosh, A.K. EmployeeEmpowerment: A Strategic Tool to Obtain Sustainable Competitive Advantage. Int. J. Manag. 2013, 30, 95–107. [Google Scholar]
  49. Alles, M. Dirección Estratégica de Recursos Humanos Gestión por Competencias; Granica: Ciudad de México, México, 2010. [Google Scholar]
  50. Jaffe, D.T.; Scott, C.D. Empowerment; Oxford University Press: Ciudad de México, México, 2007. [Google Scholar]
  51. Murari, K.; Gupta, K.S. Impact of servant leadership on employee Empowerment. J. Strateg. Hum. Resour. Manag. 2012, 1, 28–37. [Google Scholar]
  52. Chen, G.; Kirkman, T.A.; Kirkman, B.L.; Zhang, P.; Lemoine, G.J.; Farh, J.L. Multiple Team Membership and Empowerment Spillover Effects: Can Empowerment Processes Cross Team Boundaries? J. Appl. Psychol. 2019, 104, 321–340. [Google Scholar] [CrossRef]
  53. Miquilena, D.; Portillo, I.M. Empowerment como Estrategia Empresarial en Organizaciones Sociales. México SINNCO. 2010. Available online: http://www.concyteg.gob.mx/formulario/MT/MT2010/MT13/SESION2/MT132_DMIQUILENAT_222.pdf (accessed on 30 August 2019).
  54. Shedid, M. Employee Empowerment and Customer Satisfaction: An Investigation from a UAE Banking-Sector Perspective. Ph.D. Thesis, Robert Gordon University, Aberdeen, UK, 2019. [Google Scholar]
  55. Quinn, R.E.; Spreitzer, G.M. The road to empowerment: Seven questions every leader should consider. Organ. Dyn. 1997, 26, 37–49. [Google Scholar] [CrossRef]
  56. Kanter, R.M. Men and Women of the Corporation; Basic Books: New York, NY, USA, 1993. [Google Scholar]
  57. Siegall, M.; Gardner, S. Contextual factors of psychological empowerment. Pers. Rev. 2000, 29, 703–722. [Google Scholar] [CrossRef]
  58. Spreitzer, G.M. Toward a common ground in defining empowerment. Res. Organ. Chang. Dev. 1997, 10, 31–62. [Google Scholar]
  59. Tymon, W.G. An Empirical Investigation of a Cognitive Model of Empowerment. Ph.D Thesis, Temple University, Philadelphia, PA, USA, 1988. [Google Scholar]
  60. Jones, G.R. Socialization tactics, self-efficacy, and newcomers’ adjustments to organizations. Acad. Manag. J. 1986, 29, 262–279. [Google Scholar]
  61. Hackman, J.R.; Oldham, G.R. Development of the job diagnostic survey. J. Appl. Psychol. 1975, 60, 159–170. [Google Scholar] [CrossRef] [Green Version]
  62. Ashforth, B.E.; Mael, F. Social identity theory and the organization. Acad. Manag. Rev. 1989, 14, 20–39. [Google Scholar] [CrossRef]
  63. Foster-Fishman, P.G.; Salem, D.A.; Chibnall, S.L. Empirical support for the critical assumptions of empowerment theory. Am. J. Community Psychol. 1998, 26, 507–536. [Google Scholar] [CrossRef]
  64. Zaki, S.M.; Mohammed, E.A. Psychological Empowerment and Its Relation with Organizational Loyalty Among First Line Managers. J. Health Med. Nurs. 2018, 49, 122–131. [Google Scholar]
  65. Laschinger, H.K.S.; Finegan, J.; Shamian, J.; Wilk, P. Impact of structural and psychological empowerment on job strain in nursing work settings: Expanding Kanter’s model. J. Nurs. Adm. 2001, 31, 260–272. [Google Scholar] [CrossRef] [PubMed] [Green Version]
  66. Laschinger, H.; Finegan, J.E.; Shamian, J.; Wilk, P. A longitudinal analysis of the impact of workplace empowerment on work satisfaction. J. Organ. Behaiv. 2004, 25, 527–544. [Google Scholar] [CrossRef]
  67. Zimmerman, M. Empowerment theory. Handbook of Community Psychology; Rappaport, J., Seidman, E., Eds.; Kluwer: New York, NY, USA, 2000; pp. 43–63. [Google Scholar]
  68. Greco, P.; Laschinger, H.K.S.; Wong, C. Leader empowering behaviours, staff nurse empowerment and work engagement/burnout. Nurs. Leadersh. 2006, 19, 41–56. [Google Scholar] [CrossRef]
  69. Mendoza, M.; León, J.C.; Orgambídez, A.; Borrego, Y. Evidencias de validez de la adaptación española de la Organizational Empowerment Scale. Revista de Psicología del Trabajo y de las Organizaciones 2009, 25, 17–28. [Google Scholar] [CrossRef]
  70. Monje, A.; Abeal, J.P.; Faíña, J.A. Transformational leadership and work engagement: Exploring the mediating role of structural empowerment. Eur. Manag. J. 2020, 38, 169–178. [Google Scholar] [CrossRef]
  71. Gupta, R.K.; Kumar, C.; Sharma, R. Team building, employee empowerment and employee competencies: Moderating role of organizational learning culture. Eur. J. Train. Dev. 2019, 43, 39–60. [Google Scholar]
  72. Silén, M.; Skytt, B.; Engström, M. Relationships between structural and psychological empowerment, mediated by person-centred processes and thriving for nursing home staff. Geriatr. Nurs. 2019, 40, 67–71. [Google Scholar] [CrossRef]
  73. Singh, M.; Sarkar, A. Role of psychological empowerment in the relationship between structural empowerment and innovative behavior. Manag. Res. Rev. 2019, 42, 521–538. [Google Scholar] [CrossRef]
  74. Konczak, L.J.; Stelly, D.J.; Trusty, M.L. Defining and Measuring Empowering Leader Behaviors: Development of an Upward Feedback Instrument. Educ. Psychol. Meas. 2000, 60, 301–313. [Google Scholar] [CrossRef]
  75. Orgambídez-Ramos, A.; Borrego-Alés, Y.; Ruiz-Frutos, C. Empowerment, vulnerabilidad al estrés y burnout en enfermeros portugueses. Ciência Saúde Coletiva 2018, 23, 259–266. [Google Scholar]
  76. Patterson, G.M.; West, A.M.; Wall, D.T. Integrated manufacturing, empowerment, and company performance. J. Organ. Behav. 2004, 25, 641–665. [Google Scholar] [CrossRef]
  77. Schneider, J.K.; Dowling, M.; Raghuram, S. Empowerment as a success factor in start-up companies. Rev. Manag. Sci. 2007, 1, 167–184. [Google Scholar] [CrossRef]
  78. Siyamtinah, H.S. Innovation capability of SMEs through entrepreneurship, marketing capability, relational capital and empowerment. Asia Pac. Manag. Rev. 2016, 21, 196–203. [Google Scholar]
  79. Suárez-Vélez, H.D. Empowerment como Estrategia Gerencial para Mejorar la Efectividad Laboral. Revista Científica FIPCAEC Fomento De La Investigación Y Publicación En Ciencias Administrativas, Económicas Y Contables 2017, 2, 64–81. [Google Scholar]
  80. Mendoza Sierra, M.I.; Orgambídez-Ramos, A.; Borrego Ales, Y.; Gonçalves, G.; Santos, J. Translate into Spanish of the Conditions for Work Effectiveness Questionnaire (CWEQ II). Universitas Psychologica 2014, 13, 923–934. [Google Scholar]
  81. Stander, M.W.; Rothmann, S. Psychological empowerment, job insecurity and employee engagement. SA J. Ind. Psychol. 2010, 36, 1–8. [Google Scholar] [CrossRef]
  82. Blanchard, K. Empowerment, 3 Claves Para Lograr que el Proceso de Facultar a los Empleados Funcione en su Empresa; Norma Ediciones: Ciudad de México, México, 2007. [Google Scholar]
  83. Saengchai, S.; Siriattakul, P.; Jermsittiparsert, K. Exploring the link between HRPractices, Employee Motivation, Employee Empowerment and Employee Performance in Engineering Firms of Indonesia. Int. J. Psychosoc. Rehabil. 2019, 23, 734–747. [Google Scholar] [CrossRef]
  84. Saleem, M.A.; Bhutta, Z.M.; Nauman, M.; Zahra, S. Enhancing performance and commitment through leadership and empowerment: An emerging economy perspective. Int. J. Bank Mark. 2019, 37, 303–322. [Google Scholar] [CrossRef]
  85. Lu, Y.; Wang, Y.; Yin, Y. Why firms adopt empowerment practices and how such practices affect firm performance? A transaction cost-exchange perspective. Hum. Resour. Manag. Rev. 2019, 29, 111–124. [Google Scholar]
  86. Sáenz, M. Impacto de la capacitación en la mejora de la productividad en una planta de lubricantes. Crescendo 2017, 8, 93–105. [Google Scholar] [CrossRef]
  87. Viñán-Villagrán, J.A.; García-Liut, E.G.; Caicedo-Benavides, F.U. Incidencia del sistema de compensación en el desempeño laboral de los colaboradores de la Corporación Nacional de Telecomunicaciones. Dominio de las Ciencias 2020, 6, 740–762. [Google Scholar]
  88. Daily, B.F.; Bishop, J.W.; Massoud, J.A. The role of training and empowerment in environmental performance: A study of the Mexican maquiladora industry. Int. J. Oper. Prod. Manag. 2012, 32, 631–647. [Google Scholar] [CrossRef]
  89. Nnaemek, A.A.; Okoro, A.; Rejoice, O.E. capacitación tiene un efecto significativo sobre la productividad en las organizaciones manufactureras. Int. J. Adv. Res. Manag. Soc. Sci. 2019, 8, 30–48. [Google Scholar]
  90. Orgambídez-Ramos, A.; Moura, D.; Almeida, H.D. Estrés de rol y empowerment psicológico como antecedentes de la satisfacción laboral. Rev. Psicol. 2017, 35, 257–278. [Google Scholar] [CrossRef] [Green Version]
  91. Santos, J.; Gonçalves, G.; Orgambídez-Ramos, A.; Mendoza-Sierra, M.I.; Borrego-Alés, Y. Estudo de adaptação da escala de empowerment psicológico de Spreitzer (1995) numa amostra portuguesa. Aval. Psicol. 2014, 13, 56–61. [Google Scholar]
  92. DENUE Directorio Estadístico Nacional de Unidades Económicas. Instituto Nacional de Estadística y Geografía (INEGI). DENUE Interactivo. 2018. Available online: https://www.inegi.org.mx/app/mapa/denue/ (accessed on 30 August 2019).
  93. Aguirre-Urreta, M.I.; Hu, J. Detecting Common Method Bias: Performance of the Harman’s Single-Factor Test. ACM SIGMIS Database DATABASE Adv. Inf. Syst. 2019, 45–70. [Google Scholar] [CrossRef]
  94. Sahoo, M. Structural Equation Modeling: Threshold Criteria for Assessing Model Fit. In Methodological Issues in Management Research: Advances, Challenges, and the Way Ahead; Subudhi, R.N., Mishra, S., Eds.; Emerald Publishing Limited: London, UK, 2019; pp. 269–276. [Google Scholar]
  95. Sánchez, P.M.; Sarabia, S.F.J. Validez y fiabilidad de escalas. Metodología Para la Investigación en Marketing y Dirección de Empresas; Sarabia, S.F.J., Ed.; Pirámide: Madrid, Spain, 1999; pp. 363–393. [Google Scholar]
  96. Albarrán, V.; Geldres, V.; Paredes, P.; Ramirez, O.; Ruiz, F.; Palomino, C. Validación de la batería de instrumentos para la evaluación de factores de riesgo psicosocial. Horizonte Médico 2018, 18, 59–67. [Google Scholar]
  97. George, D.; Mallery, P. SPSS/PC + Step by: A Simple Guide and Reference, 4th ed.; Allyn & Bacon: Boston, MA, USA, 1995. [Google Scholar]
  98. Hair, J.F.; Black, W.C.; Babin, B.J.; Anderson, R.E. Multivariate Data Analysis, 7th ed.; Pearson Education Limited: London, UK, 2014. [Google Scholar]
  99. Mavrou, I. Análisis factorial exploratorio: Cuestiones conceptuales y metodológicas. Revista Nebrija de Lingüística Aplicada 2015, 2015, 1–10. [Google Scholar]
  100. Byrne, B.M. Structural Equation Modeling with Lisrel, Prelis, and Simplis: Basic Concepts, Applications, and Programming; Psychology Press: London, UK, 2013. [Google Scholar]
  101. Homburg, C.H.; Pflesser, C.H. A multiple liar model market-oriented organizational culture: Measurement issues and performance outcomes. J. Mark. Res. 2000, 37, 449–462. [Google Scholar] [CrossRef]
  102. Bagozzi, P.R.; Yi, Y. Specification, evaluation, and interpretation of structural equation models. J. Acad. Mark. Sci. 2012, 40, 8–34. [Google Scholar] [CrossRef]
  103. McNeish, D.; An, J.; Hancock, G.R. The Thorny Relation between Measurement Quality and Fit Index Cutoffs in Latent Variable Models. J. Personal. Assess. 2018, 100, 43–52. [Google Scholar] [CrossRef]
  104. Maydeu-Olivares, A.; Shi, D.; Rosseel, Y. Assessing Fit in Structural Equation Models: A Monte-Carlo Evaluation of RMSEA Versus SRMR Confidence Intervals and Tests of Close Fit. Struct. Equ. Modeling Multidiscip. J. 2018, 3, 389–402. [Google Scholar] [CrossRef]
  105. Reeve, B.B.; Hays, R.D.; Bjorner, J.B.; Cook, K.F.; Crane, P.K.; Teresi, J.A.; Cella, D. Psychometric evaluation and calibration of health-related quality of life item banks: Plans for the Patient-Reported Outcomes Measurement Information System (PROMIS). Med. Care 2007, 45, S22–S31. [Google Scholar] [CrossRef]
  106. Varela-Mallou, J.; Lévy-Mangin, J.P. Modelización con Estructuras de Covarianzas en Ciencias Sociales. In Temas Esenciales, Avanzados y Aportaciones Especiales; Netbiblo: Madrid, Spain, 2006. [Google Scholar]
  107. Thoemmes, F.; Rosseel, Y.; Textor, J. Local fit evaluation of structural equation models using graphical criteria. Psychol. Methods 2018, 23, 27–41. [Google Scholar] [CrossRef] [Green Version]
  108. Saengchai, S.; Siriattakul, P.; Jermsittiparsert, K. HR Practices, Overall Satisfaction and Employee Loyalty: Does Corporate Social Responsibility Matter in Mining firms of Indonesia? Int. J. Psychosoc. Rehabil. 2019, 23, 763–779. [Google Scholar] [CrossRef]
Figure 1. Model 1, single factor.
Mathematics 08 01817 g001
Figure 2. Model 4, 1st order model.
Mathematics 08 01817 g002
Figure 3. Model 5 of second-order factor structure of the empowerment scale.
Mathematics 08 01817 g003aMathematics 08 01817 g003b
Table 1. Description of the Matrices in the CFA Model of 1st Order and 2nd Order.
MatrixParameterDimensionsCovariancesDimensionsDescription
ξξ (ksi)n × 1Φ = E (ξξ´)n × nExogenous latent variables
Xxq × 1∑ = E ( X X ´)q × qExogenous observable variables
Λx
Λy
λ (lambda)q × n
p × m
----Factor loads of X on ξ
Factor loads of Y on η
δδ (delta)q × 1Θδ = E (δδ´)q × qX measurement errors
ηη (eta)m × 1Cov(η) = E (ηη´)m × mEndogenous latent variables
ζΖ (zeta)m × 1Ψ = E (ζζ´)m × mMeasurement errors of η
BΒ (beta)m × m----Direct effects of η on η
ΓΓ (gamma)m × n----Direct effects of ξ on η
YYp × 1E (YY´)p × pEndogenous observable variables
εΕ (epsilon)p × 1Θε = E (εε´)p × pMeasurement errors of Y
Source: [106] (pp. 124, 240).
Table 2. Descriptive Findings and Exploratory Factor Analysis (Reliability and Validity of Scales).
ConstructsScale Items 1Correlation Item-TotalMeanStandard
Deviation
Exploratory Factor Analysis
(Loadings)
Factor 1Factor 2
Empowerment
(α Cronbach: 0.870)
EM10.4825.600.8750.821
0.847
0.839
0.732
0.687
0.614
0.794
0.818
0.758
0.595
0.709
0.532
--
--
0.475
EM20.5105.440.943
EM30.5505.590.801
EM40.6295.470.822
EM50.6125.410.795
EM60.6115.410.795
EM70.6394.811.111
EM80.5384.641.209
EM90.4834.771.165
EM100.5485.081.003
EM110.324.811.008
EM120.5435.211.021
EM13Eliminated4.421.537
EM14Eliminated4.311.512
EM150.4795.151.029
EM16Eliminated4.011.549
EM17Eliminated4.691.338
EM18Eliminated4.201.738
EM19Eliminated4.331.671
Own value 3.8203.603
% factor explained variance29.38427.718
% cumulative explained variance29.38457.102
Bartlett’s test of Sphericity
Kaiser–Meyer–Oklin index 2
χ2(sig.): 1396.883 (0.000); KMO: 0.844; Measure of simple adequacy: (0.897–0.918);
% variance: 57.102
1 The names of the items listed in this table have been shortened in order to simplify the results. 2 Tests that show the data obtained through the questionnaire are adequate to perform the factor analysis (requirements: Bartlett’s Sphericity Test, χ2 (sig. > 0.05), Kaiser’s Measurement Adequacy Test-Meyer–Oklin (KMO) > 0.8bueno, MSA index = unacceptable for values below 0.5). Source: Authors’ own data.
Table 3. Fit Index for Empowerment Scale.
Modelsχ2dfχ2(df)PGFIAGFITLICFIRMSEAPRATIO
Model 1—(1 variable—13 items)590.438659.0840.0000.6110.5080.5340.6110.1910.833
Model 2—1st order (2 oblique factors—13 items)331.406645.1780.0000.7920.7040.7590.8020.1370.821
Model 3—1st order (2 orthogonal factors—13 items)368.100655.6630.0000.7840.6980.7310.7760.1450.833
Model 4—1st order (Model 2 re-specified- 2 variables—13 items)100.714581.7360.0000.9370.9020.9580.9680.0580.744
Model 5—2nd order (3 variables—13 items)94.1485716520.0010.9410.9050.9620.9730.0540.731
Source: Authors’ own data.
Publisher’s Note: MDPI stays neutral with regard to jurisdictional claims in published maps and institutional affiliations.

