Abstract
With rapid economic development and restructuring, the number of old or obsolete buildings is growing in large cities. Construction practice has actively focused in recent decades on the regeneration of brownfield areas and creating opportunities for their cost-effective and sustainable reuse. Some of the buildings could be identified as-built industrial heritage whose purpose could be modified and used differently. Adaptive reuse can make a major contribution to sustainable development by reducing construction waste and saving natural resources. In the reuse management process, the problem is how to deal with multiple criteria that are imposed as factors in assessing the reuse of a building. Using the adjusted fuzzy analytical hierarchy process (FAHP), we explore the potential for the adaptation and new use of industrial buildings in the former area of Electronic Industry Nis (EI Nis) in Serbia. The standard FAHP, in which we determine the weights of each sub-criterion based on the expert’s evaluation, we adjusted for use when no pairwise comparison of existing alternatives was available. Multiple criteria evaluation was performed by applying many criteria and sub-criteria, taking into account the different spatial and physical performance of buildings, as well as their locational indicators. A case study is used to demonstrate the application of the method and show its effectiveness.
1. Introduction
A variety of reasons led to the abandonment of buildings, but the descent of the manufacturing process and increase in demand for the service sector are among the significant ones. These buildings can be visual landmarks of the modern environment and have architectural or historical value suitable for attracting tourists and investment, which enhances social and economic benefits and enables the recognition of the city. The procedure of preserving industrial built heritage has developed firstly to use the social, cultural, and economic advantage of their location while attracting domestic and foreign investment, tourists, and the local population. The renovation of buildings, including changing or rearranging existing surroundings, together with the set of measures involved in the adaptive reuse process, for the past two decades, has played a big role in the process of sustainable change of industrial heritage. Following the functional, technical, constructive, and aesthetic requirements of new uses, a set of measures and activities have been needed to transform the existing architectural structure [1]. Industrial facilities were primarily created to place large machines jointly with manufacturing equipment that occupy significant spatial capacity which, together with constructional characteristics, has an undoubted significance in the determination of property value in the process of modifying buildings for different purposes. The adaptive reuse of buildings, as a concept developed with the promotion of sustainability, offers great opportunities in the field of architectural design, to extend the life of buildings that are no longer in use [2,3,4,5,6]. For the research in this subject area, 19 characteristic industrial buildings were selected, whose structures differ significantly (Figure 1).
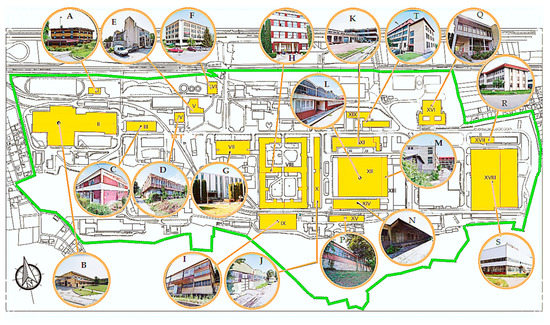
Figure 1.
Maps of the Electronic Industry Complex with marked facilities, by letters A to S, as alternatives for future redevelopment.
Selecting industrial buildings that are best suited for functional redevelopment is a complex and multidimensional problem that needs to take into account the different physical characteristics of their structures as well as different site parameters. Multi-criteria decision making (MCDM) is a useful tool for suggesting solutions for problems under the presence of many decision criteria. There are lots of methods used for solving MCDM problems in the literature. The fuzzy analytic hierarchy process (FAHP), which enables the analyst to convert linguistic definitions into mathematical expressions, is one of the most used MCDM methods due to its practical application [7]. The approach based on uniting the fuzzy and rough approaches may take into account the advantages of both concepts [8]. The different forms of fuzzy numbers are used depending on the nature of the problem [9].
The considered problem is complex, as it contains several levels of criteria and sub-criteria. We chose the AHP method because it allows the decomposition of a complex problem into several parts. It was difficult for the experts to opt for numerical grades 1–9, so the direct use of AHP methods was difficult, thus we opted for the fuzzy approach, which allowed the experts to give descriptive grades.
The paper deals with the case study of the Electronic Industry in Nis, Serbia, and to identify the buildings within the industrial complex with the highest potentials for future reuse. This paper aims to rank alternatives to recognize the most suitable buildings for adaptation. The methodology framework for this study was formulated in three main stages: (1) determining the criteria and sub-criteria that point out the adaptability of abandoned industrial buildings, (2) evaluation of the current conditions in EI Nis, and (3) determining the most adequate buildings for their possible adaptive reuse.
A large number of buildings represent industrial architecture from the modern and postmodern periods. Inadequate maintenance has compromised their identity, and the question arises of their future maintenance. Several buildings have been classified as significant due to the aesthetic values they possess. A case study consisting of nineteen alternatives illustrates the effectiveness of the proposed approach. Many authors show a unique and appropriate solution to the problem of adapting old buildings to modern use [10,11]. There are many references in the literature concerning the application of the AHP and other methods for MCDM in the construction industry and construction project management [12]. Sustainable decision-making in civil engineering, construction, and building technology is based on fundamental scientific achievements and can be supported by MCDM approaches [13,14].
The paper is organized as follows. Following the Introduction, Section 2 presents a literature review concerning reused buildings with multi-criteria methods. Section 3 consists of two subsections, namely the methodology and the introduction of indicators. Section 4 gives results with the adjusted FAHP methods. In Section 5, the discussion is presented based on the obtained results related to the ranking of buildings in the EI complex Nis for reuse. Section 6 concludes this study and puts forth some topics for a future investigation.
2. Related Works
There are a lot of methods available for supporting complex decisions in construction. Decision-making in this field can be facilitated by an application of multi-criteria decision-making. Previous research papers show that various multi-criteria methods can produce different ranking results. The need for improving and supplementing the methodology of compromise decisions arose. Proper decisions by architects and civil engineers may reduce different risks. Today, there are more and more initiatives aimed at revitalizing degraded urban areas with an emphasis on brownfield areas and industrial facilities. In the literature, there exist different methods for estimation of the reuse process of abandoned buildings, among which MCDM methods stand out. Because there are constantly evolving, new methods appearing and numerous modifications to the existing ones, as well as for enveloping various techniques and mathematical tools, MCDM methods can constitute a universal tool for supporting the decision-making processes in architecture, urban planning, and construction [15,16,17]. Identifying assessment indicators related to the selected social, economic, spatial, or environmental aspects for neglected areas in the city were discussed by Bielinskas et al. and Chen et al. [18,19]. Special attention has been paid to secondary uses for historic buildings [20], taking into account selected economic, social, cultural, environmental, and historical-architectural aspects. The fuzzy approach provides a solution to integrate opinions from various parties for demonstrating the application of the fuzzy adaptive reuse selection model. A private 15-story industrial building completed in the 1980s and located in Hong Kong is selected as a case study to illustrate the application of the fuzzy adaptive reuse selection model [21]. Most of the existing literature reviews published in the area of heritage with MCDM have been summed up by Morkūnaitė et al. in their paper [22]. Zavadskas et al. [23,24] have published research in two parts on MCDM in construction. Different applications of MCDM methods in heritage buildings have been discussed in papers [25,26,27,28]. Decision-making methodologies for the reuse of industrial or historic buildings are discussed in [29,30].
This paper contributes to the existing FAHP method-based literature in several aspects. First, we introduce an adjusted fuzzy AHP approach based on the triangular fuzzy numbers to select the most adequate buildings for reuse. Second, we provide a large scale of forty-six different spatial and location-related indicators on the base of which the team of experts will determine the suitable ones from the nineteen buildings in the former Electronic Industry, Nis.
3. Materials and Methods
3.1. Methodology
The EI Nis complex is located on approximately a total area of 55ha and is located in the eastern suburban industrial zone of Nis. The city of Nis, the third-largest city in Serbia, was a powerful industrial center in the former Yugoslavia. The factory has founded in 1948, and the largest economic activity was achieved in 1980 when close to thirty thousand workers were employed. In the 1990s, political and economic changes, the embargo, and the obsolescence of technology contributed to the complex’s 2009 staff of only a hundred. Attempts to restart production by selling businesses in 2014 have failed, and local authorities have integrated the EI complex into the urban structure of the city. The Detailed Regulation Plan (PDR, 2014) provided a plan to remodel the factory complex as a special city area [31]. With this plan, the complex has divided into individual buildings and associated plots, and the transport network became part of the public infrastructure. Only half of the total area has been sold so far, while the rest is abandoned, and brownfield regeneration has not been considered successful [32]. There are currently over one hundred registered companies in various categories, such as education, manufacturing, catering, services, and storage, but a large number of facilities are still abandoned or have a temporary purpose. The EI Nis complex consists of mostly free-standing buildings, connected by a system of streets, smaller plates, and green surfaces. As the complex has evolved over a long period, it has buildings of very different characteristics, from single-story to multi-story production facilities, concrete, and steel, to masonry buildings. They are different in terms of shape, composition, dimension, architectural expression, and degree of preservation.
The problem of choosing the best assessment for the selection of criteria/indicators has been solved by applying multi-criteria decision-making methods, which have a significant role in all segments of life. The analytic hierarchy process (AHP) is a multi-criteria method that supports decision making with colliding criteria and alternatives. The AHP was constructed by Thomas L. Saaty in the early 1980s and assiduously studied and improved through various scientific papers [33,34,35]. The AHP method has based on the following axioms:
- Reciprocity axiom: If element A is n times more significant than element B, then the element B is 1/n times more significant than the element A.
- Homogeneity axiom: Comparison only makes sense if the elements are comparable.
- Dependency axiom: Allows the comparison among the group of criteria of one level with the criteria of a higher level. Comparisons at lower levels depend on the elements of a higher level.
- Axiom of expectations: Any change in the structure of the hierarchy requires recalculating priorities in the new hierarchy.
According to methodology, one can say that AHP is a technique organized on the decomposition of a complex problem into a ranking order where the goal is at the top of the hierarchy, and the criteria, sub-criteria, and alternatives are at lower levels. AHP is a soft method that enables complex problems with many criteria and alternatives to relatively easily find a relationship between the influencing factors, determine their relative influence and importance in practical applications, as well as the dominance of one indicator over another. The most significant characteristic of the AHP method is that the decision-makers review deciding issues as elements that have a mutual hierarchical relationship. The highest level of this hierarchy is the main aim of the decision-maker. The main objectives are subordinate to the criteria that are important in decision making. The AHP method is of great importance for comparison by pairs of elements in the hierarchy of goal, criteria, and alternatives. The comparison of the elements in pairs, which adopts the top-down direction, forms a square comparison matrix where is a total of comparisons, discovers the importance of a specific criterion in comparison to another. Since it is accepted that one cannot simultaneously compare more than seven objects (plus or minus 2) [36], Saaty defined the scale that consists of 17 discrete values with the highest value 9 and the lowest value 1/9. Values from scale are symmetric to 1 and can be divided into two intervals, the uniformly distributed one [1,9] and the non-uniform distributed one .
For matrix we calculate the consistency index CI and consistency ratio CR
where represents the maximal eigenvalue of matrices and a known random index (Table 1). We can determine whether the comparison matrix is consistent. If in the comparison matrix is , then the estimates of the relative importance of the criteria are counted as acceptable.

Table 1.
Table of Random Index Numbers.
In the application of the crisp AHP method, there is a certain level of uncertainty of experts in determining the pairwise comparison matrix [37,38,39]. Even when there is only one expert, one cannot always be sure how to, using number value, express the opinion of the importance of one criterion in comparison to another. Should an expert put the value or if one element is weakly dominant to another? If there are values and , how can one put the value , when Saaty’s scale ends with 9? If there are more experts, these problems become more dominant. For these reasons, it is necessary to introduce the possibility of working with uncertain data in the AHP method [40,41].
Since the theory of fuzzy sets has proposed by Zadeh in 1965, it has been used for guidance of fuzzy decision-making problems. Originally, fuzzy sets were introduced with the basic goal that the uncertainty and imprecision in linguistics are represented and constructed in a mathematically determined way, and sets defined this way can be recognized as a generalization of classical set theory [42,43,44]. This enables the decision-maker to organize partially unknown or incomplete information in the decision model [45,46]. The basic idea of fuzzy sets is very straightforward in the classical (crisp, non-fuzzy) sets an element, a member of the universal set, either belongs or does not belong to a defined set. Considering the previous, one can say that the fuzzy set is a generalization of the classical set, and the membership of an element can be characterized by a number from interval [0,1]. The membership function (MF) of a fuzzy set, usually denoted by μ, maps each element of the universal set in this real number interval. Unlike the classical (crisp) sets, the fuzzy set has an infinite number of different membership functions, which can describe it, allowing a huge possibility of adjustment and application.
Let represents all fuzzy sets defined on the set of real numbers and let . The number [47] is a fuzzy number if there exists so it holds and for every , is a closed interval. To define a triangle fuzzy number M, it is required for the membership function to be a function , defined as
where inequality holds. Numbers and are the lower, middle, and upper value of the support and the modal value of respectively. When , it is a crisp number. In the sequel, the triangular fuzzy number will be denoted by The main operational laws for two triangular fuzzy numbers and and scalar , [48,49] are shown in Table 2.
Table 2.
Common fuzzy arithmetic operations using TFNs.
Besides the membership function (2), we will state the most commonly used membership functions: trapezoidal membership function, Gaussian curve membership function, and the Bell curve membership function, respectively:
Mathematical expressions describing membership functions (2) and (3) have presented in Figure 2. The colors green, red, orange and blue illustrate a triangular MF defined by triangular number = (0, 50, 100) a trapezoidal MF defined by trapezoidal number (a, b, c, d) = (0, 30, 70, 100), the Gaussian MF (σ = 4, c = 50) and a generalized Bell MF (b = 1, a = 4, c = 50), respectively.
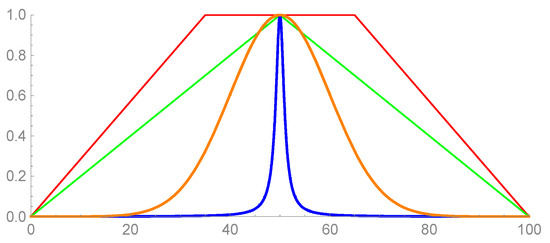
Figure 2.
The most commonly used membership functions.
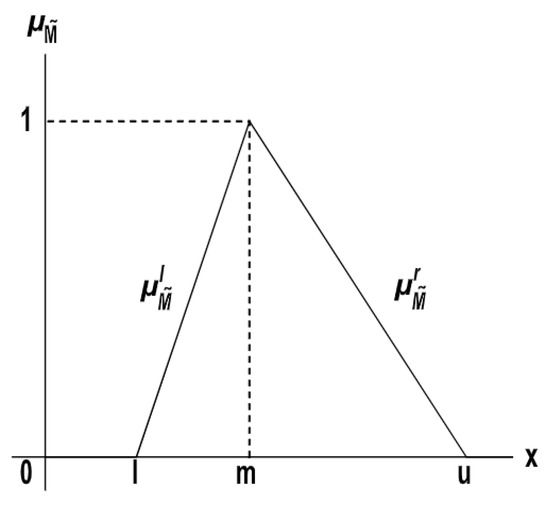
Figure 3.
The representation of a triangular membership function.
On the Figure 3, = and = are left and right side of membership function, respectively. Their corresponding inverse functions are
Using Equations (4), one can obtain left and right integral values of the triangular fuzzy number
and
The total integral value can be obtained as convex combination of the left and right integral values (5) and (6), as in [50], presented by Kulak et al.
where represents an optimism index. It describes the decision-maker’s attitude toward risk: the smaller value of λ indicates a higher degree of risk (a lower degree of optimism). Values 0, 0.5, and 1 correspond to a pessimistic, balanced, and optimistic viewpoints of the decision-maker, respectively. If , then M1 < M2; if , then M1 ≈ M2. If , then M1 > M2.
In the following, we will briefly present the algorithm of FAHP in the following steps [51,52,53]:
- Step 1: Step 1 is the same as in the crisp AHP method.
- Step 2: Obtaining the fuzzy comparison matrix.
Pair-wise comparison of criteria and alternatives is made directly with the major element at a higher level, obtaining the total of n(n − 1)/2 comparisons. Using triangular fuzzy numbers (TFNs), this pairing is shown as a matrix , representing the hierarchy of each element based on the elements in the rows above them, where is a fuzzy value that reveal the degree of relative importance of one criterion to another. It holds that if and for
The fuzzy scale used for making pairwise comparisons is given in Table 3 and has been used for quantifying the expert’s opinion [47,54].
Table 3.
Denotation of TFNs and inverse TFNs.
The verbal scale and associated fuzzy numbers can be defined differently [55,56,57].
We chose a fuzzy scale with 9 groups to give experts the same choice as with the classic AHP method. To obtain the most consistent results, as suggested by Srdjevic [58], we used a fuzzy distance of 2 on the boundaries and odd values, and a distance of 1 on the intermediate values. The priority scale has shown in Table 4.
Table 4.
Intensity scale for fuzzy AHP pairwise comparison.
The individual decision-maker or decision group should give fuzzy judgments when comparing criteria/sub-criteria or alternatives and between the scale levels of each criterion/sub-criterion [59]. The FAHP scale has three values, as we know, the lowest value (lower, l), middle value (median, m), and the highest value (upper, u). From the graphic of the above TFNs, we have the next Figure 4.
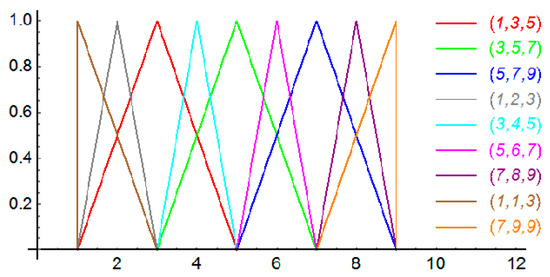
Figure 4.
The graphic representation of a TFNs.
- Step 3: Examination of matrix consistency.
We calculate the consistency index, CI and consistency ratio CR by formulas (1). CR is calculated from the corresponding crisp matrix obtained when a central value is taken in the fuzzy matrix instead of the fuzzy number. The value CR ≤ 0.1 imply that we accept evaluated fuzzy elements of the matrix, while otherwise we must remove the reasons for undesirably high estimations and repeat comparison in pairs until the degree of consistency belongs to desirable limits [60].
- Step 4: The fuzzification and the defuzzification processes.
Using TFN from the comparison matrix , the value of the fuzzy synthetic extent, according to Chang’s extent analysis method [48], is defined as:
Obtained triangular fuzzy numbers are ranked by their total integral value method [61], according to the pessimistic, moderate, and optimistic attitudes toward risk [54,58,62]. Using obtained triangular fuzzy numbers , the total integral value, as a main part of the defuzzification process, is calculated as by (9)
- Step 5: Normalization of weight vector and obtaining the vector for each criterion.
- Step 6: Ranking and selection of decisions (see Figure 5) [63]. By multiplying the respective weights of the criteria and sub-criteria, we obtain the weight for each sub-criterion. By sorting the obtained weights, we get the ranking of the sub-criteria.
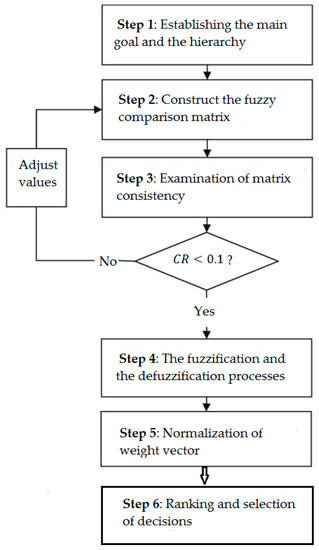 Figure 5. Steps in the FAHP algorithm.
3.2. Indicators
Today, modern societies demand a high degree of mobility in the process of planning and construction, therefore, it is necessary to examine a large number of different criteria in the decisions [64,65]. The preservation of the existing built heritage may include reuse of existing spatial capacities, with revitalization, protection of shapes, facades, and materials [66,67,68]. Through the process of renewal and adaptive reuse, taking into account modern needs, the built heritage should be protected from further deterioration [69,70]. The capacity for industrial building adaptability has determined by indicators divided into two categories: physical indicators (spatial attributes and qualities of the physical structure) and location-related indicators [71] (Table 5).
Table 5.
Description of the criteria which affect the possibility of adaptive reuse of industrial buildings.
A team of three experts in buildings, one of whom is a mathematician, participated in the selection of criteria and decision-making. The decisions were agreed with offered descriptive evaluations by consensus.
The hierarchy structure of the indicators which affect the possibility of adaptive reuse of industrial buildings as in Table 4, has presented in Figure 6.
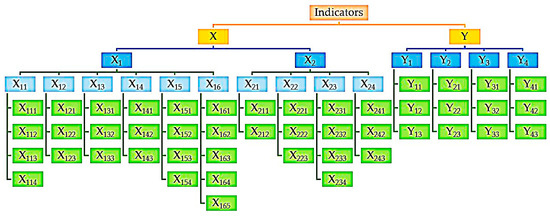
Figure 6.
The hierarchy structure of the indicators.
4. Results
Calculating the final weights of the presented buildings as a sum of the weights of the corresponding sub-criteria and sub-sub-criteria, we have adjusted the fuzzy analytical hierarchy method to identify industrial facilities with the highest potential for future reuse. The decision-makers (DMs) reached a consensus in giving assessments. A partial consensus approach may be sought among most DMs instead of an overall consensus among all DMs, thereby increasing the possibility of reaching a consensus [77]. The results of the indicators ranking in the term of industrial building adaptability obtained using the FAHP method has been represented in the next tables. Table 6 shows the evaluation of the fuzzy comparison matrix of the main categories using triangular numbers, and in Table 7 are the weights.
Table 6.
Fuzzy comparison matrix and weights for the improvement of criteria.
Table 7.
Fuzzy comparison matrix and weights for the criteria X.
The consistency ratio (CR) have checked before finding the priority weight of the main attributes. Table 8 show the fuzzy comparison matrix and weights for the criteria Y.
Table 8.
Fuzzy comparison matrix and weights for the criteria Y.
Appropriate matrices for the sub-criteria X1 and X2 and their weights are shown in Table 9, Table 10 and Table 11.
Table 9.
Fuzzy comparison matrix for the sub-criteria X1.
Table 10.
Weights for sub-criteria X1.
Table 11.
Fuzzy comparison matrix and weights for the sub-criteria X2.
The fuzzy comparison matrices for the sub-criteria Y1–Y4 and their weights are presented in Table 12, Table 13, Table 14 and Table 15.
Table 12.
Fuzzy comparison matrix and weights for the sub-criteria Y1.
Table 13.
Fuzzy comparison matrix and weights for the sub-criteria Y2.
Table 14.
Fuzzy comparison matrix and weights for the sub-criteria Y3.
Table 15.
Fuzzy comparison matrix and weights for the sub-criteria Y4.
The results for the comparison matrices of the sub-sub criteria X11–X16, as well as their weights, are presented in Table 16, Table 17, Table 18, Table 19, Table 20 and Table 21.
Table 16.
Fuzzy comparison matrix and weights for the sub-sub-criteria X11.
Table 17.
Fuzzy comparison matrix and weights for the sub-sub-criteria X12.
Table 18.
Fuzzy comparison matrix and weights for the sub-sub-criteria X13.
Table 19.
Fuzzy comparison matrix and weights for the sub-sub-criteria X14.
Table 20.
Fuzzy comparison matrix and weights for the sub-sub-criteria X15.
Table 21.
Fuzzy comparison matrix and weights for the sub-sub-criteria X16.
The results for the comparison matrices of the sub-sub criteria X21–X26, as well as their weights, are presented in Table 22, Table 23, Table 24 and Table 25.
Table 22.
Fuzzy comparison matrix and weights for the sub-sub-criteria X21.
Table 23.
Fuzzy comparison matrix and weights for the sub-sub-criteria X22.
Table 24.
Fuzzy comparison matrix and weights for the sub-sub-criteria X23.
Table 25.
Fuzzy comparison matrix and weights for the sub-sub-criteria X24.
In Table 26, we have presented the final weights of all indicators/criteria participating in the adaptability process of the industrial buildings, considering all three degrees of optimism.
Table 26.
Final weights W of indicators for adaptability of industrial buildings.
Table 27 provides an overview of the requirements that buildings meet according to the sub-criteria and sub-sub-criteria, and the final evaluation of the fuzzy AHP approach is given in Table 28.
Table 27.
Review of requirements according to the characteristics of selected objects in the complex.
Table 28.
Ranking of selected facilities for λ = 0, λ = 0.5, λ = 1.
Table 28 shows the overall comparison of the ranking of buildings in the EI complex, in terms of their potential for adaptability and reuse for all three cases of the optimism index.
Comparison matrices, considering all hierarchy levels, were acceptably consistent. As regards estimating indicators, the final ranking of indicators shows the superiority of the developed gross area of the building 1000–4500 (X152), floor height of 3–5.5 m (X112), developed gross area 4500–15,000 (X153), linear type of construction system (X211), with up to three floors (X122) and two access points (Y42).
5. Discussion
The application of the proposed methodology in the case study to explore the potential for adaptation and new use of industrial buildings led to the following conclusion. The method was capable to provide decision support to the investors and entrepreneurs for the choice of buildings reuse. Also, the method gave different results depending on the degree of optimism. Effective evaluation procedures are essential for the promotion of quality decisions. The proposed method ranks the proposed criteria, first of all. The experts gave their assessments primarily based on theoretical knowledge in the field of industrial architecture, but also based on available information on the buildings of the complex taken from planning documents and archives. According to the obtained weights for each alternative, the buildings E and A have the dominant potential for adaptive reuse (Figure 7).
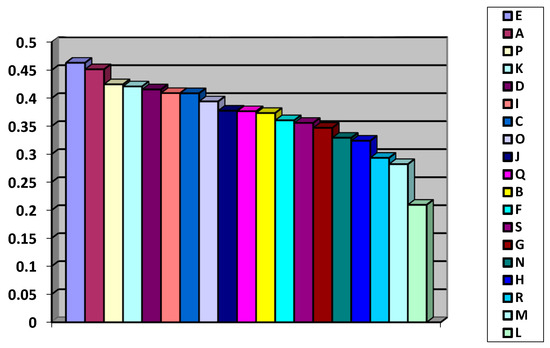
Figure 7.
The final ranking of selected facilities for λ = 1.
With respect to the obtained weights for each alternative, using the optimistic viewpoint λ = 1, the buildings E and A have the dominant potential for adaptive reuse, followed by buildings P, K, and D. The buildings M and L have a low potential for adaptation.
Using the decision-makers’ moderate point of view λ = 0.5, as a leading building for adaptive reuse stand out buildings E, A, and P, and as the least adaptable, buildings M and L. A similar state is for the pessimistic point of view λ = 0, with one change in the leading position, A, E, and P followed with buildings marked as P, K, D, and the same buildings at the bottom of the ladder, M and L. The buildings L and M have an extremely low potential for adaptation.
The sensitivity analysis is included at the criteria level by increasing the importance of the weight of Y to X (Table 29).
Table 29.
The sensitivity analysis for λ = 0, λ = 0.5, λ = 1.
The sensitivity analysis indicates that there are no significant changes in ranking.
Similar research can see in the papers [78,79,80]. By applying the FAHP method, the obtained objectivity resulted in the extraction of buildings that may not be an obvious choice at first. The combination of fuzzy theory and the adjusted multi-criteria decision-making method, as this paper and many relevant studies [81,82,83] certify, is a convenient, objective, and relevant method for the selection of criteria that affect the possibility of adaptive reuse and ranking of industrial buildings. An integral approach can be used in further research on the mathematical method of a hybrid fuzzy multi-criteria decision making (MCDM) model based on interval type-2 fuzzy sets [84]. Applying different multiple criteria decision-making methods can sometimes produce different ranking orders of alternatives [85]. Adaptive reuse or revitalization of these industrial buildings not only prolongs their life, but also has great economic, environmental, and social benefits if a good assessment is made. The industrial buildings at EI Nis have a great potential for adaptive reuse with innovative sustainable design. Applying a fuzzy approach for decision-makers to make better choices about reusing existing buildings will need to take into account the characteristics of the building and integrate stakeholder views. The results provide decision-makers with significant insight into the adaptive reuse selection problem.
6. Conclusions
The purpose of this study was to develop a scientific framework for the selection of buildings for reuse in the complex of industrial buildings. Assessing industrial buildings as an alternative to conversion is a multidimensional, complex task for decision-makers. In the process of planning the selection of buildings within industrial brownfields, suitable for adaptive reuse, models of multi-criteria analysis have been recognized as a suitable tool to facilitate optimal decision making. In this paper, we have explored a fuzzy AHP method for the selection of industrial buildings with considerable potential for adaptive reuse and ones with no potential. This method has applied to the case study of complex EI Nis. In the process of planning and the selection of buildings, a large number of different criteria, concerning physical and locational characteristics have discerned. The results showed that the proposed model is quite capable of solving decision-making problems related to exploring the potential for adaptation and new use of industrial buildings. A case study consisting of nineteen alternatives illustrates the effectiveness of the proposed approach. In the process of selecting a building for reuse, indicatively ignoring the assumed specific category of future use, to obtain main results, the recommended method first ranked the sub-criteria and then performed a potential order of selecting buildings in the complex. In terms of the obtained weights for each alternative and all λ, the buildings E, A, and P have the dominant potential for adaptive reuse. The sensitivity analysis indicates that there are no significant changes in ranking. The buildings M and L have a low potential for adaptation. The fact that future purposes have not been emphasized in the ranking of buildings indicates that the results obtained are more general because they do not suggest the type of use, but the quality and suitability of adaptability when choosing the highest-ranking buildings. For more concrete results, we can consider the particular purposes of buildings. We conclude that the proposed methodology has been successfully applied in the process of deciding on the reuse of industrial sites and buildings. Finally, the criteria can be additionally specified when considering specific use, so that the results might be more accurate. The method was, therefore, able to solve decision-making problems even with minor changes. Also, in future studies, another approach in the estimation of choices can be created that will further improve the accuracy of the assessment. Furthermore, the uncertain pairwise comparison results can be expressed with interval numbers instead of fuzzy numbers. We can perform the research using some other membership functions.
Author Contributions
Conceptualization, D.M.M. and M.R.M.; methodology, D.M.M. and M.R.M.; software, D.M.M.; validation, M.R.M., D.J.S., and D.M.M.; formal analysis, M.R.M. and D.M.M.; investigation, D.J.S. and M.R.M.; resources, M.R.M. and D.J.S.; data curation, D.M.M. and D.J.S.; writing—original draft preparation, M.R.M. and D.J.S.; writing—review and editing, D.M.M.; visualization, M.R.M. and D.M.M.; supervision, M.R.M. and D.M.M.; project administration, M.R.M. and D.S.; funding acquisition, D.J.S. All authors have read and agreed to the published version of the manuscript.
Funding
This research received no external funding.
Acknowledgments
The authors express gratitude to the Ministry of Education, Science, and Technological Development of Serbia for providing partial support for this paper.
Conflicts of Interest
The authors declare no conflict of interest.
References
- James, D. Building Adaptation, 2nd ed.; Heriot-Watt University: Edinburgh, UK, 2006. [Google Scholar]
- Stanojević, A.; Keković, A. Functional and aesthetic transformation of industrial into housing spaces. FU. Arch. Civ. Eng. 2019, 17, 401–416. [Google Scholar]
- Bana e Costa, A.; Oliveira, R.C. Assigning priorities for maintenance, repair and refurbishment in managing a municipal housing stock. Eur. J. Oper. Res. 2002, 138, 380–391. [Google Scholar] [CrossRef]
- Stellacci, S.; Rato, V.; Poletti, E.; Vasconcelos, G.; Borsoi, G. Multi-criteria analysis of rehabilitation techniques for traditional timber frame walls in Pombalino buildings (Lisbon). J. Build. Eng. 2018, 16, 184–198. [Google Scholar] [CrossRef]
- Montesinos-Valera, J.; Aragonés-Beltrán, P.; Pastor-Ferrando, J.-P. Selection of maintenance, renewal and improvement projects in rail lines using the analytic network process. Struct. Infrastruct. Eng. 2017, 13, 1476–1496. [Google Scholar] [CrossRef]
- Hossaini, N.; Reza, B.; Akhtar, S.; Sadiq, R.; Hewage, K. AHP based life cycle sustainability assessment (LCSA) framework: A case study of six storey wood frame and concrete frame buildings in Vancouver. J. Environ. Plan. Manag. 2015, 58, 1217–1241. [Google Scholar] [CrossRef]
- Ucal Sari, I. Development of an integrated discounting strategy based on vendors’ expectations using FAHP and FUZZY goal programming. Technol. Econ. Dev. Econ. 2018, 24, 635–652. [Google Scholar] [CrossRef]
- Pamučar, D.; Petrović, I.; Ćirović, G. Modification of the Best-Worst and MABAC methods: A novel approach based on interval-valued fuzzy-rough numbers. Expert. Syst. Appl. 2018, 91, 89–106. [Google Scholar] [CrossRef]
- Ghorui, N.; Ghosh, A.; Algehyne, E.A.; Mondal, S.P.; Saha, A.K. AHP-TOPSIS Inspired Shopping Mall Site Selection Problem with Fuzzy Data. Mathematics 2020, 8, 1380. [Google Scholar] [CrossRef]
- Turnšek, B.; Stanojević, A.; Jevremović, L.J. Developing a Model for Sustainable Conversion of Blockhouse Bunkers in Serbia. Tehnički Vjesnik 2020, 27, 1337–1344. [Google Scholar]
- Bollack, F.A. Old Buildings New Forms—New Directions in Architectural Transformations; The Monacelli Press: New York, NY, USA, 2013. [Google Scholar]
- Prascevic, N.; Prascevic, Z. Application of fuzzy AHP for ranking and selection of alternatives in construction project management. J. Civ. Eng. Manag. 2017, 23, 1123–1135. [Google Scholar] [CrossRef]
- Zavadskas, E.K.; Antucheviciene, J.; Vilutiene, T.; Adeli, H. Sustainable decision-making in civil engineering, construction and building technology. Sustainability 2018, 10, 14. [Google Scholar] [CrossRef]
- Zavadskas, E.K.; Saparauskas, J.; Antucheviciene, J. Sustainability in Construction Engineering. Sustainability 2018, 10, 2236. [Google Scholar] [CrossRef]
- Ogrodnik, K. Multi-Criteria Analysis of Design Solutions in Architecture and Engineering: Review of Applications and a Case Study. Buildings 2019, 9, 244. [Google Scholar] [CrossRef]
- Zavadskas, E.K.; Turskis, Z.; Kildiene, S. State of art surveys of overviews on MCDM /MADM methods. Technol. Econ. Dev. Econ. 2014, 20, 165–179. [Google Scholar] [CrossRef]
- Emrouznejad, A.; Marra, M. The state of the art development of AHP (1979–2017): A literature review with a social network analysis. Int. J. Prod. Res. 2017, 55, 6653–6675. [Google Scholar] [CrossRef]
- Bielinskas, V.; Burinskiene, M.; Palevičius, V. Assessment of neglected areas in Vilnius city using MCDM and COPRAS methods. Procedia Eng. 2015, 122, 29–38. [Google Scholar]
- Chen, C.S.; Chiu, Y.H.; Tsai, L. Evaluating the adaptive reuse of historic buildings through multicriteria decision-making. Habitat Int. 2018, 81, 12–23. [Google Scholar] [CrossRef]
- Ribera, F.; Nesticò, A.; Cucco, P.; Maselli, G. A multicriteria approach to identify the Highest and Best Use for historical buildings. J. Cult. Herit. 2019, 41, 166–177. [Google Scholar] [CrossRef]
- Tan, Y.; Shen, L.; Langston, C. A fuzzy approach for adaptive reuse selection of industrial buildings in Hong Kong. Int. J. Strateg. Prop. Manag. 2014, 18, 66–76. [Google Scholar] [CrossRef]
- Morkūnaitė, Ž.; Kalibatas, D.; Kalibatienė, D. A bibliometric data analysis of multi-criteria decision-making methods in heritage buildings. J. Civ. Eng. Manag. 2019, 25, 76–99. [Google Scholar] [CrossRef]
- Zavadskas, E.K.; Antuchevičienė, J.; Kapliński, O. Multi-Criteria Decision Making in Civil Engineering: Part I—A State-of-the-Art Survey. Eng. Struct. Technol. 2016, 7, 103–113. [Google Scholar] [CrossRef]
- Zavadskas, E.K.; Antucheviciene, J.; Kaplinski, O. Multi-criteria decision making in civil engineering. Part II—Applications. Eng. Struct. Technol. 2015, 7, 151–167. [Google Scholar] [CrossRef]
- Zagorskas, J.; Zavadskas, E.K.; Turskis, Z.; Burinskiene, M.; Blumberga, A.; Blumberga, D. Thermal insulation alternatives of historic brick buildings in Baltic Sea Region. Energy Build. 2014, 78, 35–42. [Google Scholar] [CrossRef]
- Kutut, V.; Zavadskas, E.K.; Lazauskas, M. Assessment of priority alternatives for preservation of historic buildings using model based on ARAS and AHP methods. Arch. Civ. Mech. Eng. 2014, 14, 287–294. [Google Scholar] [CrossRef]
- Turskis, Z.; Zavadskas, E.K.; Kutut, V. A model based on Aras-G and AHP methods for multiple criteria prioritizing of heritage value. Int. J. Inf. Technol. Decis. Mak. 2013, 12, 45–73. [Google Scholar] [CrossRef]
- Tupenaite, L.; Zavadskas, E.K.; Kaklauskas, A.; Turskis, Z.; Seniut, M. Multiple criteria assessment of alternatives for built and human environment renovation. J. Civ. Eng. Manag. 2010, 16, 257–266. [Google Scholar] [CrossRef]
- Van Balen, K. Preventive conservation of Historic buildings. Restor. Build. Monum. 2015, 21, 99–140. [Google Scholar] [CrossRef]
- Claver, J.; García-Domínguez, A.; Sebastián, M.A. Decision-making methodologies for reuse of industrial assets. Complexity 2018, 2018, 4070496. [Google Scholar] [CrossRef]
- PDR-Plan of Detailed Regulation of the Complex of Electronic Industry Nis; Official Gazette of the City of Nis: Nis, Serbia, No.2; 2014. (In Serbian)
- Jevremović, L.J.; Turnšek, B.; Milojković, A.; Vasić, M.; Jordanović, M. Spontaneous development and resilience places-A case study of Electronic industry Nis (Serbia). In Proceedings of the 3rd International Conference on Places and Technologies, Belgrade, Serbia, 14–15 April 2016; pp. 613–619. [Google Scholar]
- Saaty, T.L. The Analytic Hierarchy Process; McGraw-Hill: New York, NY, USA, 1980. [Google Scholar]
- Saaty, T.L. Analytic Network Process—Decision Making with Dependece and Feedback; RWS Publications: Pittsburgh, PA, USA, 1996; ISBN 0-9620317-9-8. [Google Scholar]
- Saaty, T.L. Multicriteria Decision Making—The Analytic Hierarchy Process; RWS Publications: Pittsburgh, PA, USA, 1990. [Google Scholar]
- Pamučar, D.; Ćirović, G.; Sekulović, D.; Ilić, A. A new fuzzy mathematical model for multi criteria decision making: An application of fuzzy mathematical model in a SWOT analysis. Sci. Res. Essays 2011, 6, 5374–5386. [Google Scholar]
- Waas, T.; Hugé, J.; Block, T.; Wright, T.; Benitez-Capistros, F.; Verbruggen, A. Sustainability Assessment and Indicators: Tools in a Decision-Making Strategy for Sustainable Development. Sustainability 2014, 6, 5512–5534. [Google Scholar] [CrossRef]
- Moreno-Jimenez, J.M.; Aguaron, J.; Escobar, M.T. The core of consistency in AHP-group decision making. Group Decis. Negot. 2008, 17, 249–265. [Google Scholar] [CrossRef]
- Milošević, M.; Milošević, D.; Dimić, V.; Stević, D.; Stanojević, A. The analysis of energy efficiency indicators and renewable energy sources for existing buildings. Mkoiee 2017, 5, 205–212. [Google Scholar]
- Li, D.F. An approach to fuzzy multiattribute decision making under uncertainty. Inf. Sci. 2005, 169, 97–112. [Google Scholar] [CrossRef]
- Yager, R.R. Uncertainty modeling using fuzzy measures. Knowl. Based Syst. 2016, 92, 1–8. [Google Scholar] [CrossRef]
- Zadeh, L.A. The concept of a linguistic variable and its application to approximate reasoning I. Inf. Sci. 1975, 8, 199–249. [Google Scholar] [CrossRef]
- Zadeh, L.A. The concept of a linguistic variable and its application to approximate reasoning II. Inf. Sci. 1975, 8, 301–357. [Google Scholar] [CrossRef]
- Zadeh, L.A. The concept of a linguistic variable and its application to approximate reasoning-III. Inf. Sci. 1975, 9, 43–80. [Google Scholar] [CrossRef]
- Lamastra, L.; Balderacchi, M.; Di Guardo, A.; Monchiero, M.; Trevisan, M. A novel fuzzy expert system to assess the sustainability of the viticulture at the wine-estate scale. Middle-East J. Sci. Res. 2014, 22, 1411–1421. [Google Scholar] [CrossRef]
- Chou, J.S.; Pham, A.D.; Wang, H. Bidding strategy to support decision-making by integrating fuzzy AHP and regression-based simulation. Autom. Constr. 2013, 35, 517–527. [Google Scholar] [CrossRef]
- Dimić, V.; Milošević, M.; Milošević, D.; Stević, D. Adjustable Model of Renewable Energy Projects for Sustainable Development: A Case Study of the Nišava District in Serbia. Sustainability 2018, 10, 775. [Google Scholar] [CrossRef]
- Chang, D.Y. Application of the extent analysis method on fuzzy AHP. Eur. J. Op. Res. 1996, 95, 649–655. [Google Scholar] [CrossRef]
- Wang, W.M.; Lee, A.H.I.; Chang, D.T. An integrated FA-FEAHP approach on the social indicators of Taiwan’s green building. Glob. Bus. Econ. Rev. 2009, 11, 304–316. [Google Scholar] [CrossRef]
- Kulak, O.; Durmusoglu, B.; Kahraman, C. Fuzzy multi-attribute equipment selection based on information axiom. J. Mater. Process. Technol. 2005, 169, 337–345. [Google Scholar] [CrossRef]
- Chan, F.T.S.; Kumar, N. Global supplier development considering risk factors using fuzzy extended AHP-based approach. Omega 2007, 35, 417–431. [Google Scholar] [CrossRef]
- Kahraman, C.; Cebeci, U.; Ruan, D. Multi-attribute comparison of catering service companies using fuzzy AHP: The case of Turkey. Int. J. Prod. Econ. 2004, 87, 171–184. [Google Scholar] [CrossRef]
- Lee, A.H.I. A fuzzy supplier selection model with the consideration of benefits, opportunities, costs and risks. Expert Syst. Appl. 2009, 36, 2879–2893. [Google Scholar] [CrossRef]
- Janackovic, G.; Savic, S.; Stankovic, M. Selection and ranking of Occupational Safety Indicators Based on Fuzzy AHP: A Case Study in Road Construction Companies. S. Afr. J. Ind. Eng. 2013, 24, 175–189. [Google Scholar] [CrossRef]
- Domínguez, S.; Carnero, M.C. Fuzzy Multicriteria Modelling of Decision Making in the Renewal of Healthcare Technologies. Mathematics 2020, 8, 944. [Google Scholar] [CrossRef]
- Chou, T.-Y.; Chen, Y.-T. Applying Fuzzy AHP and TOPSIS Method to Identify Key Organizational Capabilities. Mathematics 2020, 8, 836. [Google Scholar] [CrossRef]
- Milošević, D.; Milošević, M.; Stanojević, A.; Dimić, V.; Milošević, A. Application of FAHP Method in the Process of Building Construction from the Aspect of Energy Efficiency. In Proceedings of the 4th International Conference Mechanical Engineering in XXI century, Niš, Serbia, 19–20 April 2018; pp. 271–276. [Google Scholar]
- Srdjevic, B.; Medeiros, Y. Fuzzy AHP assessment of water management plans. Water Resour. Manag. 2008, 22, 877–894. [Google Scholar] [CrossRef]
- Carnero, M.C. Fuzzy Multicriteria Models for Decision Making in Gamification. Mathematics 2020, 8, 682. [Google Scholar] [CrossRef]
- Milošević, D.; Stanojević, A.; Milošević, M. AHP method in the function of logistic in development of smart cities model. In Proceedings of the 6th International Conference: Transport and logistic Til, Niš, Serbia, 25–26 May 2017; pp. 287–294. [Google Scholar]
- Liou, T.S.; Wang, M.J. Ranking fuzzy numbers with integral value. Fuzzy Sets Syst. 1992, 50, 247–256. [Google Scholar] [CrossRef]
- Milošević, M.; Milošević, D.; Stanojević, A. Managing Cultural Built Heritage in Smart Cities Using Fuzzy and Interval Multi-criteria Decision Making. In Intelligent and Fuzzy Techniques: Smart and Innovative Solutions; INFUS 2020. Advances in Intelligent Systems and Computing, vol 1197; Kahraman, C., Cevik Onar, S., Oztaysi, B., Sari, I., Cebi, S., Tolga, A., Eds.; Springer: Cham, Switzerland, 2020. [Google Scholar]
- Milošević, A.; Milošević, M.; Milošević, D.; Selimi, A. Ahp multi—Criteria method for sustainable development in construction. In Proceedings of the 4th International Conference, Contemporary Achievements in Civil Engineering, Subotica, Serbia, 22 April 2016; pp. 929–938. [Google Scholar]
- Selimi, A.; Milošević, M.; Saračević, M. AHP—TOPSIS Model as a Mathematical Support in the Selection of Project from Aspect of Mobility—Case Study. J. Appl. Math. Comput. (JAMC) 2018, 2, 257–265. [Google Scholar]
- Milošević, M.; Dimić, V. Multi-criteria analysis in ICT implementation for Smart Cities. In Proceedings of the Conference Successful Implementation of Information Technology: IT, Marketing, Education and Business Working Together for Business Success, EEE 2018, Belgrade, Serbia, 18–20 October 2018; pp. 83–105. [Google Scholar]
- Wilczkiewicz, M.; Wilkosz-Mamcarczyk, M. Revitalization—Definition, genesis, examples. Geomat. Landmanagement Landsc. 2015, 2, 71–79. [Google Scholar] [CrossRef]
- Bullen, P.; Love, P. A new future for the past: A model for adaptive reuse decision-making. Built Environ. Proj. Asset Manag. 2011, 1, 32–44. [Google Scholar] [CrossRef]
- Sharpe, S.E. Revitalizing Cities: Adaptive Reuse of Historic Structures. In Proceedings of the Mid-America College Art Association Conference, Detroit, MI, USA, 3–6 October 2012; Digital Publications: Dhaka, Bangladesh, 2012; p. 18. [Google Scholar]
- Douglas, J. Buildings Adaptation; Heriot-Watt University: Edinburgh, Scotland, 2006. [Google Scholar]
- Eray, E.; Sanchez, B.; Haas, C. Usage of Interface Management System in Adaptive Reuse of Buildings. Buildings 2019, 9, 105. [Google Scholar] [CrossRef]
- Stanojević, A.; Jevremović, L.j.; Milošević, M.; Turnšek, B.; Milošević, D. Identifying priority indicators for reuse of industrial buildings using AHP method—Case study of Electronic Industry in Nis, Serbia. In Proceedings of the 6th International Academic Conference on Places and Technologies, Pecs, Hungary, 9–10 May 2019; pp. 555–563. [Google Scholar]
- Liewelyn, D. Urban Design Compendium; English Partnerships and The Housing Corporation: London, UK, 2000.
- Stratton, M. Industrial Buildings—Conservation and Regeneration; Taylor & Francis e-Library: London, UK, 2005. [Google Scholar]
- Martínez-Rocamora, A.; Solís-Guzmán, J.; Marrero, M. LCA databases focused on construction materials: A review. Renew. Sustain. Energy Rev. 2016, 58, 565–573. [Google Scholar] [CrossRef]
- Hoxha, E.; Habert, G.; Lasvaux, S.; Chevalier, J.; Le Roy, R. Influence of construction material uncertainties on residential building LCA reliability. J. Clean. Prod. 2017, 144, 33–47. [Google Scholar] [CrossRef]
- Tulevech, S.M.; Hage, D.J.; Jorgensen, S.K.; Guensler, C.L.; Himmler, R.; Gheewala, S.H. Life cycle assessment: A multi-scenario case study of a low-energy industrial building in Thailand. Energy Build. 2018, 168, 191–200. [Google Scholar] [CrossRef]
- Wang, Y.-C.; Chen, T.-C.T. A Partial-Consensus Posterior-Aggregation FAHP Method—Supplier Selection Problem as an Example. Mathematics 2019, 7, 179. [Google Scholar] [CrossRef]
- Mosadeghi, R.; Warnken, J.; Tomlinson, R.; Mirfenderesk, H. Comparison of Fuzzy-AHP and AHP in a spatial multi-criteria decision making model for urban land-use planning. Comput. Environ. Urban. Syst. 2015, 49, 54–65. [Google Scholar] [CrossRef]
- Cabrerizo, F.J.; Ureña, R.; Pedrycz, W.; Herrera-Viedma, E. Building consensus in group decision making with an allocation of information granularity. Fuzzy Sets Syst. 2014, 255, 115–127. [Google Scholar] [CrossRef]
- Lombera, J.T.S.; Rojo, J.C. Industrial building design stage based on a system approach to their environmental sustainability. Constr. Build. Mater. 2010, 24, 438–447. [Google Scholar] [CrossRef]
- Kaya, İ.; Kahraman, C. A comparison of fuzzy multi criteria decision making methods for intelligent building assessment. J. Civ. Eng. Manag. 2014, 20, 59–69. [Google Scholar] [CrossRef]
- Hatefi, S.M. Intelligent building assessment based on an integrated model of fuzzy analytic hierarchy process and fuzzy preference degree approach (FAHP-FPDA). Int. J. Optim. Civ. Eng. 2019, 79–92. [Google Scholar]
- Wong, J.K.W.; Li, H. Application of the analytic hierarchy process (AHP) in multi-criteria analysis of the selection of intelligent building systems. Build Environ. 2008, 43, 108–125. [Google Scholar] [CrossRef]
- Milošević, M.R.; Milošević, D.M.; Stević, D.M.; Stanojević, A.D. Smart City: Modeling Key Indicators in Serbia Using IT2FS. Sustainability 2019, 11, 3536. [Google Scholar] [CrossRef]
- Stanujkic, D.; Đorđević, B.; Đorđević, M. Comparative analysis of some prominent mcdm methods: A case of ranking Serbian banks. Serbian J. Manag. 2013, 8, 213–241. [Google Scholar] [CrossRef]


© 2020 by the authors. Licensee MDPI, Basel, Switzerland. This article is an open access article distributed under the terms and conditions of the Creative Commons Attribution (CC BY) license (http://creativecommons.org/licenses/by/4.0/).