1. Introduction
In the last few decades, the focus on Total Quality Management (TQM) philosophy has significantly gained attention among industry practitioners and academics. The emphasis is on the application of the TQM theories to manage and improve the various organisational aspects, so as to deliver a quality outcome i.e., a good or service to the end-user. Organisations use a multitude of TQM tools and techniques to continuously improve process outcomes [
1]. TQM has evolved in different quality domains from the substantial contributions of Shewhart (Statistical Quality Control), Deming (Process Control Quality), Juran (Quality Management), Feigenbaum (Total Quality Control), Crosby (Quality Cost), Ishikawa (Preventive Quality), and Taguchi (Design Quality) [
2,
3,
4]. Moreover, different TQM methodologies have been successfully implemented in various industrial settings across distinct organisational levels [
5,
6]. With the increased material, energy, and operational costs, organisations continuously look for opportunities to optimise their operations to gain competitive advantage [
7]. Based on Taguchi’s methodology, this paper describes a case study in an industrial setting, which is facing challenges in producing high-quality products that are sensitive to various causes of variation.
In the building and construction industry, expanded polystyrene (EPS) is extensively used to produce pods and blocks for under floorings and insulation panels, which are the two essential components that are required in the buildings. A pod is a semi-hollow grid component, which resembles with a honeycomb, whereas a block is a solid module that is cut into sheets to produce insulation panels. Post February 2011 earthquakes in Christchurch (New Zealand), there has been an ongoing mass scale rebuild process in the city to redevelop the infrastructure for commercial and residential purposes. New materials, possessing earthquake resistant properties, are being produced and used in buildings to minimise the impact of any such natural calamity in future. As a result, there is a surge in the demand for new construction and building materials that can withstand earthquake shocks to reduce sufferings of the various affected community segments.
In this paper, a pod-manufacturing process is considered in the EPS supply chain to study the impact of the various process parameters on the quality of the pod. The variation in the pod manufacturing process with regard to the response variable i.e., weight of the expanded beads forms the basis for this study. In general, EPS is also suitable for manufacturing various types of packaging material for consumer goods, including foodstuff, horticulture, and electronics. EPS, which is a synthetic polymer made from the styrene monomer, is extremely light, durable, and resistant to moisture. On the daily basis, a considerable amount of EPS based materials are produced, a portion of which results in waste. This leads to the increase in carbon footprint, which eventually ends up affecting the environment. Furthermore, variation in the manufacturing practices or non-compliance to the standards and procedures might lead to increased processing time and cost, which might affect the sustainability aspects across the EPS chain. EPS has been the focus of work for academics for long. Horvath [
8] provided useful information regarding the various mechanical, physical, and thermal properties of the EPS. Chen and Liu [
9] investigated the properties of reinforced concrete structures with respect to EPS and styrene-butadine rubber by considering two types of spherical EPS beads to test the strength of polymer-cement ratios. Whereas, Magalhães and Lago [
10] studied the impact of Titanium dioxide (TiO
2) on EPS surface through a photocatalytic study. Kannan et al. [
11] addressed the issues that surround the decomposition of EPS by considering heating rate and gaseous environment as the parameters. The studies that were conducted by Varnagiris et al. [
12] and Shirazi et al. [
13] analysed the moisture adsorption and resistance aspects of coated EPS foam beads under mechanical stresses, such as shear and compressive stresses. Furthermore, EPS has been the topic of interest for researchers in various other applications areas. For instance, various aspects of EPS have been explored in different applications such as nano-manufacturing [
14,
15], construction [
16,
17], composite materials [
18,
19], waste [
20,
21], and recycling [
22].
In view of the utility of the EPS pods, especially in the construction industry, it is of utmost important to ensure the quality of the final deliverable. It has been observed from the literature that information pertaining to the systematic experimental investigation of the effect of the various pod production process parameters on the quality of pods is lacking. Keeping this in view, an attempt has been made in this paper to explore effect of the critical pod production process parameters on the pod quality that is measured in terms of weight of the expanded beads. Further, this paper also aims at determining the optimal combination of the process parameters while using Taguchi’s design of experiment. If the pod production process is operated at optimum levels of the process parameters then it would produce high quality pods and helps to mitigate the ripple effects of poor quality down the chain. The pod production process was observed and experiments were conducted to study the effects of critical factors in producing pods at one of the major New Zealand based EPS facilities. The study that is presented in this paper is expected to provide useful information to the stakeholders who are associated with EPS pod production.
2. The Pod Production Process
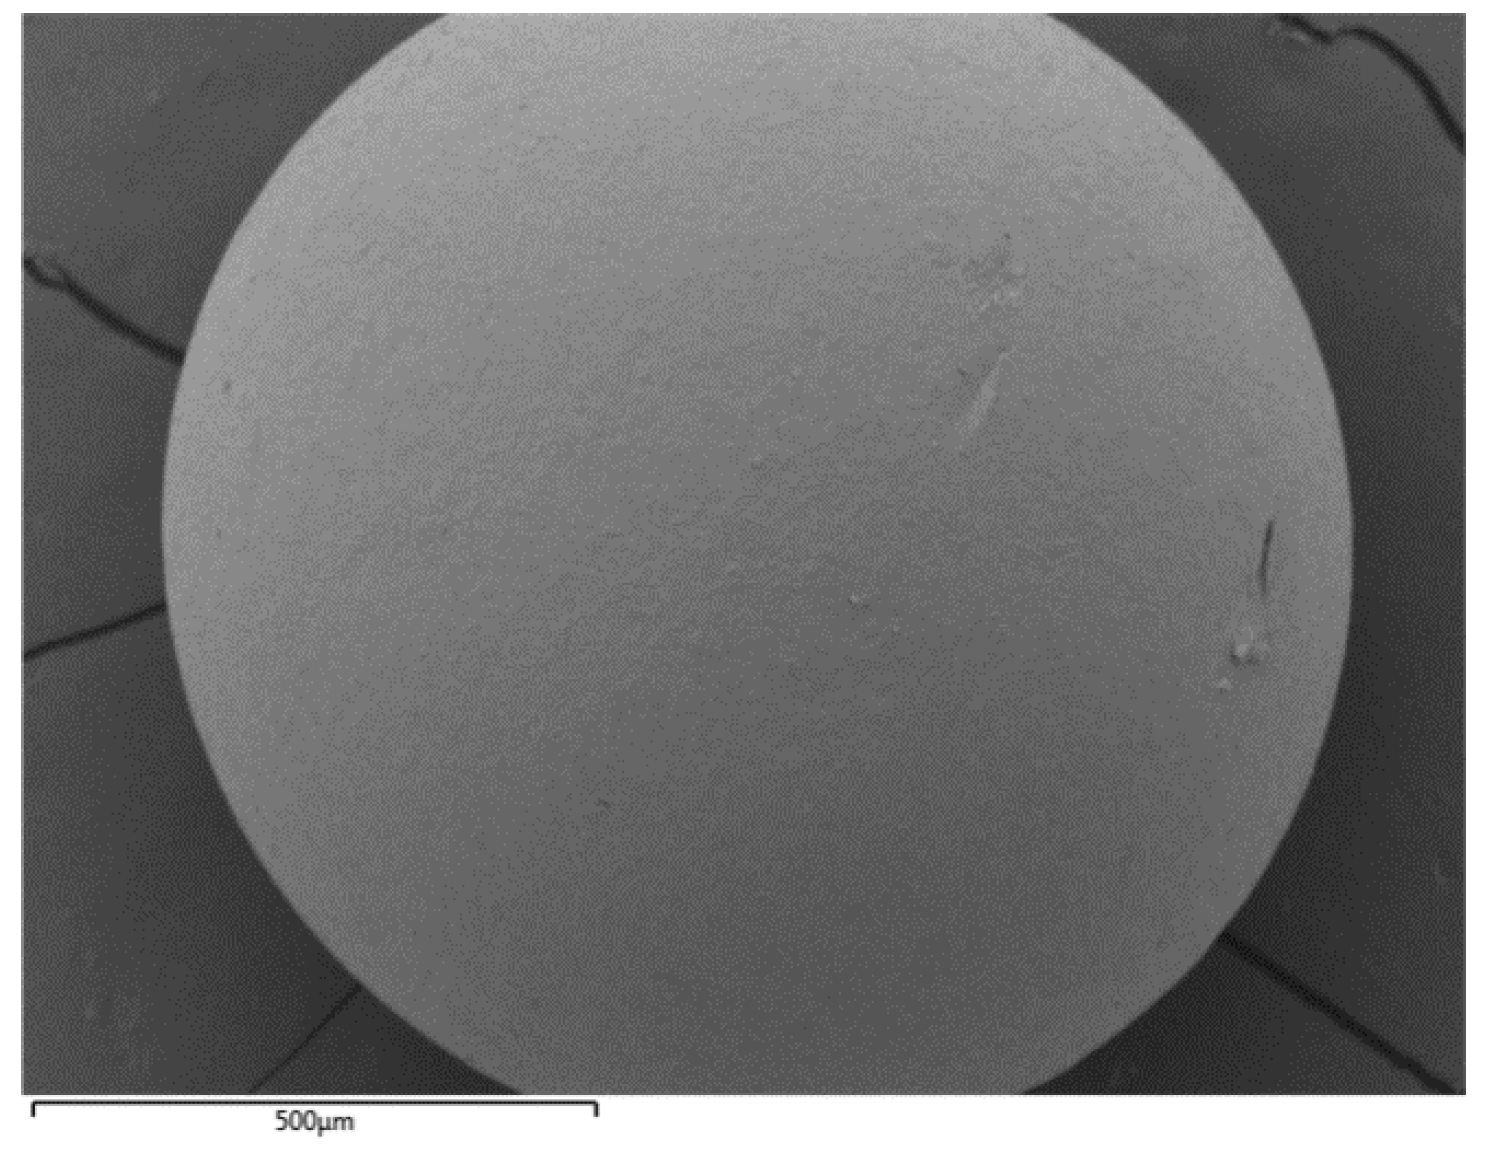
A pod is produced using EPS, which is a synthetic polymer. As stated by the operators at the production facility, the pod production process starts with the acquisition of raw material in the form of resin or crystals from the upstream suppliers in the chain. The resin is a tiny pentane or butane bead (
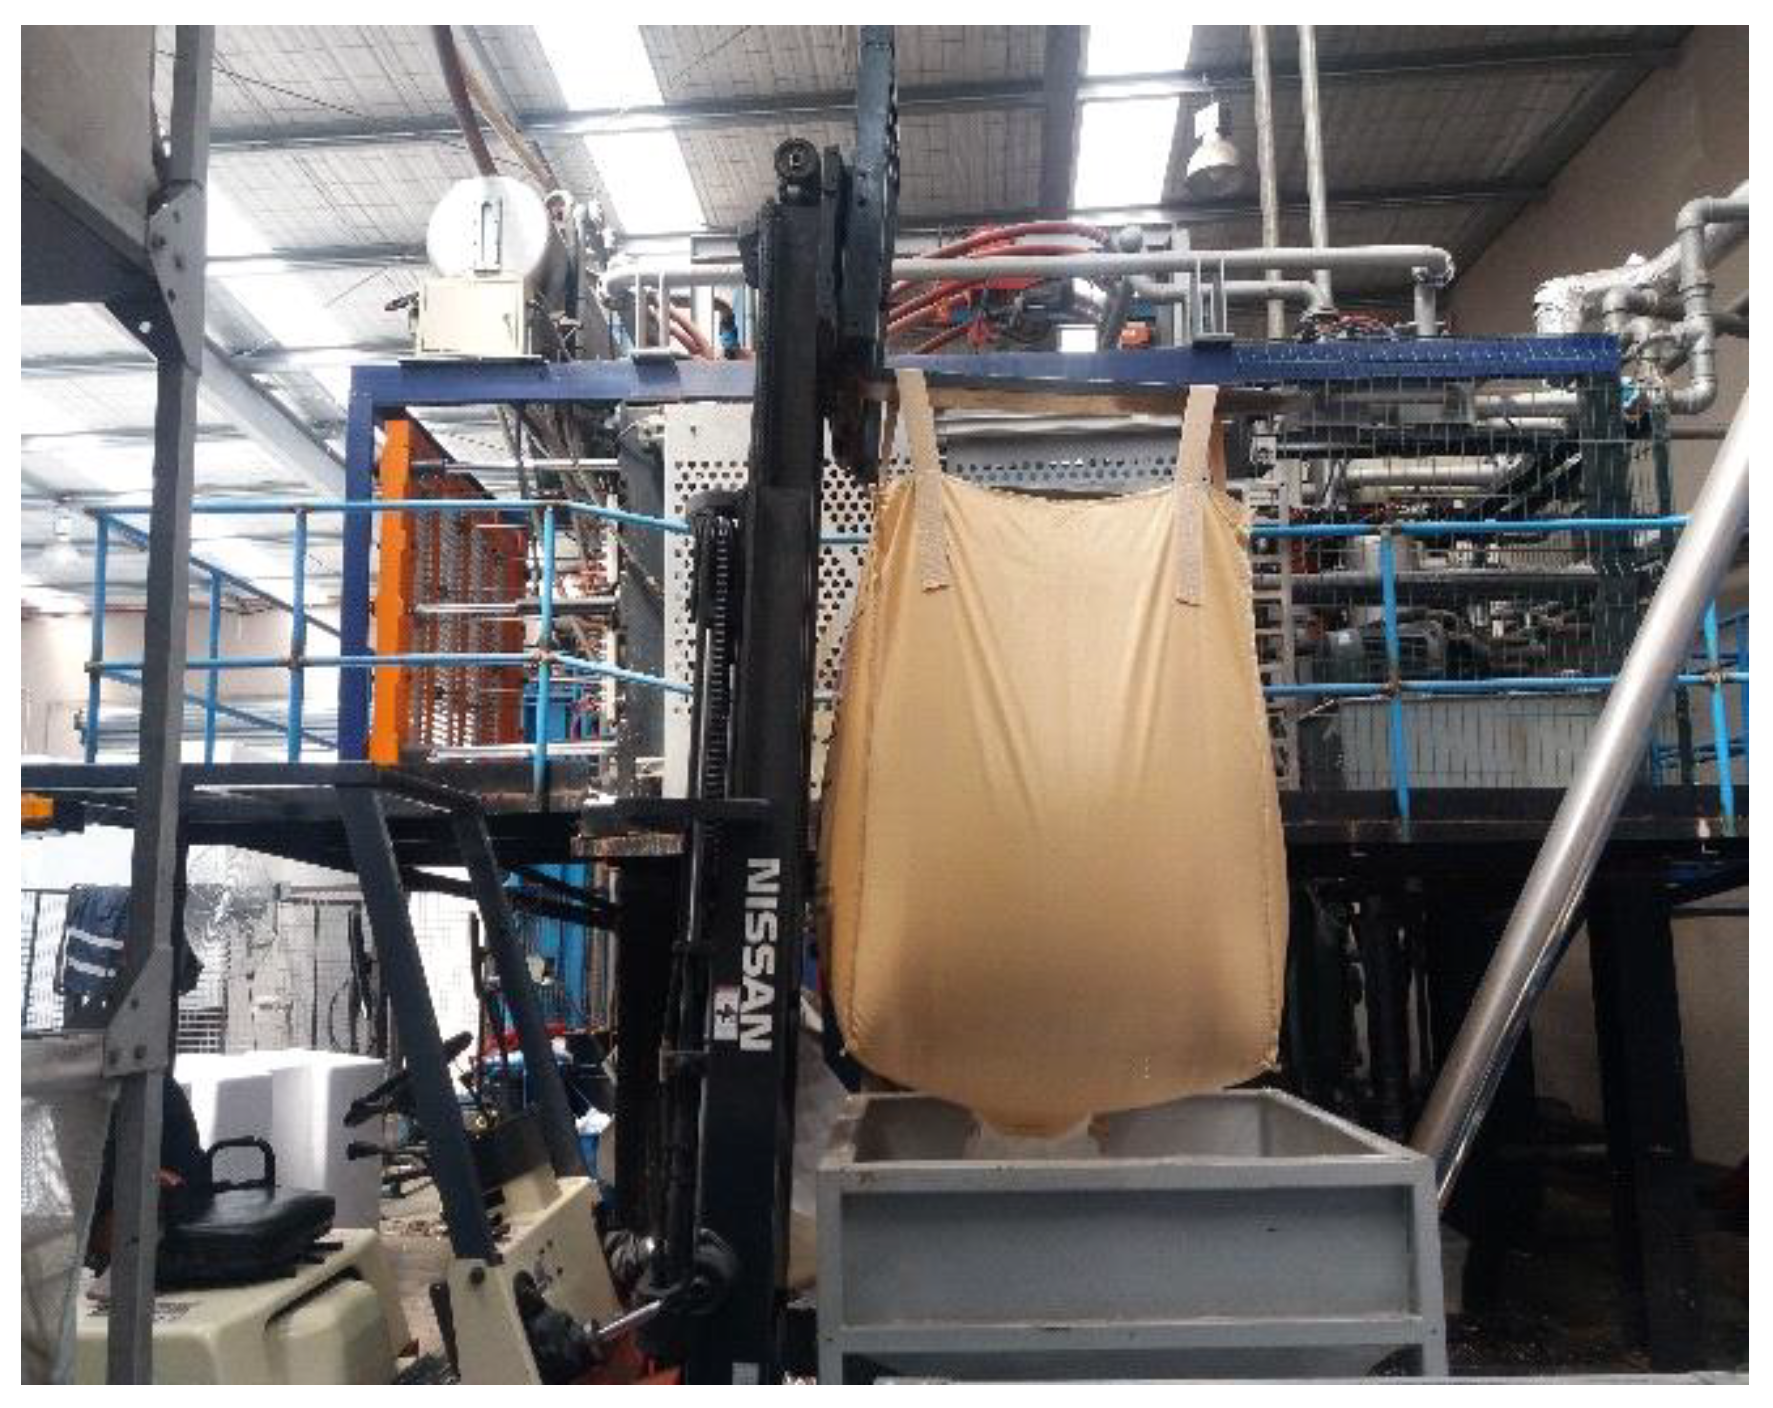
Figure 1) with a diameter that ranges from 0.2 mm to 2.0 mm. The resin is procured in large bags that contain between 800 kg to 850 kg of raw material i.e., polymeric expandable beads (
Figure 2).
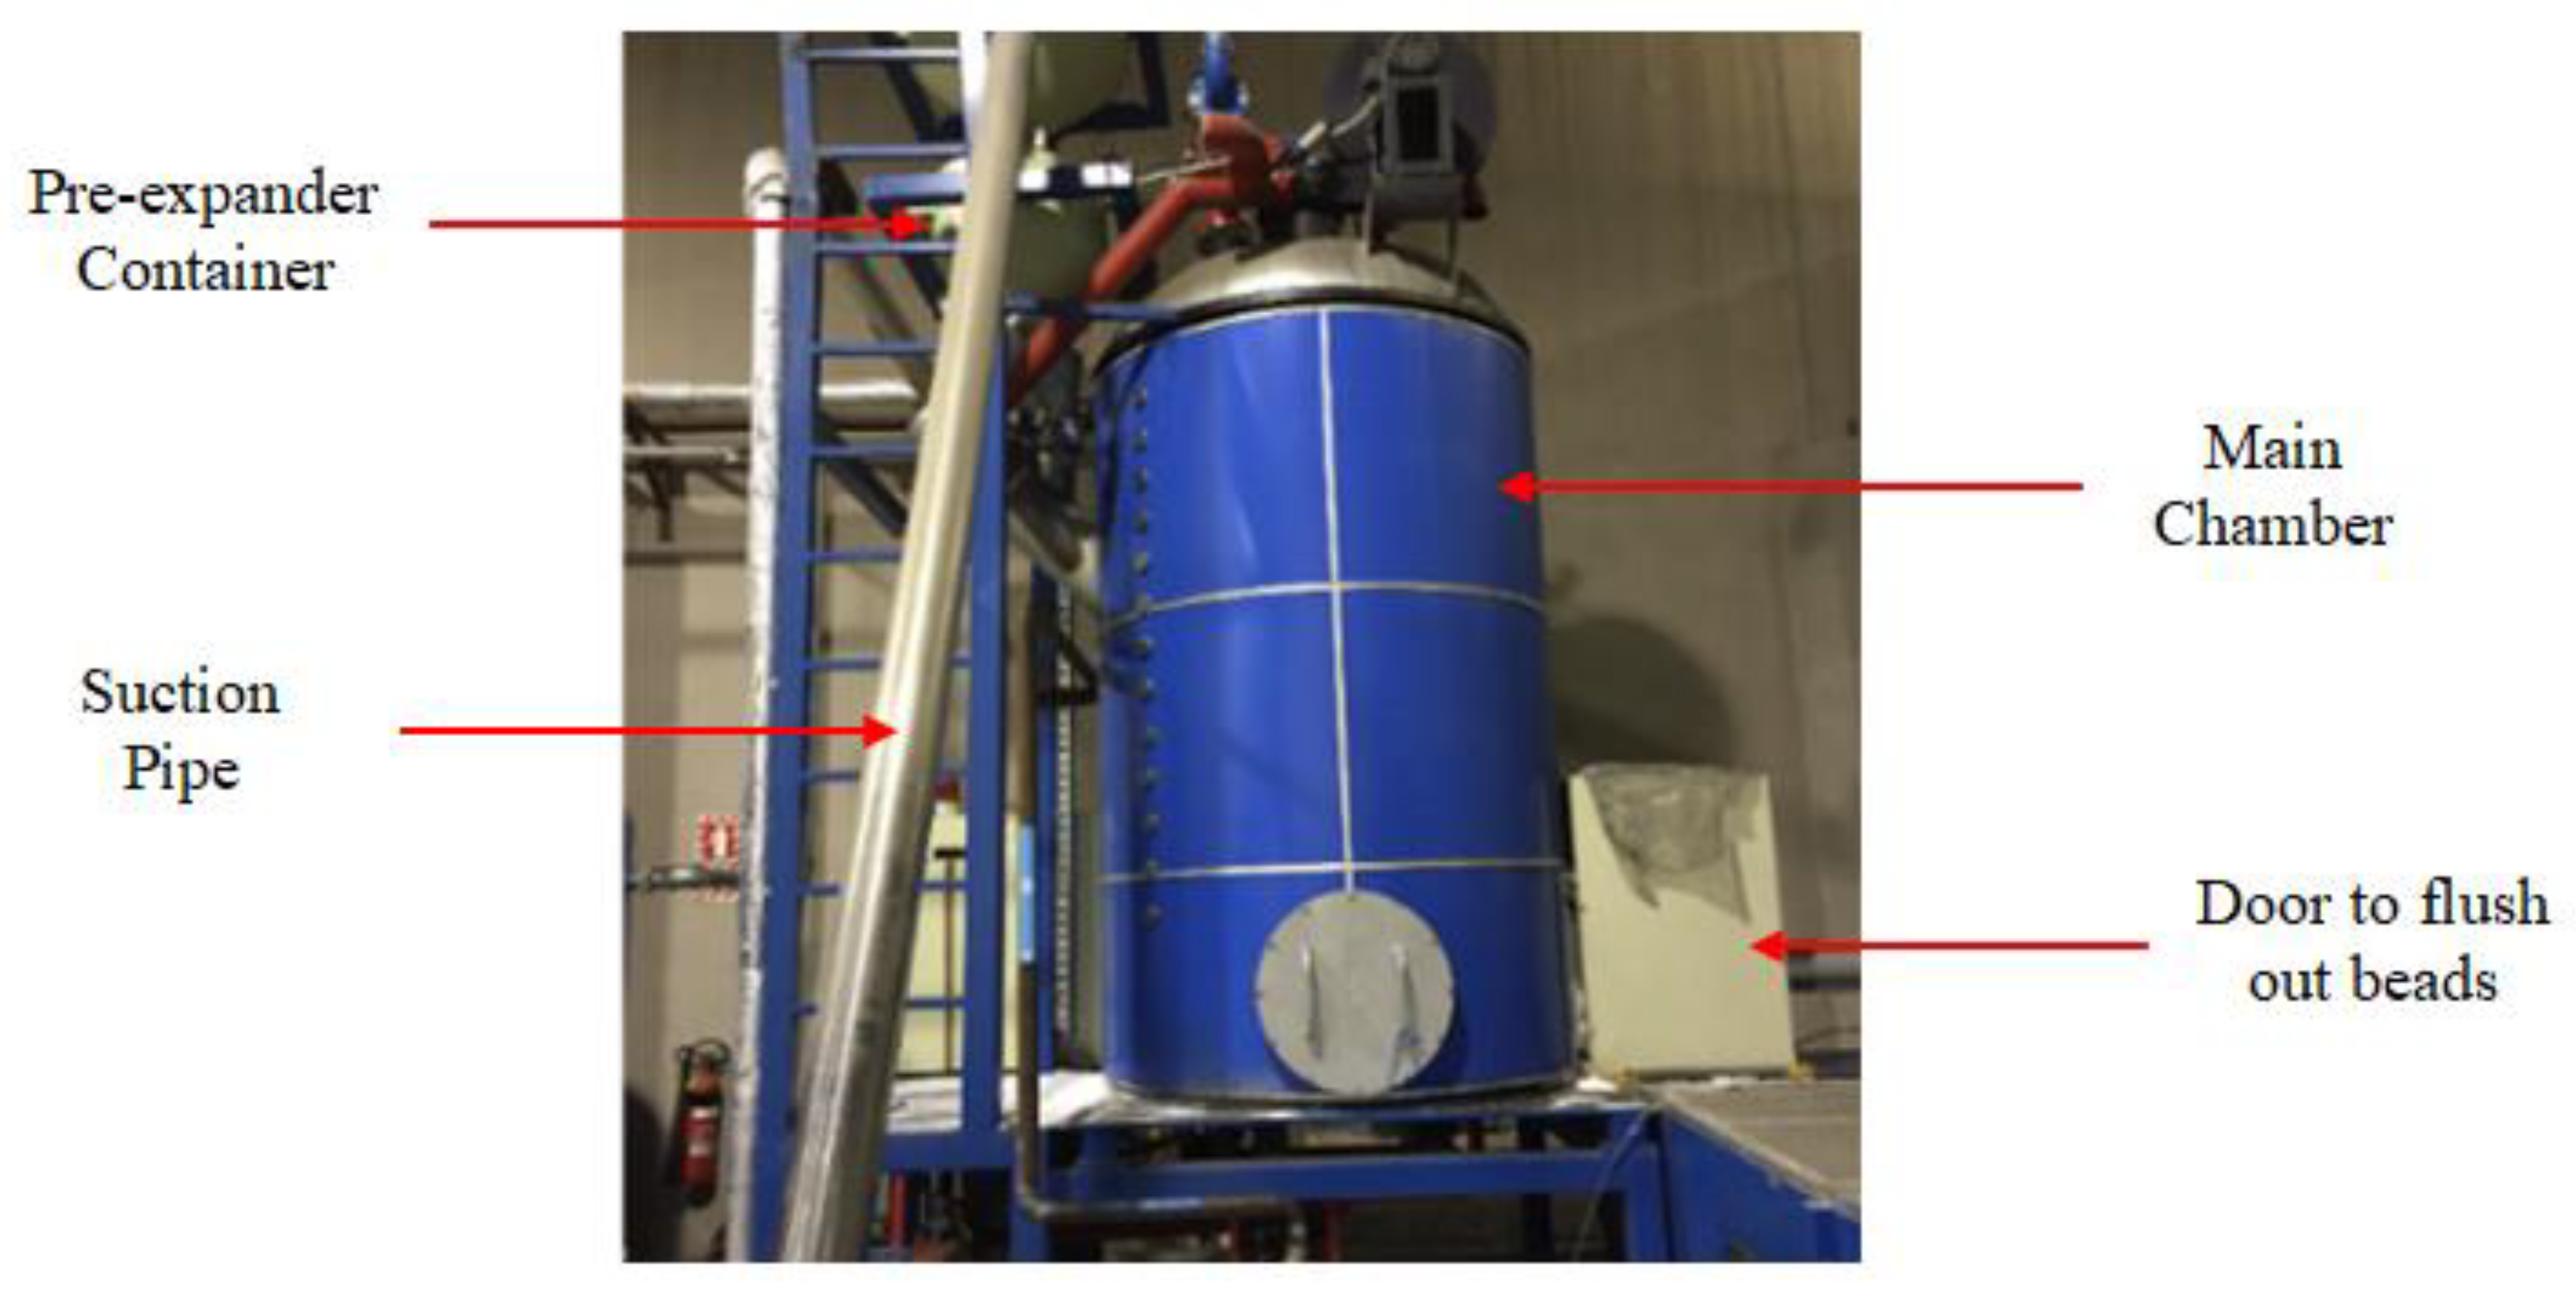
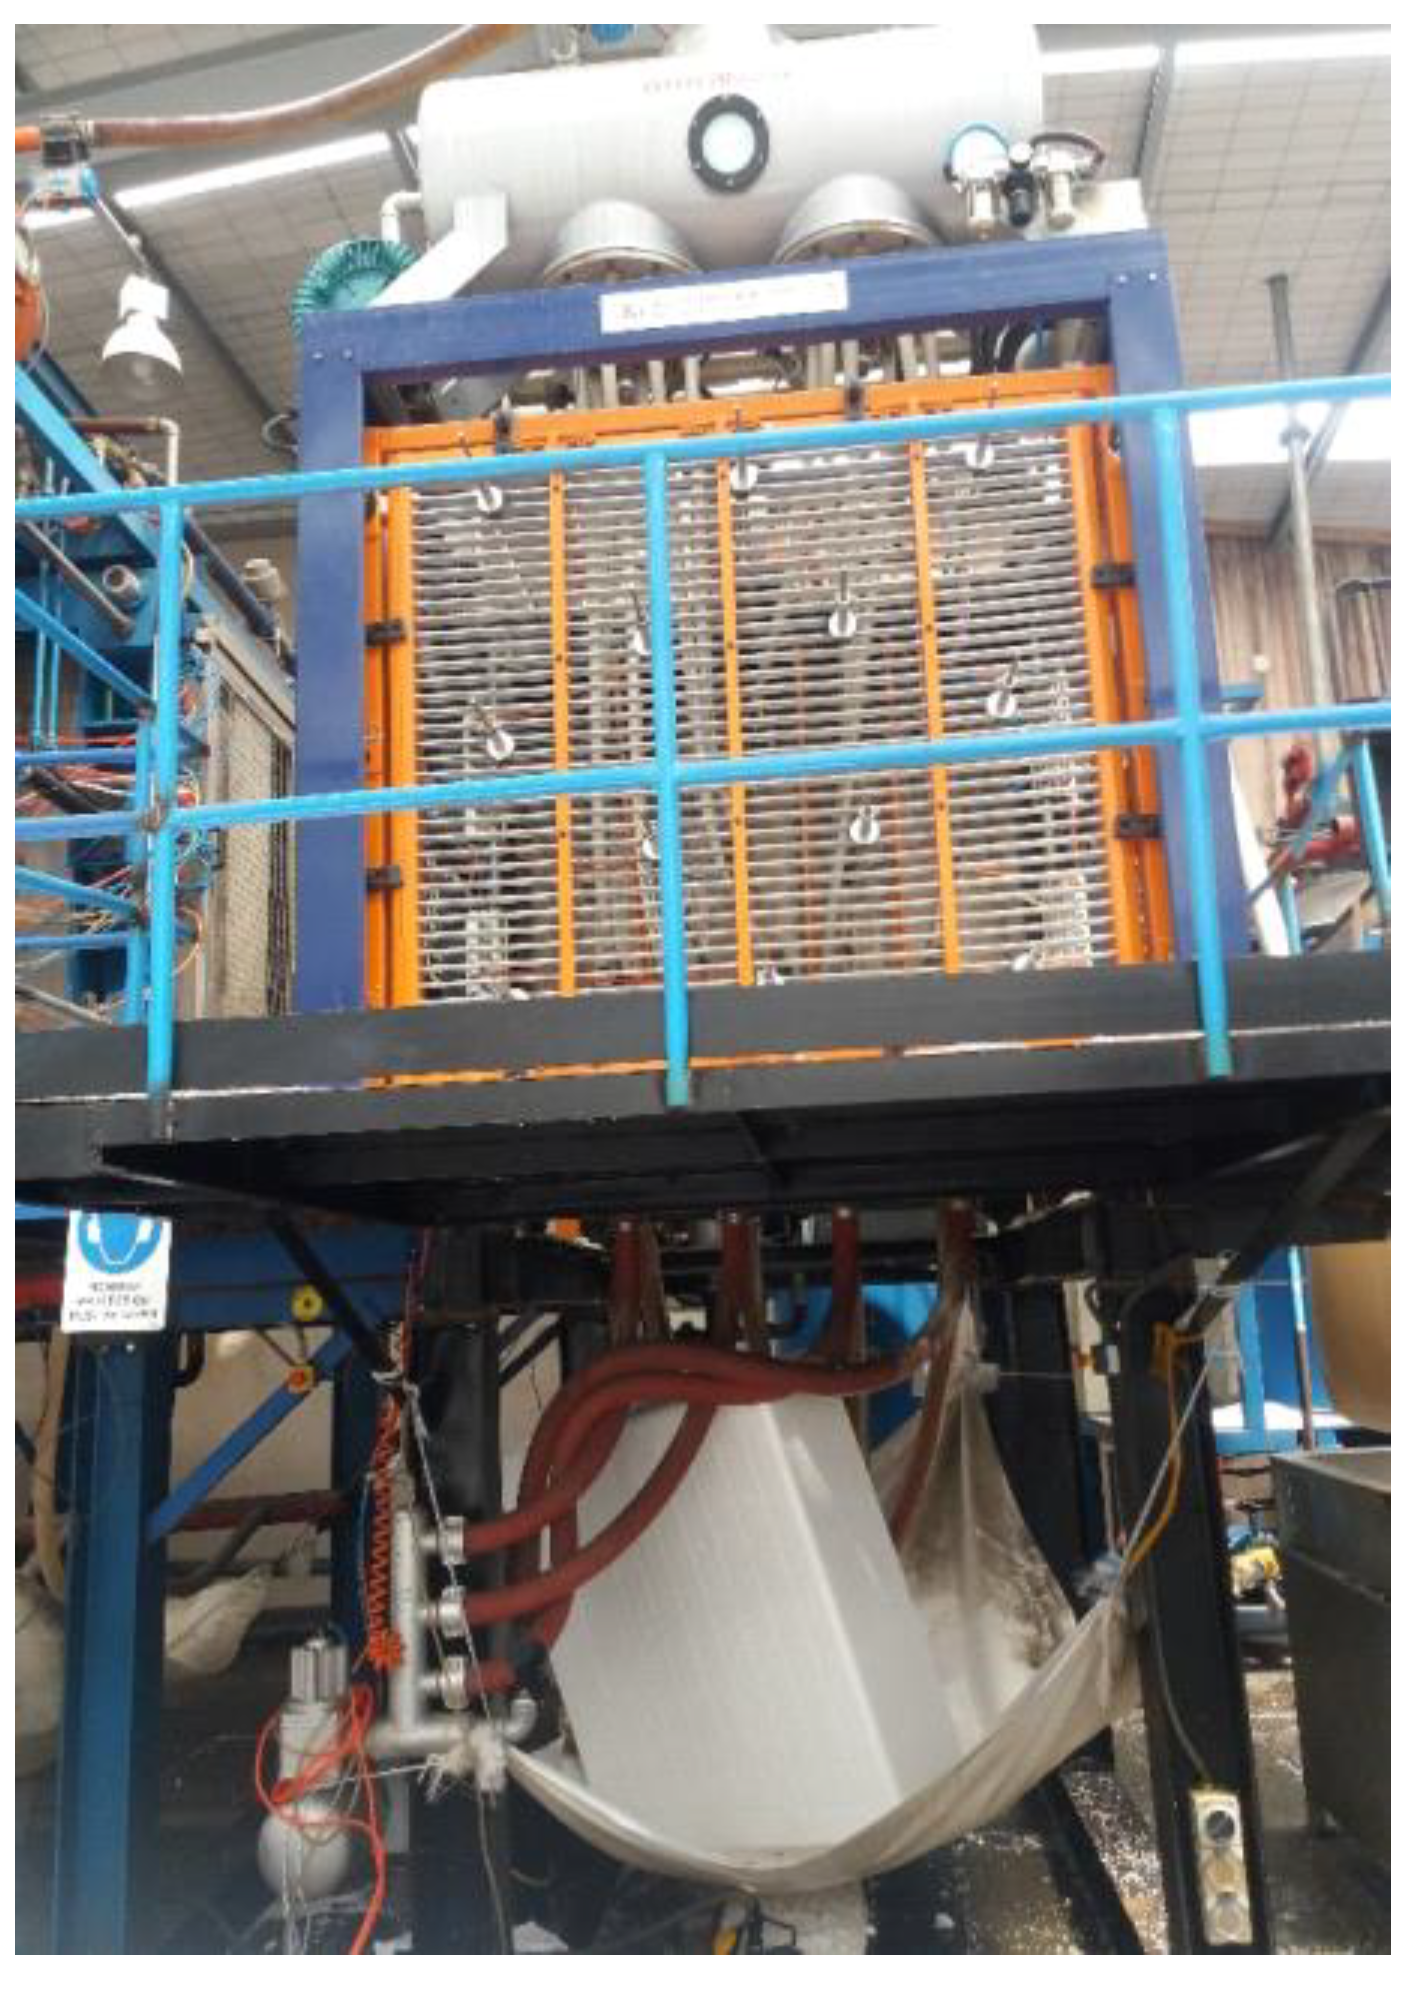
These tiny beads are placed in the bead expander machine (
Figure 3) from hopper filler through a suction pipe. The raw material is contained in the machine in different quantities through a censor-controlled mechanism. Depending on the type of product (pod or block) to be produced, the resins are released to the main chamber of the bead expander machine, where they are transformed into expanded beads. In the main chamber, the resin is exposed to the steam at high temperature that transforms it to as many as 40 times its original size; turning the resin into a hollow bead.
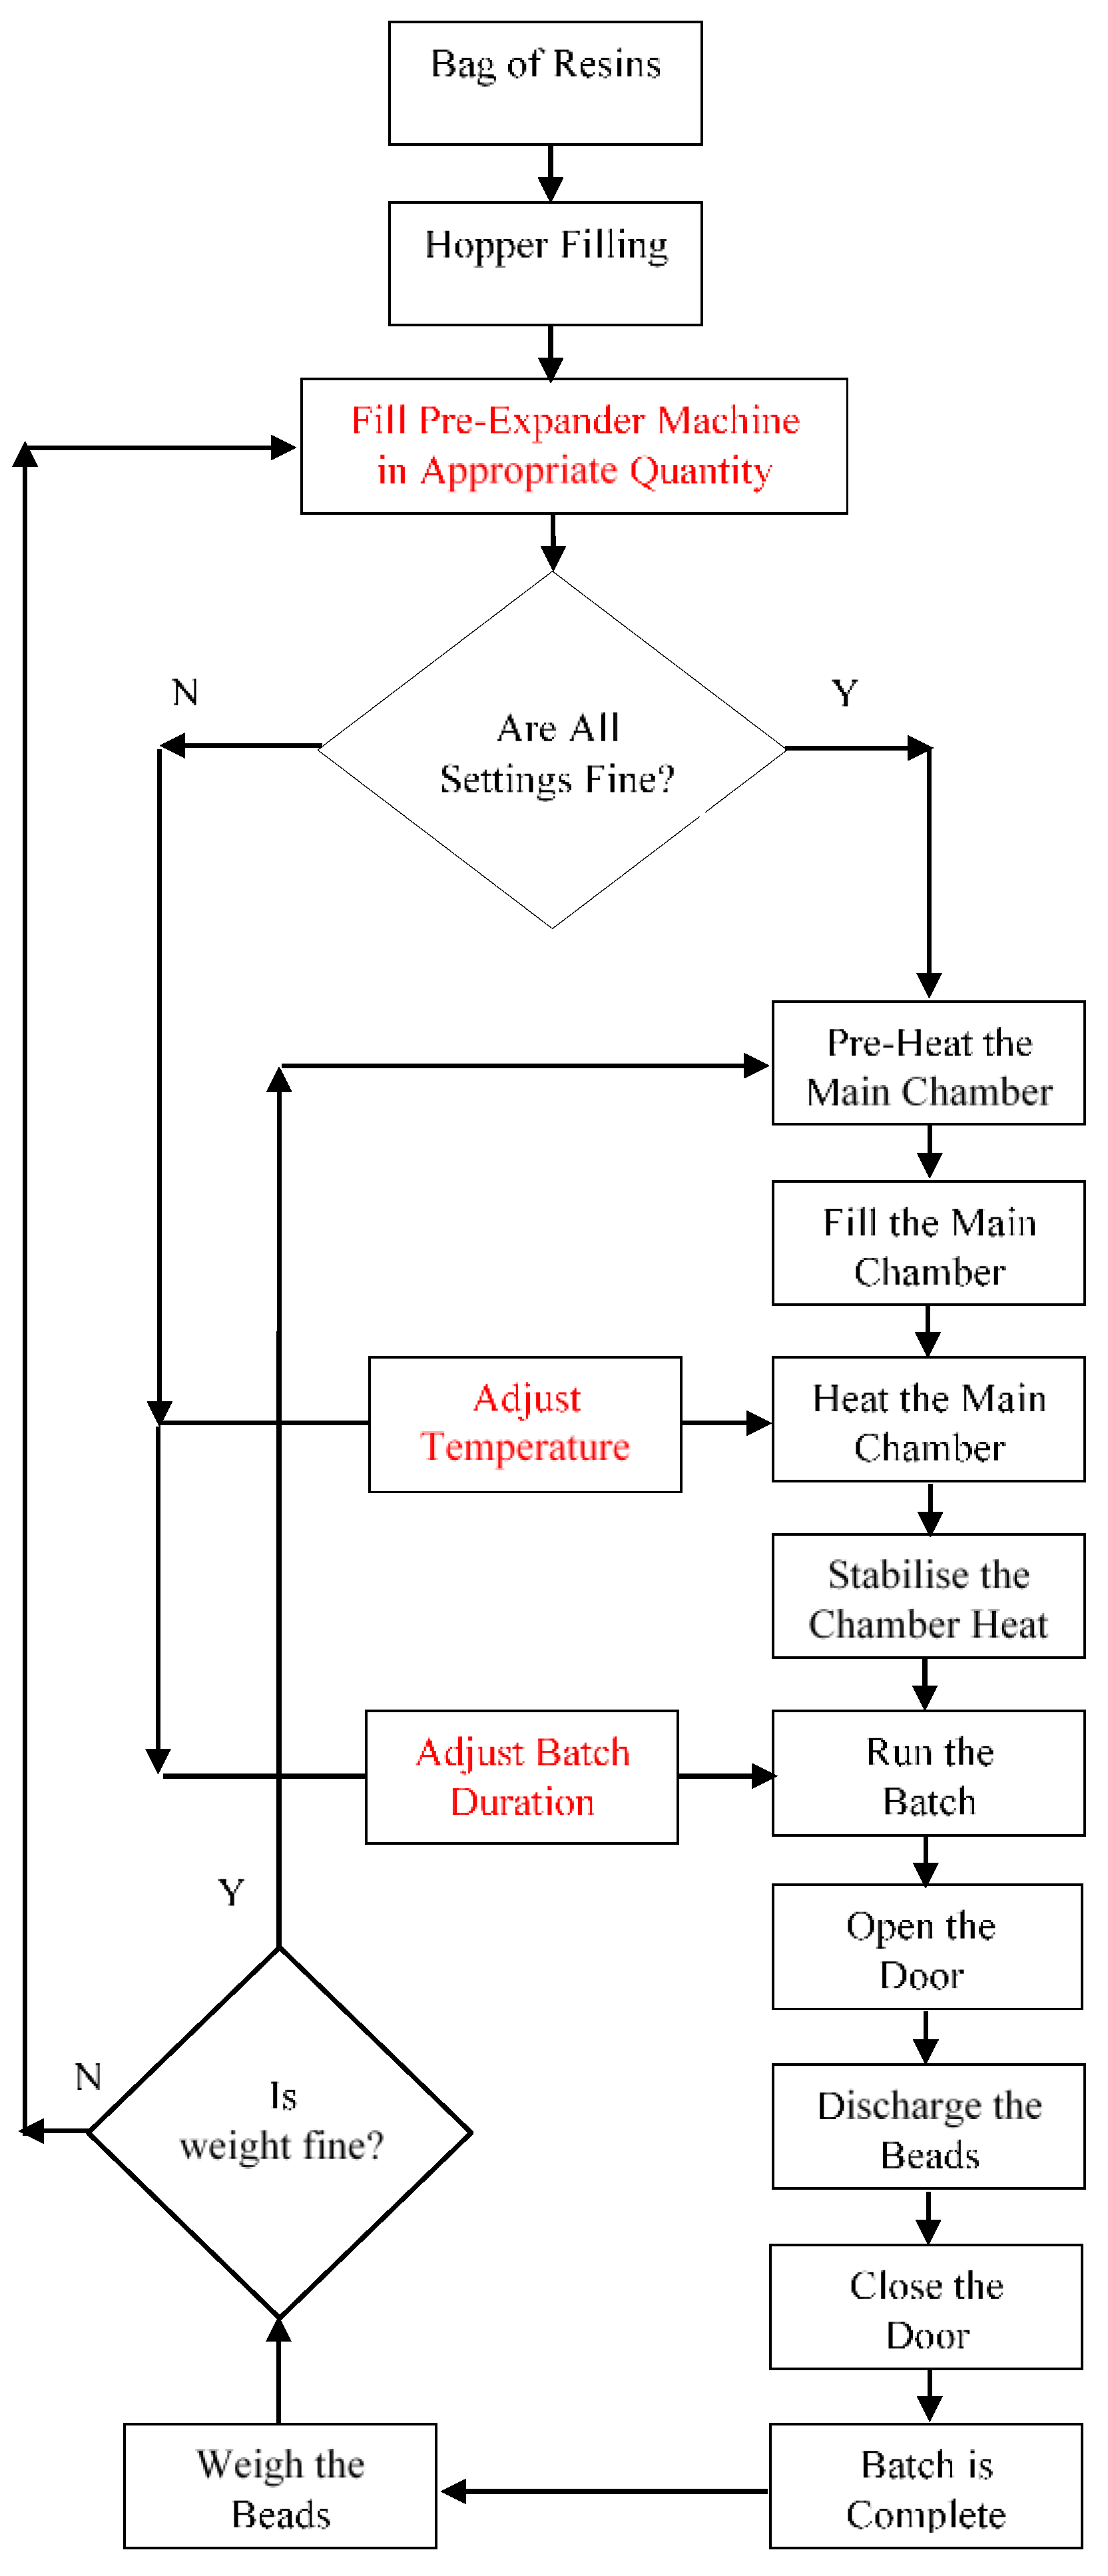
Transforming the resin into beads in the bead expander machine is one of the most important steps in the pod production process. This transformation is subjected to variations, and therefore it leads to different quality issues. In this phase, a set of sequential activities, such as establishing the resin quantity, filling the resin in the main chamber, pre-heating, heating, stabilising, and discharging of the beads is carried out. This is followed by closing the door of the chamber and waiting for few seconds for the next batch to start. However, before the next batch is processed, the weight of the expanded beads is recorded to ensure that it conforms to the desired specifications. If the desired weight is obtained, then the process is continued, otherwise the parameters are adjusted to suit the output requirements.
Based on the conversation with the operators,
Figure 4 presents a flow chart of the process associated with the bead expander machine to illustrate the sequential activities that are involved at this significant stage of the pod production process. Among these activities, during the transformation process, parameters, such as material quantity, temperature, and batch time, play significantly important role in converting polystyrene resins into the beads of foam. Due to a change in these parameters, beads of foam shrink or expand, leading to variation in the weight of the beads affecting the quality of the pod. In this work, different combinations of the parameters were studied along with their impact on the response variable to minimise the variation in the pod manufacturing process. The transformation process is operated through the state-of-the-art touch screen Programmable logic controller (PLC) mechanism that is built-in to the bead expander machine. The outcome of this process is a bead containing more than 95% air content in it. In pod manufacturing, consistency in the output can be achieved and improved by standardising the significant input parameters of the bead expander machine.
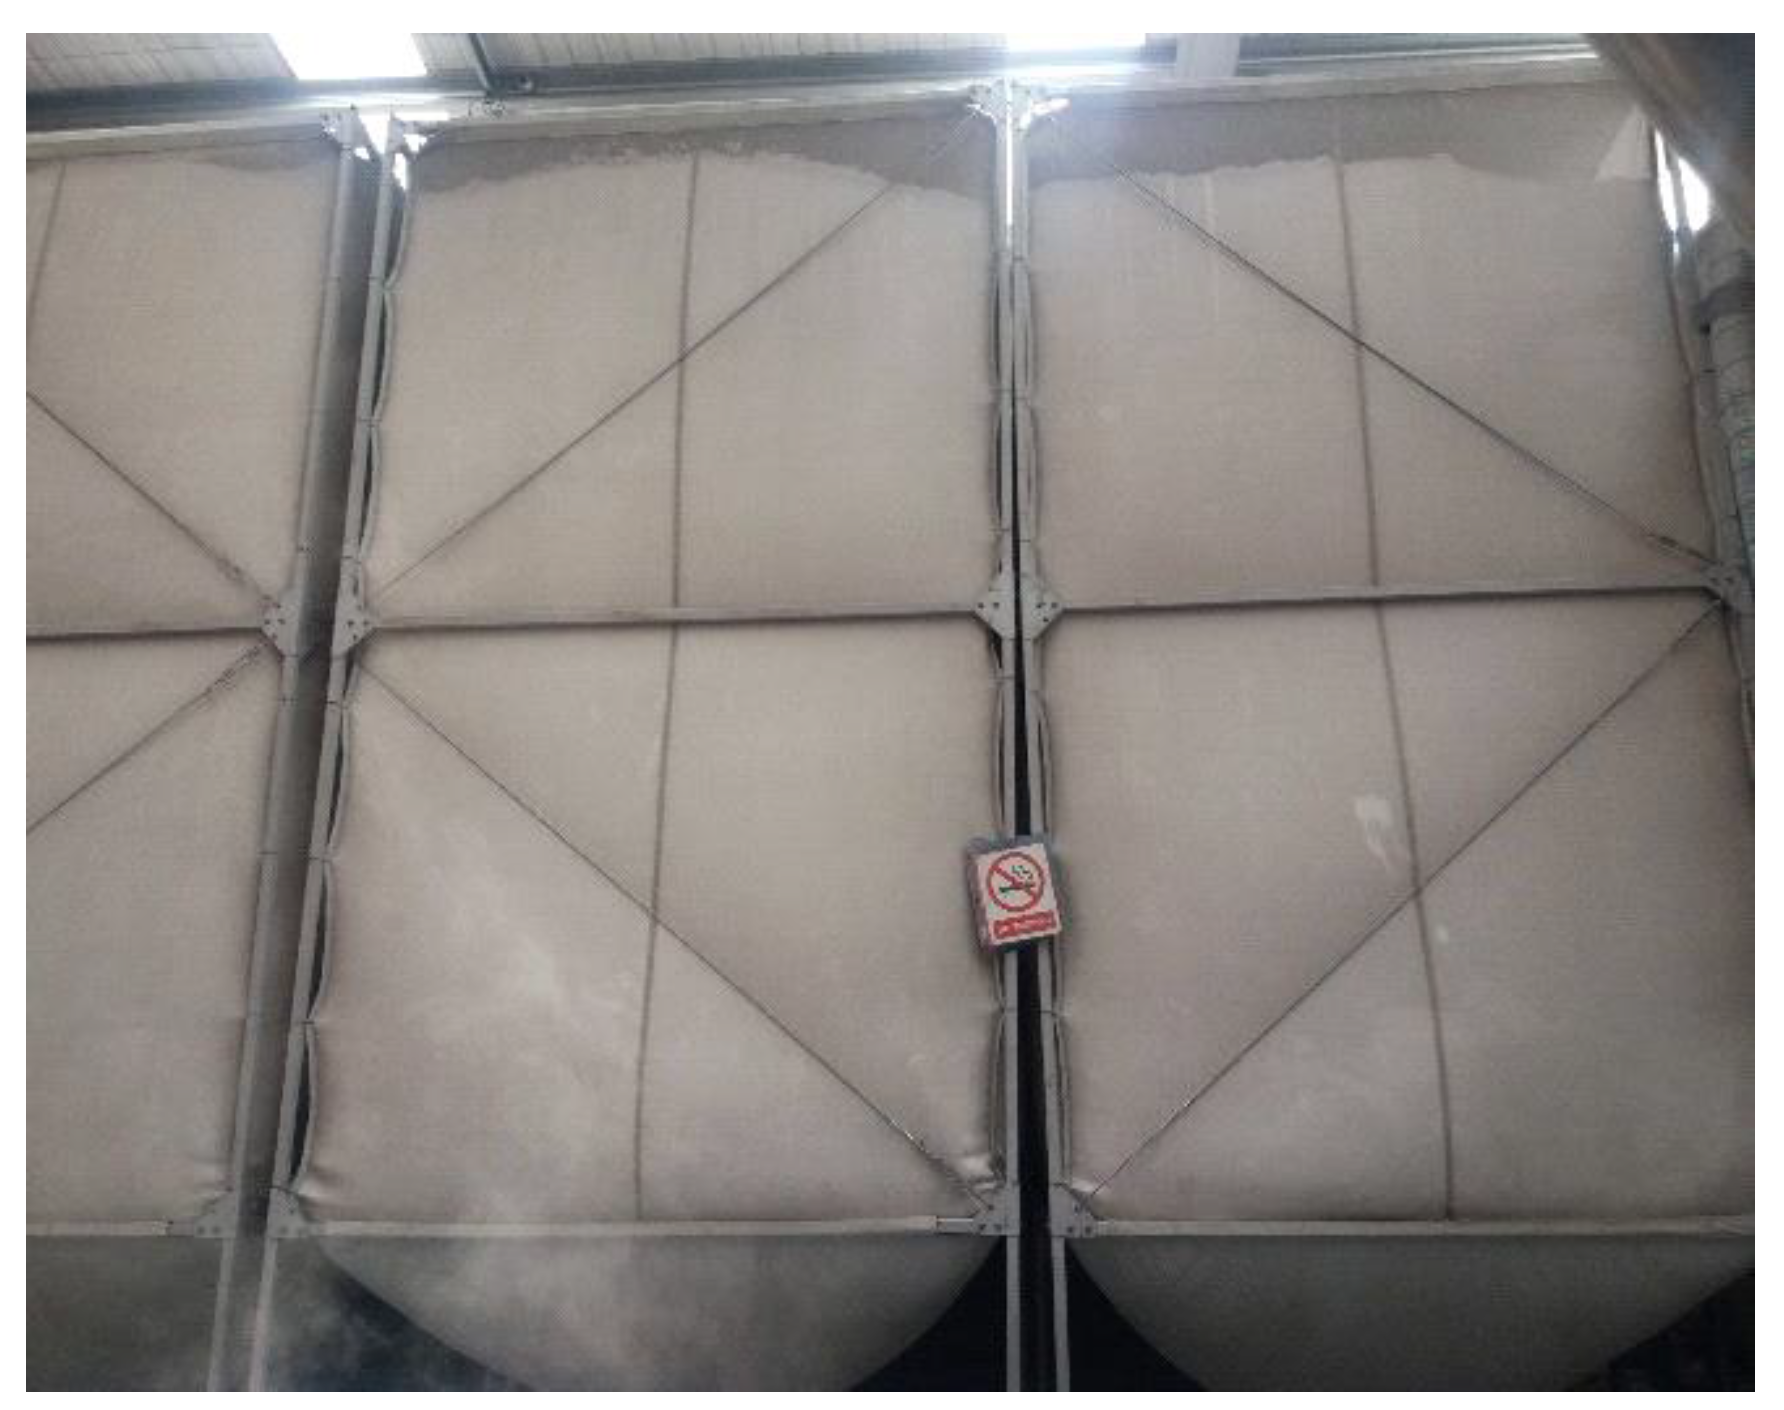
Once the beads are formed, they are allowed to cool down and are dried in large tanks (
Figure 5), preferably at least for a day. The cooling process, to some extent, removes, pentane, or butane present inside the puffed beads.
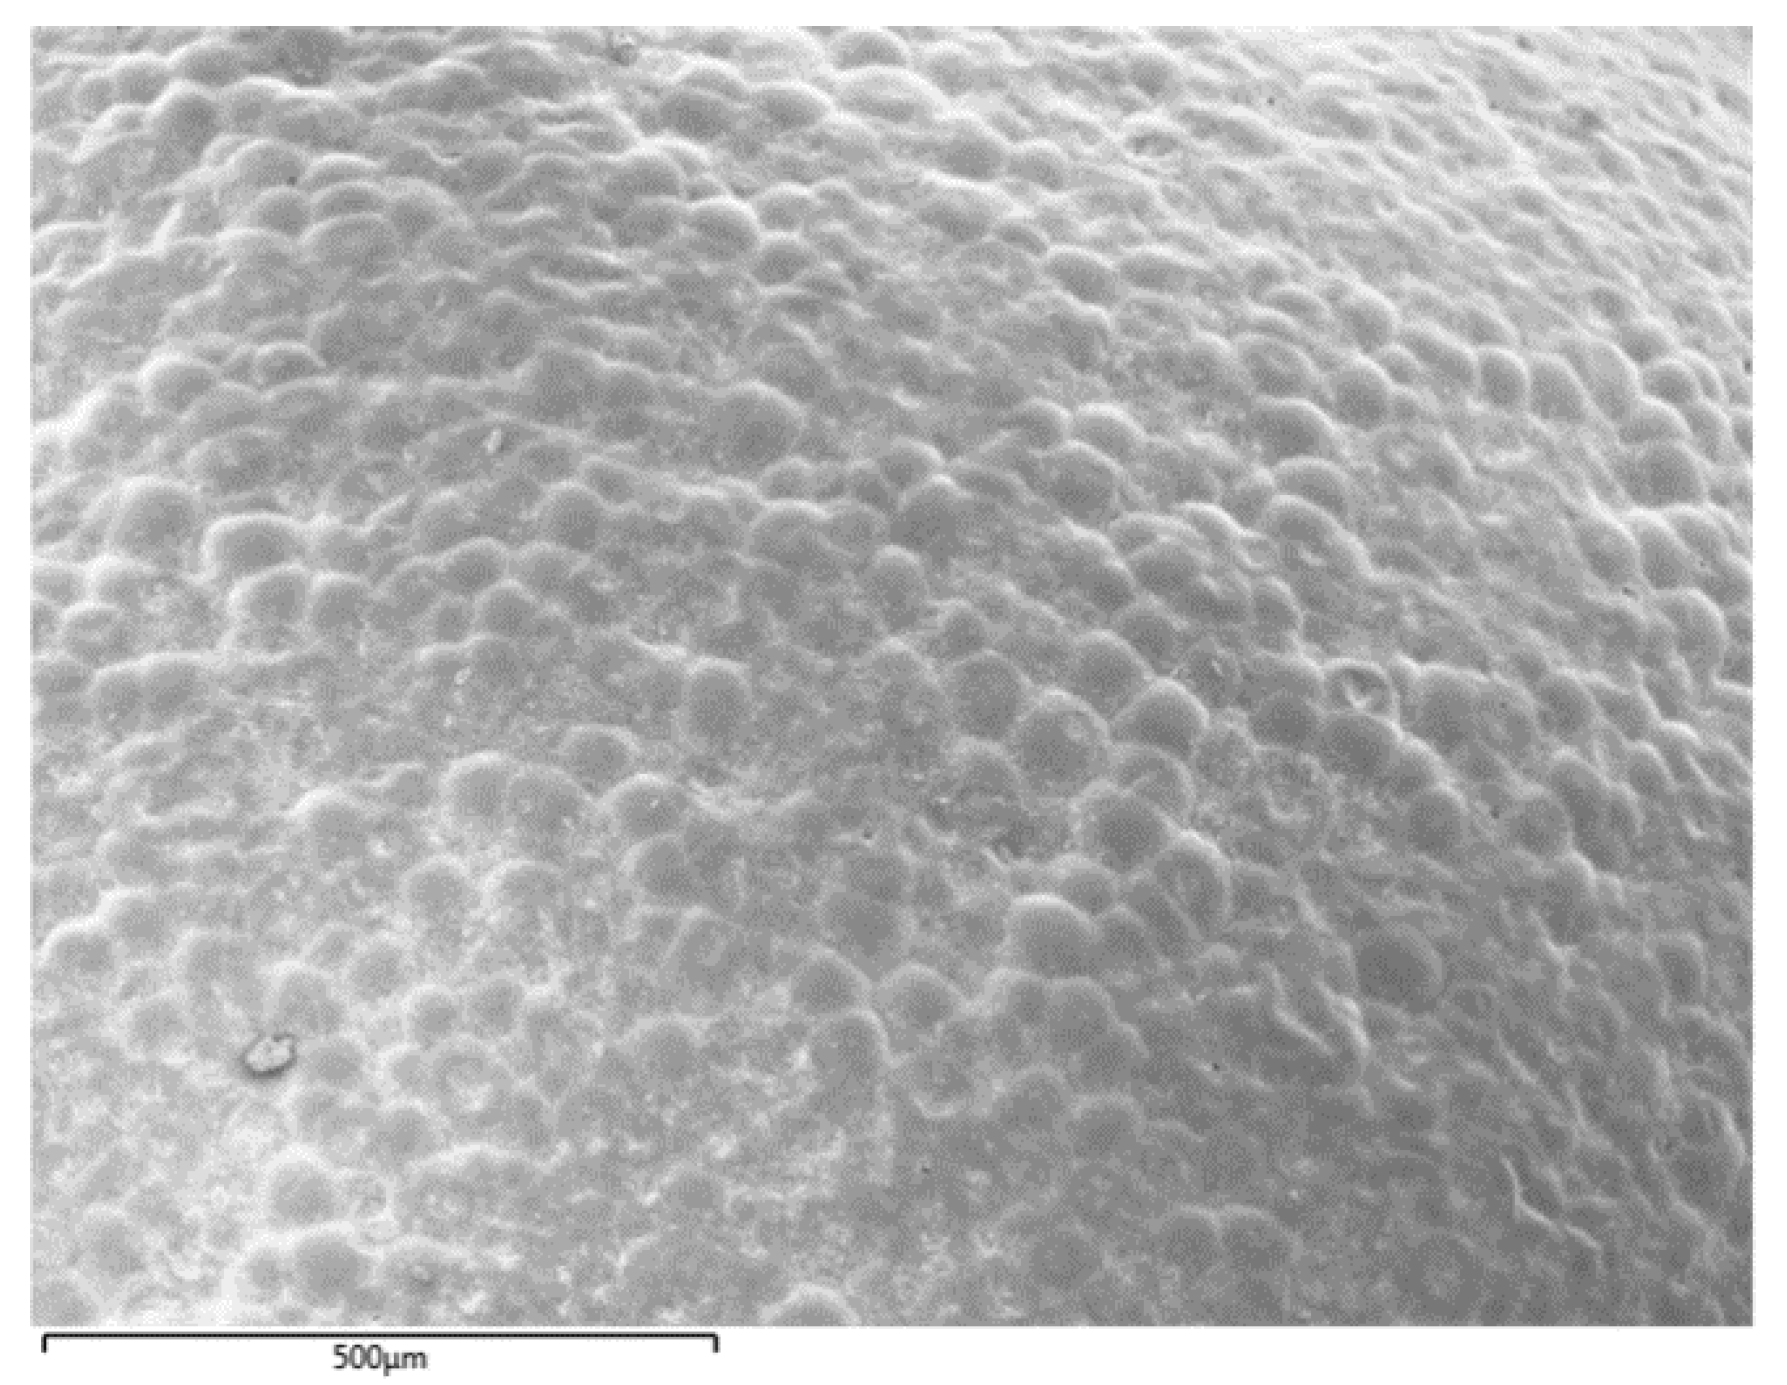
However, the expanded beads are not kept in the tanks beyond two days, as they may lose the chemical component significantly, which may have an impact on the final deliverable. In this case, the beads might not shrink or expand in the shape moulding machine appropriately when exposed to cross-steam, which helps in binding the beads to produce pods or blocks. As evident from
Figure 6, the over exposure of the beads to the external environment might severely affect their capacity to bind with one another and limits their ability to expand or shrink during the moulding stage. After the cooling process, the vacuum created within the beads is diffused to attain greater elasticity for the moulds. At this stage, the diffused beads are exposed to cross steam in the moulding machine, so that they bind together to form the desired shapes.
Two types of cross-streams are used in the moulding process; type P and Q, which represents the portion of the pod where the cross-streams are exposed on it during the moulding process. Type P is used for the front portion of the pod in which the stronger cross-steam (P
1) targets the four corners of the pod, whereas the relatively milder cross-steam (P
2) captures the mesh structure. Type Q cross-steam is exposed at the back of the pod with different intensities (Q
1 and Q
2), wherein the four back corners of the pod are captured by Q
1 and the even back surface is exposed to Q
2. It is observed that, if the beads vary in quality in regards to weight, then the beads may not bind together, properly compromising the quality of the pod. In this case, the pod is not good enough to be used for the intended purpose (under flooring) and it may end up with little use (packaging material) or no use (scrap). For pods, a greater density of the beads is desired to achieve better flexibility in the product. In
Figure 7, a manufactured pod released from the moulding machine is shown. The final product (
Figure 8) depends on the weight of the expanded beads. Three different sizes of pods are produced to suit distinct customer requirements, as presented in
Table 1.
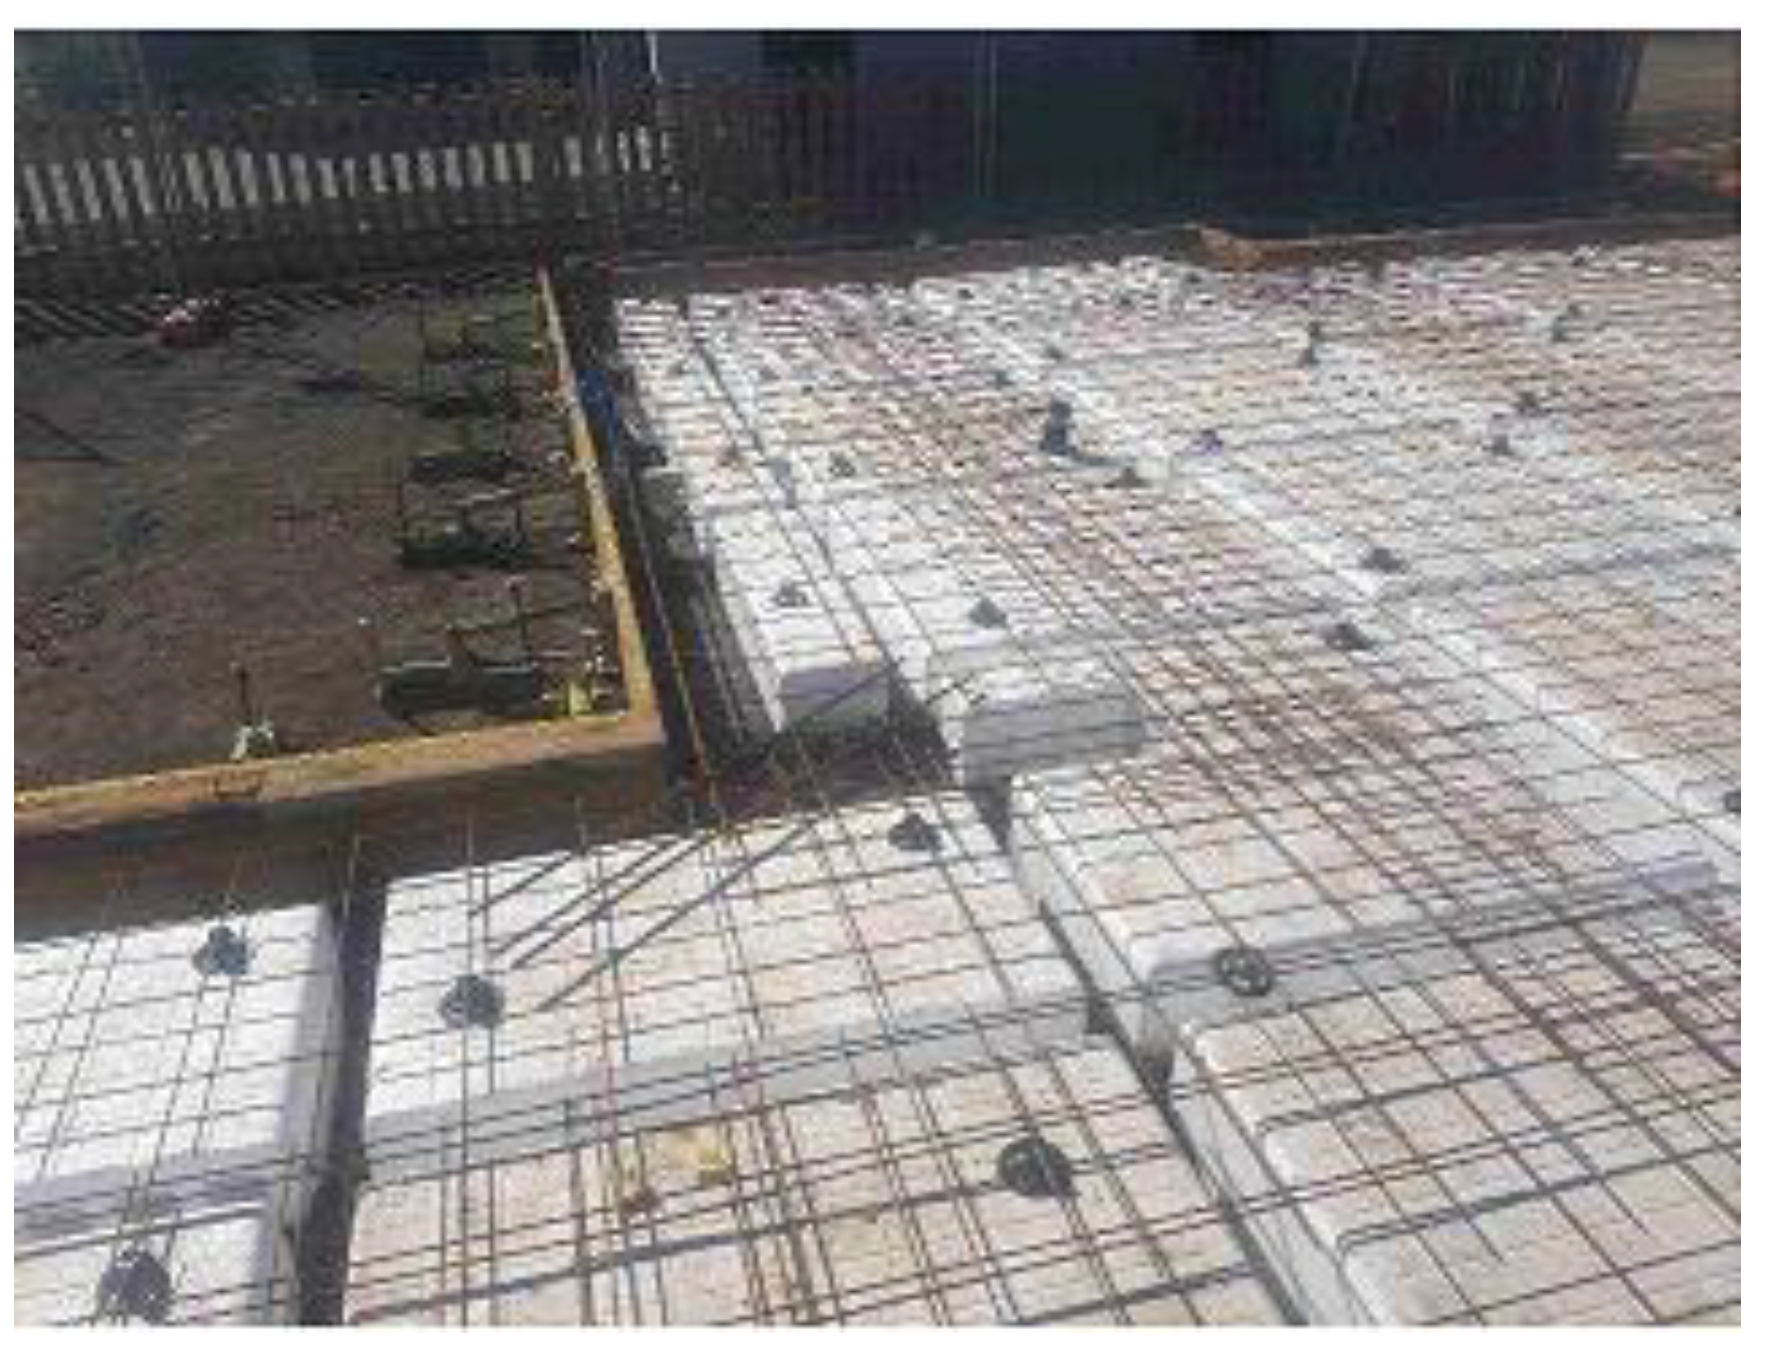
For all types of pods, the standard weight for beads of foam is 14 g in a 1 litre capacity container. However, for blocks it is different for standard, high, and very high grades i.e., 18 g, 24 g, and 27 g, respectively. After the pod is manufactured, it is tested with respect to quality specifications and is shipped to the construction site to be laid in the foundation of the building (
Figure 9).
3. Methodology
Experimental design techniques are used to study the behaviour and impact of the significant input parameters on the response variables in developing new products, improving existing product designs, and achieving process improvement. Regarding an experimental design based work, Hinkelmann [
23] and Davim [
24] suggested that, for more comprehensive study, a full factorial design should be preferred, as it explores all of the possibilities associated with the experimental set up. In this study, Taguchi methodology is used to investigate the effect of controllable parameters of Pod production on the weight of the bead in order to obtain optimal combination of the parameters, which yields minimum weight of the expanded beads. The Taguchi method makes use of orthogonal arrays (OAs) for designing the experiments. This method is based on the additive cause and effect model, which can be explained, as follows:
Suppose that a process is affected by two factors i.e., A and B, and the effects of factor A and factor B on the response variably Y are represented by α and β, respectively. Taguchi suggested that in many practical situations the effects of factor A and factor B, also known as main effects, can be represented by an additive cause and effect model that is given in Equation (1).
where, µ = mean value of Y within the experiment range, α
i and β
j = main effects of factor A and factor B, respectively, e
ij = error term.
The Taguchi method is a partial factorial design of experiment that is widely used by researchers for design and process optimization. When compared to other methods, its advantage is that it provides the desired results with minimum number of experiments, which results in significant savings of resources, such as money, time, etc. The Taguchi method is a well-celebrated technique that provides a structured and efficient methodology to streamline a process [
25]. Significance of the application of Taguchi methods and its variants in different industrial applications is evident from the works of Mota-Gutiérrez et al. [
26], Jeyapaul et al. [
27], Beyer and Sendhoff [
28], and Bendell et al. [
29]. Among others, Taguchi’s approach was considered by the researchers to address process improvement in food [
30,
31,
32], healthcare [
33], electronics [
34], and manufacturing [
35,
36] industries.
3.1. Factor Selection and Their Levels
In this study, three controllable parameters, i.e., weight of untreated beads (A), batch duration (B), and temperature (C), each at three levels are considered. The factors and their levels are selected after observing, and by consulting with the experienced operators that are involved in the pod production process at the facility. In general, factor levels are equally spaced as closely as possible to the lower and upper bounds. Even though the factor levels are continuous, they are not theoretically equidistant in the case of ‘weight of untreated beads’ and ‘batch duration’ factors due to operational constraints to conform to the market requirements.
Table 2 shows the selected factors and their levels.
3.2. Experimental Design
Taguchi method involves an experimental layout as an orthogonal array that has various combinations of the levels of the factors that correspond to each experiment Phadke [
37]. In this study, an L
27 orthogonal array as shown in
Table 3 is used. Through this orthogonal array, not only the effect of main factors, but also the interaction effects, if any, of the factors can be easily investigated [
25]. This orthogonal array suits the experimental design for the factors and their levels considered in the study. The L
27 orthogonal array has twenty-six degrees of freedom and it can be used to perform the experiments required in this study. The degree of freedom of an orthogonal array is obtained by subtracting 1 from total number of experiments of the array. L
27 orthogonal array has 27 experiments and, therefore, its degree of freedom is 26 (27 − 1 = 26). Based on the data that were obtained for the study, the experimental layout for three factors each at three levels is shown in
Table 3. In this layout, each row represents a trial condition or experiment that involves the factors that were included in the study at different levels. For each trial run, three replicates of the response variable i.e., the weight of the expanded beads are observed. These trial runs are carried out on the random basis to avoid the influence of the experimental setup during data collection [
25].
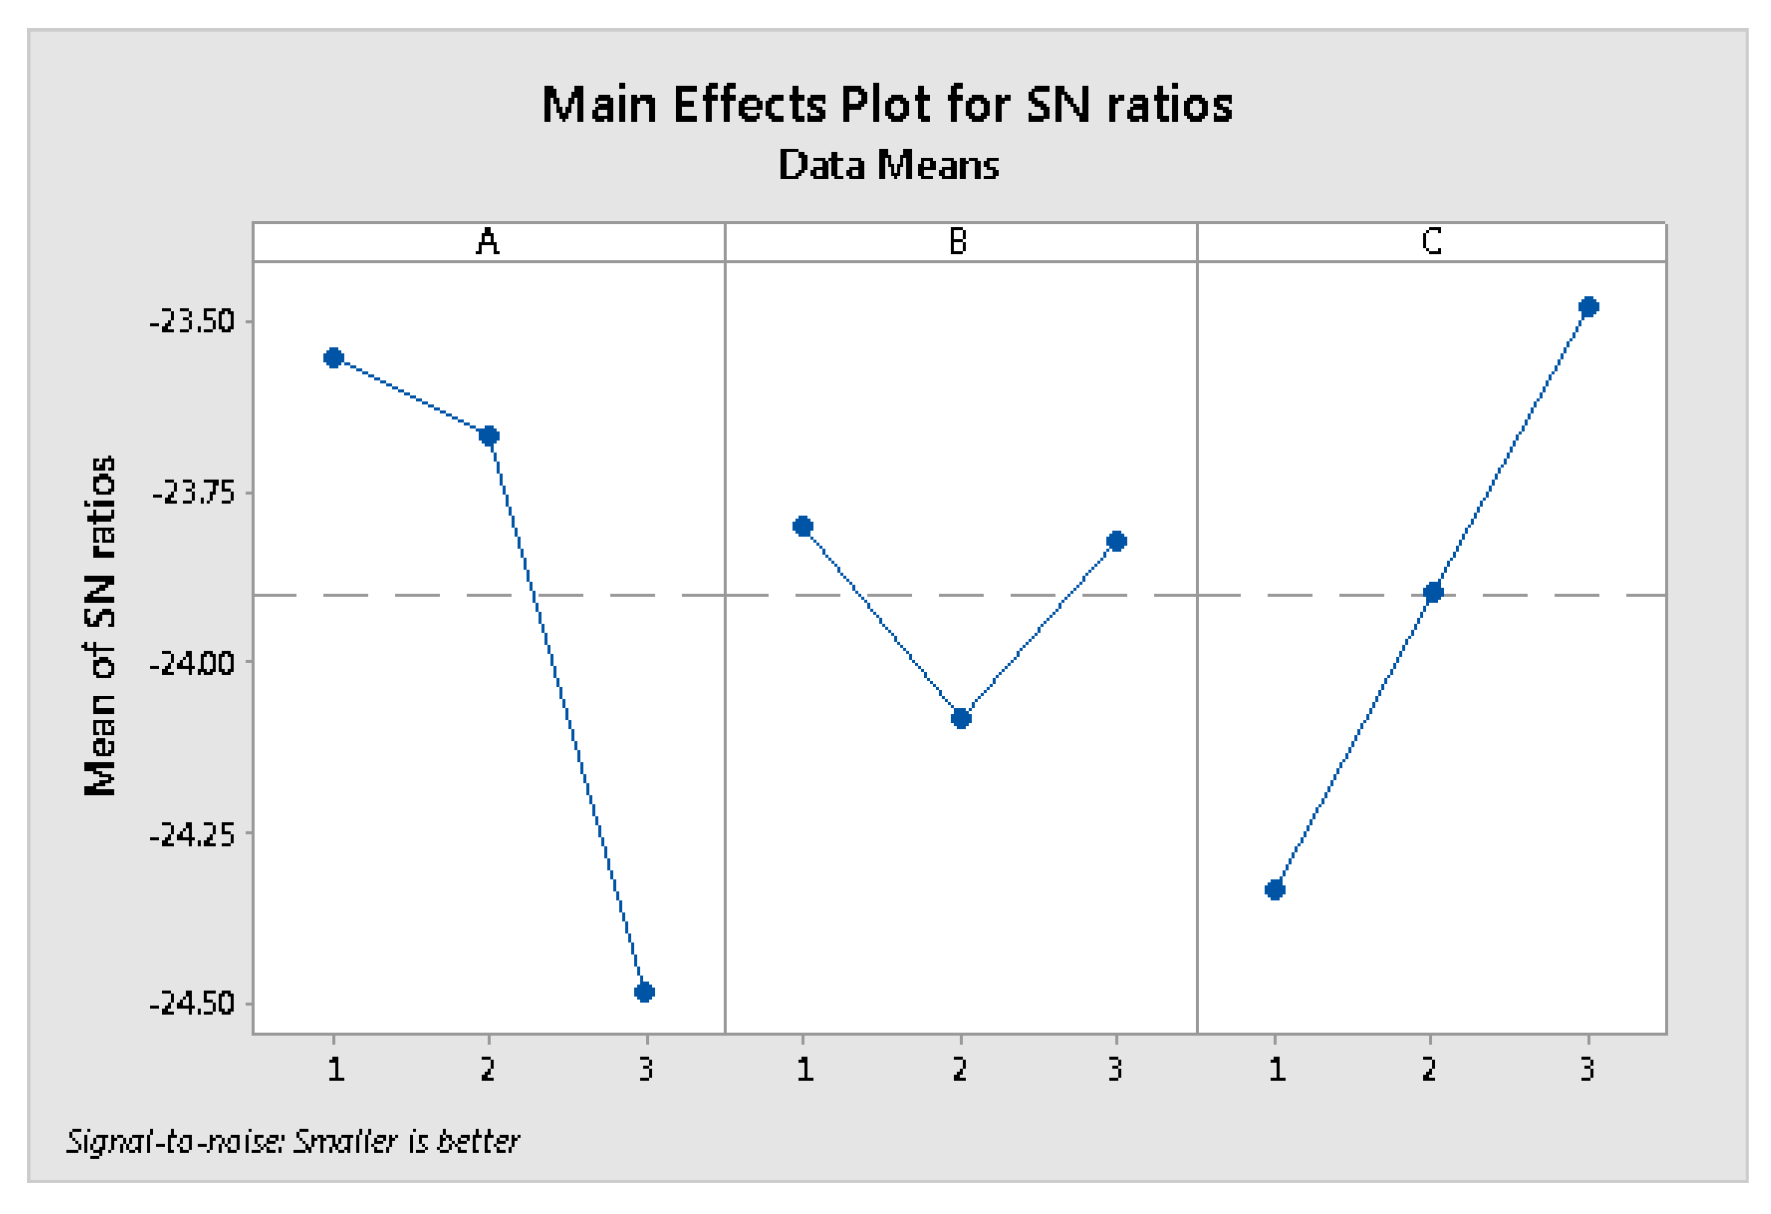
5. Conclusions
Pods are essential components that were used in the construction industry to provide under floorings and insulation in the buildings. The quality of pod plays a significantly important role in providing desired characteristics to the buildings. Pod quality, in turn, depends upon the optimal setting of the process parameters, which is used for its manufacturing and, therefore, optimal setting of the parameters needs to be determined. This study demonstrated the application of the widely used Taguchi method in the determination of the optimal combination of the process parameters that yields the minimum weight of the expanded beads. In this study, the effect of three important parameters of pod production process i.e., weight of untreated beads, batch duration, and temperature on the weight of the expanded beads is explored. Based on the results that were obtained from the analysis of the experimental data using Taguchi’s L27 orthogonal array, it is found that, within the range investigated, the optimal setting of the parameters is A1B1C3. The two way interactions between the factors are not found to be significant. For consistent performance and good quality production of the beads, the production process is suggested to be operated with the weight of untreated beads at 17 kg, batch duration of 130 s, and the temperature at 155 °F. This optimal combination of the process parameters yields a consistent weight of the expanded beads. Furthermore, the confirmatory experiment showed that, at optimal parameter settings, a reasonably streamlined and robust pod manufacturing process can be achieved. Moreover, the confirmation experiments also indicated that, at optimal combination of the parameters, there is no significant difference between the experimental and predicted values of the S/N ratio. It is emphasized that improved and streamlined processes, such as pod production in the EPS supply chain, can be helpful for the manufacturers to streamline their production operations and mitigate waste in the chain. Thus, in continuation to this work, a longitudinal study may be carried out in the future to assess the impact of EPS waste during the pod production process by capturing the Cost of Quality (COQ) in the downstream chain activities.

 ,
, 


