Abstract
Production now requires the management of production processes and operations on the basis of customers’ demand to ensure the best combination of technology and humans in the system. The role of the humans in the production process is very significant for the production and quality of the product. The production system depends upon technology and human factors and is highly influenced by the working conditions of the workers, that is, work load, physical, dealings, job timings and so forth. In the current global economy, minimizing production costs is a serious priority for the industries. However, the costs of bad working conditions increase the intensity of the average stress among employees to cause extra costs by affecting the workers’ efficiency and products’ quality, which is invisible in the eyes of decision makers. This research identifies the cost of workers’ stress by developing a linkage between the economic benefits of the firms and the social upgrading of the workers. A numerical example of a production based system is performed to represent the real-time application of the proposed model. A sensitivity analysis is also carried out to quantify the impact of average stress among workers on the production system. Sequential quadratic programming is used to optimize the given nonlinear model for production planning. The optimal results influence ergonomics awareness and the relationship with the safety culture among managers in a firm. It is concluded that efficient and effective production cannot be possible without considering the working conditions of humans in the firm. Managerial insights are also generated from the implications of the results and sensitivity analysis.
1. Introduction
The production industry is considered one of the key indicators for the development of a nation. Human resources are a significant approach to a firm’s performance and it is believed that the most important assets of the firm are its people. The workforce has been an important variable for management to maximize the revenues [1]. Despite these assessments, managers are giving a relatively low priority to workers. That is the reason why, when a firm needs to cut costs, they first look to the investments in the worker, that is, wages, training and firing [2]. Human workers require social development and deserve a good working environment to avoid workplace stress. It is the responsibility of the firm to provide a safe and healthy environment for the workers for better performance and productivity.
Work-related stress and workplace violence are widely recognized as major challenges to occupational health and safety [3,4,5]. Most injuries at work occur from physical stress and the strain to perform repetitive and overused tasks, over a long time, which results in damaged joints, muscles, and tendons [6]. Job stress can be defined as the occurrence of harmful physical and emotional response when the requirement of the work does not fulfil the capability of worker [7]. It is considered as a major challenge to the individual on the basis of mental and physical health, and it also damages the organizational health [8]. Job insecurity and physical exertion at the workplace also cause stress. Stressed workers are more likely to be unhealthy, less motivated, poor productivity and a less safe working environment, which ultimately produces a bad impact on the success factor of the firm in a competitive market [9]. It is estimated that job stress costs the state economy, health care and lost productivity. The latest figures state that the estimated cost of work-related stress costs the UK economy are £7 billion a year in sick pay and lost production [10].
Even in advanced high-technology based industries, the physical demands of work are still high, which is directed to produce the environment of physical hazards and work injuries [11]. However, limited work has been done on the impact of stresses on work performance. Similarly, many factors can reduce the impact of work stress during work, but also a very little work has been done to cover these individual and organizational factors. An important source of stress is job strain, which is faced by workers at the workplace. Job insecurity and physical exertion at workplace also cause stress. Even in advanced high-technology based industries, the physical demands of work are still high, which is directed to produce an environment of physical hazards and work injuries [12].
Traditionally decision makers consider common costs, that is, manufacturing, labor cost, holding cost and maintenance cost to take decisions in inventory and production systems. Despite the significant importance of non-ergonomic working conditions and work injuries, these are ignored. Managers cannot justify the investments in any project regarding the working environment unless it is economically feasible and beneficial to the firm. Accordingly, to manage the workplace, it is extremely significant to understand the costs and economic benefits of breakeven time [13]. This study represents the significance of controlling workplace stress due to the working environment through a mathematical model. The inclusion of stress level among workers is anticipated in considering effective and efficient production. The mathematical analysis of average stress is a big contribution, which is inversely related to the worker’s efficiency and product’s quality. The contribution of this research is extended to quantify the production loss and required labor due to the stress. The analysis provides a platform for production managers to make investments in favor of workers and can be utilized to support the research with the objective to determine the factors that bring awareness and a safety culture in the firm.
This paper is structured as follows: Section 2 present a literature survey regarding stress level, and imperfect production. Furthermore, Section 3 is related to the verbal problem statement to discuss the imperfect production system and drawbacks in the form of workplace stress. The formulation of a mathematical model considering notation, assumptions along with solution methodology is given in Section 4. Section 5 depict the numerical experiment for the practical implication of the mathematical model including data collection and data analysis. Section 6 is related to the numerical results of the experiment performed in the automobile part manufacturing firm. Section 7 presents the sensitivity analysis of the model to determine the effect of workers’ stress on the production system. The directions and recommendations for the support of management firms are also given. Finally, Section 8 finds the conclusions of this study.
2. Literature Survey
Effective and efficient production systems rely on the working conditions of the worker. The objective is to improve the working environment by optimising the effort of workers to enhance the firm’s performance and promote human well-being. Most of the ergonomic-related work in developing countries is based in the industrial sector. Researchers also worked to create a link between working environment and cost. But the problem arises of how to quantify the invisible average costs of work-related injuries [14]. There is no specific and unique methodology in the literature, which could understand and calculate the cost of displeasure due to bad work conditions and the average cost of pain due to work-related injuries.
Most of the researchers have worked on the economic and environmental aspect of the production system i.e., [15,16,17,18]. However, now a work has been started to encourage the social dimension of the system, and in this direction several authors contributed to measure the cost associated in such cases. The cost of work injuries due to bad working environment is calculated by using the friction method, capital method, and willingness to pay method [19]. Furthermore, it also observed that working hours have a huge impact on work-related injuries because longer shift timings increase the probability of an accident [20]. Ruhm (2000) observes a good relationship between macroeconomic conditions and mortality, which he attributes to bad working conditions, the physical exertion of the worker, and work stress when job hours are extended [21]. Work stressors are environmental factors at work that lead to individual strain, that is, potentially harmful reactions of the individual [22].
The most common job stressors considered by researchers are chronic, for example, job conflict. Few researchers also focus on the shorter-term stressors, also called acute stressors. Examples of acute stressors might include something as annoying as a research assistant encountering computer shutdowns [23]. Chronic stressors are usually conceptualized and measured generically (i.e., the same for all jobs), while measures of events or acute stressors tend to be more job-specific, both conceptually and operationally [24]. This study considers the chronic stressors. The questionnaire and the data collection are based on the chronic stressors among the workers. The consequences of high stress among workers are production loss, bad quality work, work injuries, hiring new workers, time lost, legislation, legal expenses, lost jobs and training.
Knauth (1998) [25] discussed the effect of different attributes of working hours on fatigue. Early morning shifts, night shifts, extended working hours, and short recesses are the significant factors, which may cause accidents at work and reduce productivity. The concept behind the risk of fatigue among workers due to shift schedule is to keep it simple [26]. Inconvenient working environments cause stress, which does not allow the maximum utilization of personal ability to perform well [27]. A global survey estimated that due to high stress levels, 90% of the workers were disengaged and among 57% were absolutely disconnected from their work [28]. Another issue caused by increase stress level among worker is production loss. If a worker is normal, then he can work efficiently and effectively to achieve his target production, on the other hand if he feel any stress or pressure then definitely it will cause production loss [29]. Abraham Maslow imagined the categorized employee behaviour patterns in five levels of survival, security, social, stability and satisfaction for the knowledge-based global economy [30].
The effect of intangible cost on production and inventory can be analysed in various production and supply chain models. Most of the researchers ([31,32,33,34,35,36]) worked on imperfect production systems to help the managers in planning and controlling the bad quality items. However, very few researchers analyzed the cause to reduce the imperfect production in the system. There are many factors affecting the production flow to produce imperfection in the form of reworks, rejections and scraps. Errors can be generated by man, machine or material. This research covers the imperfect production occurring due to the average stress among unskilled workers caused by non-ergonomic working conditions. Previous studies analyzed the effect of stress on the efficiency of the workers and still its effect on the production system was missing. Mansour (2016) [26] only related the stress among workers due to bad working conditions and injuries to the efficiency of the systems. However, this research paper considers the stress level among workers that not only affects the efficiency of the system but also the defective rate. The contribution of this study is to incorporate the workplace depending efficiency and defective rate in the production model as an extension. The impact of stress on the production system is valid theoretically but still there is a gap to find it in tangible dimensions. The production model is developed to analyze the quantitative effect of stress on the total cost and required workers in the production system. The mathematical analysis of the proposed production model is evident to provide the importance of the good working environment, where there is less human stress to avoid the economic loss due to degraded efficiency and high defective rate.
3. Verbal Problem Statement
The research is performed by converting the theoretical idea into the mathematical model and be analysed by the nonlinear programming technique. The model considered an optimization problem to minimize the total cost of production system provided with the limitation of budget, production, and inventory space. The launch of a new product by the combination of human and technology is a big challenge for production planning and control. The developing countries are mainly concerned about manpower as compared to technology because the firms can easily acquire cheap labor against expensive high tech machines. That is the reason, in such scenarios the efficiency and the performance of unskilled labor is highly dependent upon ergonomic conditions and other moral support from the firm, which may result in a high stress level among workers in typical production firms. The issue can be clearly highlighted by considering a mass production system of automobile spare part industry, where there is a need to manage the resources in the form of unskilled workers and machines. The machines are performing the same operation of mass production and worker is working on it. The task might be repetitive or time consuming with an effect of bad working conditions. A single machine problem is considered to experiment the research idea represented in this paper. The flow diagram of imperfect quality production system of three automobile parts A, B, and C parts is illustrated in Figure 1.
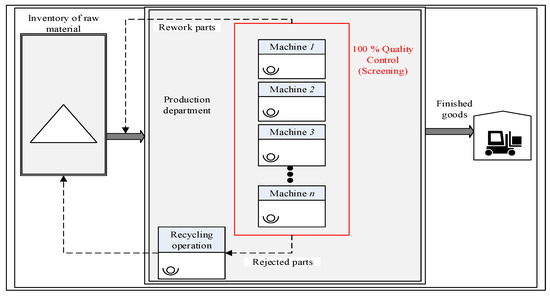
Figure 1.
Representation of imperfect quality production system.
The raw material from the inventory transported to the production department, where operators are working on machines for manufacturing of a automobile parts. A production planing and control decisions are looking to find the resources in terms of machines and labor required in production department, which depends upon the production rate and demand rate. The efficiency of operators is influenced by the average stress. The finished parts are shifted to quality department for inspection, where reworked parts are backtracked to machines while the scrapped items are recycled. After managing the imperfect products, the finished goods are transported to the final inventory. The defective items (bad quality items) are produced due to errors caused by man, machine or material, that is the reason the total defective rate is introduced to be the sum of the initial and variable defective rate. The former is the result of machine errors while the latter depends upon the average stress among workers. The main reasons for psychological stress among workers are injuries, moral degradation and so forth.
Let represents a scaled input qualitative variable. The relationship between these qualitative input variables can be mapped into a single value to represent an average stress level among employees. Accordingly, the stress can be expressed as given in Equation (1).
where s is stress level; is the scaled elements of the work conditions that cause stress; is the normalized weights.
3.1. Stress Level and Efficiency
The stressed worker cannot provide his best utilization according to his capabilities. The affiliation of the worker’s stress level with efficiency can be formulated as given in Equation (2), where is efficiency of the workers. The efficiency is directly proportional to the average stress (s) and the relationship is drawn by a curve as shown in Figure 2 [26].
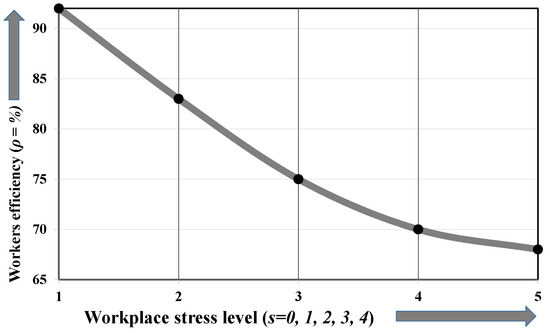
Figure 2.
Relation between workers’ stress and efficiency.
3.2. Stress Level and Defective Rate
The expression for defective rate includes variable defective rate depending upon the average stress with initial defective rate to cover the rest of factors, that is, machine, material and so forth, is given as in Equation (3). The Initial defective rate is considered to follow a uniform distribution. A direct relationship between stress and defective rate can be shown as in Figure 3, where is the total defective rate of the production system, is the initial defective rate, and are the scaling factors and s is average stress among worker.
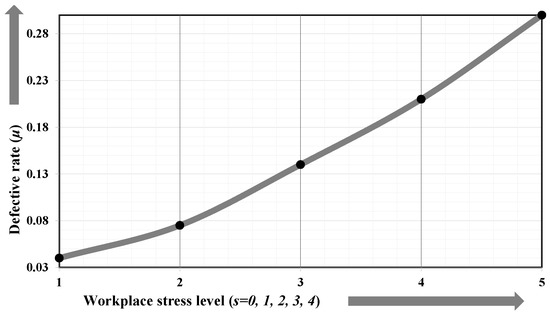
Figure 3.
Relation between workers’ stress and defective rate.
4. Formal Problem Statement
4.1. Assumptions
There are following assumptions for the proposed model.
- The model is considered for multiple type items.
- All products are screened and screening cost is incurred on each item [37].
- Defective rate is stress level-dependent and the initial defective rate is considered as uniformly distributed.
- Average efficiency of workers is also a function of stress level.
- The defective items are reworked to make the perfect quality products.
- Some parts are rejected after reworking the operation, which is recycled [38].
4.2. Notation
The research is based on the optimization of the decision variables to provide significant support to the managers and experts in production planing and control phase. Indeed this research provides a production resource planing for any production system with given data. There are three decision variables proposed in the mathematical modelling, that is, cycle time , number of machines required , and number of workers required . The cycle time provides data regarding the total time of the production system to process all the required parts with respect to the given demand. There are number of machines working similar operations, the capacity of the system depends on the number of machines. Similarly, the number of workers depend upon number of machines. The proposed research based on mathematical model will be effectively and efficiently providing information to the managers regarding exact number of machines and number of workers required to process parts by fulfilling the annual demand. The notations of the parameters and decision variables of the proposed imperfect production model are enlisted comprehensively as.
4.3. Mathematical Modelling
A mathematical model based on a single-stage production system with defective in the form of reworked and rejected items include fixed and variable costs, that is, capital cost, labor cost, setup cost, manufacturing cost, inventory carrying cost, reworking cost, energy cost and recycling cost. The capital cost is time-related, which consists of initial investment for purchasing and installing machine units. Cost of manufacturing in this model is associated with the machine/workstation used to manufacture the product. The total inventory of the production system is holding as given in Figure 4, where P is the production rate of the system, D is the demand, is the total inventory of the system, the cycle time T is divided into small time fractions (i.e., , , and, ), and are the parameters used to represent the heights of the inventories during production and reworking process respectively. It is a continuous production scenario for one production cycle T. The model is based on pure production system where the production is going on and the demand D is also fulfilling simultaneously during and . The reworking operations are done during time interval . The production stopped at , then there will be no production and inventory is going down to zero during .Theocratically, the total cost of production is the sum of capital cost, setup cost, manufacturing cost, holding, backorder cost, energy, inspection, reworking and recycling cost. Mathematically, these fractions of the total cost can be mathematically calculated as given in Appendix A for the support of managers and industries.
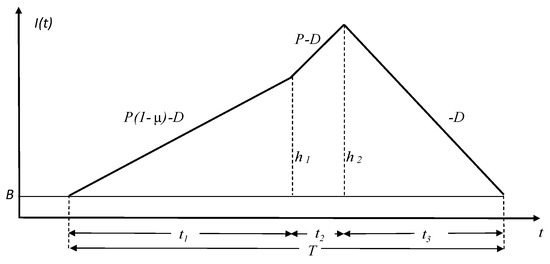
Figure 4.
Economic production Quantity model with variable defective rate and backorders.
By considering the interaction between the labors and machines, the total cost function is the sum of the fixed costs to represent the capital cost and variable costs in terms of labor cost. The objective function is to minimize the total cost of production as given in Equation (4).
The mathematical form of the objective function to minimize the total cost of production can be given as in Equation (5). The model is limited by the budget, production, and capacity constraints.
Subject to
Budget constraint: The budget constraint is the limitation given by the management on the availability of the resources. There is a cost associated with the machines and number of workers. The addition or removal of the machine or worker in the production plan will effect the cost budget and balance. That is the reason the combination of the workers and machines should by utilized in this way to not exceed than the total budget as represented by Equation (6).
Production function constraint: The production function provides a constraint to relate the production quantity with the number of workers and number of machines. Where there is a combine effect of availability factor (%) for machines and workers, and an efficiency () of the workers is multiplied with the number of workers. The and are the respective shares of machines and workers in the production system depending upon the level of automation.
Space constraint: The inventory of the production system is also controlled depending upon the capacity of the storage system or warehouse. Therefore, the space constrain (volume based) is very important to limit the maximum quantity depending on the size of each part.
Non-negative constraint: All the decision variable i.e., T, , and are non negative.
5. NumericaL Experiment
Most of the data used for analysis of the proposed mode has been taken from the numerical experiment done by Sarkar et al., (2014) [39] except the data related to the average stress among workers in a production system.
5.1. Data Collection
The average stress is measured by the workplace stress scale on the basis of a questionnaire as given in Appendix B. The scale was designed and made by the Marlin Company, North Haven, CT, USA, and the American Institute of Stress (AIS) in 1978, Yonkers, NY, USA [40]. There are two basic type of stressors, that is, chronic and acute. Chronic stressors are usually conceptualized and measured generically (i.e., the same for all jobs), while measures of events or acute stressors tend to be more job-specific, both conceptually and operationally [23]. The chronic stressors are considered to collect the data from the workers because the research covered basic but not specific working conditions and the production system rely on long term data for making decisions. That is the reason a questionnaire is considered to reflect the data from the workers facing generic stresses throughout their job. The questionnaire is standard and general, which can be applied to any circumstances to find the average stress among workers. Each question indicates the specific performance factor of the worker chronically and in generic, that is, job satisfaction, safe working conditions, deadlines, job pressure, skills utilization and so forth. Responses of the workers are collected by using a five-point scale starting from one to five representing never, rarely, sometimes, often and very often, respectively [41]. This scale of questionnaires was utilized to evaluate the function of occupational stress among workers [42]. A survey was conducted among five automobile spare parts industries. A Total of 150 questionnaires were distributed among unskilled workers. The demographics of the participating workers are as follows.
- All workers are participated in the survey irrespective of the age and health.
- They are working on the production floor as an operator or helper.
- The respondent unskilled workers are performing manual activities, e.g., loading, unloading, helping, operating, heavy working, manual forging, cutting etc.
The survey was conducted during fall 2018. It was performed at an Industrial estate in Pakistan. The data was collected from the workers in two ways—those who could understand filled the questionnaire by themselves, otherwise most of them were interviewed for collecting the data. The workers were chosen randomly to avoid bias. Almost five general manufacturing industries related to the automobile part were selected for the collection of data for workplace stress to reflect the general conditions of workers. These industries are working as a separate firms to manufacture automobile spare parts, each consist of almost 400–500 workers. 150 workers were selected randomly among total 2200 workers from five industries (at the rate of 6%), where 130 workers returned the questionnaires and among which 12 were rejected due to incomplete and unreliable information. Therefore, a total 118 questionnaires were considered for the analysis of this research work and the response rate was about 78.7%. The sample size of 118 is enough to reflect the population of the workers among manufacturing industries.
5.2. Data Analysis
For the reliability and adequacy of the data, a Cronbach’s reliability test was performed. The objective of the test is to check the average differences among each data. The test value for each question is calculated, which was more than 0.7 and is commonly recommended for the validation and reliability of the data. As all values result were above 0.70, a good reliability resulted for data sets, and these data sets were accepted for further analysis [43]. The value of stress among workers was found to be 2.6 as a normal average on a five-point Likert scale. The formula for central tendency (mean) was utilized to find the mean average of the workplace stress among workers. The value 2.6 value was considered as a general average stress existed among unskilled workers on the production floor of manufacturing system. The value of workplace stress above 2.6 will be assumed as “High Stressed” and lower value will be considered as a “Low stressed”. The five-point Likert scale had qualitative levels from 1 to 5, tagged as never, rarely, sometimes, often, and very often respectively. The never and very often stress levels are the ideal situations for industry. The sensitivity analysis is performed on the basis of these mentioned stress levels to find the changing cost of production and number of labor required.
The data related to the production of each automobile part on the basis of demand, production rate, backorders and, energy utilization are given as in Table 1. The data related to the production rate, setup, holding, demand and manufacturing cost are taken from the work done by Sarkar et al., (2014) [39]. The data related to the energy, machine cost, defective rate, recycling cost, and labor costs are considered directly from the industry because these are depending on the industrial conditions and state regulations. The inspection data is collected from the research study of Sarkar (2016) [44]. The data related to stress are incorporated by the detailed survey using the questionnaire as discussed in the data collection section.

Table 1.
Data related to the production and demand.
The data related to the cost of production are given in Table 2, that is, manufacturing, holding, setup, backorder, labor and machine costs. Manufacturing costs includes running costs incurred on each item. The backorder cost is applied for extra resources when shortages are occurred to fulfill the demand. When parts are transported from production department to quality department, imperfection is produced.
Table 2.
Data related to the production costs.
The cost related to imperfect production is given as in Table 3. Inspection is carried out after production at quality department, where all parts are checked for defective and sorted the pass, rework and rejected parts. Inspection process acquire cost to perform some visual as well as lab testing. Recycling include process of converting the semi-finished item into raw material to reduce the waste and carry a cost.
Table 3.
Data related to the imperfect production.
6. Results and Discussions
The model is nonlinear and complex enough to solve by using any analytical method. However, there are many iterative methods available to find the optimal solution of nonlinear optimization model with many decision variables and more constraints. The sequential quadratic programming (SQP) are the most effective methods to solve nonlinear equations [45]. The method of SQP is based on Newton’s method in the best way to deal with the unconstrained optimizations [46]. The SQP deals with the quadratic programming problems, to find an optimal solution. SQP methods represent the state of the art in nonlinear programming methods. Schittkowski [47] has implemented and tested a version that outperforms every other tested method in terms of efficiency, accuracy, and percentage of successful solutions, over a large number of test problems. The method closely mimics Newton’s method for unconstrained optimization. At each major iteration, an approximation is made of the Hessian using a quasi-Newton updating method. This is then used to generate a QP subproblem whose solution is used to form a search direction for a line search procedure.
The proposed production model in the form of nonlinear problem was coded in MATLAB for the analysis and by using the methodology of SQP, optimal solution and results are obtained [48]. The optimal solution of the production model is given as in Table 4, which is a complete production plan for the manufacturing of three items A, B and C. To meet the target in the form of demand rate and by the capability of the production system in term of production rate, the required machines and labor for each item is calculated. The cycle time of the complete production plan is almost three months (0.329 years). The optimal solution of the imperfect production model, that is, total cost (TC) considering the impact of workers’ stress is found as $428,248.
Table 4.
Optimal solution of the production model.
The optimal results and solutions have been found to support the production planning phase of the manufacturing firm. Optimal requirements of resources in the form of workers and machines are quantified with the minimum expense of total cost (TC). This paper presents the impact of average stress on the production system with defective rate and workers’ efficiency as a function of workers’ stress. However, stress elements are generated among worker, whatever their cost, such stress factors have personal as well as economic consequences and can cause poor productivity and unavailability. Stress factors are required to be calculated economically for the benefit of decision makers. That is the reason, further analysis is required to find the sensitivity of the model by the effect of stress levels.
7. Sensitivity Analysis
Stresses can be divided into chronic and acute [23]. Given the differences between acute and chronic stressors, they may differ in their relations with individual strains and performance [24]. Stressors that are more job specific (whether chronic or acute) may have the greatest impact on individual strains and performance, because they are most salient to employees in a particular job. The chronic job stressors are considered. The stress factor is a variable function and it depends upon various aspects of the production system for example, repetitive and cyclic work type are common in mass production systems to make the job more boring and tedious, which is one of the causes of high stress. However, workers feel less stress in case of job production where the management invested on the training and development for handling a variety of tasks. Similarly, stress also depending upon the firm’s policies regarding workers’ health care and safety. Sometimes, there are a lot of medical facilities and insurances available for labors in low-income management firms and on the other hand, a very few incentives are available in high-quality firms.
There is a need to check the model on different levels of stress existed across various production firms. The stress factor negatively affects the workers’ performance and efficiency, which is directed to lessen the workforce and increase the number of rejections. Hence there are two changes occur, firstly the actual number of labor will be reduced from the standard requirements due to the decreased performance level and secondly, the output production will be reduced to meet the target level. Therefore, to compensate the loss efficiency and maintain the output quantity at a certain level, the amount of labor should be increased. This can be done either by hiring extra labor in terms of cost or increasing the production schedule time. In both cases, the total cost (TC) will be increased. The detailed analysis and variations of TC and labors at each level of stress are given as in Table 5. These cases are given as following.
Table 5.
Sensitivity analysis of the model with respect to the stress level of worker.
- The scale can divided into five values of s levels from never, rarely, sometimes, often, and very often. An analysis is carried to quantify the exact amount of labor required by increasing the level of workers’ stress ranging from to as given in Table 5. In first case, by considering it is observed that when stress is increasing then there is no changes occurs. The reason is the demand for first part A is almost 180, which can be easily fulfilled by the same number of workers, that is, 111. The change in average stress would not create any variation in the production system to disturb the manual workers.
- By comparing the status of the labors required for part B and C, that is, and respectively at extreme levels of the stress, the labors required at and are 119 and 126 for item B while 124 and 137 for item C respectively. Indeed, the analysis is providing a quantitative impact of the stress level on the number of workers required in the production system.
- Since the stress is a variable factor and there is also a need to analyze the sensitivity of the proposed model for the TC by changing the stress among workers. It is clear that the model is sensitive to the stress on the basis of TC and labors required for each part, that is, the total cost of production and labor requirements are increased by increasing the stress from level to level. However, the mathematical calculations are required. When comparing the extreme levels of the workplace stress, it is found that at , the total cost of production is around $420,601, and at , the value increased to $432,410.
- The machines (, , and ) are not changing by increasing the average stress among the workers because the capital cost is enough that it cannot be effected by the average stress among workers. The efficiency of the workers is inversely proportional whereas the defective rate is directly proportional to the workplace stress.
Hence the mathematical analysis for the impact of the stress on the workers required and TC is providing an evidence to think and plan for the good working environment to the workers. Where, there is less chances to induce stress among workers due to which the efficiency of the workers is at a maximum level and there are less chances to create rejections due to workers. These meaningful results in different scenarios are beneficial to understand the economic loss (almost $40,000) and consequences of the production system due to high-level stress among workers, which will pressurize the managers to improve the safety culture and working environment.
8. Conclusions
This paper investigates the meaningful hidden costs, which are not considered by management in the planning phase of the production system. The injuries and the poor working conditions are the causes of the high workers’ stress. The stress exists among workers in every environment, but the intensity and level of stress are different. Poor work conditions will amplify the stress among employees, which will significantly influence the production system. On the other hand, a more ergonomic workplace and safer practices will benefit the corporations. In-depth, the stress affects the efficiency of the workers and production rate causes the management to hire more workers and material for compensation causes more cost. The average stress among workers of traditional spare part industries is calculated by the detailed survey for practical application of the model. The incorporation of stress level in production enhances the quality of decision making to consider for the optimal solution. To get the optimal solution, the solution methodology of sequential quadratic programming (SQP) is selected, which uses Langrage multiplier directly and is based on the equations of Karush-Kuhn-Tucker (KKT). The sensitivity analysis provides a detailed analysis of the stress at each level in different scenarios for the sensitivity of the proposed imperfect production model. The results addressed the increased amount of invested labor and defective rate due to the increased stress level. These increments affect the total cost of production, which are not estimated and are ignored. The objective value of this research is to create awareness among production managers by calculating the tangible cost of workplace stress to control.
A set of recommendations are drawn from the optimal results obtained by the numerical analysis of production model. In case of high stress, almost 3, 11, and 21 extra workforce required for part A, B, and C respectively ($15,020) and overall economic loss is in the production cost is almost $47,000. The study motivates the decision makers to also include the quantitative factor of workplace stress in the production planing and control phase. The managers need to aware about the causing factors of stress among workers to minimize the economic loss (almost $47,000). The data collection and data analysis from the detailed questionnaire provide a better understanding of each performance factor related to the worker stress, which can be analysed for improving the average efficiency of the workers. It is one of the social responsibility of the production system to improve and maintain the workers’ job satisfaction, safe working conditions, work deadlines, job pressure and skills utilization to avoid inducing stress. Furthermore, by this research the managers are required to calculate tangibly the average stress among workers quarterly or bimonthly for efficient and effective production with minimum rejections.
The understanding and the extensions of the proposed model can be extended into a socially responsible production model, one of the significant and major areas, but unfortunately it has less value in the eyes of managers. Future extensions of the models are also possible under certain conditions. Demand as a function of a sustainable product can be incorporated for better results. The purposed model concluded that stress among workers affects the production system due to the efficiency of workers and defective items. There is a need to make production more reliable by considering intangible costs, which seem invisible but ultimately affect the total cost of production under variable production quantity. A long-term strategic analysis is also necessary to represent the stress affecting capital units (machines). In addition, the detailed validation of the quantitative impact of workplace stress on the production is also required, which might include a survey based on questionnaires. The respondents will be the industrial managers, experts, and academicians. The objective is to validate the changes occurred in the production cost due to change in the workplace stress as an outcome of this research. Furthermore the proposed model can be compared against the research work done by Sarkar et al. (2014) [39] on the basis of the total cost by considering the same assumptions. The data collected from the manufacturing firms can be utilized to find the stress levels of the industries on the basis of the collected data. The analysis could be helpful for industries to identify the weak areas and the potential to improve their stress levels to achieve fewer rejections and higher efficiency in the production system. Overall, this research creates an awareness among managers to understand the economic value of workers’ stress level in production.
Author Contributions
All the authors contributed equally at every stage of this research work. However, the individual contributions in the research study are as following i.e., writing–original draft preparation and methodology, M.O.; writing–review and editing, S.N.; resources and investigation, M.U.; software, S.M.; data curation and formal analysis, B.G.; supervision and conceptualization, B.S.
Funding
This research received no external funding.
Conflicts of Interest
The authors declare no conflict of interest.
Abbreviations
| Indices | |
| j | the index used to indicate the number of items, |
| Decision variables | |
| n | number of cycles (number) |
| T | Cycle time of production (years) |
| Number of labors work to manufacture jth item (numbers) | |
| Number of capital units utilized to manufacture jth item (numbers) | |
| Parameters | |
| average wage of labor to manufacture jth item ($/labor) | |
| backorder of jth item ($/unit/year) | |
| fixed backorder cost to fulfill the shortages of jth item ($/year) | |
| variable backorder cost to fulfill the shortages of item jth ($/unit) | |
| holding cost of each item per cycle ($/unit/year) | |
| production rate (units/year) | |
| cost of each machine unit require to manufacture jth item ($/machine/year) | |
| demand rate, units per planning period (unit/year) | |
| units of energy utilised to manufacture jth item (kwh/unit) | |
| s | average stress among workers (number) |
| m | scale element for stress level of worker (constant) |
| setup cost for jth item ($/year) | |
| reworking cost of jth item ($/unit) | |
| labor share (%) | |
| capital share (%) | |
| availability factor (%) | |
| fixed inspection cost of item jth ($/year) | |
| variable inspection cost of item jth ($/unit) | |
| cost of energy per unit required for jth item ($/kWh/unit) | |
| scrap rate for recycling (%) | |
| recycling cost of item jth ($/unit) | |
| total defective rate (percentage) | |
| initial defective rate (percentage) | |
| scaling parameter (positive constant) | |
| shape parameter (positive constant) | |
| c | capacity of each item (%) |
| C | total capacity of inventory (%) |
| the average efficiency of workers (%) | |
| total inventory of the production system (units) | |
| TC | total cost of production model($/cycle) |
Appendix A
Generally, managers are facing complexities to calculate the total cost of production. Therefore, a mathematical expressions of all the costs i.e., setup, manufacturing, labor, energy, inspection, reworking, recycling, and holding cost as a part of production system are represented from Equations (A1)–(A8).
Capital cost (CC)
This cost is an independent of the production quantity. It is time related, which consists of initial investment and setup cost of production as given in Equation. Cost of capital in this model is associated with the machine/workstation used to manufacture product.
Setup cost (SC)
The fixed cost including initial cost for each setup of the production system.
Manufacturing cost (MC)
The basic cost depending on the production quantity of the system to meet the targeted demand.
Labor cost (LC)
The labor cost includes the wages and salaries of the workers depending on the production cycle time.
Energy cost (EC)
Energy cost incurred on all the production quantity due to the energy consumed by the machines, equipments, and utilities etc.
Inspection cost (IC)
The insepction cost is incurred on all the items to check whether the parts are correct, rejected, or should move towards reworking operations.
Reworking cost (RWC)
The reworking cost also affects the total cost for reworking operations on a fraction of defective items.
Recycling cost (RC)
The rejected items are move towards recycling process for the regeneration of the raw material.
Holding cost and Backorder cost
The holding cost is referred to the cost of carrying inventory in the production house, which includes rents, salaries, insurance etc. It also depends on the time during which the final product will be held in inventory. The backorder cost is also incurred on the items produced to fulfill the shortages. Both the holding and backorder costs are taken from the work of Sarkar et al., (2014) [39].
Appendix B
Table A1.
Questionnaire from the American Institute of Stress.
Table A1.
Questionnaire from the American Institute of Stress.
| Sr. | Questions | Never | Rarely | Sometimes | Often | Very Often |
|---|---|---|---|---|---|---|
| 1 | In general, I am not particularly proud or satisfied with my job. | 1 | 2 | 3 | 4 | 5 |
| 2 | Conditions at work are unpleasant or sometimes even unsafe. | 1 | 2 | 3 | 4 | 5 |
| 3 | I feel that my job is negatively affecting my physical or emotional well-being. | 1 | 2 | 3 | 4 | 5 |
| 4 | I have too much work to do and/or too many unreasonable deadlines. | 1 | 2 | 3 | 4 | 5 |
| 5 | I find it difficult to express my opinions or feelings about my job conditions to my superiors. | 1 | 2 | 3 | 4 | 5 |
| 6 | I feel that job pressures interfere with my family or personal life. | 1 | 2 | 3 | 4 | 5 |
| 7 | I don’t have adequate control or input over my work duties. | 1 | 2 | 3 | 4 | 5 |
| 8 | I do not receive appropriate appreciation or rewards for good performance. | 1 | 2 | 3 | 4 | 5 |
| 9 | I cannot utilize my skills and talents fully at work. | 1 | 2 | 3 | 4 | 5 |
| 10 | I tend to have frequent arguments with superiors, co-workers, or customers. | 1 | 2 | 3 | 4 | 5 |
References
- Perla, A.; Nikolaev, A.; Pasiliao, E. Workforce management under social link based corruption. Omega 2018, 78, 222–236. [Google Scholar] [CrossRef]
- Barney, J.B. Gaining and Sustaining Competitive Advantage; Addison-Wesley Pub. Co.: Boston, MA, USA, 1997. [Google Scholar]
- Choudhry, R.-M.; Fang, D. Why operatives engage in unsafe work behavior: Investigating factors on construction sites. Saf. Sci. 2008, 46, 566–584. [Google Scholar] [CrossRef]
- Leka, S.; Jain, A.; Zwetsloot, G.; Cox, T. Policy-level interventions and work-related psychosocial risk management in the European Union. Work Stress 2010, 24, 298–307. [Google Scholar] [CrossRef]
- EU-OSHA—European Agency for Safety and Health at Work. Expert Forecast on Emerging Psychosocial Risks Related to Occupational Safety and Health; European Agency for Safety and Health at Work: Bilbao, Spain, 2007.
- Kumar, S. Theories of musculoskeletal injury causation. Ergonomics 2001, 44, 17–47. [Google Scholar] [CrossRef] [PubMed]
- NIOSH. Stress…at Work; National Institute for Occupational Safety and Health (NIOSH): Washington, DC, USA, 1999; Volume 20, pp. 99–101.
- Karasek, R. Demand/control model: A social-emotional, and psychological approach to stress risk and active behavior development. In ILO Encyclopedia of Occupational Health and Safety; ILO: Paris, France, 1998. [Google Scholar]
- Leka, S.; Griffiths, A.; Cox, T.; World Health Organization (WHO). Work Organisation and Stress: Systematic Problem Approaches for Employers, Managers and Trade Union Representatives; WHO: Geneva, Switzerland, 2003. [Google Scholar]
- Palmer, S.; Cooper, C.; Thomas, K. A Model of Work Stress. Counselling at Work-Winter. Available online: https://s3.amazonaws.com/academia.edu.documents/31468591/acw_winter04_a.pdf?response-content-disposition=inline%3B%20filename%3DPalmer_S._Cooper_C._and_Thomas_K._2004_..pdf&X-Amz-Algorithm=AWS4-HMAC-SHA256&X-Amz-Credential=AKIAIWOWYYGZ2Y53UL3A%2F20190714%2Fus-east-1%2Fs3%2Faws4_request&X-Amz-Date=20190714T064506Z&X-Amz-Expires=3600&X-Amz-SignedHeaders=host&X-Amz-Signature=99276df961605f827720de490055880ce6bf5eefbf248336ac81476d42ddf3d9 (accessed on 6 April 2019).
- Dollard, M.-F.; Metzer, J.-C. Psychological research, practice, and production: The occupational stress problem. Int. J. Stress Manag. 1999, 6, 241–253. [Google Scholar] [CrossRef]
- Park, J. Work stress and job performance. Perspect. Labour Income 2008, 20, 7. [Google Scholar]
- Hendrick, H.-W. Determining the cost—Benefits of ergonomics projects and factors that lead to their success. Appl. Ergon. 2003, 34, 419–427. [Google Scholar] [CrossRef]
- Mrozek, J.-R.; Taylor, L.-O. What determines the value of life? A meta-analysis. J. Policy Anal. Manag. 2002, 21, 253–270. [Google Scholar] [CrossRef]
- Habib, M.-S.; Sarkar, B.; Tayyab, M.; Saleem, M.-W.; Hussain, A.; Ullah, M.; Omair, M.; Iqbal, M.-W. Large-scale disaster waste management under uncertain environment. J. Clean. Prod. 2019, 212, 200–222. [Google Scholar] [CrossRef]
- Omair, M.; Noor, S.; Hussain, I.; Maqsood, S.; Khattak, S.-B.; Akhtar, R.; Haq, I.-U. Sustainable development tool for Khyber Pakhtunkhwa’s dimension stone industry. Technol. J. 2015, 20, 160–165. [Google Scholar]
- Omair, M.; Noor, S.; Maqsood, S.; Nawaz, R. Assessment of Sustainability in Marble Quarry of Khyber Pakhtunkhwa Province Pakistan. Int. J. Eng. Technol. 2014, 14, 84–89. [Google Scholar]
- Kang, C.-W.; Imran, M.; Omair, M.; Ahmed, W.; Ullah, M.; Sarkar, B. Stochastic-Petri Net Modeling and Optimization for Outdoor Patients in Building Sustainable Healthcare System Considering Staff Absenteeism. Mathematics 2019, 7, 499. [Google Scholar] [CrossRef]
- Amador-Rodezno, R. An overview to cersss self evaluation of the cost-benefit on the investment in occupational safety and health in the textile factories: A step by step methodology. J. Saf. Res. 2005, 36, 215–229. [Google Scholar]
- Boone, J.; van Ours, J.-C. Are recessions good for workplace safety? J. Health Econ. 2006, 25, 1069–1093. [Google Scholar] [CrossRef] [PubMed]
- Ruhm, C.-J. Are recessions good for your health? Q. J. Econ. 2000, 115, 617–650. [Google Scholar] [CrossRef]
- Beehr, T.A.; Johnson, L.B.; Nieva, R. Occupational stress: Coping of police and their spouses. J. Organ. Behav. 1995, 16, 3–25. [Google Scholar] [CrossRef]
- Caplan, R.D.; Jones, K.-W. Effects of work load, role ambiguity, and type A personality on anxiety, depression, and heart rate. J. Appl. Psychol. 1975, 60, 713–719. [Google Scholar] [PubMed]
- Motowidlo, S.-J.; Packard, J.-S.; Manning, M.-R. Occupational stress: Its causes and consequences for job performance. J. Appl. Psychol. 1986, 71, 618–629. [Google Scholar] [CrossRef]
- Knauth, P. Innovative worktime arrangements. Scand. J. Work Environ. Health 1998, 24, 13–17. [Google Scholar]
- Mansour, M. Quantifying the intangible costs related to non-ergonomic work conditions and work injuries based on the stress level among employees. Saf. Sci. 2016, 82, 283–288. [Google Scholar] [CrossRef]
- Wilkinson, J. Shift work and fatigue-and the possible consequences. Occup. Health Wellbeing 2013, 65, 27–30. [Google Scholar]
- Dyble, J. Workplace stress linked to lower productivity. Empl. Benefits 2014, 9, 2014. [Google Scholar]
- Locke, E.-A. Toward a theory of task motivation and incentives. Organ. Behav. Hum. Perform. 1968, 3, 157–189. [Google Scholar] [CrossRef]
- Harvard, P.-S. Maslow, mazes, minotaurs; updating employee needs and behavior patterns in a knowledge-based global economy. J. Knowl. Econ. 2010, 1, 117–127. [Google Scholar] [CrossRef]
- Wee, H.-M.; Yu, J.; Chen, M.-C. Optimal inventory model for items with imperfect quality and shortage backordering. Omega 2007, 35, 7–11. [Google Scholar] [CrossRef]
- Ganguly, B.; Pareek, S.; Sarkar, B.; Sarkar, M.; Omair, M. Influence of controllable lead time, premium price, and unequal shipments under environmental effects in a supply chain management. RAIRO-Operations Res. 2018. [Google Scholar] [CrossRef]
- Goyal, S.-K.; Cárdenas-Barrón, L.-E. Note on: Economic production quantity model for items with imperfect quality–a practical approach. Int. J. Prod. Econ. 2002, 77, 85–87. [Google Scholar] [CrossRef]
- Wook Kang, C.; Ullah, M.; Sarkar, M.; Omair, M.; Sarkar, B. A Single-Stage Manufacturing Model with Imperfect Items, Inspections, Rework, and Planned Backorders. Mathematics 2019, 7, 446. [Google Scholar] [CrossRef]
- Bouslah, B.; Gharbi, A.; Pellerin, R. Integrated production, sampling quality control and maintenance of deteriorating production systems with AOQL constraint. Omega 2016, 61, 110–126. [Google Scholar] [CrossRef]
- Jeang, A. Simultaneous determination of production lot size and process parameters under process deterioration and process breakdown. Omega 2012, 40, 774–781. [Google Scholar] [CrossRef]
- Sarkar, B.; Omair, M.; Choi, S.-B. A multi-objective optimization of energy, economic, and carbon emission in a production model under sustainable supply chain management. Appl. Sci. 2018, 8, 1744. [Google Scholar] [CrossRef]
- Omair, M.; Sarkar, B.; Cárdenas-Barrón, L.-E. Minimum quantity lubrication and carbon footprint: A step towards sustainability. Sustainability 2017, 9, 714. [Google Scholar] [CrossRef]
- Sarkar, B.; Cárdenas-Barrón, L.-E.; Sarkar, M.; Singgih, M.-L. An economic production quantity model with random defective rate, rework process and backorders for a single stage production system. J. Manuf. Syst. 2014, 33, 423–435. [Google Scholar] [CrossRef]
- The Marlin Company and American Institute of Stress (AIS). The Workplace Stress Scale; The Marlin Company and American Institute of Stress: North Haven, CT, USA; Yonkers, NY, USA, 1978. [Google Scholar]
- Aghilinejad, M.; Zargham Sadeghi, A.-A.; Sarebanha, S.; Bahrami-Ahmadi, A. Role of occupational stress and burnout in prevalence of musculoskeletal disorders among embassy personnel of foreign countries in Iran. Iran. Red Crescent Med. J. 2014, 16, e9066. [Google Scholar] [CrossRef] [PubMed][Green Version]
- McCalister, K.-T.; Dolbier, C.-L.; Webster, J.-A.; Mallon, M.-W.; Steinhardt, M.-A. Hardiness and support at work as predictors of work stress and job satisfaction. Am. J. Health Promot. 2006, 20, 183–191. [Google Scholar] [CrossRef] [PubMed]
- Idrees, M.; Hafeez, M.; Kim, J.-Y. Workers’ age and the impact of psychological factors on the perception of safety at construction sites. Sustainability 2017, 9, 745. [Google Scholar] [CrossRef]
- Sarkar, B. Supply chain coordination with variable backorder, inspections, and discount policy for fixed lifetime products. Math. Probl. Eng. 2016, 2016. [Google Scholar] [CrossRef]
- Birgin, E.-G.; Haeser, G.; Ramos, A. Augmented lagrangians with constrained subproblems and convergence to second-order stationary points. Comput. Optim. Appl. 2018, 69, 51–75. [Google Scholar] [CrossRef]
- Mostafa, N.; Khajavi, M. Optimization of welding parameters for weld penetration in FCAW. J. Achiev. Mater. Manuf. Eng. 2006, 16, 132–138. [Google Scholar]
- Schittkowski, K. NLPQL: A fortran subroutine solving constrained nonlinear programming problems. Ann. Oper. Res. 1986, 5, 485–500. [Google Scholar] [CrossRef]
- Theodorakatos, N.-P.; Manousakis, N.-M.; Korres, G.-N. A sequential quadratic programming method for contingency-constrained phasor measurement unit placement. Int. Trans. Electr. Energy Syst. 2015, 25, 3185–3211. [Google Scholar] [CrossRef]
© 2019 by the authors. Licensee MDPI, Basel, Switzerland. This article is an open access article distributed under the terms and conditions of the Creative Commons Attribution (CC BY) license (http://creativecommons.org/licenses/by/4.0/).