Article

3D Visualization through the Hologram for the Learning of Area and Volume Concepts

1
Facultad de Educación, Universidad Internacional de La Rioja, 26006 La Rioja, Spain
2
Departamento de Matemática Aplicada, Universitat Politècnica de València, 46022 València, Spain
3
Departamento de Matemáticas y Computación, Universidad de La Rioja, 26004 La Rioja, Spain
*
Author to whom correspondence should be addressed.
Mathematics 2019, 7(3), 247; https://doi.org/10.3390/math7030247
Submission received: 20 January 2019 / Revised: 26 February 2019 / Accepted: 6 March 2019 / Published: 9 March 2019
(This article belongs to the Special Issue New trends in Mathematics Learning)

Abstract

:
This study aims to implement and evaluate a methodological proposal using the hologram as a teaching medium for the learning of concepts related to areas and volumes of geometrical bodies. The study has been carried out with a sample of 78 students in the third year of secondary education from a privately-owned but state-funded school in Madrid. Thirty-five students who have been taught traditionally formed the control group, and 43 formed the experimental group in which the methodology was implemented. To evaluate its goodness, we have used the Student’s t-test to assess the existence of significant differences between both groups. The results reported by the test show that there is a difference of 3.9 points between the scores of both groups which is significant at the level of 0.05. In addition, the user experience in the experimental group has also been evaluated to assess the students’ opinions of the hologram in the learning process. The overall results have assisted us in corroborating the efficacy of the hologram as a teaching medium.

1. Introduction

The changes that take place in society require the involvement of teachers in students’ learning processes to guarantee they acquire the competencies that will allow them to face the future.
It is a fact that the environment is filled with scientific concepts which find a place in the official curriculum. In many situations, teachers perceive the deficiencies that students present as an aspect of the difficulties of the explanation of the concepts, sometimes due to the degree of abstraction they imply.
In this context, and especially when talking about the learning of mathematics, it is clear that the conceptions and knowledge that teachers have are closely linked to how they were taught, and they tend to reproduce the models that they experienced [1]. In the study carried out by Blanco and Barrantes [1], based on the conceptions that teachers have in relation to geometry, they reached the conclusion that these concepts are difficult to teach and also difficult to learn. In addition, in the Spanish territory, it is usual to relegate geometry to the last units of the school year if the official curriculum is followed which leads to rote learning.
In geometry, it is important to bear in mind the well-known Ostensive Phenomenon that constitutes an obstacle for students. This phenomenon arises from the appearance of figures and geometric bodies drawn in textbooks from a single perspective, which means that, when placed in another spatial orientation, students are not able to apply the knowledge they have learned, that is, they are not able to extrapolate.
As [2] comments, students are taught to learn formulas and how to use them but not to reason them, so they end up being forgotten in a short period, leading to non-meaningful learning. In this way, the exam assumes the most important, or even unique, part of the evaluation.
As [3] explains, geometry should offer students the possibility to describe, understand, and interpret the real world and its phenomena through the use of techniques and tools that allow them to make conjectures and extrapolations. In this sense, it is important to foster in students the ability of amazement based on the use of visualization tools, which makes them acquire an interest in the learning of this important branch of mathematics that, moreover, is present in our daily lives.
The main objective of this study is to verify if there are significant differences in the students’ qualifications of the mathematical concepts related to areas and volumes of geometric bodies depending on whether they have studied these concepts through a methodology that uses the hologram as a teaching medium or not, following the conclusions of Serra, Vega, Ferrat, Lunazzi, and Magalhães [4].
This study arises from a previous one, carried out by the authors, related to the use of this tool in the learning process of cell division concepts [5].

2. Literature Review

2.1. The Teaching of Geometry in Secondary Education

Geometry can be perceived by students as a set of tedious formulas they are forced to learn. The perception that it is rote learning and that most of the formulas will not be useful in the future has led the students to show a deep disinterest in this area.
In this context, the role of the teachers is crucial since, in some way, they are responsible for the students’ interest in geometry. This area is the part of mathematics that may be less abstract in its understanding since the world around us is full of figures and geometric bodies. As Fabres proposed [6], students need to be exposed to directed observation to be able to appreciate them. The learning becomes more fun and meaningful if we give them the opportunity to work with materials so they can build their learning process.
Fabres [6] commented that geometry teachers have to bear in mind that the purpose should be that students acquire skills that allow them to analyze the characteristics and properties of figures and geometric bodies, as well as develop arguments to relate them and use systems for their localization, thus, developing a spatial visualization ability.
The term “Geometric Eye”, coined by Fujita and Jones [7], alludes to the fact that the intuition, based on previous experience in relation to geometrical concepts, is very useful when it is applied in the classroom. Taking into account that secondary education students, between 12 and 16 years old, have studied the shapes of geometric bodies before the study of their areas and volumes, and that these are part of the world around us, it can be considered affordable to propose teaching–learning methodologies that allow the development of their Geometric Eye.
According to the pedagogical model of Van Hiele, explained in [8], geometric thinking is developed in five levels of reasoning (perception, analysis, classification, deduction, and rigor), which lead to an explanation of the stages that students experience when learning geometry concepts. These levels are hierarchical and discontinuous, so every teacher should look for mechanisms that allow students to advance among them, taking into account that the achievement of a new level will depend on the degree of skill in the previous one.

2.2. The Importance of Visualization and the Use of Technologies in the Geometry Learning Process

In the 70s, there was an interest in investigating how spatial abilities were related to the learning of mathematics [9]. Gutiérrez [10], remarked that the visual process involves the interpretation of external representations to form mental images that, subsequently, will be used to generate information. In the field of geometry, these external representations, that take part in daily life, can be generated more easily and, as Owens and Outhred presented [11], the use of diagrams or visual representations, imply an improvement in the process, since they make students pay attention to the relationships between the different elements.
The use of prototypical images should only be done initially, to present the geometric shape and its parts to the students and it is necessary to make use of diverse representations to avoid the Ostensive Phenomenon explained above. Authors, such as Bishop [12] and Clements and Battista [13], agree that better results in the area of geometry are obtained when manipulative materials are used since the ability of students to handle bodies and their representations are increased. In the same way, they comment that it is crucial to carry out didactic experiences that allow connecting the two and three-dimensional spaces with each other.
In this sense, it is very important to give special emphasis in the primary education, from 6 to 12 years old, when students begin to study geometric concepts since geometric bodies are obtained in three-dimensional space when extrapolating them. As Gutiérrez concluded [10], their correct study implies practising the two directions between the plane and the space, which means, to draw the flat representations of solids in two dimensions and the construction of solids from their flat representations. These actions have important differences from the point of view of the learning process and the use that students make of the plane and the space figures.
Since 2010, mobile learning has been evolving and enriching with the use of new technologies, such as augmented reality, virtual environments, etc. Nowadays, we can see that classes increasingly become virtual learning environments, where the use of tablets or iPad offers teachers and students a new world of learning opportunities [13].
Moreover, authors, such as Moyer-Packenham and Suh [14], show the use of virtual manipulatives in mathematics learning in which students obtain different results. Other studies related to the use of virtual manipulatives in mathematics and their advantages in earlier ages are also presented in [15].
The Horizon report [16] shows the importance of the use of electronic devices in classrooms, as well as the long-term and short-term challenges, and highlights the main technological trends in education for the coming years: mobile learning, social networks, online learning, big data, bring your own devise (BYOD), hybrid and collaborative learning, flipped classroom, cloud computing, personal learning environment (PLE), gamification, educational robotics, maker spaces and virtual reality.
In this sense, the use of information and communication technologies (ICT) applied to the geometry learning process is very interesting, since it helps students to develop spatial ability and, therefore, to understand the concepts in a meaningful way, allowing them to establish relationships between the different figures, based on their characteristics and properties.

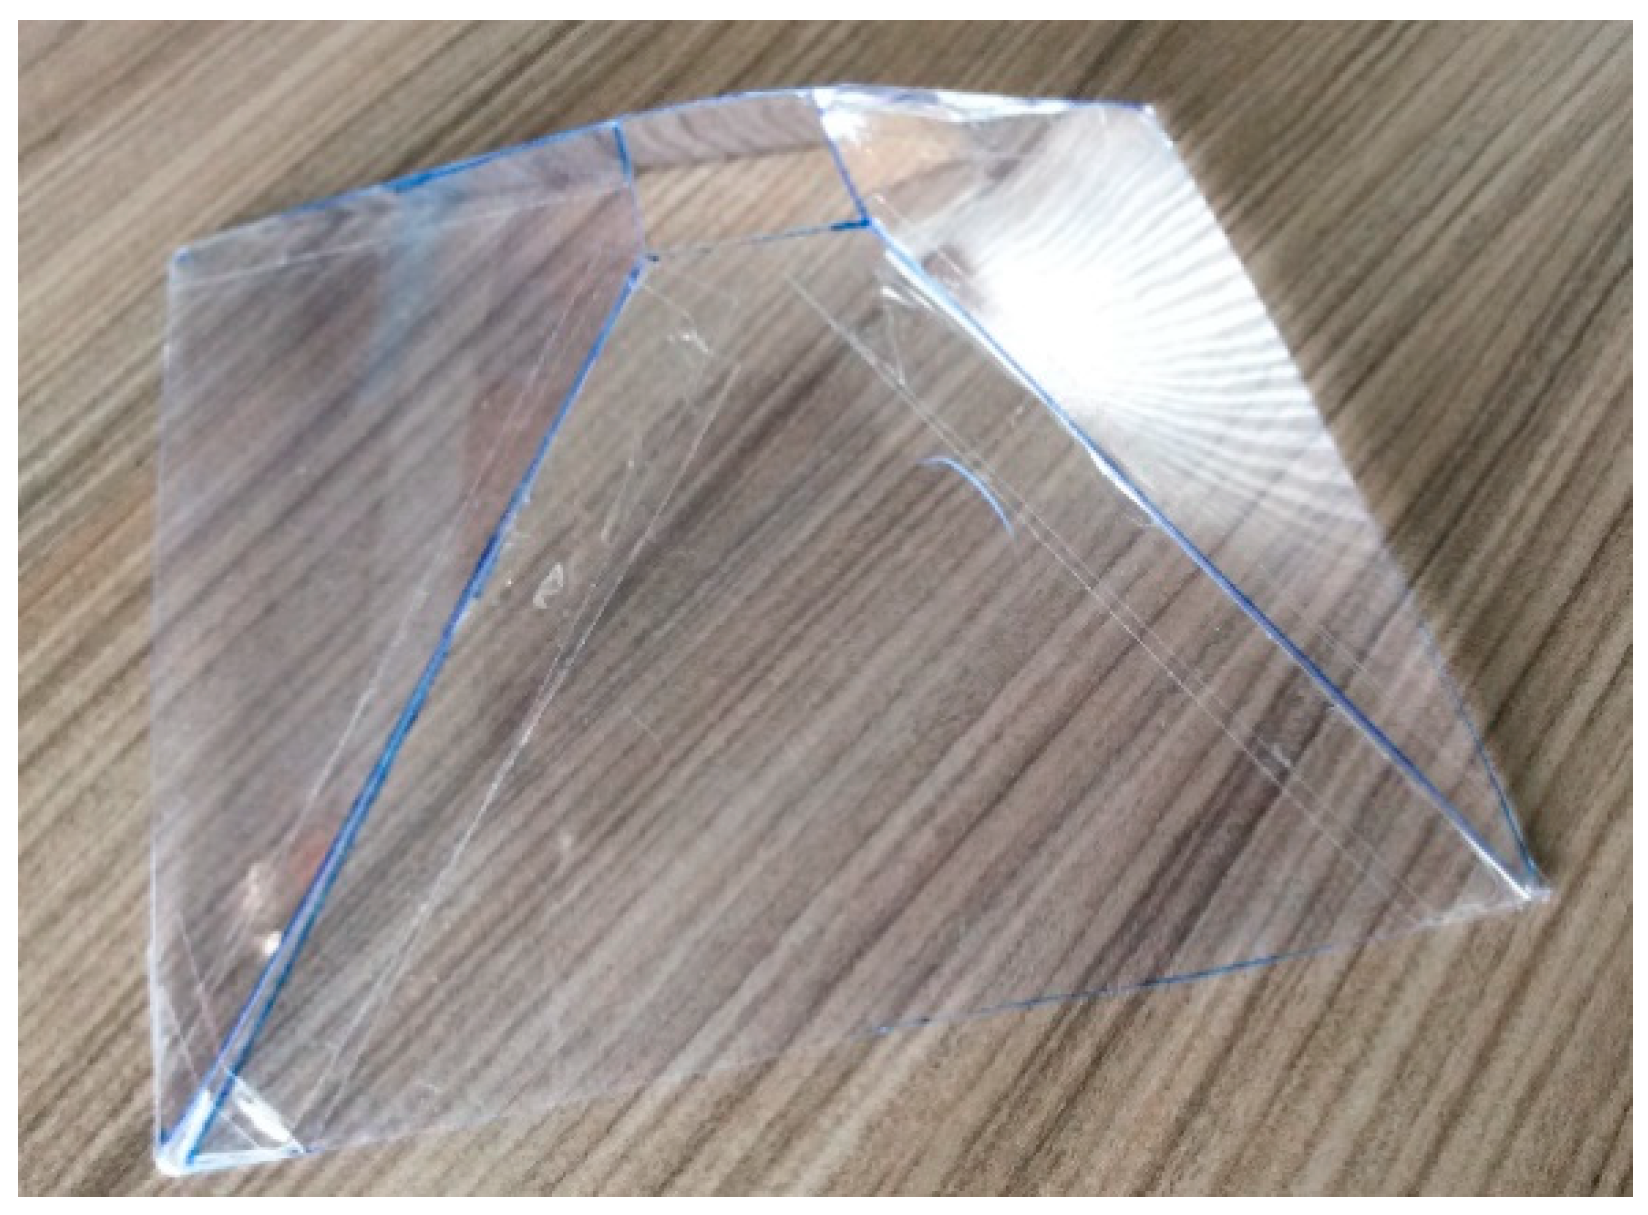
2.3. The Use of the Hologram in Geometry

In the context in which we are immersed, the use of the hologram acquires its full potential as a technological tool that allows us to obtain a three-dimensional representation of an image. As explained by Liu, Pang, Jiang, and Dong [17], an augmented reality effect of a floating holographic 3D image is obtained.
The hologram is not a recently discovered technique since it was developed in 1947 by Dennis Gabor [18]. It is based on the formation of a three-dimensional photograph with a laser beam when it is incised through an object, so the ray that is projected allows obtaining three-dimensional images.
There are several types of holographic techniques, and in this article, we will use the square-based pyramid trunks, which are placed on a reflective surface, such as the screen of a tablet, in an inverted position, so the hologram can be seen “floating” on the surface of it.
When talking about the application of any technological tool, it should be borne in mind that its potential should not be based on their use, the importance is that it has to be an integral part of the teaching–learning process. In this sense, teacher training is crucial to ensure that the hologram becomes a medium to reach knowledge.
As was proposed by Serra et al. [4], the hologram can be considered as a teaching medium, since its foundation is supported by the principles of general pedagogy. It is worth highlighting studies, such as those of Lee [19], which explain how the adequate implementation of holograms in the classroom enables students to be in an attractive environment. This, in turn, allows them to have greater concentration and to build their own learning process. Another study presented by Walker [20] shows the advantages of using holography as a teaching medium.
Moreover, in [19] it is affirmed that it constitutes an element of socialization, since, in addition to the generation of individual conceptual relationships, the student can express his knowledge to the class group while the experience is taking place. The commonality of said knowledge forms a social bond.
As can be seen in [21], industry offers 3D and holographic tools and some applications to the education of STEM (Science, Technology, Engineering and Mathematics) subjects. On the other hand, there exist several studies, such as [22], about the application of the dual coding in mathematics and its good results. Finally, other techniques for teaching mathematics with different technologies are presented by very renowned researchers in this area [23,24,25,26,27,28,29].

3. Methodology

3.1. Objective and Hypothesis

Our objective is to verify if there are significant differences in the students’ learning of the mathematical concepts related to areas and volumes of geometric bodies depending on whether or not they have studied these concepts through a methodology that uses the hologram as a teaching medium.
The study hypothesis is “the hologram is a teaching medium that enhances the students to improve their results in the learning process of areas and volumes of geometric bodies”.

3.2. Sample

The development of this study has been approached considering a sample of 78 students of the third-year of compulsory secondary education (15–16 years old) corresponding to four classes of a privately-owned but state-funded school located in Spain. The study has been carried out in the subject of Mathematics Oriented to the Academic Teachings and performed by the teachers of the subject, to whom the procedure was previously explained and who have the permission of the school to carry out the research.
Of the total of students of the four classes, 35 formed the control group, who studied traditionally, and 43 formed the experimental group who studied using the hologram as a teaching medium. Both groups were homogeneous, and the students answered a test of previous knowledge before the experience to check what they remembered from previous years in relation to areas and volumes of flat figures and easy concepts of volumetric bodies.
It is also important to mention that the results in the pretest lead us to form homogeneous groups between the students of the four classes to assess that the new knowledge was acquired from the methodology proposed in each case because they had the same knowledge about areas and volumes concepts.

3.3. Research Design

The study design is quasi-experimental and the methodology, both to corroborate the working hypothesis and to assess the user experience, was quantitative.

3.4. Information Collection Tools

To obtain the information required for this project, several types of questionnaires elaborated with Google Forms have used. First, we have worked with a pre-test with 21 very simple questions, 12 of them based on concepts related to flat figures, the name of their parts and the calculation of their perimeters, areas, and volumes, six based on classification and obtaining of the bodies of revolution, and three of them based on the calculation of areas and volumes of bodies of revolution without the application of formulas (see Appendix A). After the pre-test is done, the results are used to divide students in control and experimental groups, in such way that the groups were homogeneous and the difference between the means of both groups was despicable.
After the development of the experiment, students of both groups answered the post-test, without having the option to review the content, to assess whether there were significant differences between the results obtained after the application or not of the tool. The post-test consisted of 14 questions about the concepts of areas and volumes of geometric bodies studied. These have been:
  • Lateral and total areas of polyhedrons
  • Lateral and total areas of bodies in revolution
  • Volumes of polyhedrons
  • Volumes of bodies of revolution
Within the polyhedrons, the cube, the orthohedron, the tetrahedron, the rectangular and in hexagonal prisms, the pyramid, and the pyramid trunk were studied. Within the bodies of revolution, the cylinder, the cone, the truncated cone, and the sphere were studied. In addition, the relationship between the volume of the tetrahedron and the triangular prism, between the cube and the square-based pyramid and between the cone, cylinder, and sphere were studied (see Appendix B).
Nine of the 14 questions of the post-test were of single selection of a numerical value corresponding to the solution of the application of a formula to calculate an area or a volume of a geometric body. In the other 5 questions, it was required to mark one or several statements related to the obtaining of the geometric bodies and the relation between the volumes.
Finally, a validated questionnaire to assess the students’ experience in the experimental group after using the hologram was undertaken. This questionnaire was also used to gain an understanding of whether the students had understood some concepts related to light phenomena. It consisted of 16 questions, 12 of them were Likert scale assessment from 1 to 5 (1 being in total disagreement and 5 in total agreement) about the relation between the hologram and the learning process of the students, in terms of autonomous work, creativity, collaborative work, etc. The other four questions were designed to assess the level of satisfaction and recommendation of the hologram use (see Appendix C).

3.5. Procedure

To carry out this study the control group worked traditionally, so the teacher explained the contents in a master class, and the formulas were presented to the students, and they had to learn them by heart. After that, they completed the post-test. The experimental group worked with the hologram.
The first stage was the verification of the previous knowledge of the students about the calculation of areas of flat figures and the types and characteristics of geometric bodies using the pretest. The results allowed us to form the homogeneous groups.
To perform the experience with the hologram, we established four phases:
Construction of the geometrical bodies to be projected with the hologram. Once the teacher determined the prior knowledge of the students, she made and edited the videos, so the first stage was to build the figures. They were created with the GeoGebra® program (Classic 5, Markus Hohenwarter et al, Linz, Austria), adding to each of them as much explanatory information as deemed necessary and taking into account the following considerations. It was necessary that the figures had a black background. In the case of the:
Lateral areas of polyhedrons: It is essential to place special emphasis on the decomposition of the faces so that students reach the calculation of the lateral area from the areas of the flat figures.
Bodies of revolution (cylinder, cone, truncated cone, and sphere): It is important that students understand how they are obtained from the revolution of the flat figures from which they are formed.
Lateral areas of the cylinder, cone and truncated cone: It is important to break them to reach the formula of the area. In the case of the area of the sphere, it is convenient to highlight that it is the same as the area of four circles.
Volume of the cube and prism: It is necessary to show it from the three-dimensional arrangement of the figures in two dimensions. The volume of the tetrahedron can be shown as a third of the volume of a prism, joining three tetrahedral, the volume of a square-based pyramid can be made as a third of the volume of the cube, and the volume of the cone can be shown as a third of the volume of the cylinder.
The volume of the bodies of revolution: It is crucial to show the students the relationship between the cone, cylinder, and sphere volumes.
Creation and edition of a video of each figure with Camtasia® (3, TechSmith, Okemos, MI, USA), by the teacher, turning the figures and showing their decomposition when possible. In this case, we have worked with four independent videos on (a) polyhedrons lateral areas, (b) areas of bodies in revolution, (c) volumes of polyhedrons, and (d) volumes of bodies in revolution, which were shown in this order to students.
In Figure 1, the result of an image of the video made with Camtasia ® to be projected with the hologram.
Construction of the hologram. Acetate was used since it is a transparent, semi-soft plastic material that is easily cut. In our experience, for the manufacture of each hologram, the students cut four trapezoids, whose measurements were calculated bearing in mind that the iPad Air® was going to be used as a device to project the videos. The dimensions of the trapezoids were: 13 cm for the greater base, 2.5 cm for the smaller base and 8.5 cm in height. It should be noted that, in this case, the construction of the hologram led students to become familiar with the calculation of the lateral area of the pyramid trunk. Once built, they were glued on their sides and obtained the pyramid trunk shown in Figure 2.
Visualization of the videos with the hologram. The students placed the hologram in an inverted position on top of the screen of the device, and they watched each video twice.
After the experience, the students of both groups answered the post-test to determine the knowledge acquired during the sessions. Its analysis has allowed us to verify the effectiveness of the hologram when comparing the data of the experimental and the control groups. Finally, students of the experimental group answered a validated user experience test, as it is considered very useful to know their opinions about the use of the tool and to evaluate the relationship between different items that take place in the learning process.

3.6. Data Analysis

The percentages of correct answers both in the pre-test and in the post-test were analyzed. In the case of the pre-test, this analysis is considered necessary, since it helped the formation of the groups and the development of the methodologies, according to the previous knowledge of the students.
A comparison of means between the results of the pre-test and the post-test has not been performed since the questions were very different. The pre-test was based on previous concepts while the post-test referred to the new knowledge acquired on areas and volumes of geometric bodies, in terms of formulas.
For the analysis of post-test results, we have worked under the parametric assumptions in two independent samples, the control group and the experimental group, so the hypothesis test chosen for the comparison of means was the Student’s t-test. The null hypothesis, Ho, established was that there were no significant differences between the groups and the alternative hypothesis, H1, that there were differences. In the case that the significance value obtained is less than the level of significance of 0.05, the null hypothesis could be rejected. The tests were made with SPSS 21.
For each of the 14 post-test questions, we compared the percentage of correct answers between the control group and the experimental group. In addition, we assessed the concepts that have not been completely learned after the use of the tool to raise its improvement.
Finally, the results of the user experience test of the tool answered by students of the experimental group were analyzed.

4. Results and Discussion

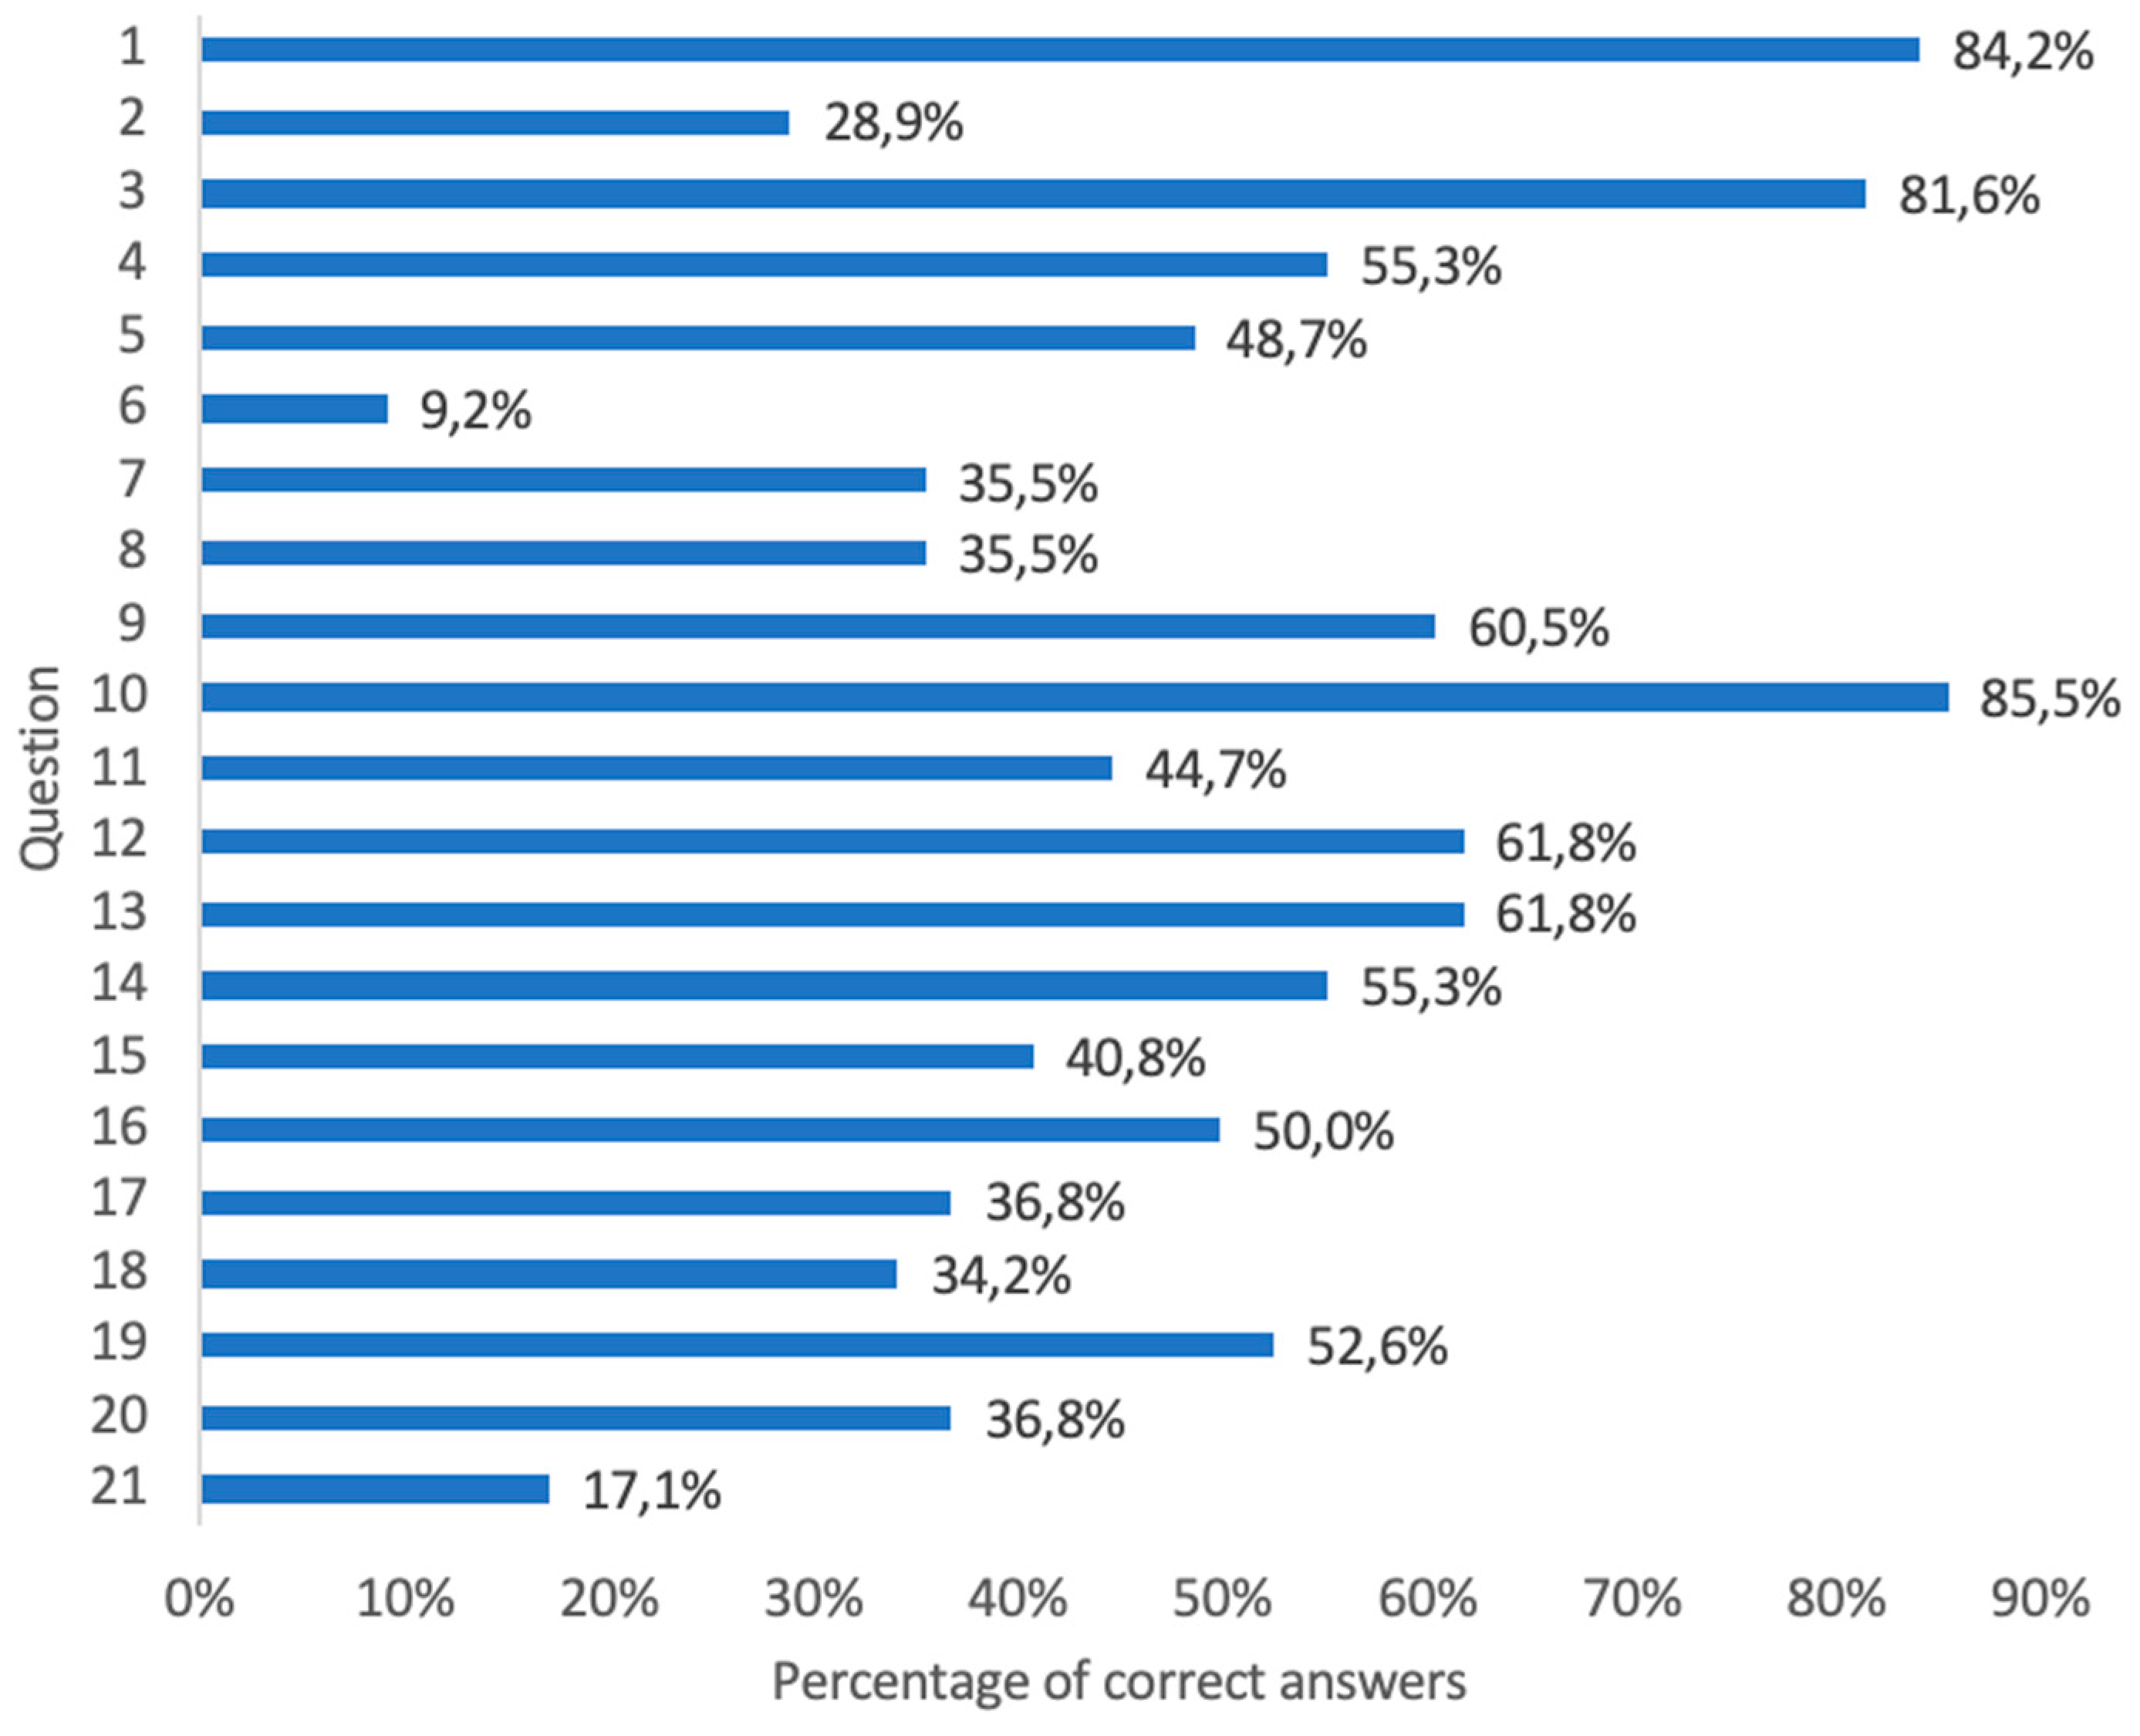
4.1. Pre-Test Results

As mentioned above, the pre-test consisted of 21 questions of very simple concepts about the classification, parts, areas, and volumes of flat figures and some of them related to the obtaining of geometric bodies without to use of formulas. Figure 3 shows the percentages of correct answers to the pre-test of all the students.
As can be seen in Figure 3, the percentage of correct answers was high for some questions, which means that students remember some of the contents of geometry from previous courses. Questions 1, 3, and 10 have the highest percentage of correct answers, so the students knew what a polygon was, the classification of the triangles, and the calculation of their area. In questions 9, 12, and 13, students obtained more than 60% of correct answers so that they could calculate the area of a quadrilateral and a circle and they knew what a polyhedron was. In question 2, related to the definition of quadrilaterals, students obtained a low score. They considered that a quadrilateral was a square and forgot the rest of the figures in the classification. Therefore, 71% said that it was a figure with four equal sides or with four equal angles or with four straight angles.
Question 6 had the least percentage of correct answers. Most students answered that the perimeter is the sum of the sides, forgetting that the circle has no sides. In relation to question 21, the percentage of correct answers was small, since it was about the calculation of volumes of geometric bodies, content that the students had not studied yet. Seventeen point one percent of them marked the correct option and knew that not all volumes of polyhedrons are calculated by multiplying the area of the base by the height, but most of them did not know that the volume of a cube, orthohedron, and cylinder is calculated in the same way or, that the volume of the cone and the square-base pyramid are one third of those of the cylinder and cube, respectively.
These results lead us to form the control and the experimental groups taking into account the individual qualifications in each question.

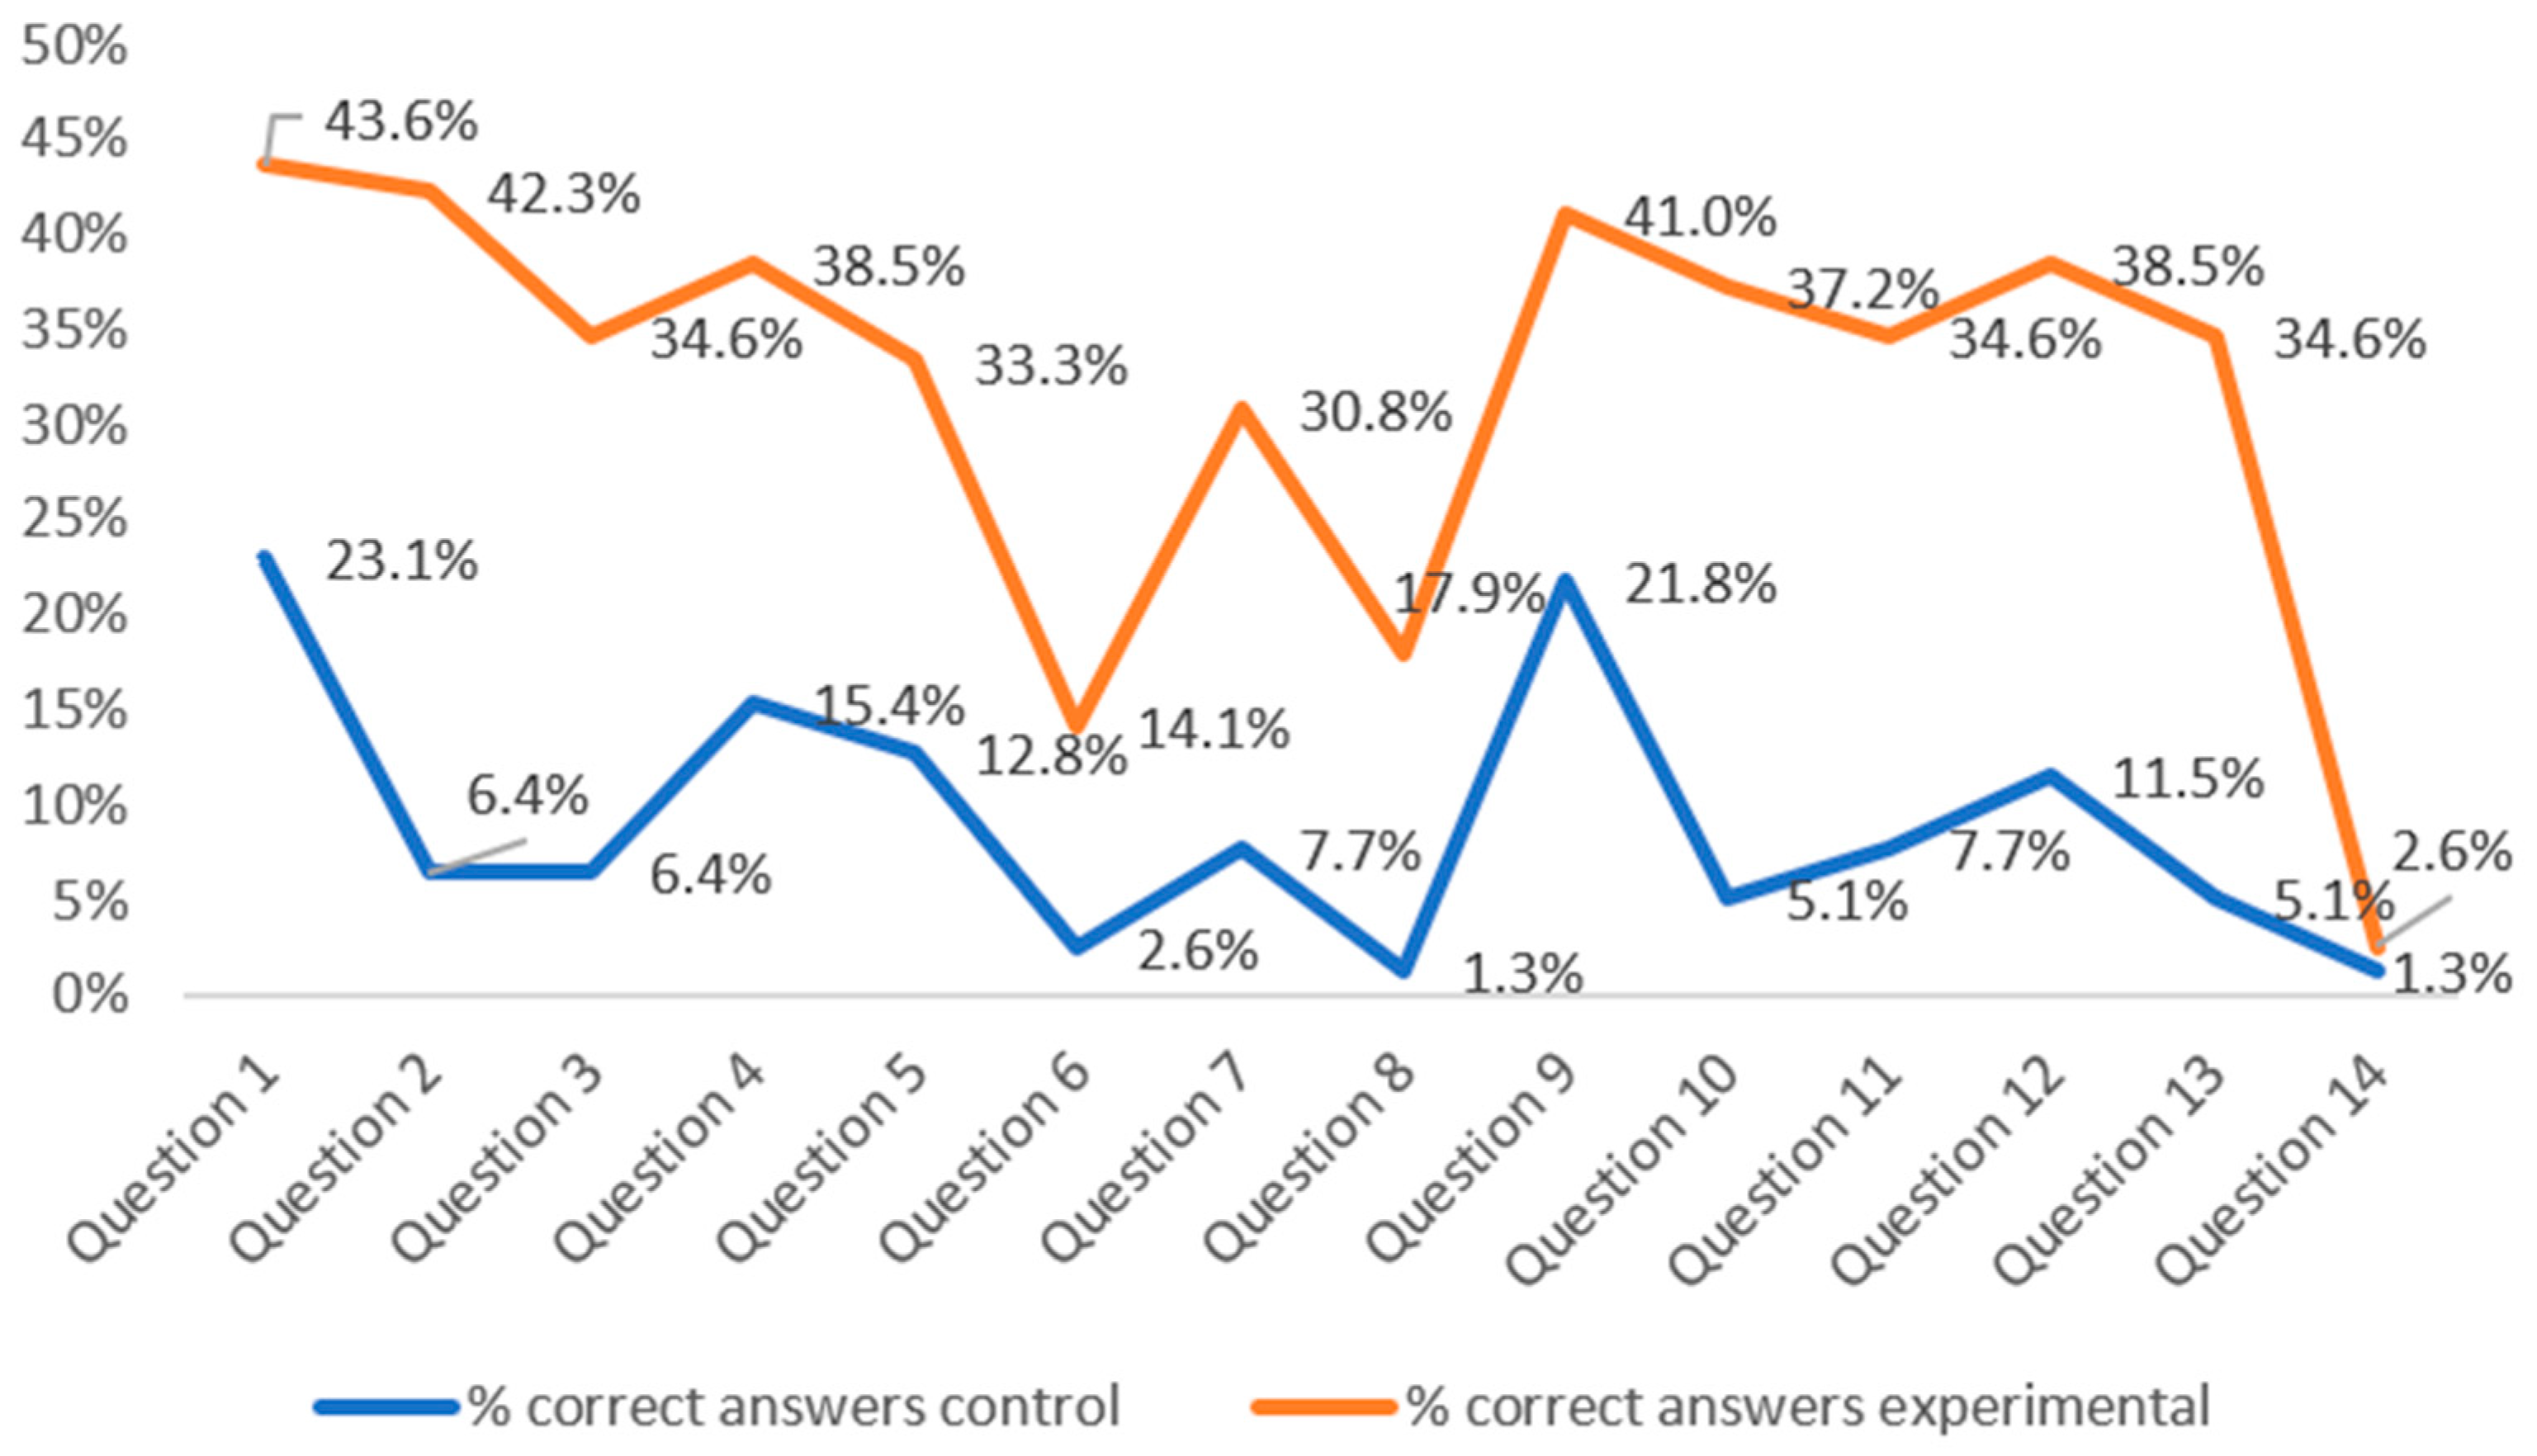
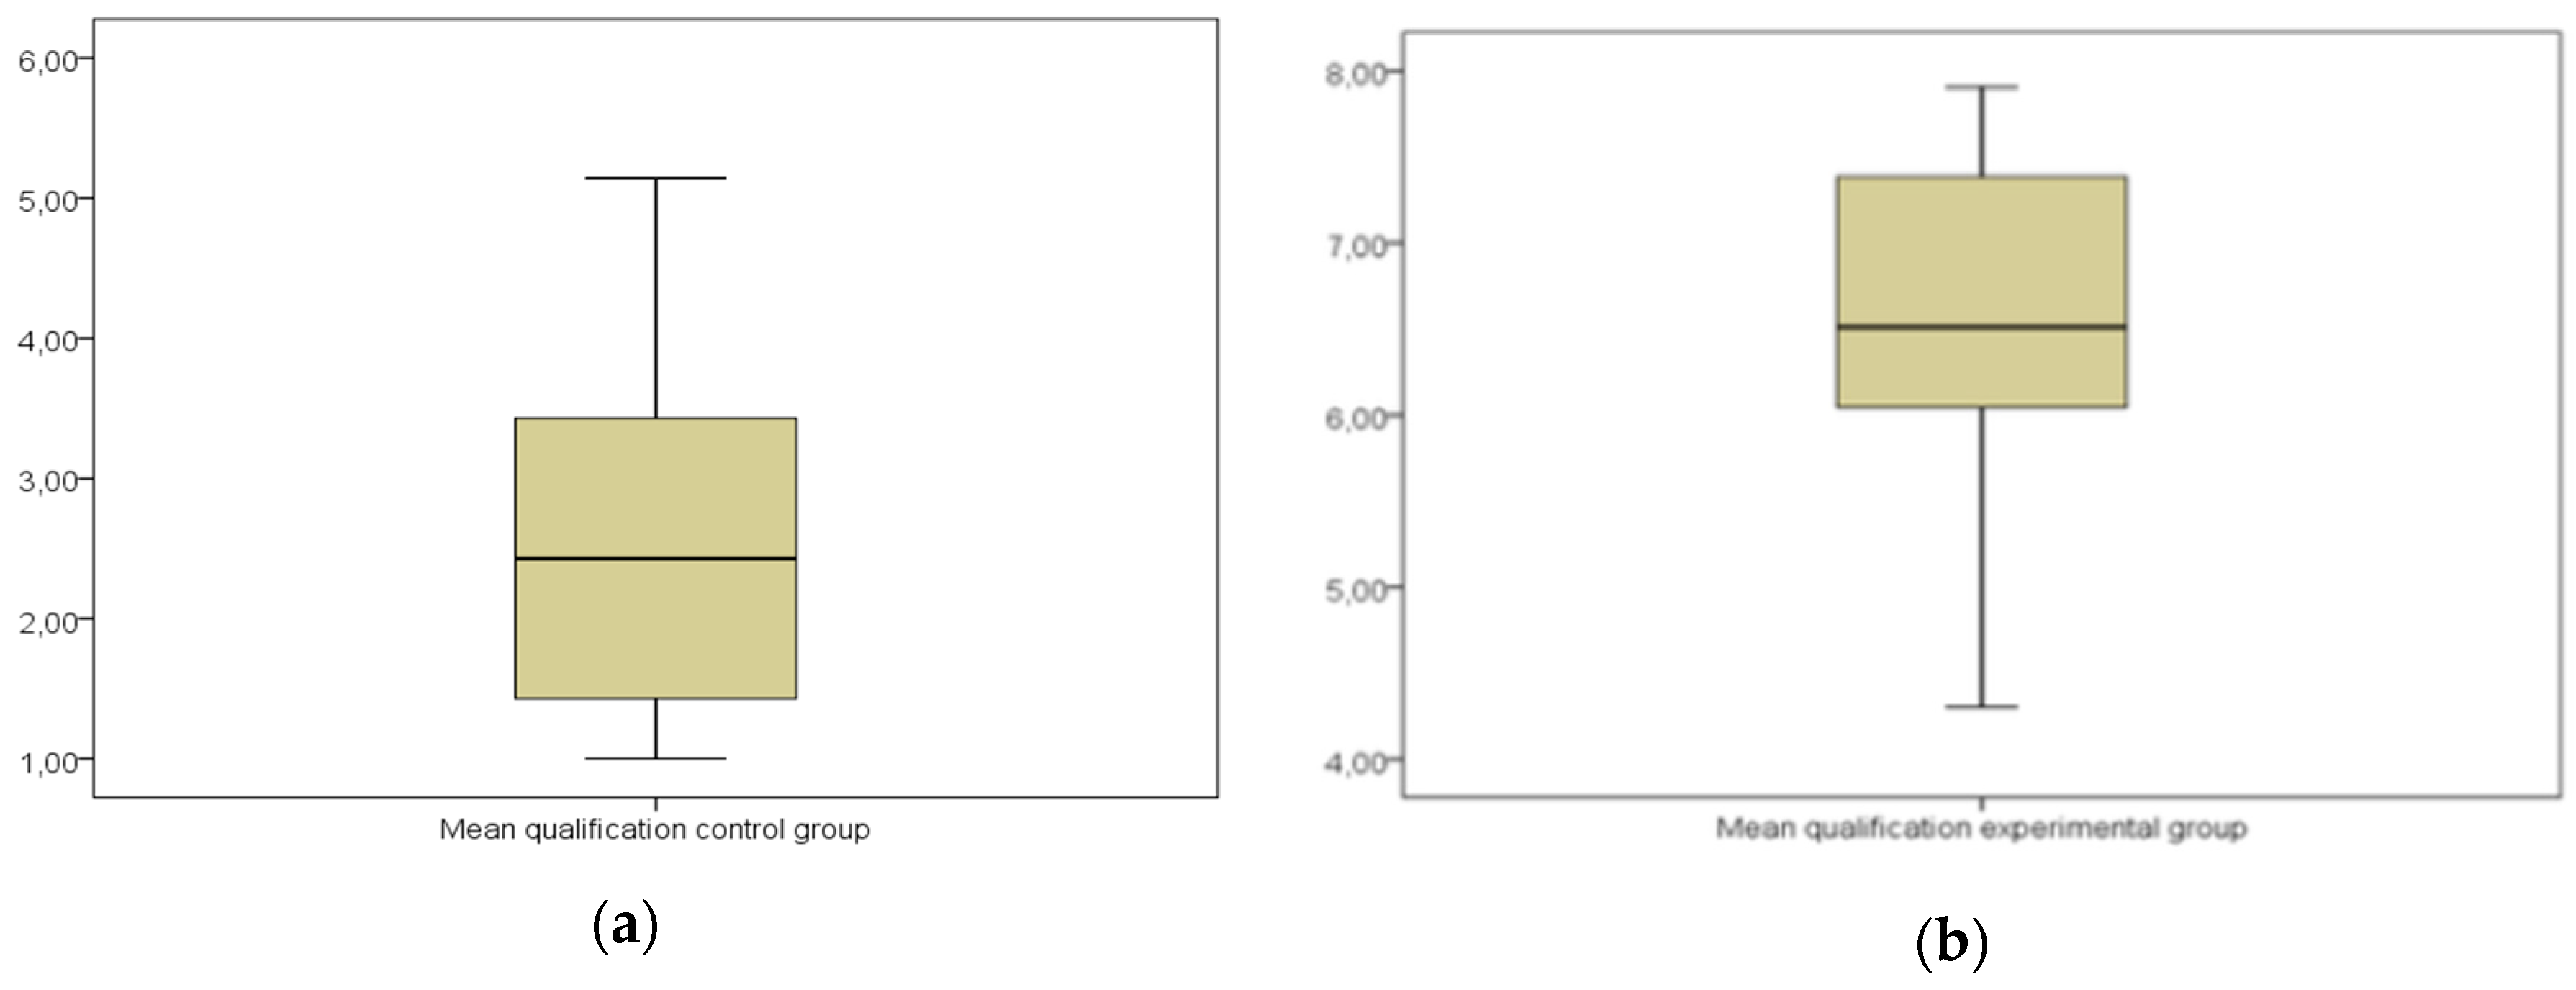
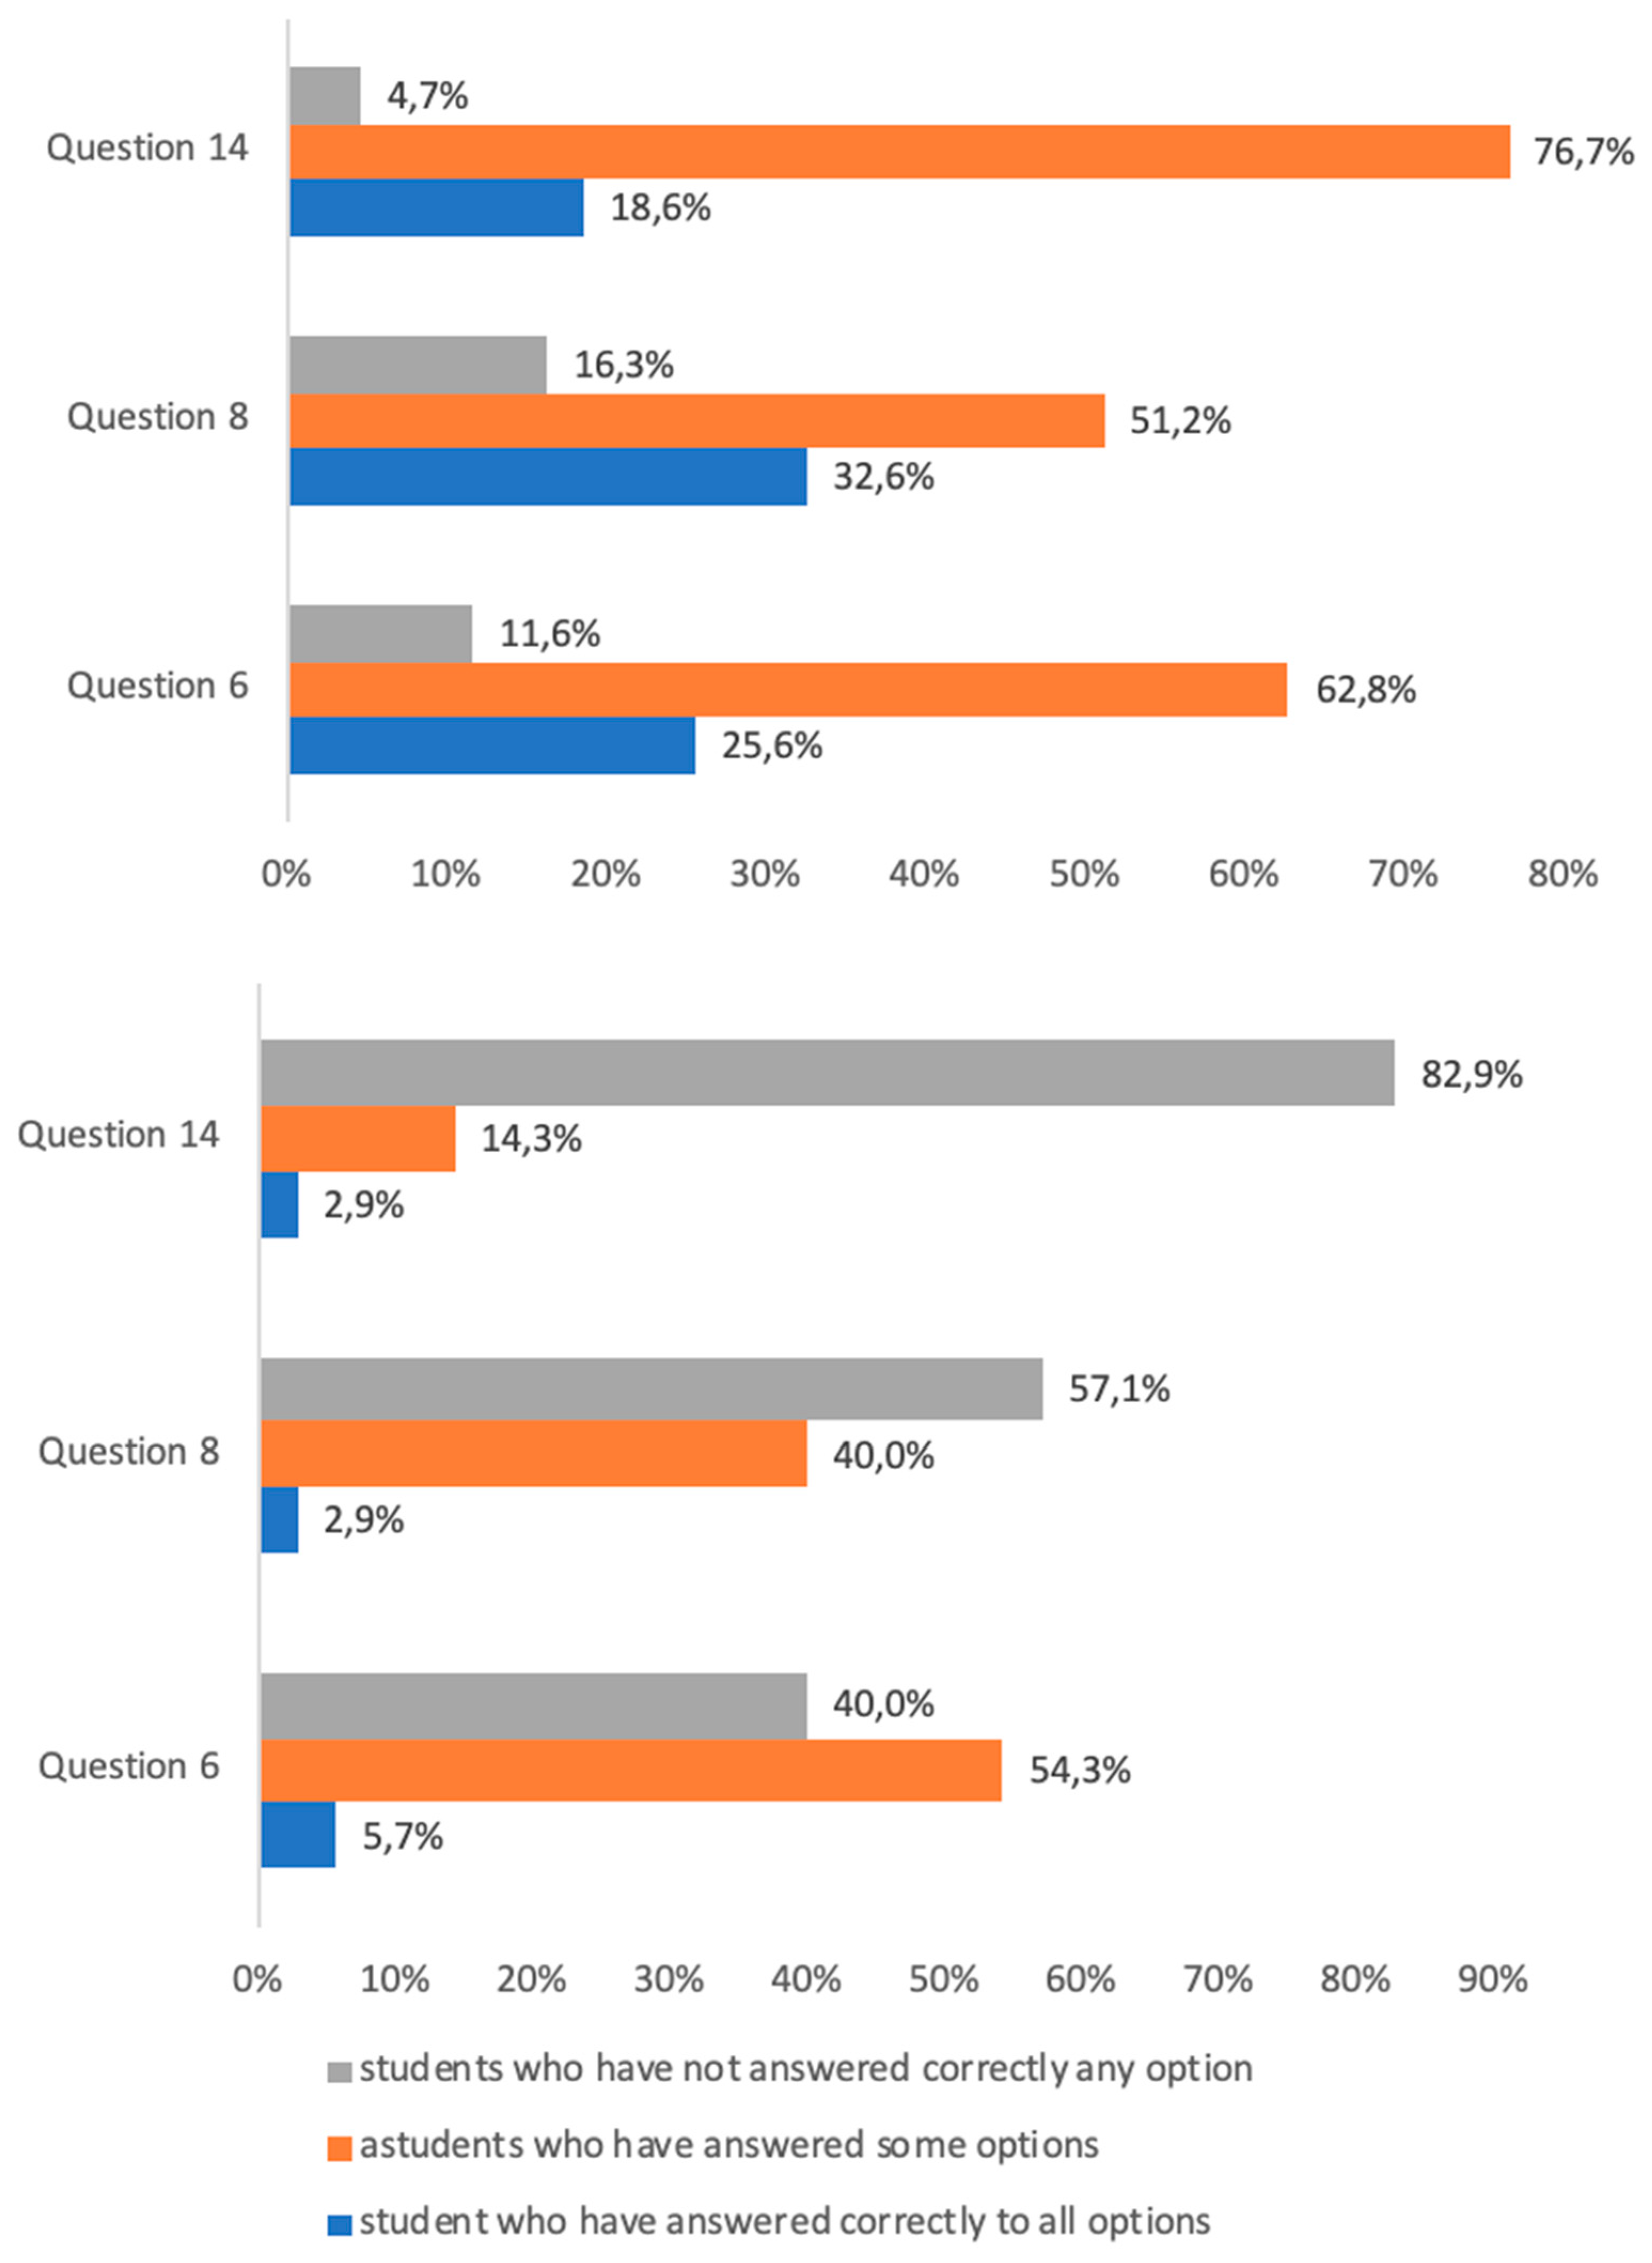
4.2. Post-Test Results

Figure 4 shows the box plots for the mean qualifications of both post-test in control and experimental groups. As can be seen, the mean for the control group is almost 2.43, and the one for the experimental group is 6.51.
The score of the experimental group differed 3.9 points from that of the control group, although in the experimental group the data had a greater dispersion and, therefore, there was more difference between the maximum and minimum value of the qualifications.
The test of comparison of means of two independent groups under the parametric assumptions, Student’s t-test, was carried out with the statistical program SPSS and the reported results and the validity of the proof are collected in Table 1.
It is observed that the level of significance obtained has been null, significance 0.000, so, as it is small than 0.05, Ho is rejected, concluding that there are significant differences between both control and experimental groups. As previously mentioned, the difference in means between the qualifications of control and experimental groups was 3.9 points with a standard deviation of 0.2441 points so it can be said that the use of the holographic tool has improved the meaningful learning of the concepts studied. It should be noted that, the value of the average of the qualification obtained in the experimental group has not been very high, 6.52, but this fact is logical if we take into account that the post-test was answered by students immediately after working with the hologram, without being able to do the subsequent review of the concepts learned. It is verified that the students have learned the concepts through the use of this tool and the selected videos, being able to learn by themselves and to build their own learning process. The percentage of correct answers for each question for both groups is shown in Figure 5.
As it has been mentioned above, the qualifications obtained have been low for both the control and the experimental groups as it was the first-time students had seen these concepts, and the post-test was answered immediately after the learning experience. In addition, in the specific qualifications per question, it is also appreciated that the values of correct answers were also low for both groups, although they were higher in the case of the experimental group, since questions did not exceed 45% of correct answers.
In Figure 5, it can be seen that there has been a gain of between 20% and 30% in most of the questions in the experience with the hologram, with the exception of questions 6, 8, and 14, which have the least differences. It is interesting to understand the reason for future improvements to the tool or methodology. The results for questions 6, 8, and 14 corresponding to the students of the experimental and the control groups are shown in Figure 6.
In these three questions, there was more than one correct option to choose. In the case of question 6, which was related to the obtaining of the volumetric bodies and the calculation of their area, most students, both in the experimental and the control group, 62.8% and 54.3% respectively, left some options unanswered, but it is important to mention that 25.6% of the students in the experimental group answered all options correctly compared with 5.7% of the control group.
Regarding question 8, based on the relationship between the tetrahedron and the prism and the square base pyramid and the cube, 32.6% of the students in the experimental group answered all the questions correctly while most of the students, 51.2%, left one of the answers blank. In the control group, only 2.9% of students answered all questions correctly, and 40% selected some correct answers only.
According to question 14, about the relationship between the volume of the cone, cylinder, and sphere, it can be seen that most of the students in the experimental group, 76.7%, left answers unmarked compared with 18.6% who marked all of them. In the control group, 82.9% of students did not answer any options correctly.
In general terms, it can be said that in these three questions, the ones with lower general qualifications in both groups, most students in the experimental group answered some questions correctly, but in the control group, most have not answered correctly. This fact leads us to consider the potential of the tool for learning areas and volumes.
However, we consider it important to analyze the reasons why the qualifications have been so low in these questions, especially in the experimental group who worked with the hologram. We believe there can be two options. On the one hand, it is possible that they did not understand these concepts correctly after the use of hologram but, on the other hand, it is also possible that most of them did not realize they had to mark several options. For this reason, in view of future experiences, it is considered necessary to rework the questionnaire to determine where the fault lies.
In terms of similarities between the groups, we can say that questions 1, related to the surface area of the octahedron, and question 9, related to the relationship between the volume of a cube and the one of each of the three pyramids it can form, are the questions in which the higher qualifications in both groups were obtained, although the percentage of correct answers was greater in the experimental group. This fact leads us to check that students have had fewer problems learning these concepts in both groups.

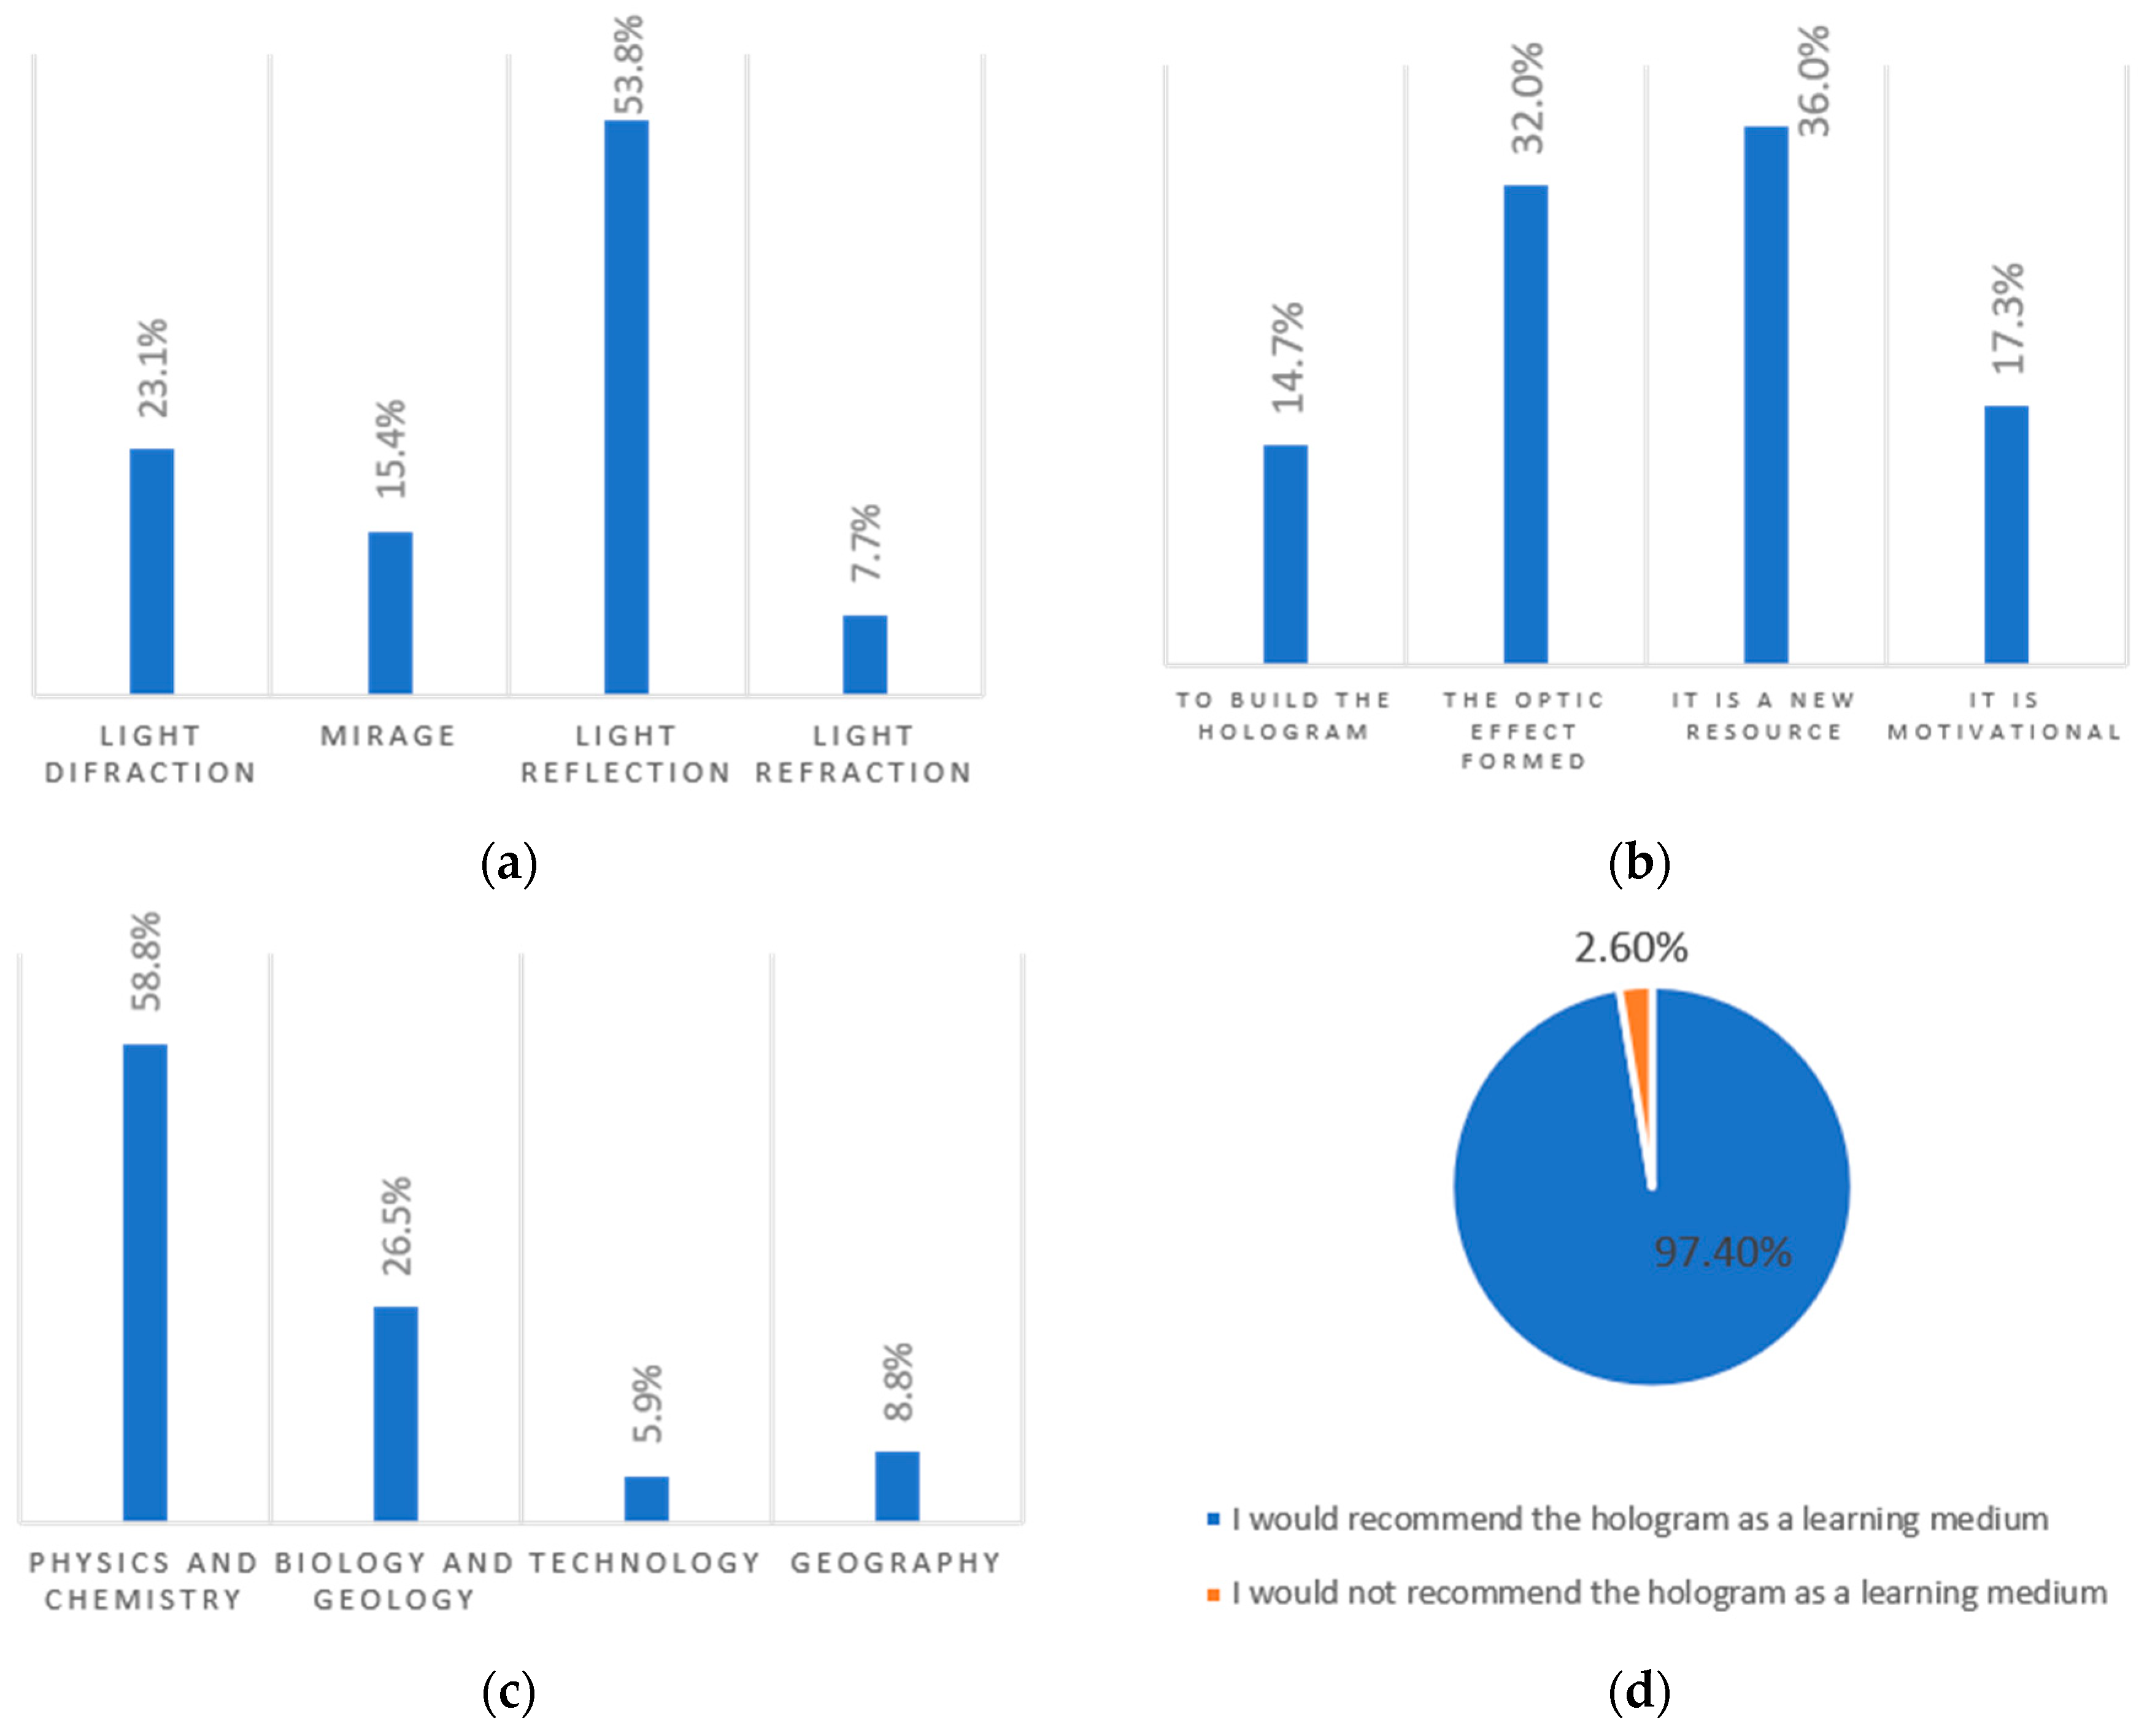
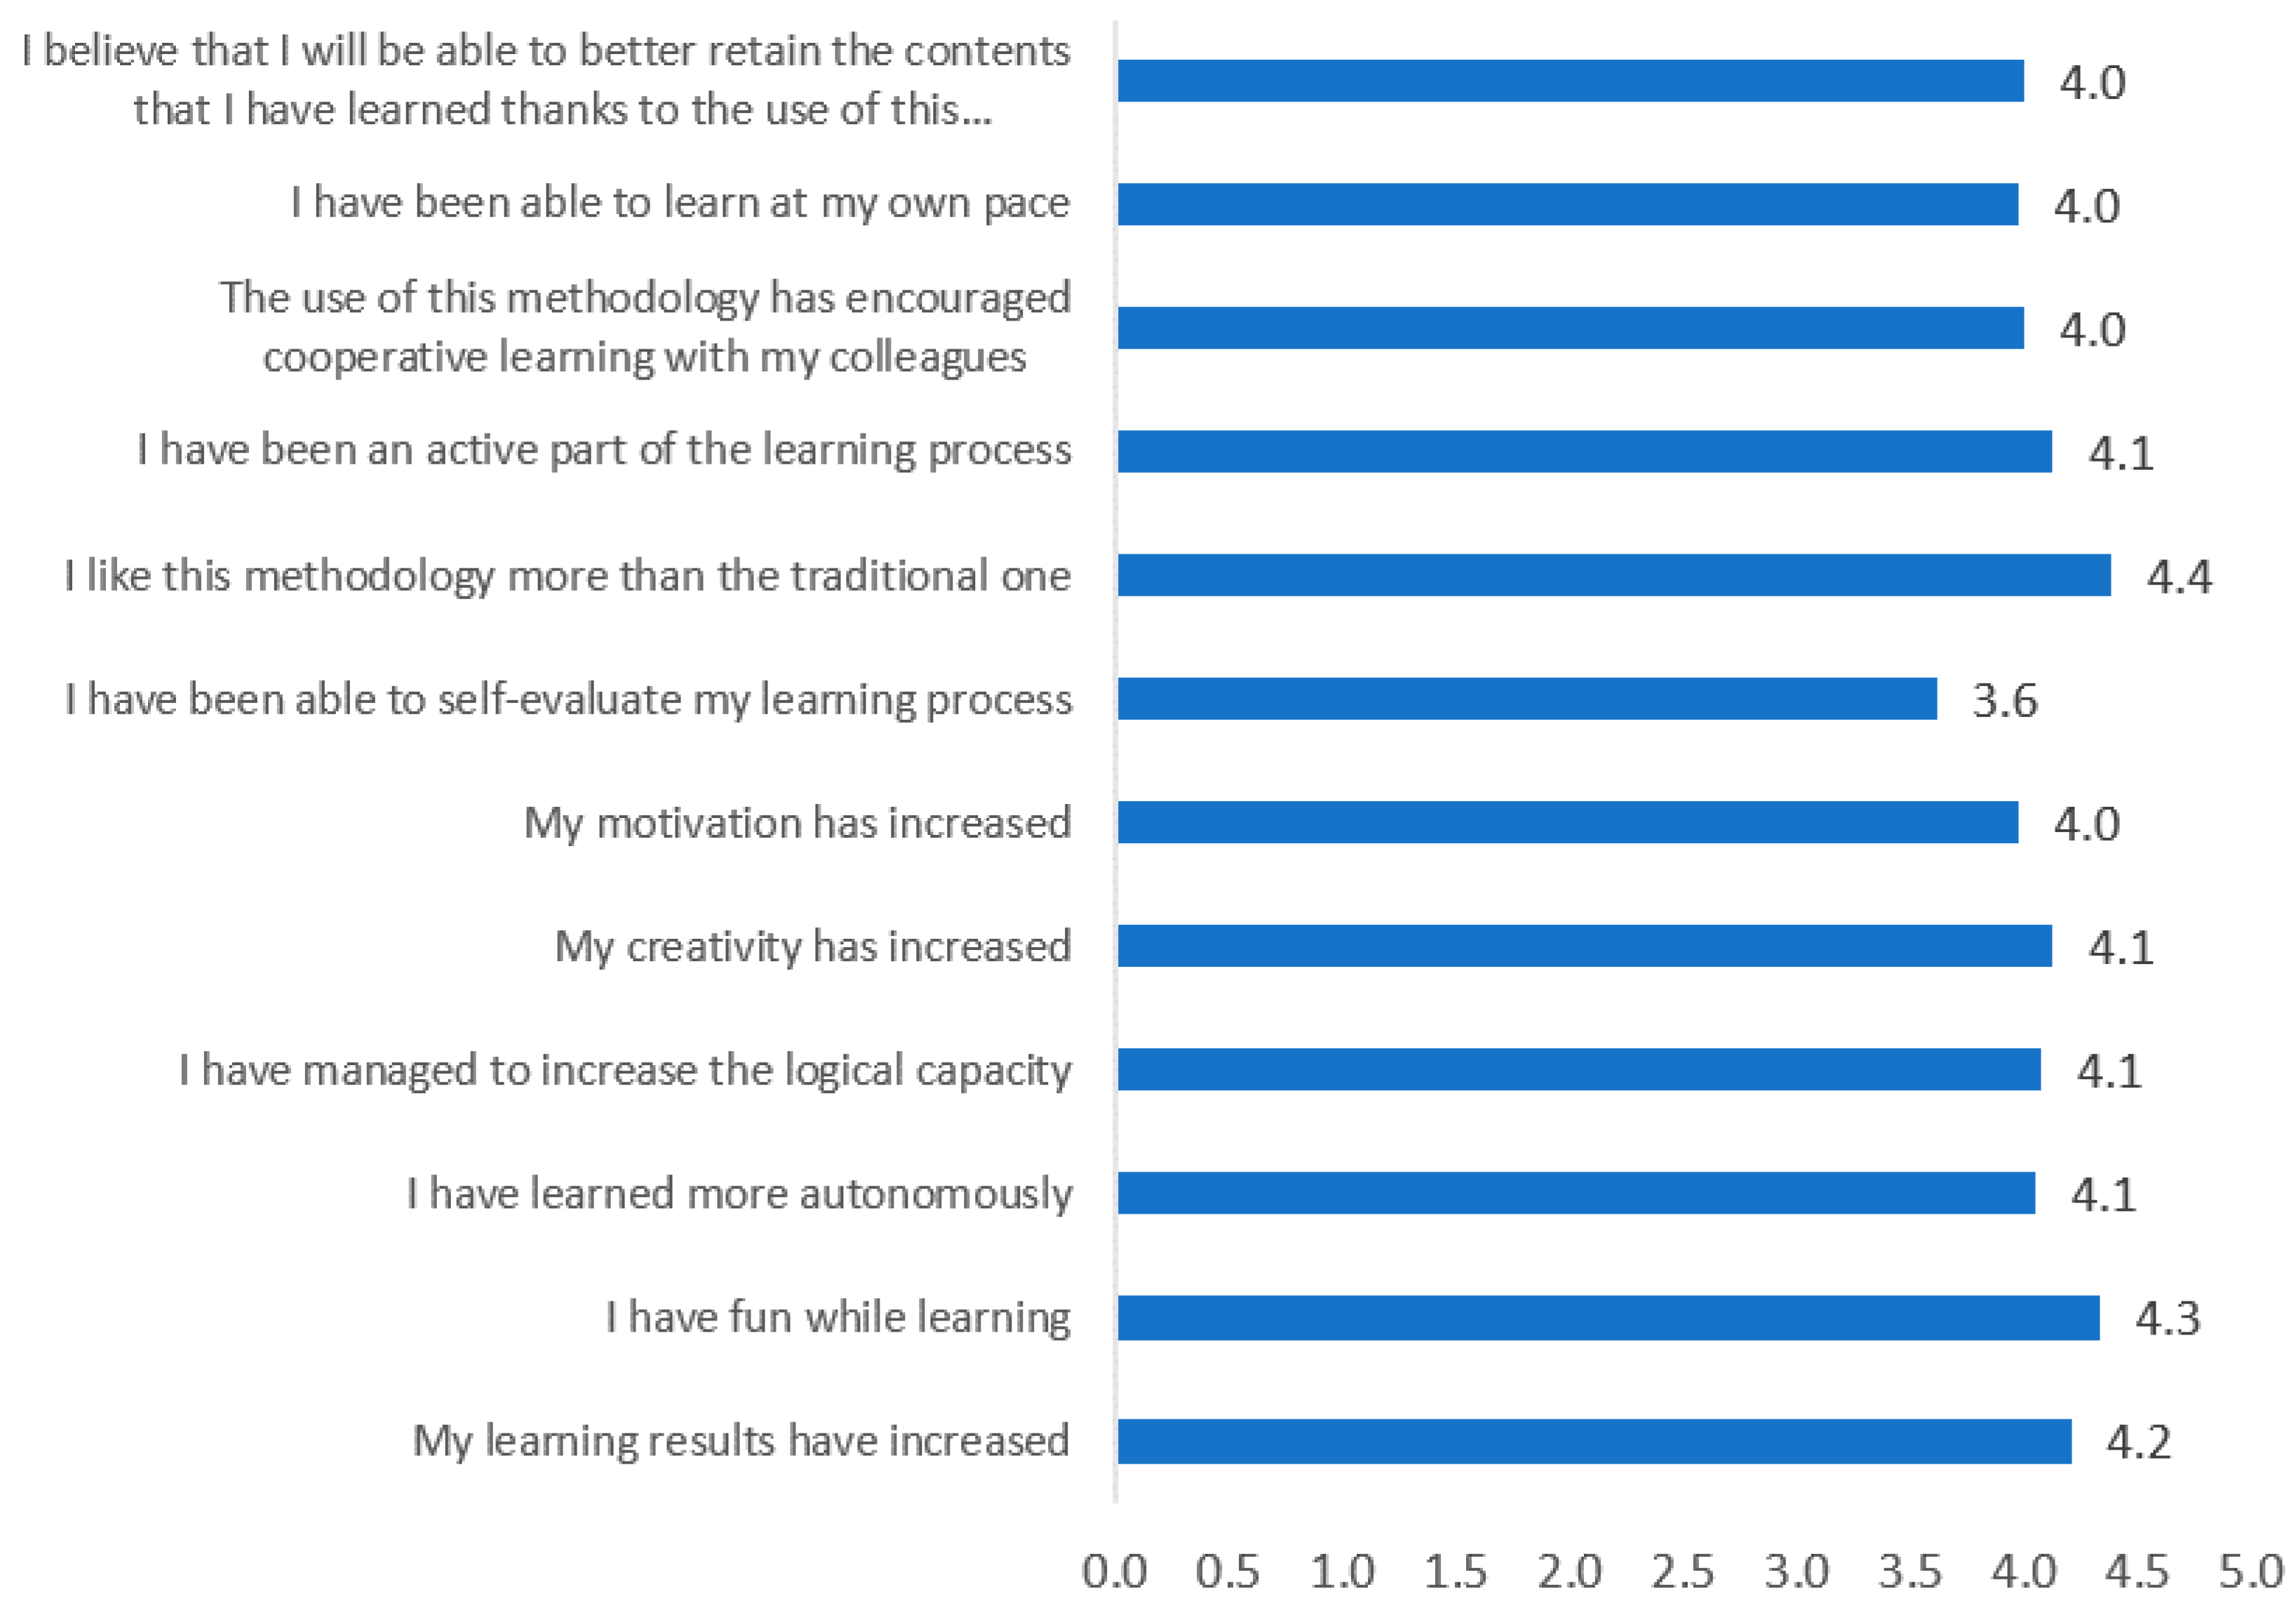
4.3. User Experience Results

The user experience has been analyzed from two points of view. On the one hand, the opinions of the students about the physical phenomenon produced in the hologram and their level of satisfaction has been assessed, and on the other hand, their considerations about how the experience with the hologram influenced their learning process using a Likert scale of 1 (in total disagreement) to 5 (total agreement) has been evaluated. The results are shown in Figure 7 and Figure 8.
It should be noted that the data indicate a positive user experience among the students of the experimental group since 97.4% of them would recommend it as a teaching medium. The aspects they most liked about working with the hologram, were “because it is a new resource” with 36% and “the optic effect produced” with 32%. These facts are considered obvious because students are familiarised with the use of technological devices which are changing and improving every day and they like to investigate new ones. It should also be mentioned that 53.8% of students considered that the hologram is formed due to the phenomena of light reflection, which implies that they have learned a practical application of this phenomenon. These results lead us to consider that it would be advisable to use this tool to work on the concepts related to light with students in physics classes, in line with what 58.8% of students comment on the feasibility of using it in this subject.
The value of the overall assessment mean of the Likert-type scale items was 4.1 (agree) with a standard deviation of 0.2. In Figure 8, it can be seen that the item with the highest rating was “I like this methodology more than the traditional one”, followed by “I had fun while learning” and “My learning results have increased”.
These data corroborate that the user experience has been very positive since it demonstrates the potentiality of the hologram in the classroom for learning the concepts of areas and volumes of geometric bodies.

5. Conclusions

The objective set out in this work has been based on verifying if there were significant differences in the learning of the mathematical concepts of areas and volumes of geometric bodies when using or not the hologram as a teaching medium. The results of the means comparison test with the Student’s t-test statistic, given the nature of the sample and the variables, have shown that there has been a significant difference in terms of qualification obtained between the control and the experimental group. These differences are because the students in the experimental group, who have used the hologram, have learned the concepts better thanks to the tool. These results are in accordance with the ones obtained in [5] so it can be concluded that the hologram enables the learning process of the concepts studied, in this case the ones related to the areas and volumes of geometric bodies.
It is worth mentioning that the overall qualifications obtained, and the ones obtained in each question in the post-test, have been low in the experimental group, with 45% of correct answers, but there has been a gain of 20 to 30% with respect to the control group. However, this fact is considered logical since it is the first time that students have seen the concepts of areas and volumes of geometric bodies and the post-test was answered after the realization of the classroom experience, without having time to study. This fact is considered of great importance because it indicates that students’ learning has been meaningful.
The proposed hypothesis has been tested based on the results obtained, which helps us to support the assertions of Serra el al. [4] and Walker [17] and corroborate the conclusions obtained by the authors in [5] which are supported theoretically in [30,31]. Likewise, most of the students considered that the hologram a teaching medium. On the other hand, the optical effect that it produces and the fact that it is a new resource motivated the students to concentrate and, therefore, they valued it as a tool which helps them to foster collaborative and well as active and autonomous learning, because when working as a team, they learnt by themselves, as commented in [32]. All these aspects have been corroborated and are in accordance with the conclusions in [6,11,12,13,14,15] in regard to how directed observation with the use of materials make learning more fun and meaningful.
The use of the pre-test was very important for the study enabling homogenous groups to be formed and to develop the methodology taking into account the previous ideas of students. Intuition has taken a main role and students have developed the Geometric Eye, as affirmed by Fujita and Jones [7].
Students have been able to follow the levels of reasoning proposed by Van Hiele included in [8] and have acquired new skills when analysing the characteristics and properties of the figures, which is in accordance with the theoretical aspect commented by Fabres [6].
Moreover, this tool enhances students’ motivation since it enables us to create collaborative environments. The fact of being able to see the images in three dimensions favours the learning process and students can achieve meaningful learning from a constructivist point of view, which leads us to corroborate the conclusion commented by Lee [19]. Students liked the optical effect that the hologram produced and this made them pay attention to the content.
It is also important to mention that the hologram helps students to develop STEM competencies since they manage to work on maths, science, in terms on light phenomenon, and technology contents in an integrate way, which is crucial to face the demands that society will require of them in the future [33].
As mentioned, it has been seen that in some questions, the students have presented more limitations. Therefore, at the prospective level, it is proposed to change this type of question in the post-test to corroborate if the difficulty is due to the way in which the questions were formulated or to the knowledge apprehended from the hologram itself. In the case that it is due to the hologram, it will be studied in more detail to propose improvements, such as making larger holograms or even with more interactivity to maintain students’ motivation. Moreover, we consider it of interest to continue with the application of the tool in greater samples.

Author Contributions

All authors have contributed equally in writing this article. All authors read and approved the final manuscript.

Funding

This work was supported in part by Programa de Apoyo a la investigación de la fundación Séneca-Agencia de Ciencia y Tecnología de la Región de Murcia 19374/PI/14, by the project MTM2014-52016-C2-1-P of the Spanish Ministry of Science and Innovation.

Conflicts of Interest

The authors declare no conflict of interest.

Appendix A. Pre-Test

1. The polygons are flat figures (T/F)
2. The quadrilaterals have:
a. Four equal sides
b. Four equal sides two to two
c. Four equal angles
d. Four right angles
3. A triangle with two equal sides and a different one is called:
a. Equilateral
b. Isosceles
c. Scalene
d. Acute
4. In a triangle with an angle greater than 90º it is called:
a. Scalene
b. Acute
c. Obtuse
d. Rectangle
5. The apothem of a regular polygon is:
a. The side of the polygon
b. The sum of the sides of the polygon
c. The distance from the center of the polygon to the vertex
d. The distance of the polygon to the middle of the side
6. What is the perimeter of a flat figure:
a. The sum of its angles
b. The sum of its sides
c. The line that forms its outline
d. The space that collects
7. The circumference of a circle is:
a. πr2
b. 2πr2
c. 2πr
d. πr
8. A piece of circumference is called:
a. Arc
b. Sector
c. Radio
d. Angle
9. To which flat figure corresponds the formula for calculating area axb, where a and b are the sides:
a. Rectangle
b. Quadrilateral
c. Triangle
d. Hexagon
10. The formula of the area of the triangle is:
a. Base x height/3
b. Base x height/2
c. Base x height
d. Side by side
11. How is the area of a hexagon calculated?
a. Decomposing in equilateral triangles
b. Decomposing in isosceles triangles
c. Decomposing in triangles
d. Decomposing in scalene triangles
12. The area of a circle is:
a. πr2
b. 2πr2
c. 2πr
d. πr
13. A polyhedron is:
a. A flat figure
b. A 3D figure
c. A 3D figure whose faces are polygons
d. A 3D figure whose lateral surface is curved
14. A orthohedron is shaped like a shoe box (T/F)
15. What is a polyhedron:
a. Cube
b. Prism
c. Orthopedic
d. pyramid
e. Everyone
16. A body in revolution is:
a. A flat figure
b. A 3D figure
c. A 3D figure whose faces are polygons
d. A 3D figure whose lateral surface is curved
17. What is a body in revolution?
a. Cylinder
b. Cone
c. Sphere
d. Everyone
18. The word edge refers to:
a. The side of a polyhedron
b. The vertex of a polyhedron
c. The height of a polyhedron
d. The face of a polyhedron
19. The total surface area of the polyhedrons is calculated as:
a. Area of the bases plus the lateral area
b. Area of a base by height
20. The surface area of the bodies in revolution is calculated as the sum of the lateral area plus the areas of the base, except that of the sphere
21. Point out the false statement:
a. The volume of a cube, orthohedron, prism and cylinder is calculated as the area of the base by height
b. The volume of a polyhedron is calculated as the area of the base by the height
c. The volume of a cone is one-third of the volume of the cylinder
d. The volume of a square base pyramid is one-third of the volume of a cube

Appendix B. Post-Test

1. The surface area of a 5 cm long, 2 cm wide and 3 cm high orthohedron is:
a. 30 cm2
b. 30 cm3
c. 62 cm2
d. 10 cm2
2. The total surface area of a prism with right triangle base whose legs measure 4 cm and 3 cm and the height of the prism is 6 cm is:
a. 72 cm2
b. 84 cm2
c. 78 cm2
d. 36 cm2
3. The total surface area of a hexagonal prism of 7 cm high whose base is formed by a hexagon of 6 cm side and whose apothem is 4 cm is:
a. 396 cm2
b. 66 cm2
c. 276 cm2
d. 324 cm2
4. The lateral area of a square-based pyramid whose faces are formed by isosceles triangles in which the equal sides have 5 cm and the other 6 cm is:
a. 12 cm2
b. 48 cm2
c. 84 cm2
d. 24 cm2
e. 60 cm2
5. The lateral area of a trunk squared-base pyramid in which the faces are trapezoids with a great base of 7 cm, a small base of 4 cm and an apothem of 5 cm is:
a. 70cm2
b. 280 cm2
c. 110 cm2
d. 88 cm2
6. Label the correct statement/s:
a. A cylinder is a body of revolution obtained when rectangle or a square rotates on one of its sides so its lateral surface area is calculated by multiplying the length of the circumference it forms by the height
b. A cone is a body of revolution obtained when a right triangle rotates by one of its sides and the lateral surface area is obtained by multiplying the length of the circumference that it forms by the height
c. A truncated cone is a body of revolution obtained by cutting a cone or rotating a trapezoid on its straight side and its lateral surface area is πg (R + r)
d. A sphere is a body of revolution obtained when a semicircle or a circle rotates around its diameter and its surface area is the sum of the area of 4 circles.
7. Label the correct statement/s:
a. The volume of a cube and an octohedron is always calculated as the product of the area of the base by the height
b. The volume of a hexagonal prism is calculated as the product of the area of its base by its height
c. The volume of a cylinder is calculated as the product of area of the base by height
d. a and b are correct
e. All are correct
8. Point out the correct affirmation or affirmations
a. Three triangular-base pyramids form a cube
b. Three triangular-base pyramids form a tetrahedron
c. Three square-base pyramids form a cube
d. Three square-base pyramids form a tetrahedron
9. If a cube has a volume of 27 cm3, what will be the volume of the three equal pyramids it can form?
a. 3 cm3
b. 9 cm3
c. 13.5 cm3
d. 6.75 cm3
10. If a squared-base pyramid of side 7 cm and height 6 cm is cut at a height from the ground of 4 cm so that the side of the square of the smaller base is 2 cm, the volume of the pyramid trunk is:
a. 86 cm3
b. 95.3 cm3
c. 6 cm3
d. 12 cm3
11. The volume of a cone of diameter 6 cm and height 5 cm is:
a. 47.1 cm3
b. 141.3 cm3
c. 188.4 cm3
d. 70.65 cm3
12. If a cone in which the base has a radius of 3 cm and 5 cm in height is cut at a height from the base of 3 cm so that the smallest radius of the circle that forms is 1.2 cm, the volume of the trunk of the cone is:
a. 47.1 cm3
b. 44.1 cm3
c. 42.58 cm3
d. 3.01 cm3
13. Label the false statement in relation to the volume of the sphere
a. It is calculated as one third of the product of the surface area by the radius
b. It can be calculated by adding the volumes of all the square-base pyramids that constitute it
c. A sphere can be filled with two cones if the height and diameter of the cone are equal to the diameter of the sphere
d. Three cylinders can be filled with two spheres if the height and diameter of the cylinder is equal to the diameter of the sphere
14. Label the false statement/s
a. With three cones you can fill three cylinders if they have the same height and same base area
b. With three cones you can fill a cylinder if they have the same height and same base area
c. With a cone, a semi-sphere can be filled if the height and diameter of the cone are equal to the diameter of the semi-sphere
d. With three spheres two cylinders can be filled if the height and diameter of the cylinder are equal to the diameter of the sphere
e. With two spheres three cylinders can be filled if the height and diameter of the cylinder are equal to the diameter of the sphere

Appendix C. User Experience Test

Likert-type questions:
1. My learning results have increased
2. I had fun learning
3. I have learned more autonomously
4. I have managed to increase the logical capacity
5. My creativity has increased
6. My motivation has increased
7. I have been able to self-evaluate my learning process
8. I liked this methodology more than the traditional one
9. The learning has been more active on my part
10. The use of this methodology has encouraged cooperative learning with my colleagues
11. I have been able to learn at my own rhythm
12. I believe that I will be able to retain better the contents that I have learned thanks to the use of this methodology
Open questions:
1. The physical phenomenon that has taken place in the use of the hologram is:
2. What I liked most about the use of hologram is:
3. In what subject/s do you think it could be used in addition to mathematics?
4. Would you recommend the hologram as a teaching tool?
5. Is there something you want to comment?

References

  1. Blanco, L.J.; Barrantes, M. Concepciones de los estudiantes para maestro en España sobre la Geometría escolar y su enseñanza-aprendizaje. Relime 2003, 6, 107–132. [Google Scholar]
  2. Gómez-Chacón, I.M. Matemática Emocional. Los Efectos en el Aprendizaje Matemático; Narcea: Madrid, Spain, 2000. [Google Scholar]
  3. Villella, J. Uno, Dos, Tres… Geometría Otra Vez; Aique: Buenos Aires, Argentina, 2001. [Google Scholar]
  4. Serra, R.; Vega, G.; Ferrat, Á; Lunazzi, J.J.; Magalhães, D.S.F. El holograma y su utilización como un medio de enseñanza de la física en Ingeniería. Revista Brasileira de Ensino de Física 2009, 31, 1401. [Google Scholar] [CrossRef]
  5. Orcos, L.; Magreñán, Á.A. The hologram as a teaching medium for the acquisition of STEM contents. Int. J. Learn. Technol. 2018, 13, 163–177. [Google Scholar] [CrossRef]
  6. Fabres, R. Estrategias metodológicas para la enseñanza y el aprendizaje de la Geometría, utilizadas por docentes de segundo ciclo, con la finalidad de generar una propuesta metodológica atingente a los contenidos. Estudios Pedagógicos 2016, 42, 87–105. [Google Scholar] [CrossRef]
  7. Fujita, T.; Jones, K. The bridge between practical and deductive geometry: Developing the geometrical eye. In Proceedings of the 26th PME International Conference, Norwich, UK, 21–26 July 2002; Cockburn, A.D., Nardi, E., Eds.; University of East Anglia: Norwich, UK, 2002; Volume 2, pp. 384–391. [Google Scholar]
  8. Jaramillo López, C.; Duarte, P. Enseñanza y aprendizaje de las estructuras matemáticas a partir del modelo de Van Hiele. Revista Educación y Pedagogía 2009, 18, 109–118. [Google Scholar]
  9. Schonberger, A.K. The relationship between visual spatial abilities and mathematical problem solving are there sex-related differences? In Proceedings of the 3rd PME International Conference, Coventry, UK, 9–14 July 1979; Volume 1, pp. 179–185. [Google Scholar]
  10. Gutiérrez, Á. Las representaciones planas de los cuerpos 3-dimensioanles en la enseñanza de la Geometría espacial. Rev. EMA 1998, 3, 193–220. [Google Scholar]
  11. Owens, K.; Outhred, L. The Complexity of learning geometry and measurement. In Handbook of Research on the Psychology of Mathematics Education: Past, Present and Future; Gutierrez, A., Boero, P., Eds.; Sense Publishers: Rotterdam, The Netherlands, 2006; pp. 83–115. [Google Scholar]
  12. Bishop, A.J. Spatial abilities and mathematics education—A review. Educ. Stud. Math. 1980, 11, 257–269. [Google Scholar] [CrossRef]
  13. Suh, J.; Seshaiyer, P. The Role of Information Technology in Engaging Elementary Students in Mathematical Modeling. In Proceedings of the Society for Information Technology & Teacher Education International Conference, Kuala Lumpur, Malaysia, 24–25 March 2016; pp. 2576–2583. [Google Scholar]
  14. Moyer-Packenham, P.; Suh, J. Learning mathematics with technology: The influence of virtual manipulatives on different achievement groups. J. Comput. Math. Sci. Teach. 2012, 31, 39–59. [Google Scholar]
  15. Clements, D.H.; Sarama, J. Effects of a preschool mathematics curriculum: Summative research on the Building Blocks project. J. Res. Math. Educ. 2007, 38, 136–163. [Google Scholar]
  16. Adams Becker, S.; Cummins, M.; Davis, A.; Freeman, A.; Hall Giesinger, C.; Ananthanarayanan, V. NMC Horizon Report: 2017 Higher Education Edition; The New Media Consortium: Austin, TX, USA, 2017. [Google Scholar]
  17. Liu, Y.Z.; Pang, X.N.; Jiang, S.; Dong, J.W. Viewing-angle enlargement in holographic augmented reality using time division and spatial tiling. Opt. Express 2013, 21, 12068–12076. [Google Scholar] [CrossRef] [PubMed]
  18. Gabor, D. Holography, 1948–1971. Science 1972, 177, 299–313. [Google Scholar] [CrossRef] [PubMed]
  19. Lee, H. 3D Holographic Technology and Its Educational Potential. Teach Trends 2013, 57, 34–39. [Google Scholar] [CrossRef]
  20. Walker, R.A. Holograms as teaching agents. In Journal of Physics: Conference Series; IOP Publishing: London, UK, 2013; Volume 415, p. 012076. [Google Scholar]
  21. Ohlmann, O.M. 3D and Education. In Journal of Physics: Conference Series; IOP Publishing: London, UK, 2013; Volume 415, p. 012066. [Google Scholar]
  22. Suh, J.M.; Moyer-Packenham, P.S. The application of dual coding theory in multi-representational virtual mathematics environments. In Proceedings of the 31st Conference of the International Group for the Psychology of Mathematics Education, Seoul, Korea, 8–13 July 2007; Woo, J.-H., Lew, H.-C., Park, K.-S., Seo, Y., Eds.; PME: Seoul, Korea, 2007; Volume 4, pp. 209–216. [Google Scholar]
  23. Moyer, P.S.; Bolyard, J.J.; Spikell, M.A. What are virtual manipulatives? Teach. Child. Math. 2002, 8, 372–377. [Google Scholar]
  24. Moyer-Packenham, P.S.; Lommatsch, C.W.; Litster, K.; Ashby, J.; Bullock, E.K.; Roxburgh, A.L.; Shumway, J.F.; Speed, E.; Covington, B.; Hartmann, C.; et al. How design features in digital math games support learning and mathematics connections. Comput. Hum. Behav. 2019, 91, 316–332. [Google Scholar] [CrossRef]
  25. Melhuish, K.; Falloon, G. Looking to the future: M-learning with the iPad. Comput. N. Z. Sch. 2010, 22, 1–16. [Google Scholar]
  26. Martín-Gutiérrez, J.; Saorín, J.L.; Contero, M.; Alcañiz, M.; Pérez-López, D.C.; Ortega, M. Design and Validation of an Augmented Reality for Spatial Abilities Development in Engineering Students. Comput. Graph. 2010, 34, 7–91. [Google Scholar] [CrossRef]
  27. Kesim, M.; Ozarsla, Y. Augmented Reality in Education: Current Technologies and the Potential for Education. Procedia Soc. Behav. Sci. 2012, 47, 297–302. [Google Scholar] [CrossRef]
  28. Heinrich, P. The iPad as a Tool for Education: A Study of the Introduction of iPads at Longfield Academy; The ICT Association: Nottingham, UK, 2012; Available online: http://www.naace.co.uk/publications/longfieldipadresearch (accessed on 10 December 2012).
  29. Clements, D.H.; Battista, M.T. Geometry and spatial reasoning. In Handbook of Research on Mathematics Teaching and Learning; Grouws, D.A., Ed.; MacMillan: New York, NY, USA, 1992; pp. 420–464. [Google Scholar]
  30. De la Torre, J.; Martín-Dorta, N.; Soarín, J.L.; Carbonel, C.; Contero, M. Entorno de aprendizaje ubicuo con realidad aumentada y tabletas para estimular la compresión del espacio tridimensional. Revista de Educación a Distancia 2013, 37. Available online: http://www.um.es/ead/red/37/ (accessed on 9 March 2019).
  31. Grouws, D.A. Handbook of Research on Mathematics Teaching and Learning. A Project of the National Council of Teachers of Mathematics; MacMillan: New York, NY, USA, 1992; pp. 420–464. [Google Scholar]
  32. Pozo, J.I.; Monereo, C. Introducción: La nueva cultura del aprendizaje universitario o por qué cambiar nuestras formas de enseñar y aprender. In Psicología del Aprendizaje Universitario: La Formación en Competencias; Pozo, J.I., Pérez, M.P., Eds.; Morata: Madrid, Spain, 2009; pp. 9–28. [Google Scholar]
  33. LeTendre, G.; McGinnis, E.; Mitra, D.; Montgomery, R.; Pendola, A. American Journal of Education: Retos y oportunidades en las ciencias translacionales y la zona gris de la publicacion academica|The American Journal of Education: Challenges and opportunities in translational science and the grey area of academic. Revista Espanola de Pedagogía 2018, 76, 413–435. [Google Scholar] [CrossRef]
Figure 1. Image taken from the video of the volume calculation of the cylinder to be projected with the hologram.
Mathematics 07 00247 g001
Figure 2. Image of the hologram.
Mathematics 07 00247 g002
Figure 3. Percentages of correct answers in the pre-test of all the students.
Mathematics 07 00247 g003
Figure 4. Box plots of the mean qualifictions. (a) Box plots of the mean qualifications in the post-test in the control group; (b) Box plots of the mean qualifications in the post-test in the experimental group.
Mathematics 07 00247 g004
Figure 5. Comparison of the percentage of correct answers in the post-test of both control and experimental groups.
Mathematics 07 00247 g005
Figure 6. Results of the percentages of responses of students of the experimental (top) and control (bottom) groups in questions 6, 8, and 14.
Mathematics 07 00247 g006
Figure 7. Results of the user experience. (a) Results of the user experience on knowledge of the physical phenomenon on which the hologram is based; (b) Results of the user experience on what they liked most; (c) Results of the user experience on its possible application to other areas; (d) Results of the user experience on and its recommendation as a teaching medium.
Mathematics 07 00247 g007
Figure 8. Average results of the assessment of Likert-type scale items of the user experience in the experimental group.
Mathematics 07 00247 g008
Table 1. Results of the Student’s t-test for the comparison of means in independent groups.
Independent Samples Test
Levene Prooft-Test of Equality of Means
FSig.t-ValueglSig.Mean DifferencesStandard Error Differences
Assuming equal variances3.1840.078−15.983760.000−3.90210.2441
Non assuming equal variances--−16.76670.7770.000−3.90210.2327

